Statistical Analysis Project: MAT10251, Fuel Price Data Analysis
VerifiedAdded on 2023/04/25
|7
|1280
|179
Project
AI Summary
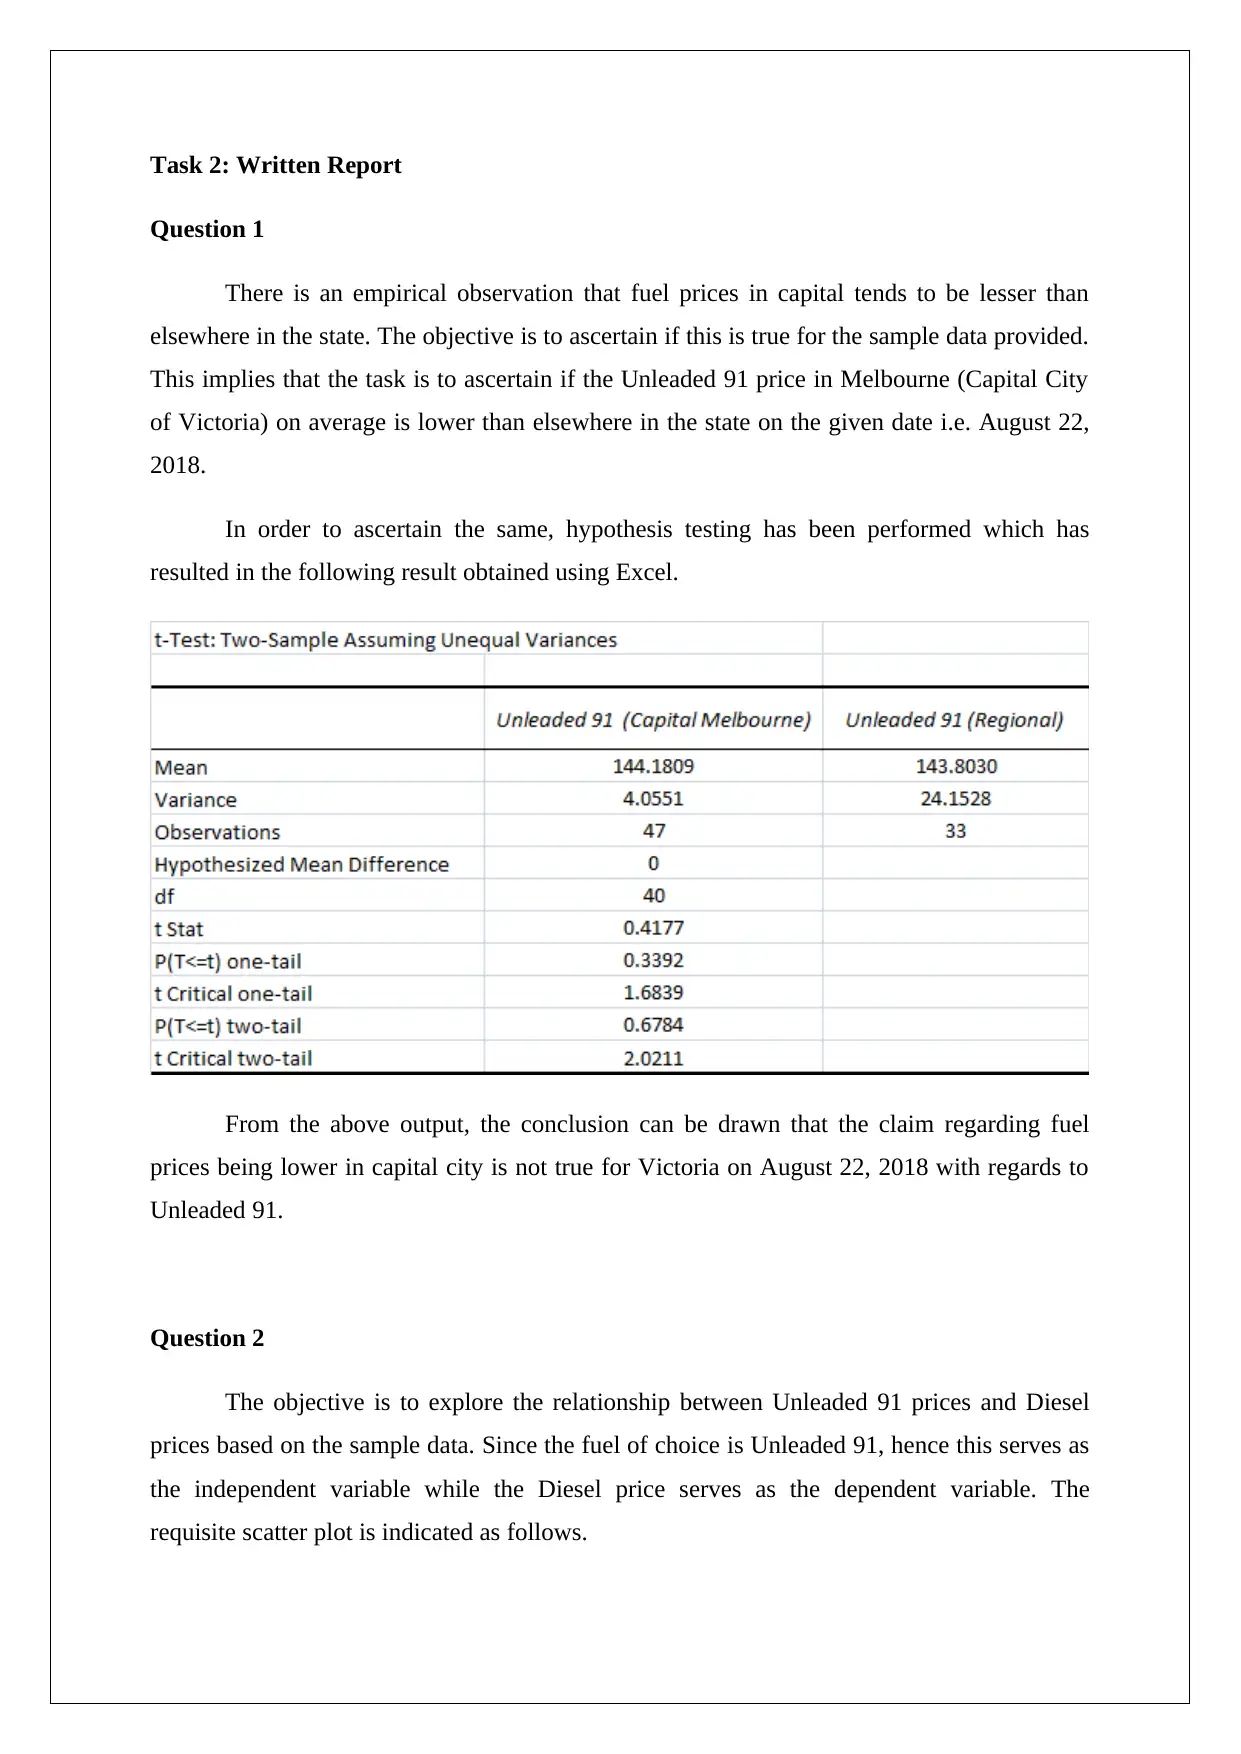
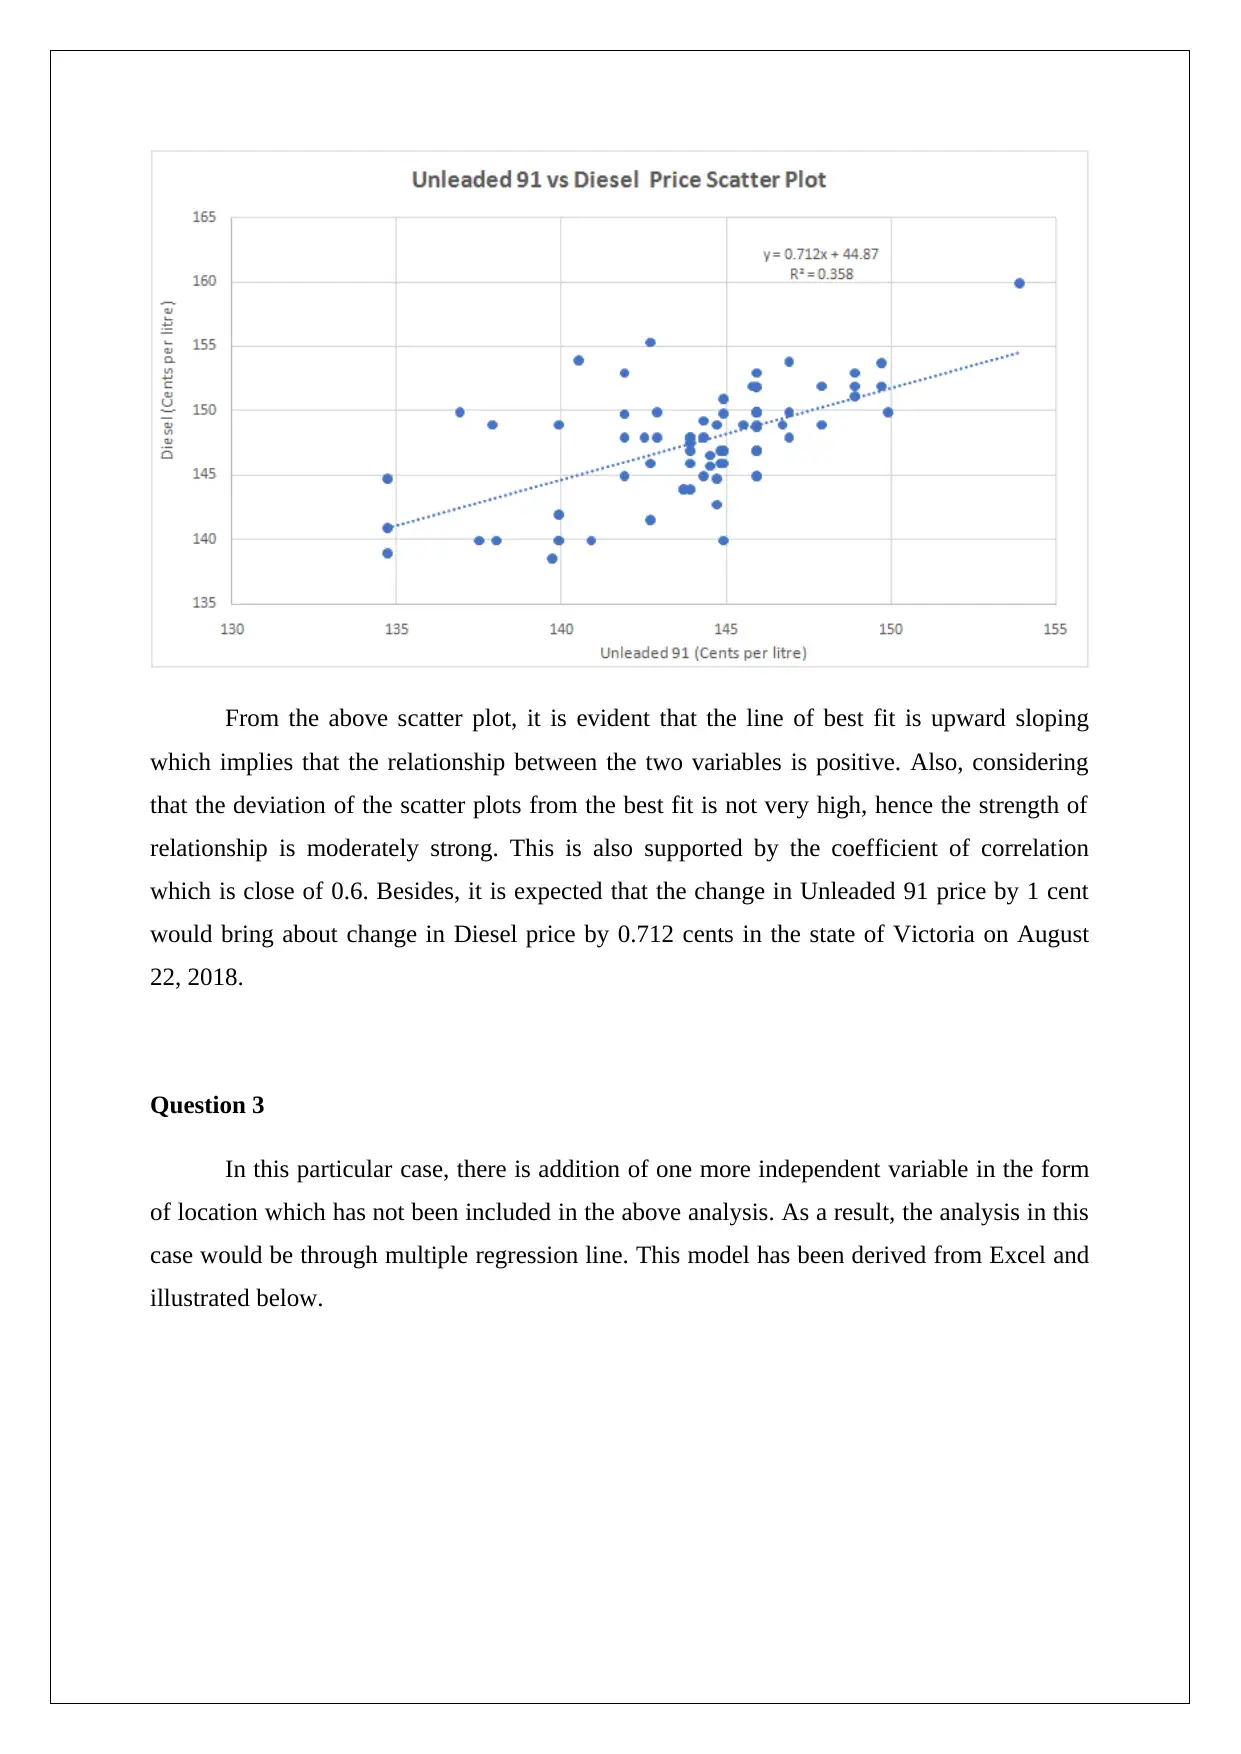
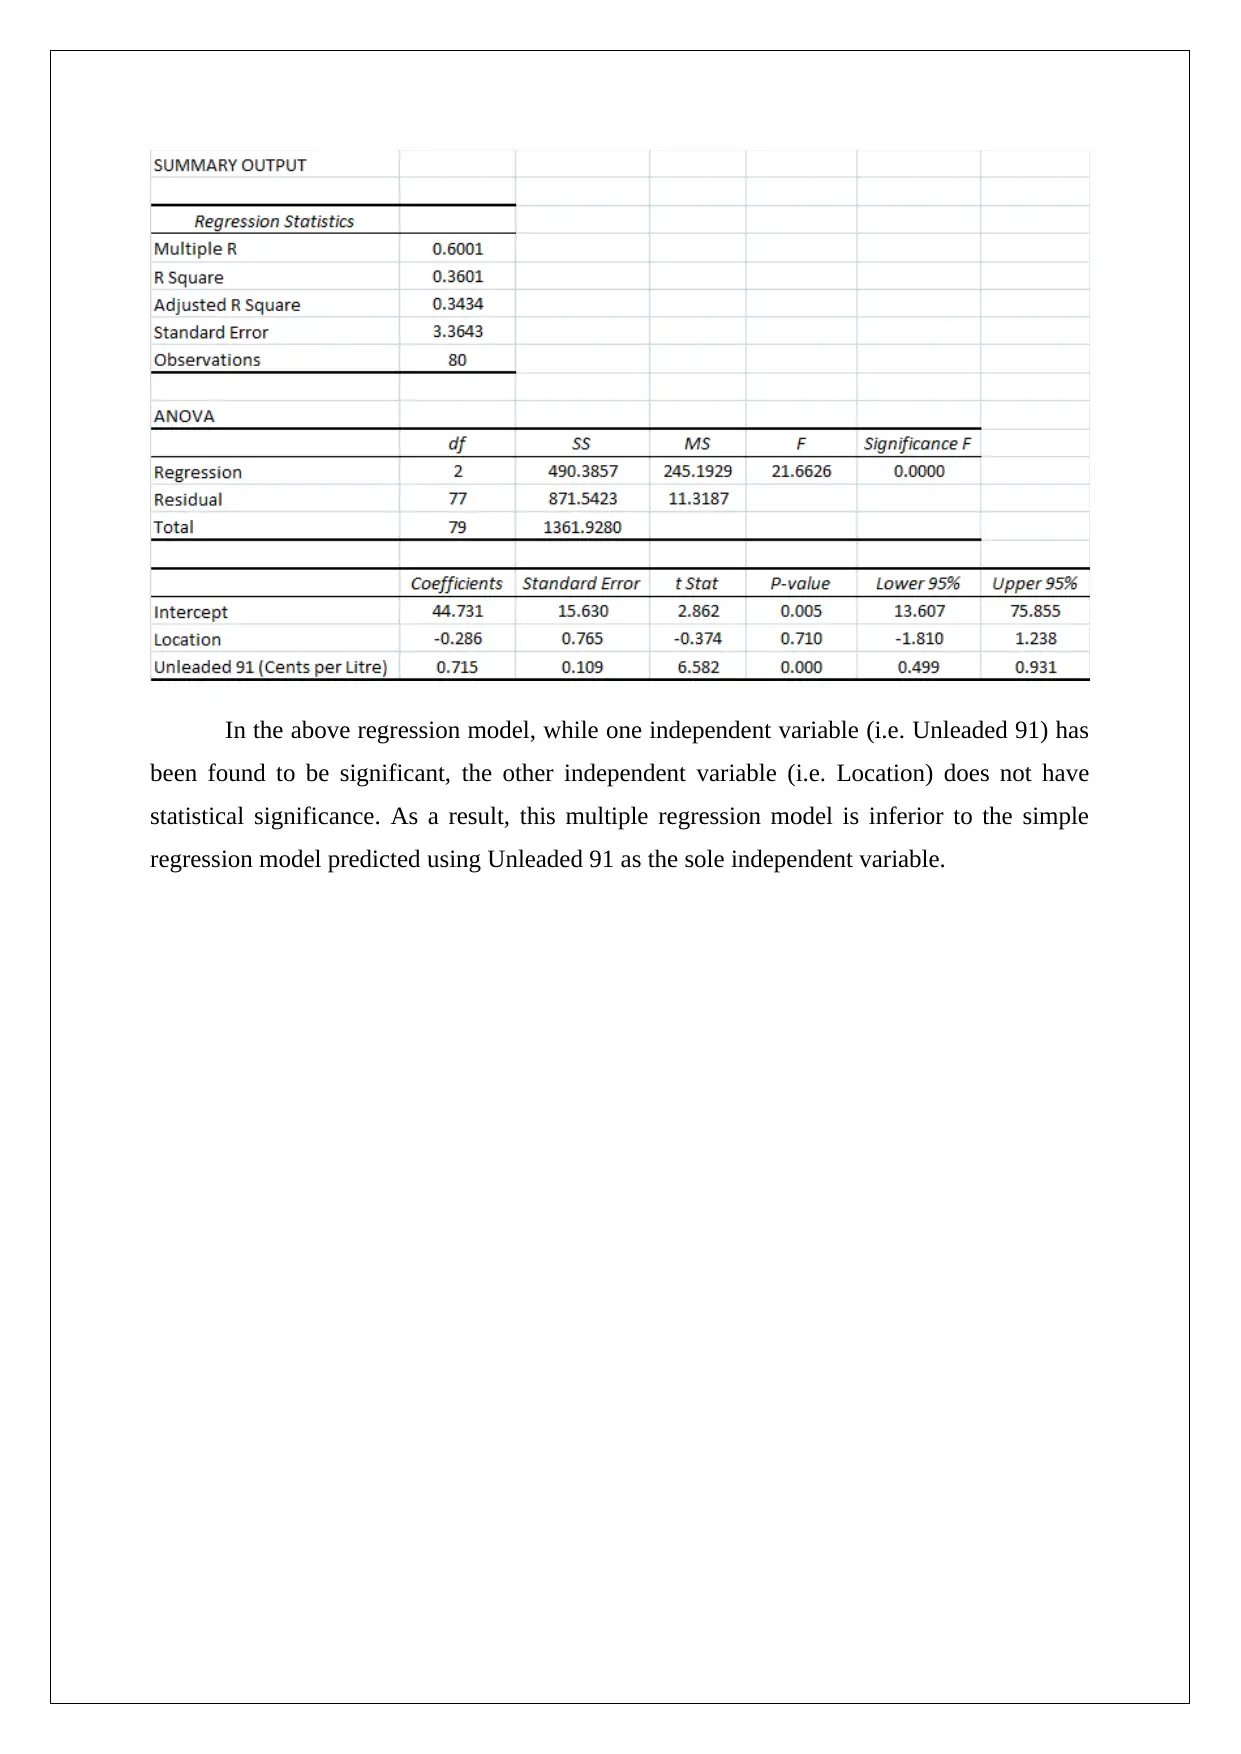
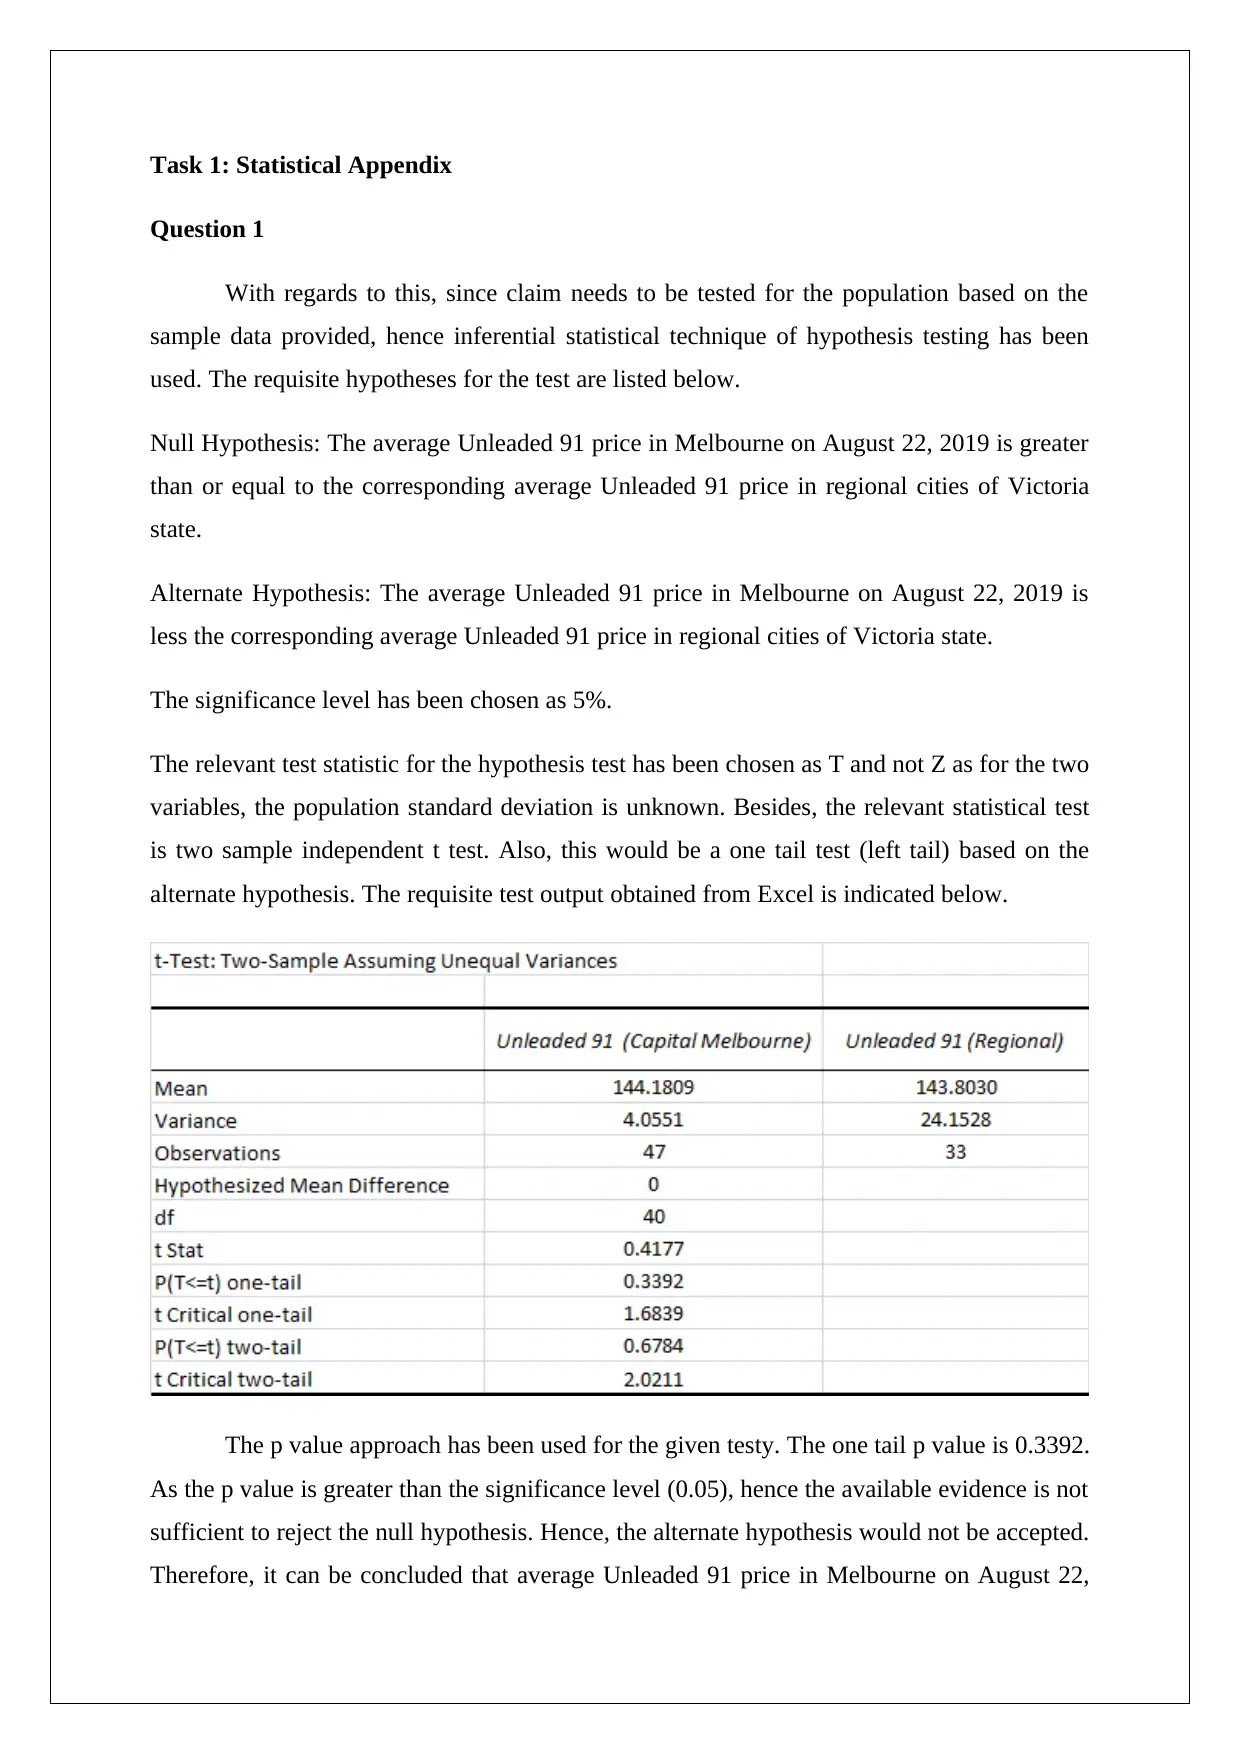
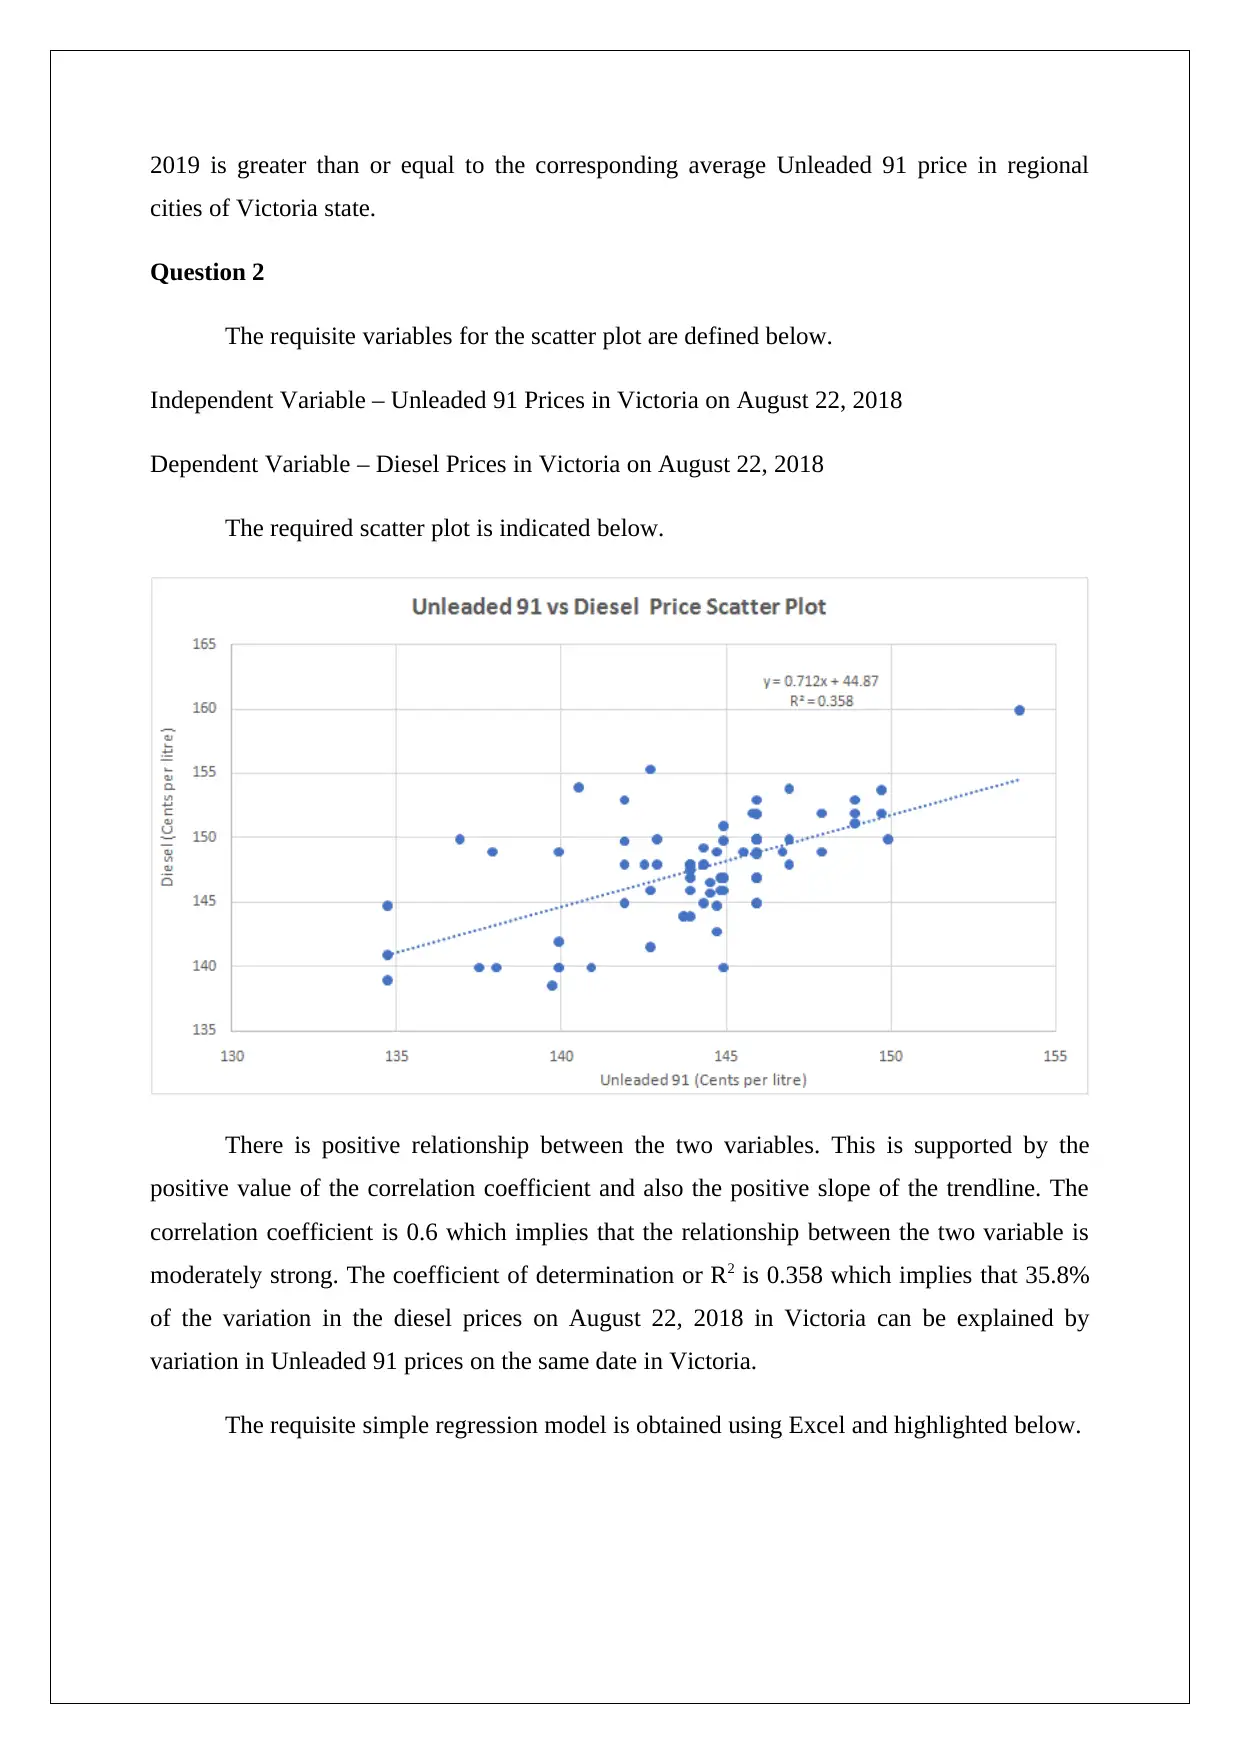
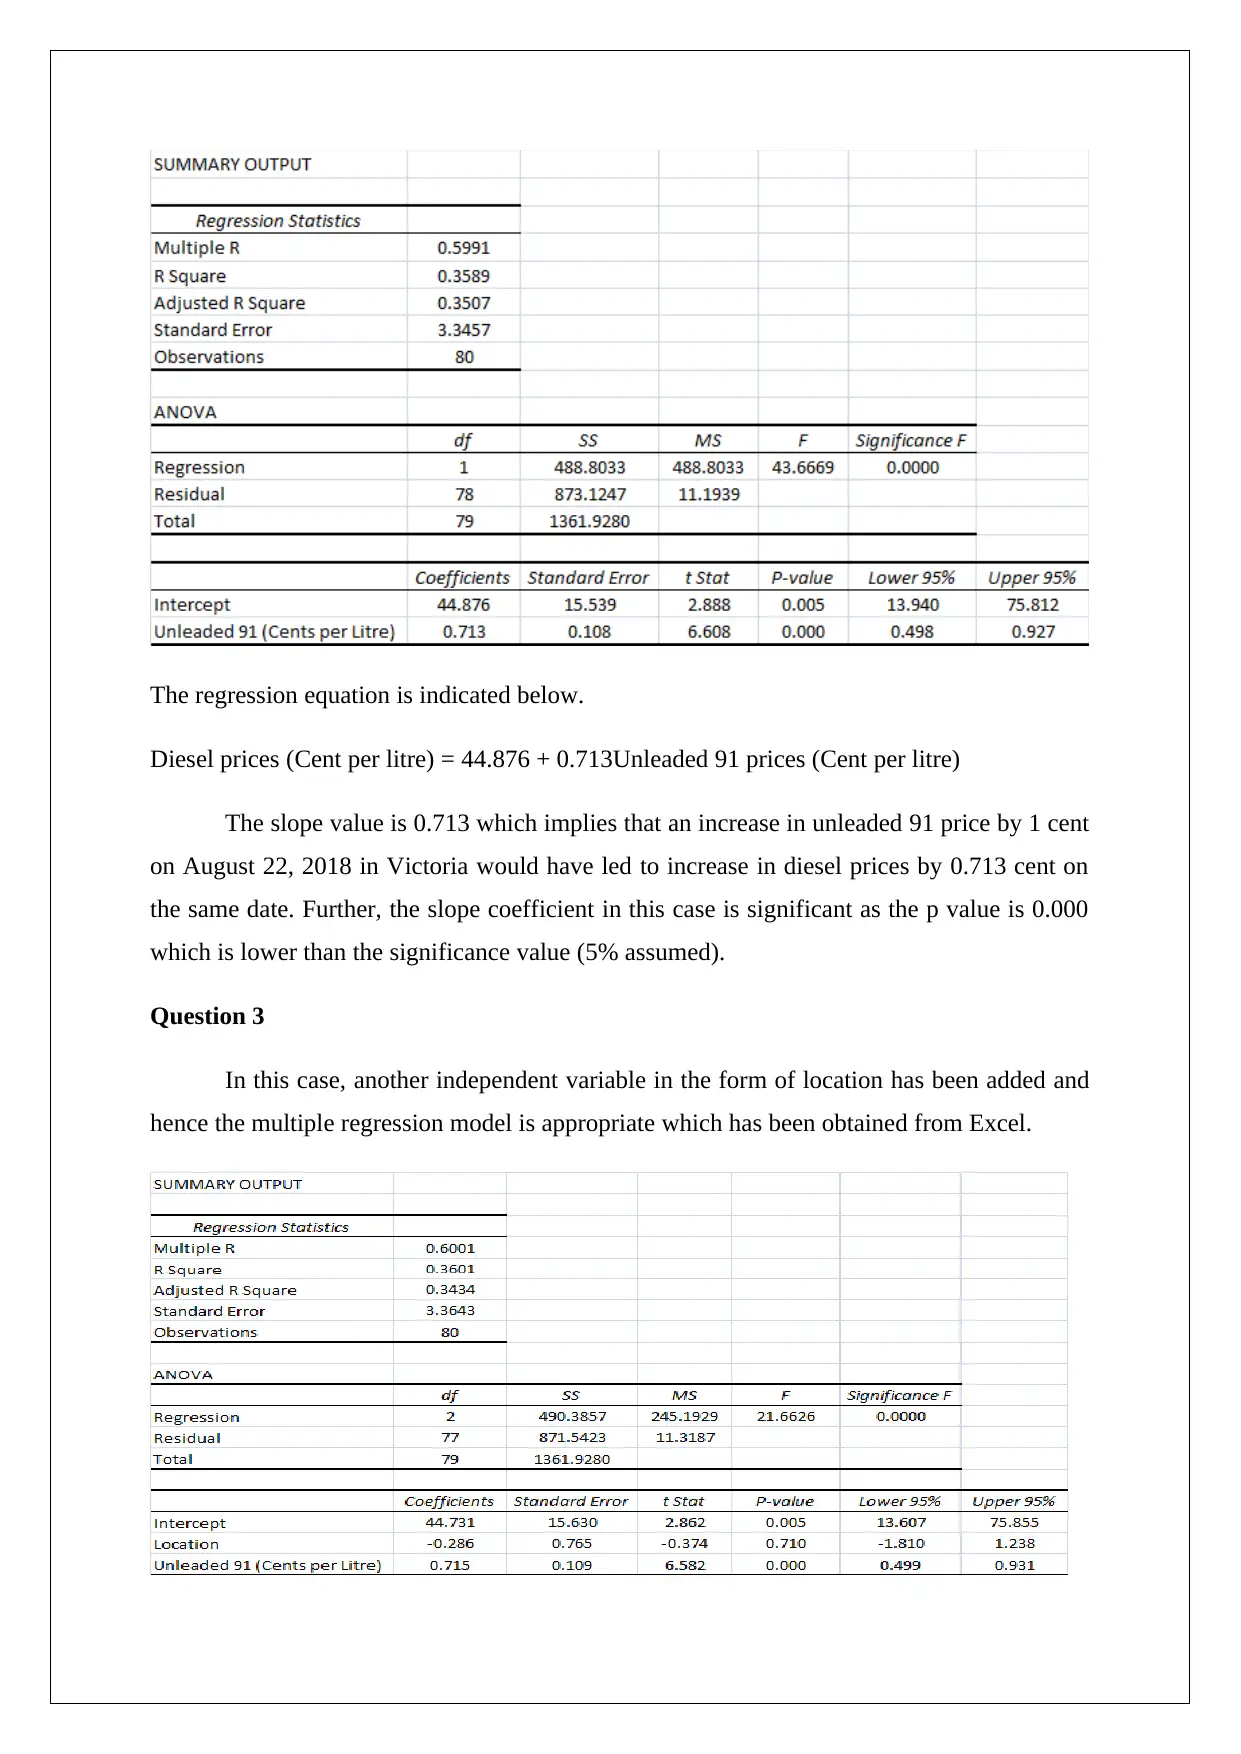
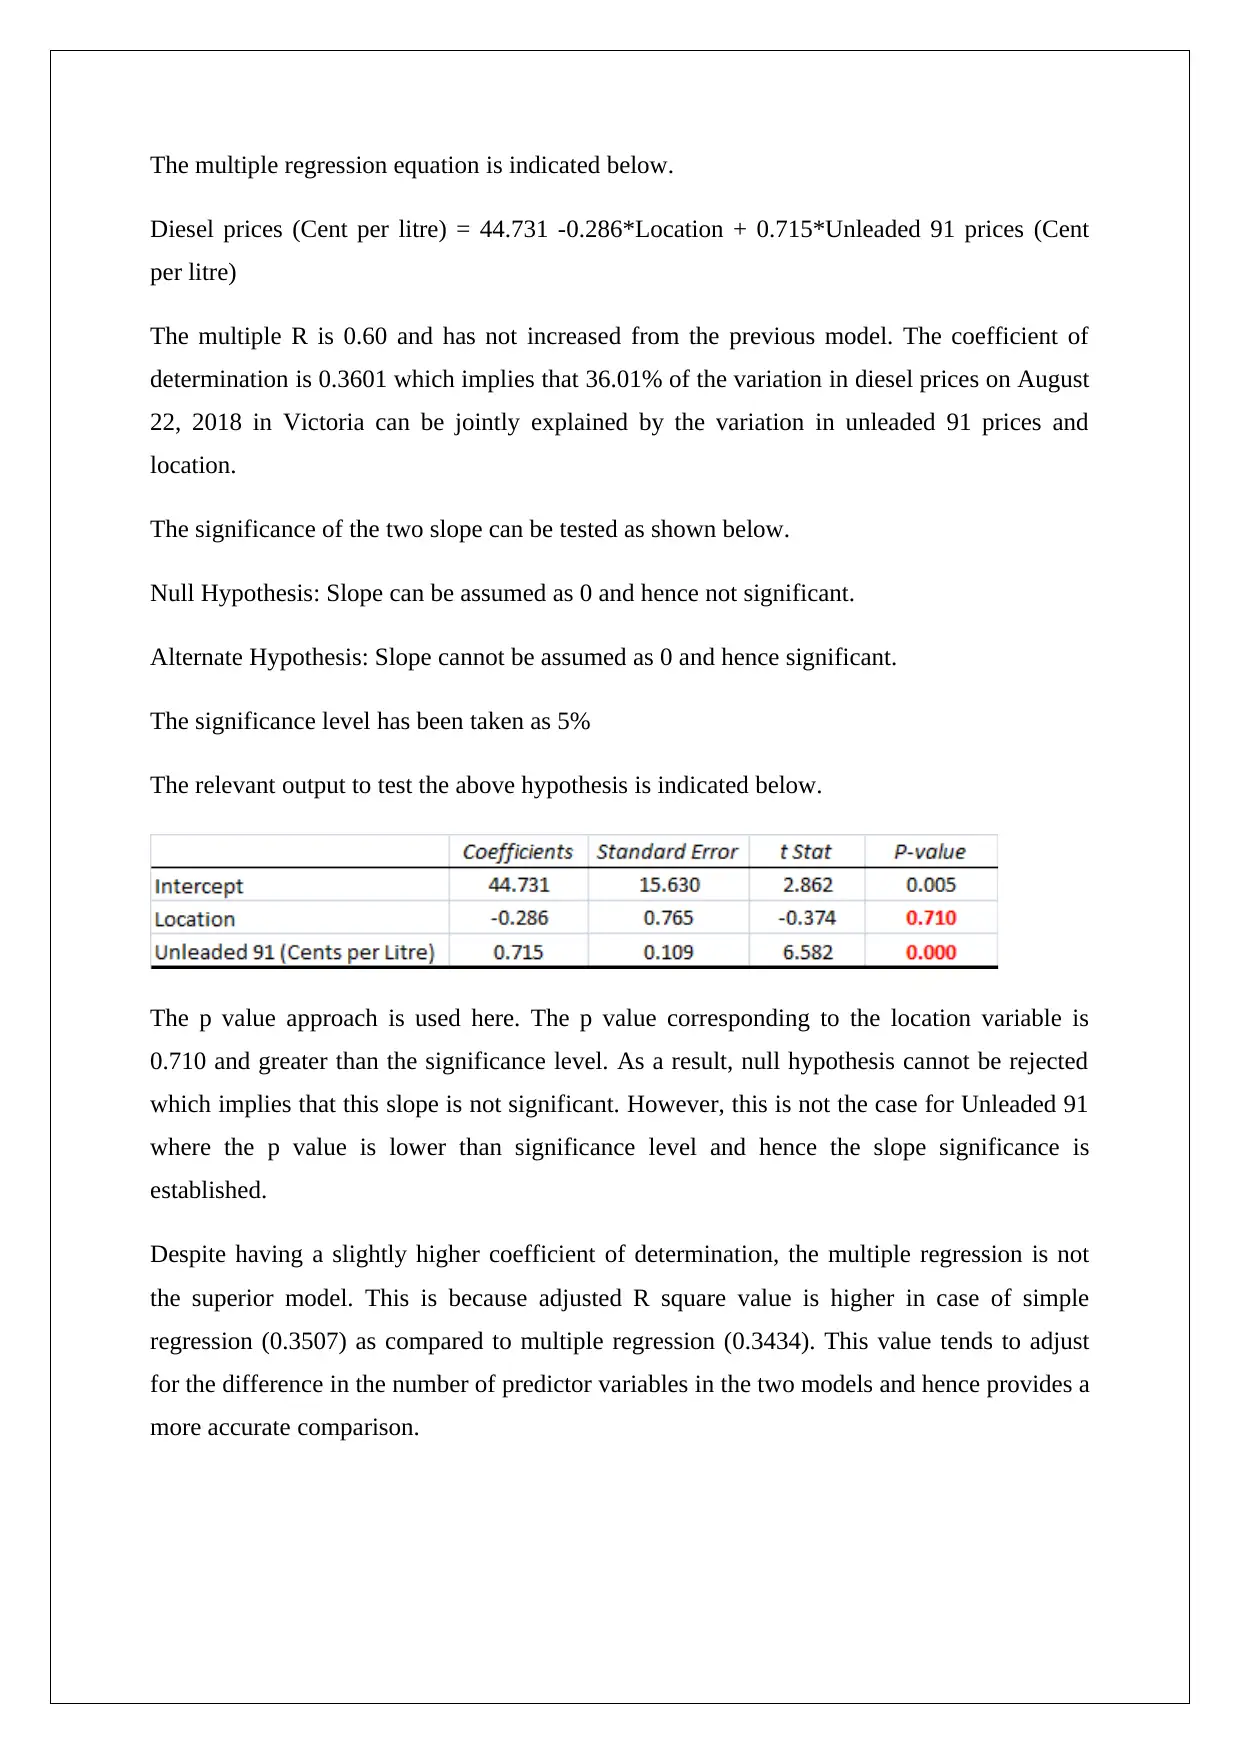
This project presents a statistical analysis of fuel price data from Victoria, Australia, focusing on Unleaded 91 and Diesel prices. The analysis begins with hypothesis testing to determine if fuel prices in the capital city are lower than elsewhere. It then explores the relationship between Unleaded 91 and Diesel prices using scatter plots and correlation coefficients, establishing a moderately strong positive relationship. Simple and multiple regression models are developed to further examine the impact of Unleaded 91 prices and location on Diesel prices. The project compares the models, evaluates the significance of variables, and concludes that the simple regression model is superior due to a higher adjusted R-squared value. The analysis incorporates inferential statistics, including t-tests and p-value approaches, to validate claims about fuel price averages and relationships between variables. The project utilizes Excel for calculations and model generation, providing a comprehensive statistical examination of fuel price trends.
1 out of 7
Related Documents


Your All-in-One AI-Powered Toolkit for Academic Success.
+13062052269
info@desklib.com
Available 24*7 on WhatsApp / Email
![[object Object]](/_next/static/media/star-bottom.7253800d.svg)
Copyright © 2020–2026 A2Z Services. All Rights Reserved. Developed and managed by ZUCOL.