Fundamentals of Finance Group Project: TCS & Infosys Analysis
VerifiedAdded on 2023/01/06
Group Project
Faculty in Charge: Prof. Shalini Kalra Sahi
Presented By:
IB-A, Group 8
Anshuman Mishra 21PGIB010
Arshnoor Singh 21PGIB012
G Chandra Sekhar 21PGIB030
Gaurav Kumar Jha 21PGIB032
Kritesh Kaushal 21PGIB044
Mayanka Soni 21PGIB052
Companies selected for Analysis:
Paraphrase This Document
i. Liquidity Ratios
ii. Leverage ratios
iii. Activity ratios
iv. Pro tability ratios.
v. Market ratios
vi. Evaluate the company’s pro tability using the DuPont Framework.
After calculating the ratios for both the companies for the last 3 years,you must interpret them.
Remember to use the notes to thenancialstatements and any narrative provided by manageme
You must compare both the company’s ratios also. Focus on the interpretation!
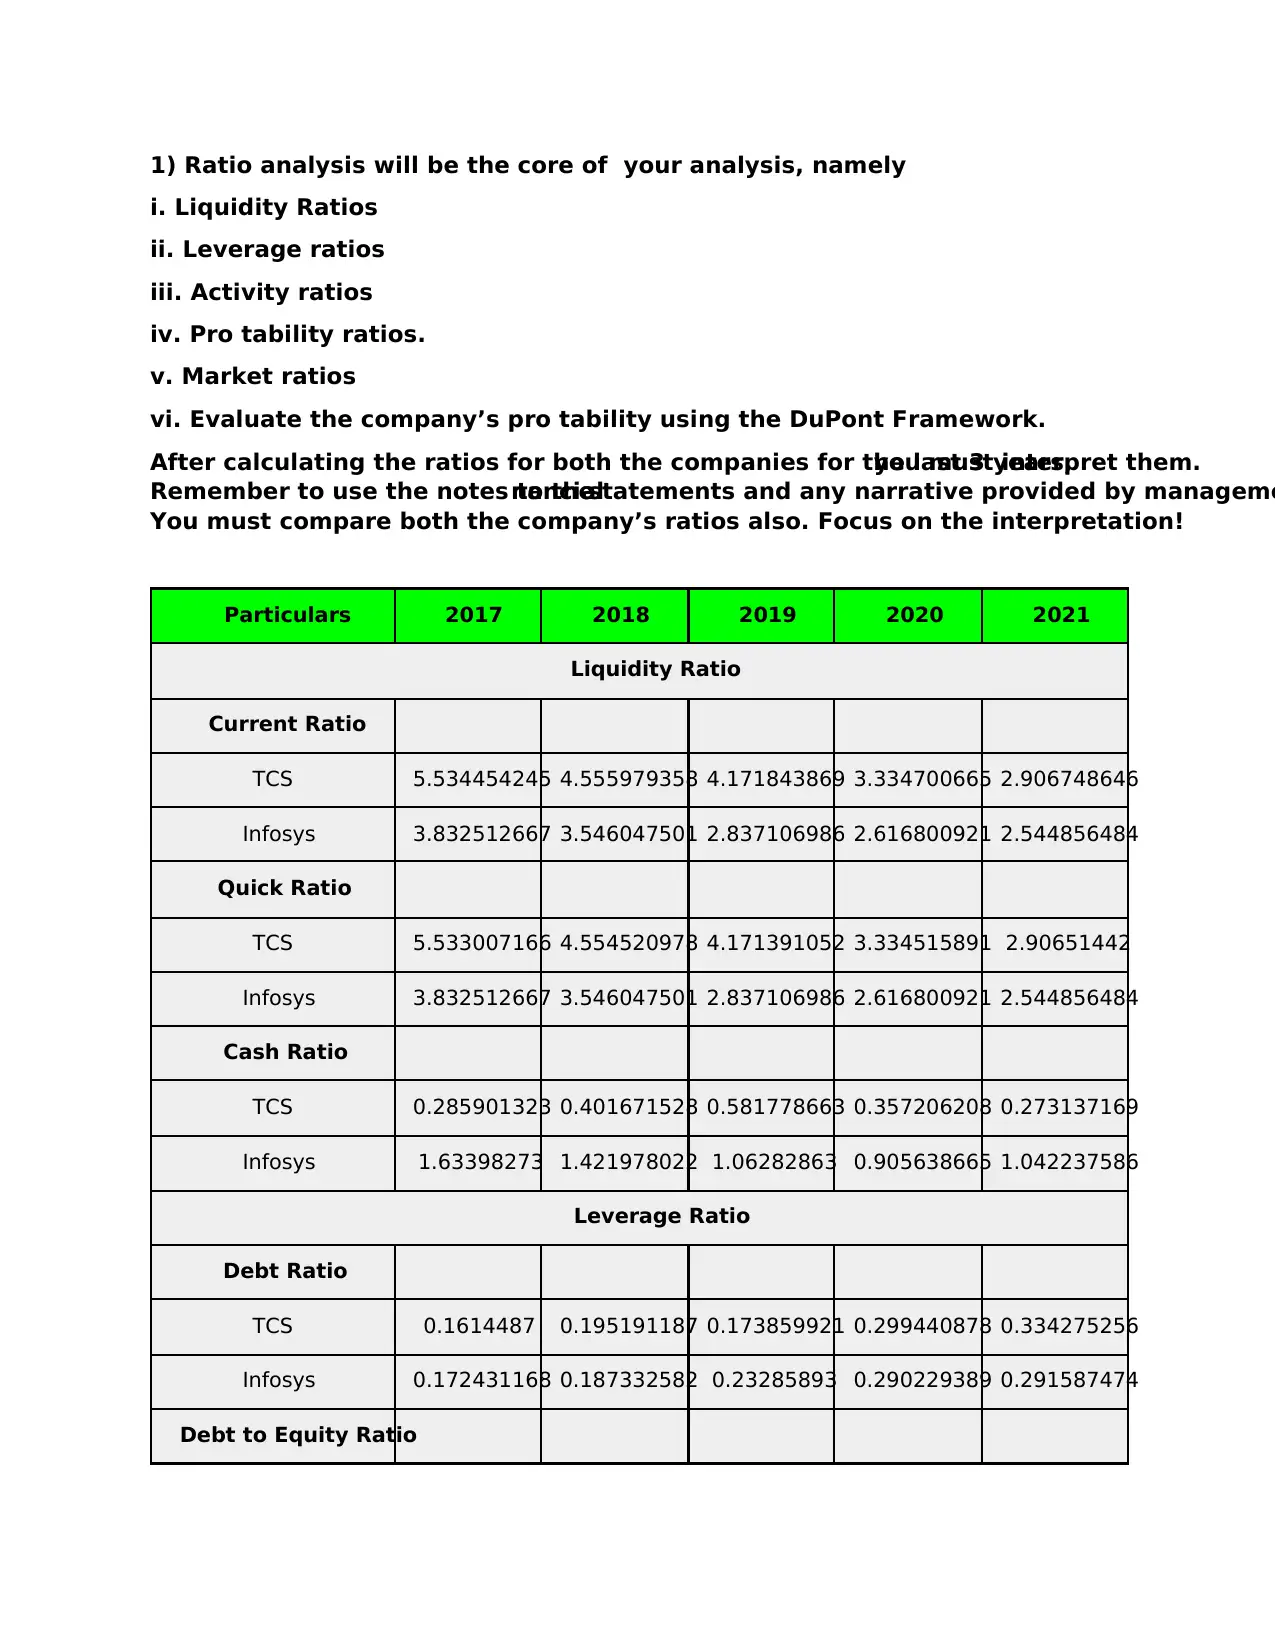
Particulars 2017 2018 2019 2020 2021
Liquidity Ratio
Current Ratio
TCS 5.534454245 4.555979358 4.171843869 3.334700665 2.906748646
Infosys 3.832512667 3.546047501 2.837106986 2.616800921 2.544856484
Quick Ratio
TCS 5.533007166 4.554520978 4.171391052 3.334515891 2.90651442
Infosys 3.832512667 3.546047501 2.837106986 2.616800921 2.544856484
Cash Ratio
TCS 0.285901323 0.401671528 0.581778663 0.357206208 0.273137169
Infosys 1.63398273 1.421978022 1.06282863 0.905638665 1.042237586
Leverage Ratio
Debt Ratio
TCS 0.1614487 0.195191187 0.173859921 0.299440878 0.334275256
Infosys 0.172431168 0.187332582 0.23285893 0.290229389 0.291587474
Debt to Equity Ratio
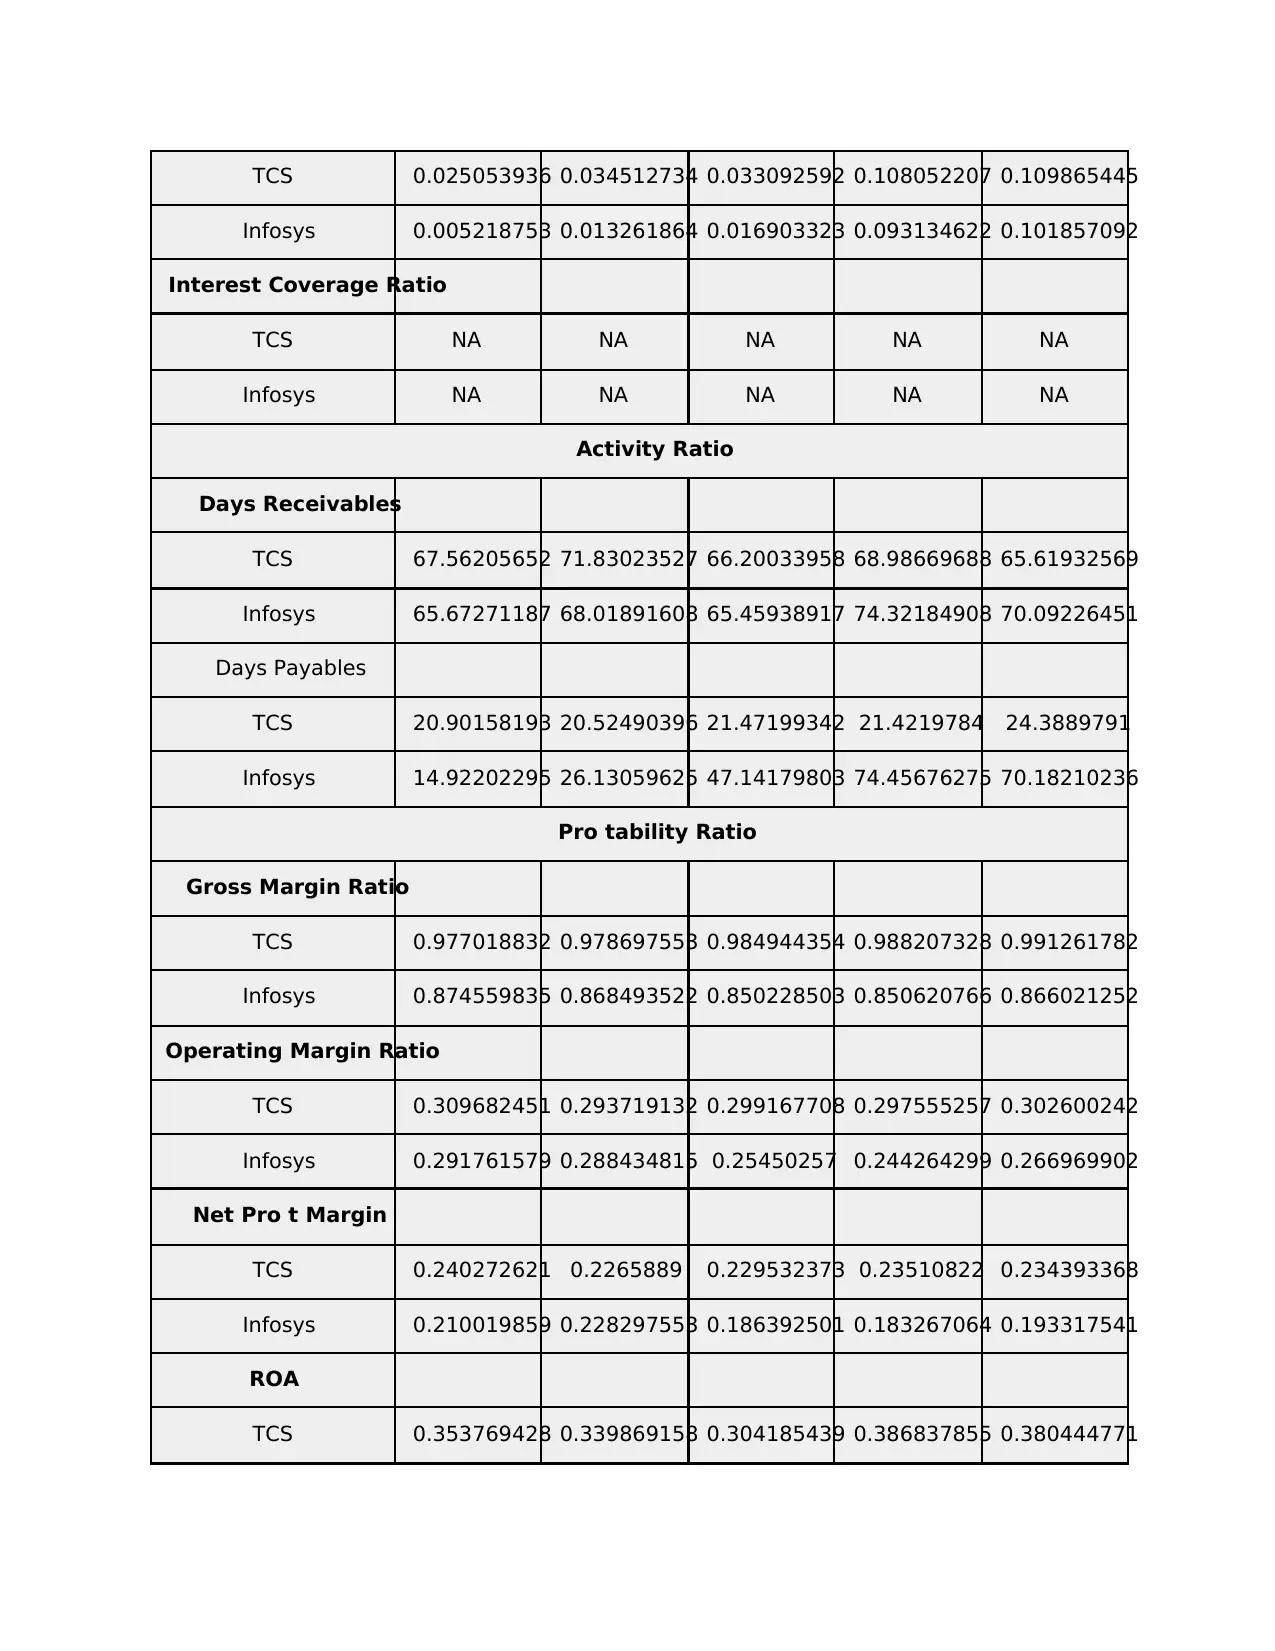
Infosys 0.005218753 0.013261864 0.016903323 0.093134622 0.101857092
Interest Coverage Ratio
TCS NA NA NA NA NA
Infosys NA NA NA NA NA
Activity Ratio
Days Receivables
TCS 67.56205652 71.83023527 66.20033958 68.98669688 65.61932569
Infosys 65.67271187 68.01891608 65.45938917 74.32184908 70.09226451
Days Payables
TCS 20.90158193 20.52490396 21.47199342 21.4219784 24.3889791
Infosys 14.92202295 26.13059625 47.14179803 74.45676275 70.18210236
Pro tability Ratio
Gross Margin Ratio
TCS 0.977018832 0.978697553 0.984944354 0.988207328 0.991261782
Infosys 0.874559835 0.868493522 0.850228503 0.850620766 0.866021252
Operating Margin Ratio
TCS 0.309682451 0.293719132 0.299167708 0.297555257 0.302600242
Infosys 0.291761579 0.288434815 0.25450257 0.244264299 0.266969902
Net Pro t Margin
TCS 0.240272621 0.2265889 0.229532373 0.23510822 0.234393368
Infosys 0.210019859 0.228297553 0.186392501 0.183267064 0.193317541
ROA
TCS 0.353769428 0.339869158 0.304185439 0.386837855 0.380444771
You're viewing a preview
Unlock full access by subscribing today!
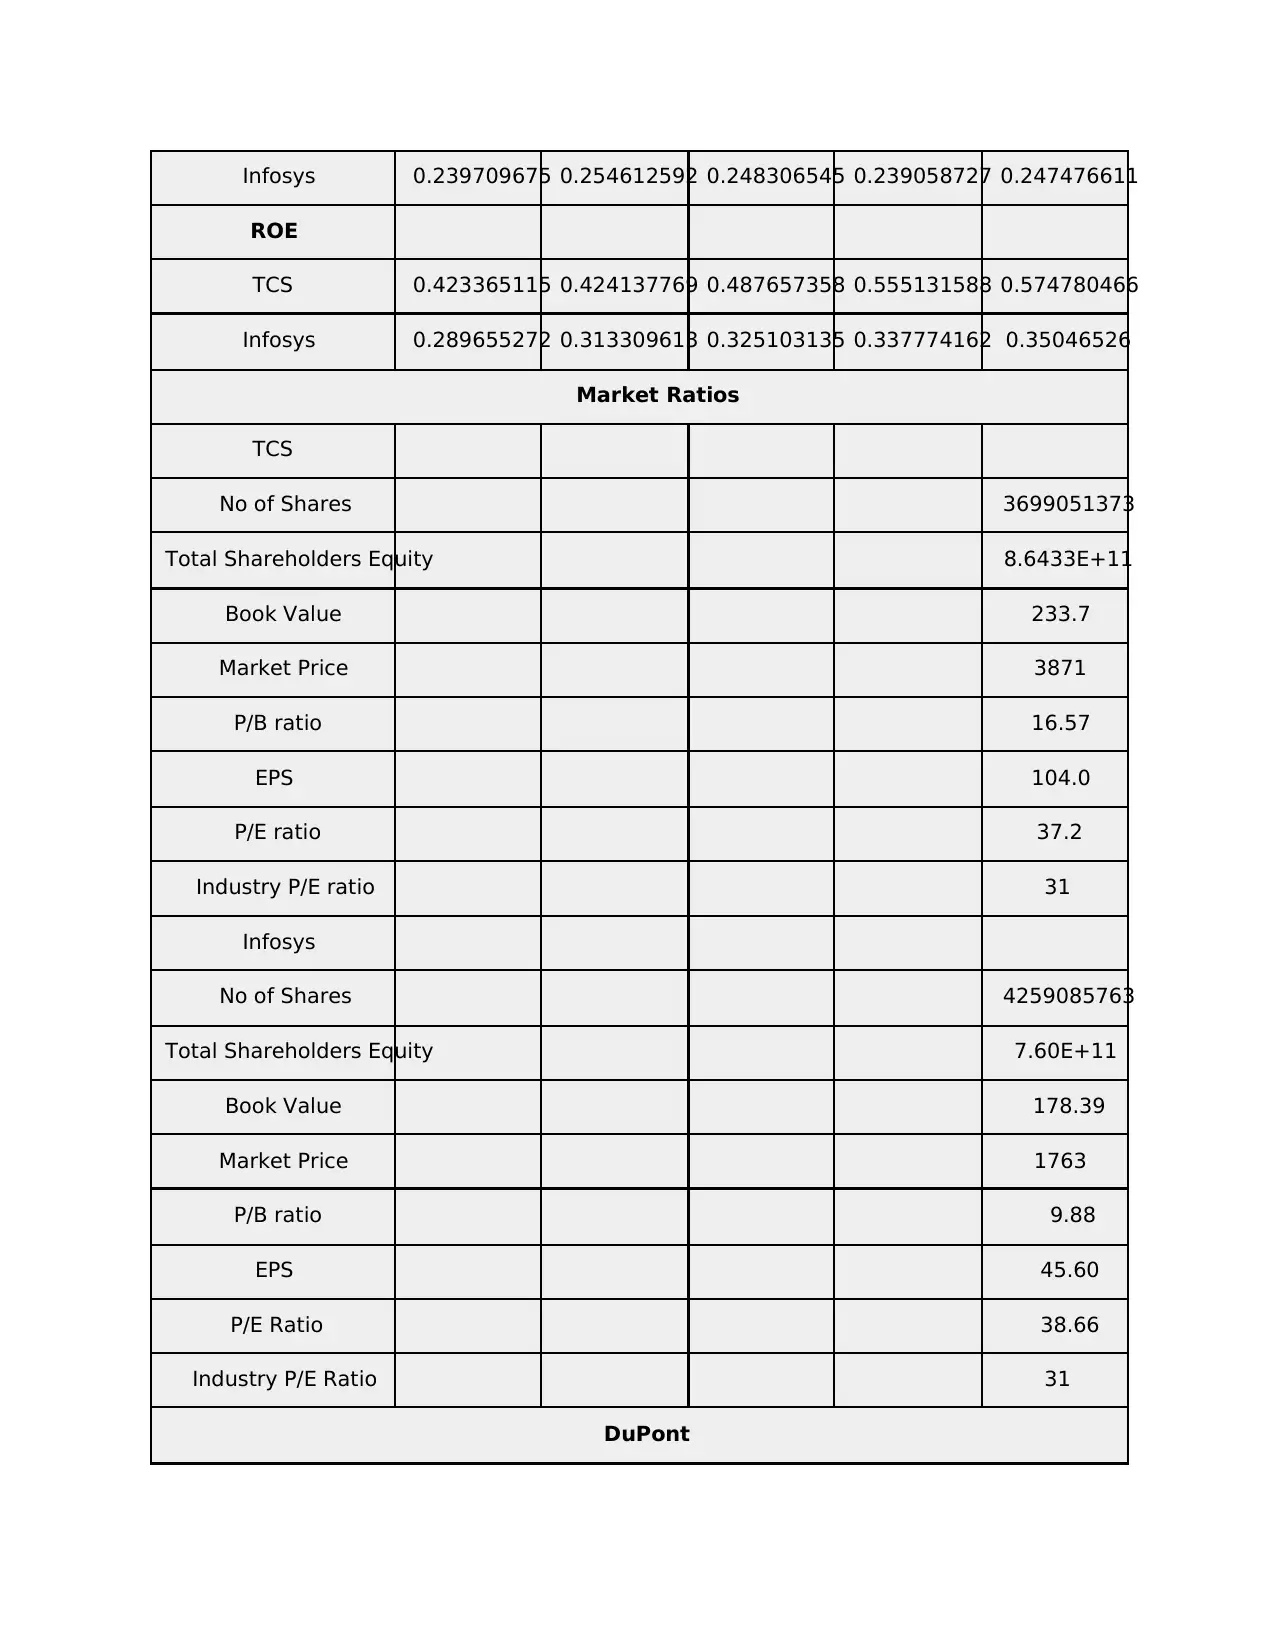
ROE
TCS 0.423365115 0.424137769 0.487657358 0.555131588 0.574780466
Infosys 0.289655272 0.313309613 0.325103135 0.337774162 0.35046526
Market Ratios
TCS
No of Shares 3699051373
Total Shareholders Equity 8.6433E+11
Book Value 233.7
Market Price 3871
P/B ratio 16.57
EPS 104.0
P/E ratio 37.2
Industry P/E ratio 31
Infosys
No of Shares 4259085763
Total Shareholders Equity 7.60E+11
Book Value 178.39
Market Price 1763
P/B ratio 9.88
EPS 45.60
P/E Ratio 38.66
Industry P/E Ratio 31
DuPont
Paraphrase This Document
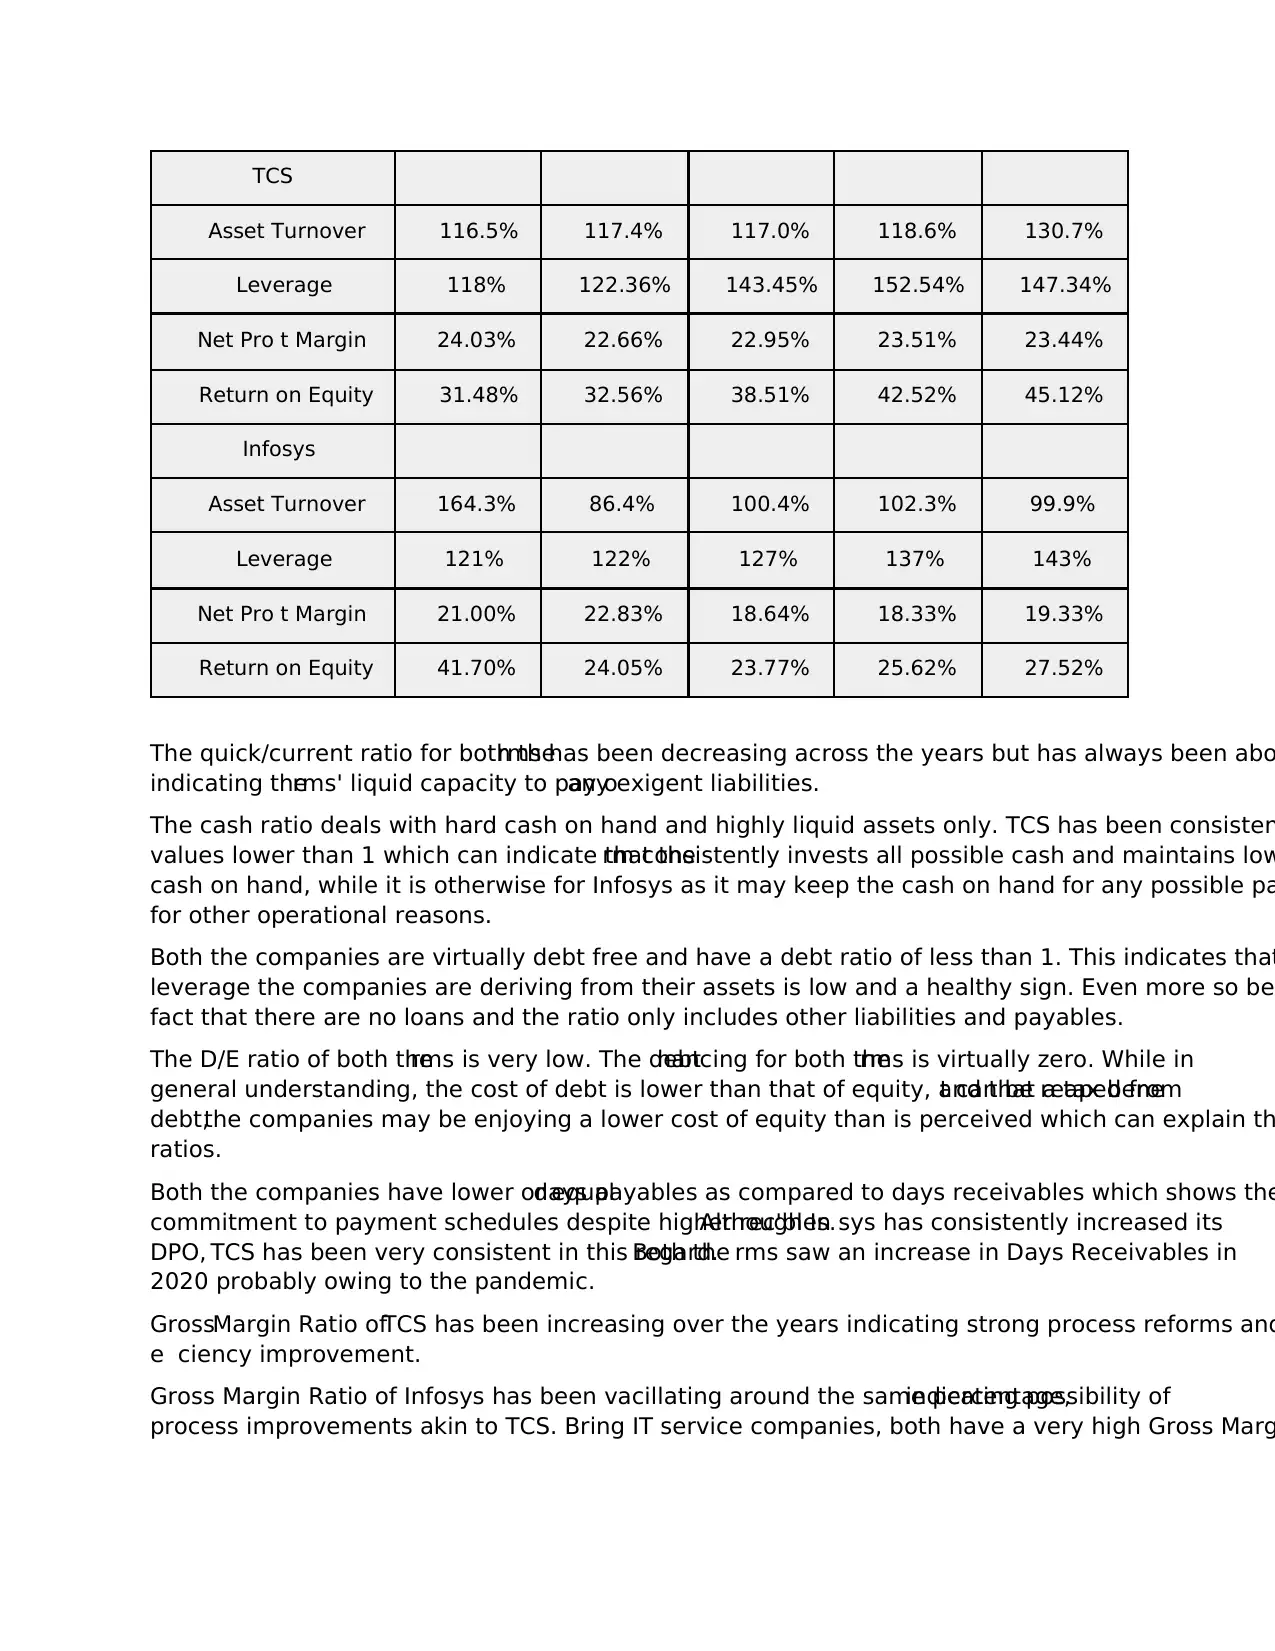
Asset Turnover 116.5% 117.4% 117.0% 118.6% 130.7%
Leverage 118% 122.36% 143.45% 152.54% 147.34%
Net Pro t Margin 24.03% 22.66% 22.95% 23.51% 23.44%
Return on Equity 31.48% 32.56% 38.51% 42.52% 45.12%
Infosys
Asset Turnover 164.3% 86.4% 100.4% 102.3% 99.9%
Leverage 121% 122% 127% 137% 143%
Net Pro t Margin 21.00% 22.83% 18.64% 18.33% 19.33%
Return on Equity 41.70% 24.05% 23.77% 25.62% 27.52%
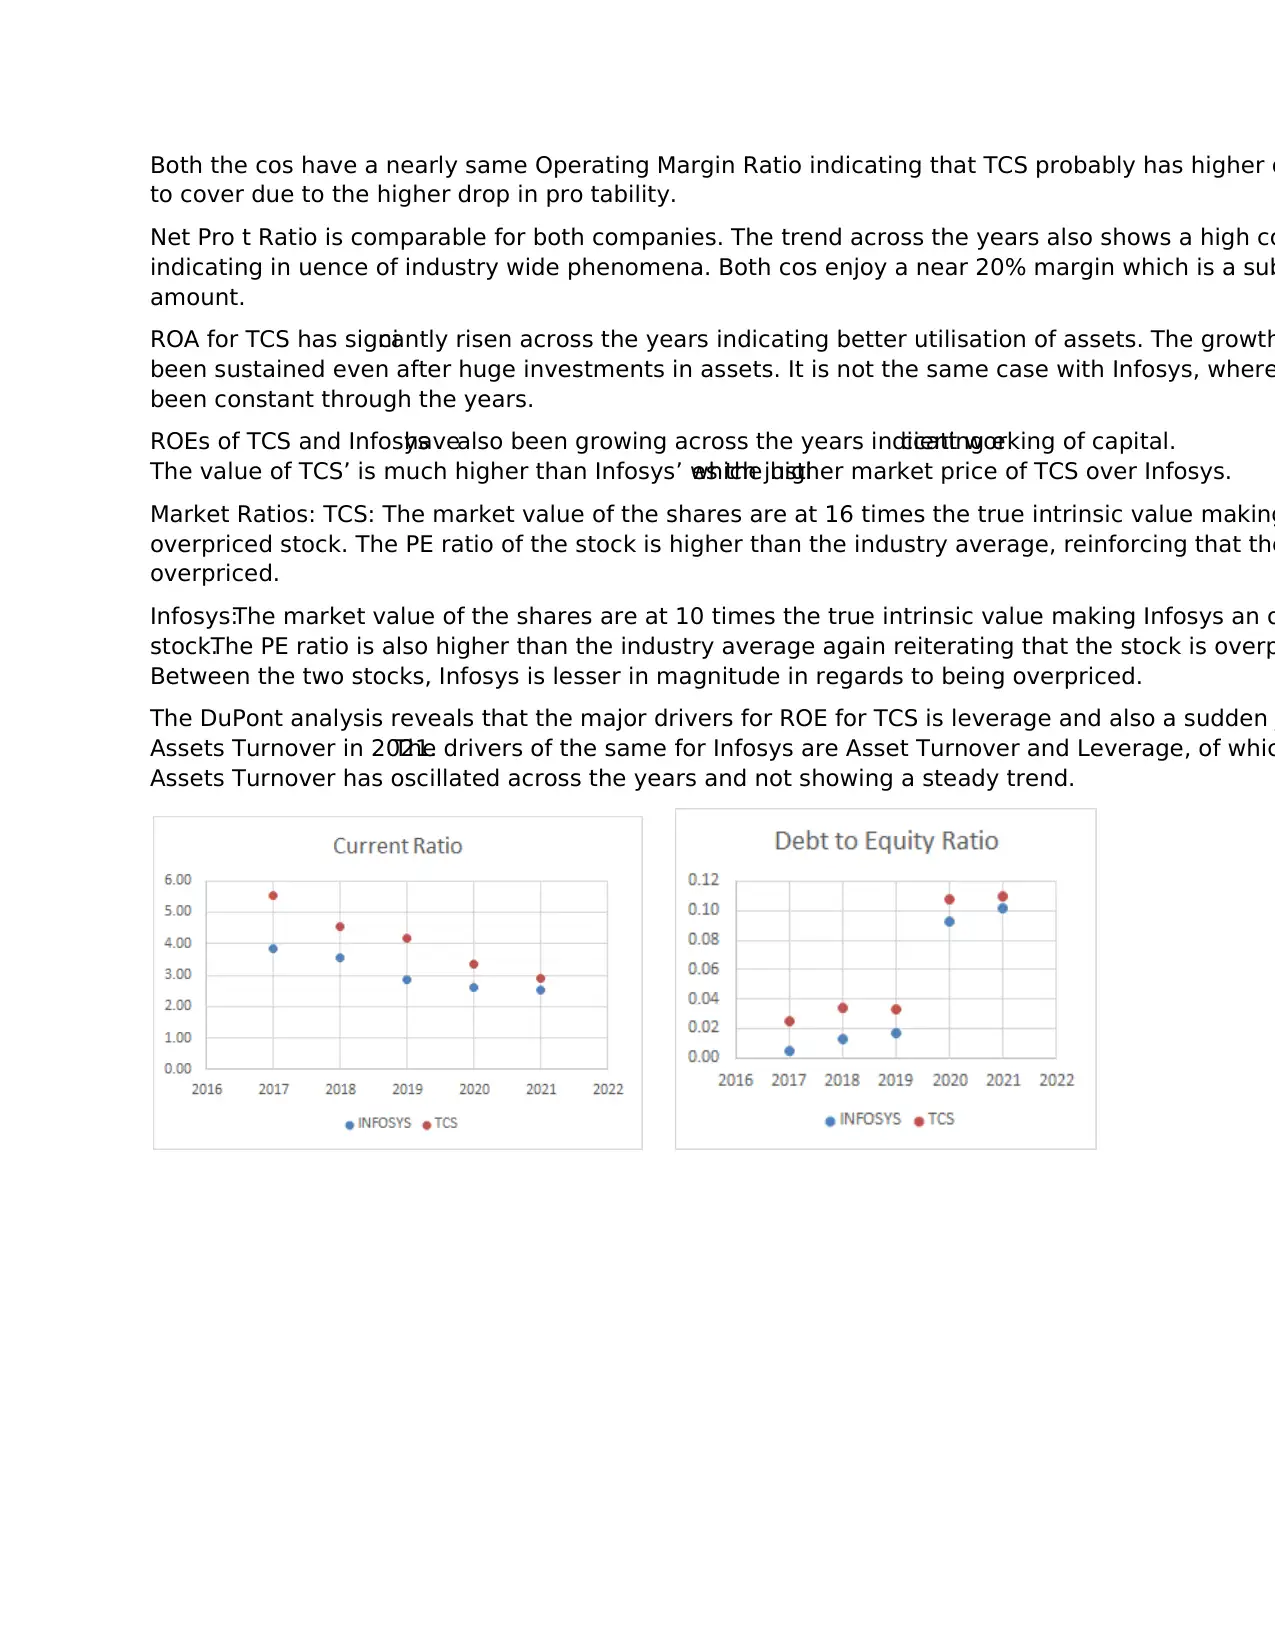
The quick/current ratio for both therms has been decreasing across the years but has always been abo
indicating therms' liquid capacity to pay oany exigent liabilities.
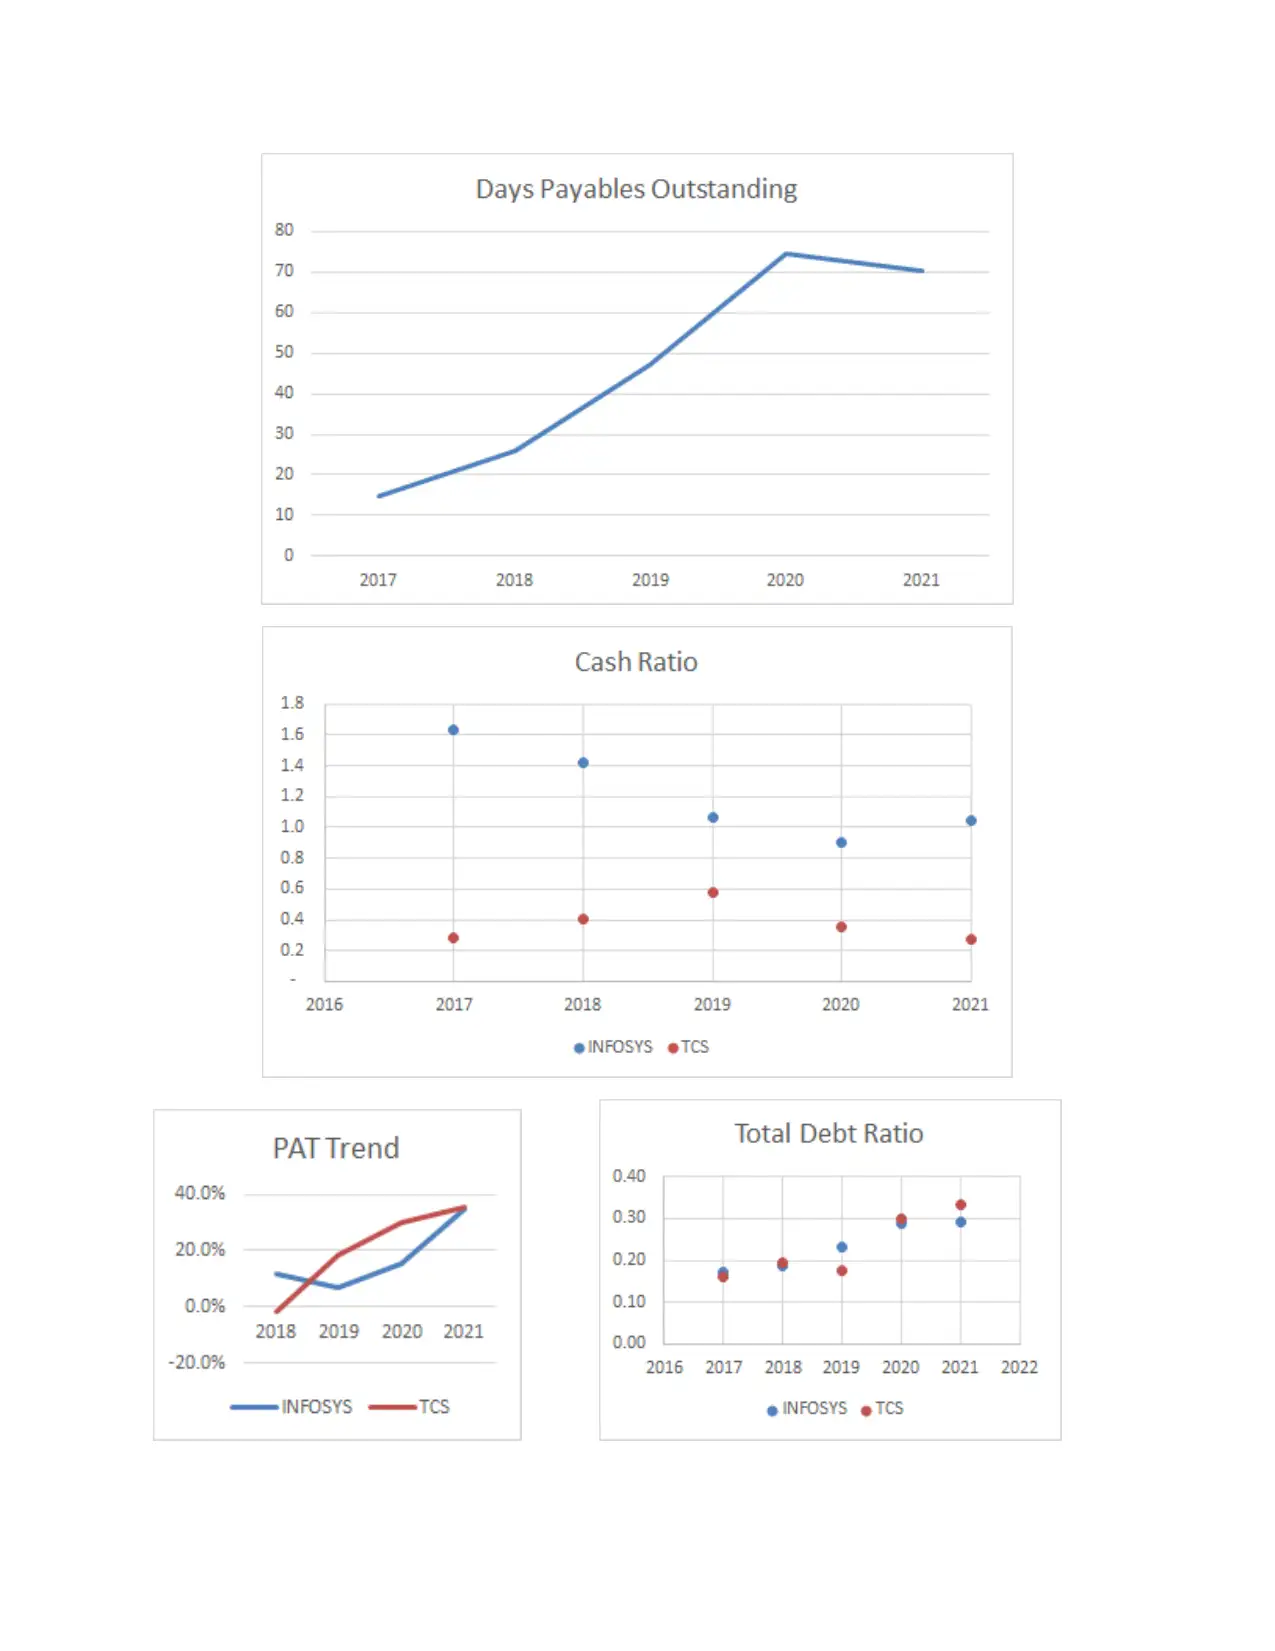
The cash ratio deals with hard cash on hand and highly liquid assets only. TCS has been consisten
values lower than 1 which can indicate that therm consistently invests all possible cash and maintains low
cash on hand, while it is otherwise for Infosys as it may keep the cash on hand for any possible pa
for other operational reasons.
Both the companies are virtually debt free and have a debt ratio of less than 1. This indicates that
leverage the companies are deriving from their assets is low and a healthy sign. Even more so bec
fact that there are no loans and the ratio only includes other liabilities and payables.
The D/E ratio of both therms is very low. The debtnancing for both therms is virtually zero. While in
general understanding, the cost of debt is lower than that of equity, and that a tax benet can be reaped from
debt,the companies may be enjoying a lower cost of equity than is perceived which can explain th
ratios.
Both the companies have lower or equaldays payables as compared to days receivables which shows the
commitment to payment schedules despite higher rec'bles.Although In sys has consistently increased its
DPO, TCS has been very consistent in this regard.Both the rms saw an increase in Days Receivables in
2020 probably owing to the pandemic.
GrossMargin Ratio ofTCS has been increasing over the years indicating strong process reforms and
e ciency improvement.
Gross Margin Ratio of Infosys has been vacillating around the same percentage,indicating possibility of
process improvements akin to TCS. Bring IT service companies, both have a very high Gross Marg
to cover due to the higher drop in pro tability.
Net Pro t Ratio is comparable for both companies. The trend across the years also shows a high co
indicating in uence of industry wide phenomena. Both cos enjoy a near 20% margin which is a sub
amount.
ROA for TCS has signicantly risen across the years indicating better utilisation of assets. The growth
been sustained even after huge investments in assets. It is not the same case with Infosys, where
been constant through the years.
ROEs of TCS and Infosyshavealso been growing across the years indicating ecient working of capital.
The value of TCS’ is much higher than Infosys’ which justies the higher market price of TCS over Infosys.
Market Ratios: TCS: The market value of the shares are at 16 times the true intrinsic value making
overpriced stock. The PE ratio of the stock is higher than the industry average, reinforcing that the
overpriced.
Infosys:The market value of the shares are at 10 times the true intrinsic value making Infosys an o
stock.The PE ratio is also higher than the industry average again reiterating that the stock is overp
Between the two stocks, Infosys is lesser in magnitude in regards to being overpriced.
The DuPont analysis reveals that the major drivers for ROE for TCS is leverage and also a sudden
Assets Turnover in 2021.The drivers of the same for Infosys are Asset Turnover and Leverage, of whic
Assets Turnover has oscillated across the years and not showing a steady trend.
You're viewing a preview
Unlock full access by subscribing today!
Paraphrase This Document
items, which you consider as important, and analyse the results.
TCS:
Horizontal Analysis:
Share Capital: The YoY results show that there were two instances of decrease in the share capi
indicate therm required liquidity.The 96% surge in 18-19 indicates that there was an investment or an
upcoming one.The decrease in SHE in 20-21 indicates that the company possibly required some liqu
and sold shares.
Long Term Liabilities:The decrease in long term liabilities,which includes debt,presents interesting
results as there is a decline thatatlines at zero, at a time when the co raised its share capital by nealy 1
and invested the funds. This indicates the reliance and con dence the co has on the project and suciency of
funds.
Short Term Liabilities: The Short term liabilities have been steady across the years and have ri
possibly indicating a sudden necessary borrowing or liability induced by the pandemic.
Intangible Assets: The huge ascent in Intangible As demonstrates the co's solid investment in R
which shows positive future development.
Vertical Analysis:
Long Term Liabilities:The % of LTL has drastically decreased across the years,indicating that TCS’
monthly cashow in near term would not be restricted.
Short Term Liabilities: The % of LTL has drastically decreased across the years, a positive sign
that TCS is not at the mercy of high-cycle risks i.e less likely to be caught in a debt trap.
Cash and Bank Balances: The Cash and Bank Balances saw a downtrend from 2019 onwards, w
possibly indicate toward TCS investing their cash at hand into dierent ventures such as technological
advancements and cloud stacks, talked about in the directors report.
Trend Analysis:
Fixed Assets: The total FA have constantly risen across time indicating that the co has been exp
operations across the geography
Total Operating Revenue: The Operating Revenues has been steadily increasing across the yea
the co's strong foothold and growth in the sector.
Operating and Direct Expenses: The operating and direct expenses have been decreasing con
which shows that the company has been improving its eciency of doing business.
EBITDA: EBIT has been improving and growing consistently which shows that the company has b
improving its performance even under the changing scenarios and will continue to do so.
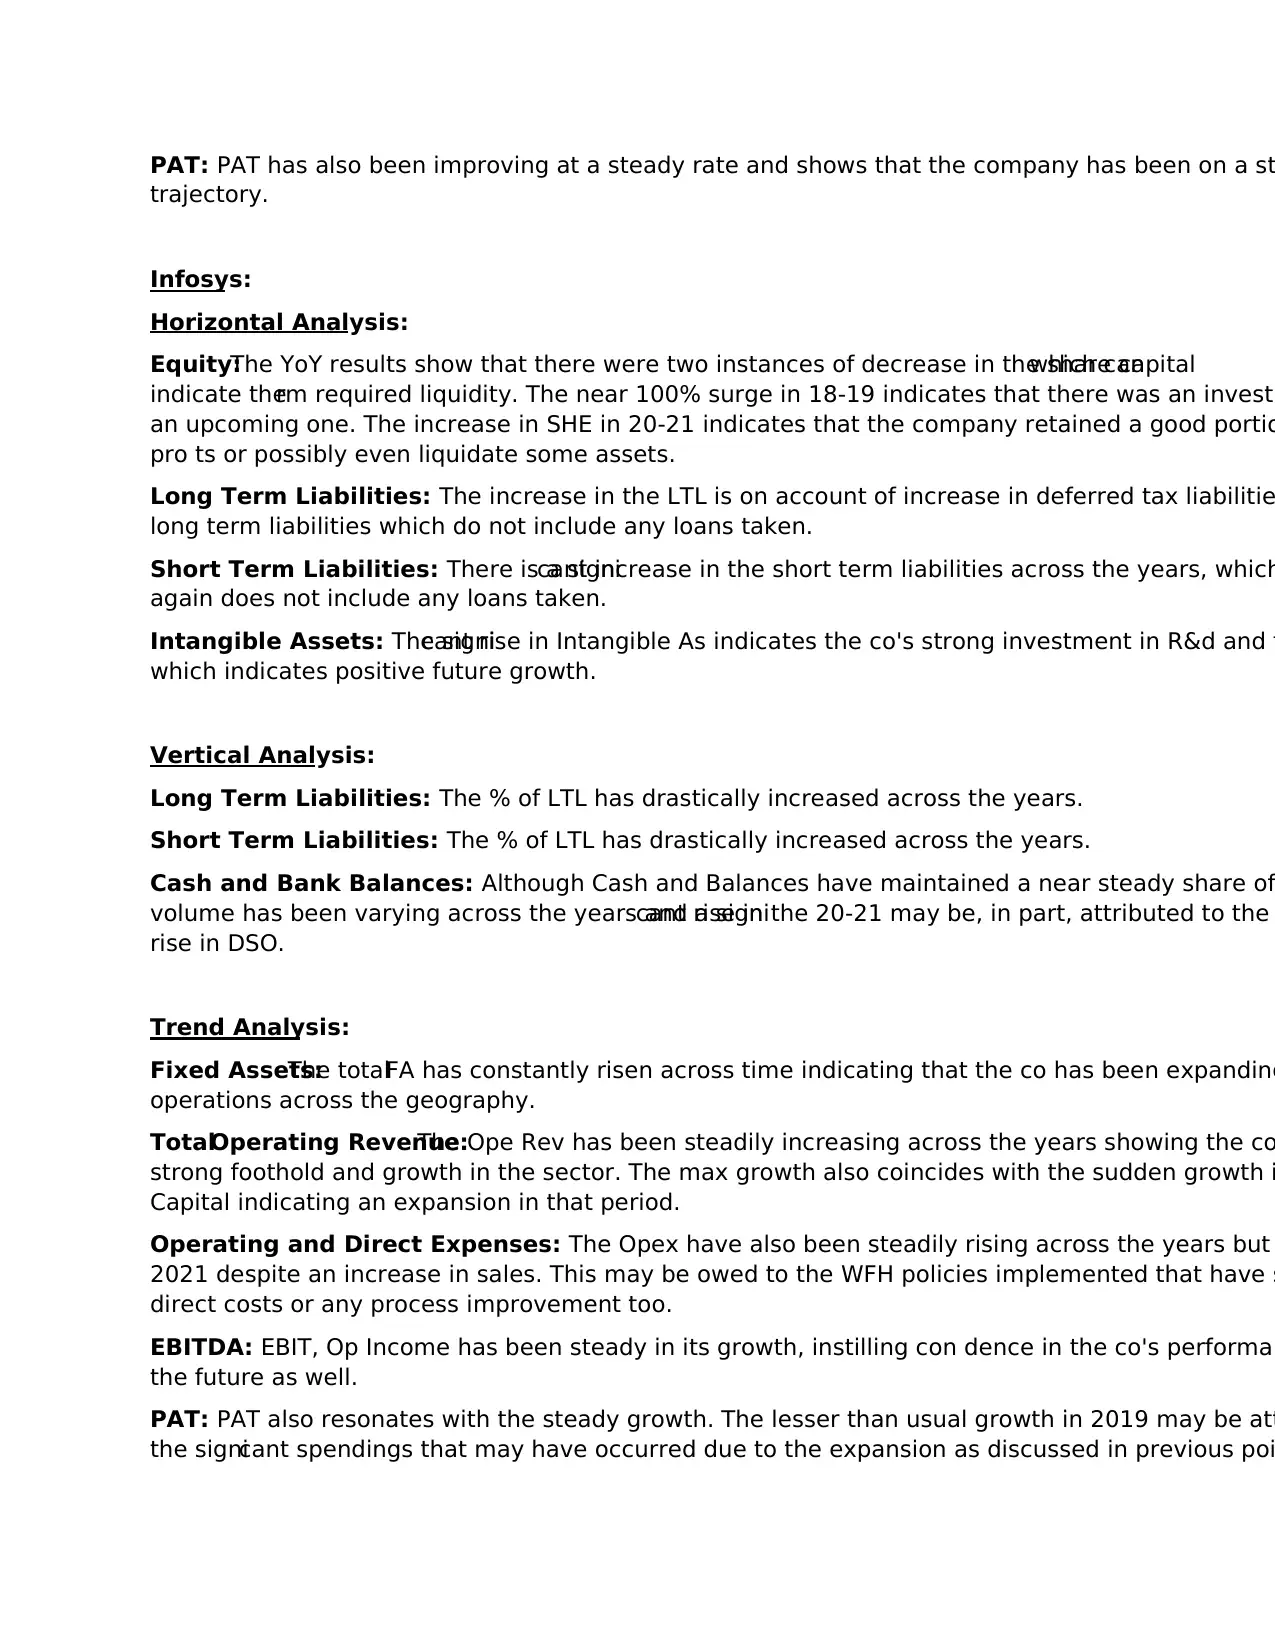
trajectory.
Infosys:
Horizontal Analysis:
Equity:The YoY results show that there were two instances of decrease in the share capitalwhich can
indicate therm required liquidity. The near 100% surge in 18-19 indicates that there was an investm
an upcoming one. The increase in SHE in 20-21 indicates that the company retained a good portio
pro ts or possibly even liquidate some assets.
Long Term Liabilities: The increase in the LTL is on account of increase in deferred tax liabilitie
long term liabilities which do not include any loans taken.
Short Term Liabilities: There is a signicant increase in the short term liabilities across the years, which
again does not include any loans taken.
Intangible Assets: The signicant rise in Intangible As indicates the co's strong investment in R&d and t
which indicates positive future growth.
Vertical Analysis:
Long Term Liabilities: The % of LTL has drastically increased across the years.
Short Term Liabilities: The % of LTL has drastically increased across the years.
Cash and Bank Balances: Although Cash and Balances have maintained a near steady share of
volume has been varying across the years and a signicant rise in the 20-21 may be, in part, attributed to the
rise in DSO.
Trend Analysis:
Fixed Assets:The totalFA has constantly risen across time indicating that the co has been expanding
operations across the geography.
TotalOperating Revenue:The Ope Rev has been steadily increasing across the years showing the co
strong foothold and growth in the sector. The max growth also coincides with the sudden growth i
Capital indicating an expansion in that period.
Operating and Direct Expenses: The Opex have also been steadily rising across the years but
2021 despite an increase in sales. This may be owed to the WFH policies implemented that have s
direct costs or any process improvement too.
EBITDA: EBIT, Op Income has been steady in its growth, instilling con dence in the co's performan
the future as well.
PAT: PAT also resonates with the steady growth. The lesser than usual growth in 2019 may be att
the signicant spendings that may have occurred due to the expansion as discussed in previous poi
You're viewing a preview
Unlock full access by subscribing today!
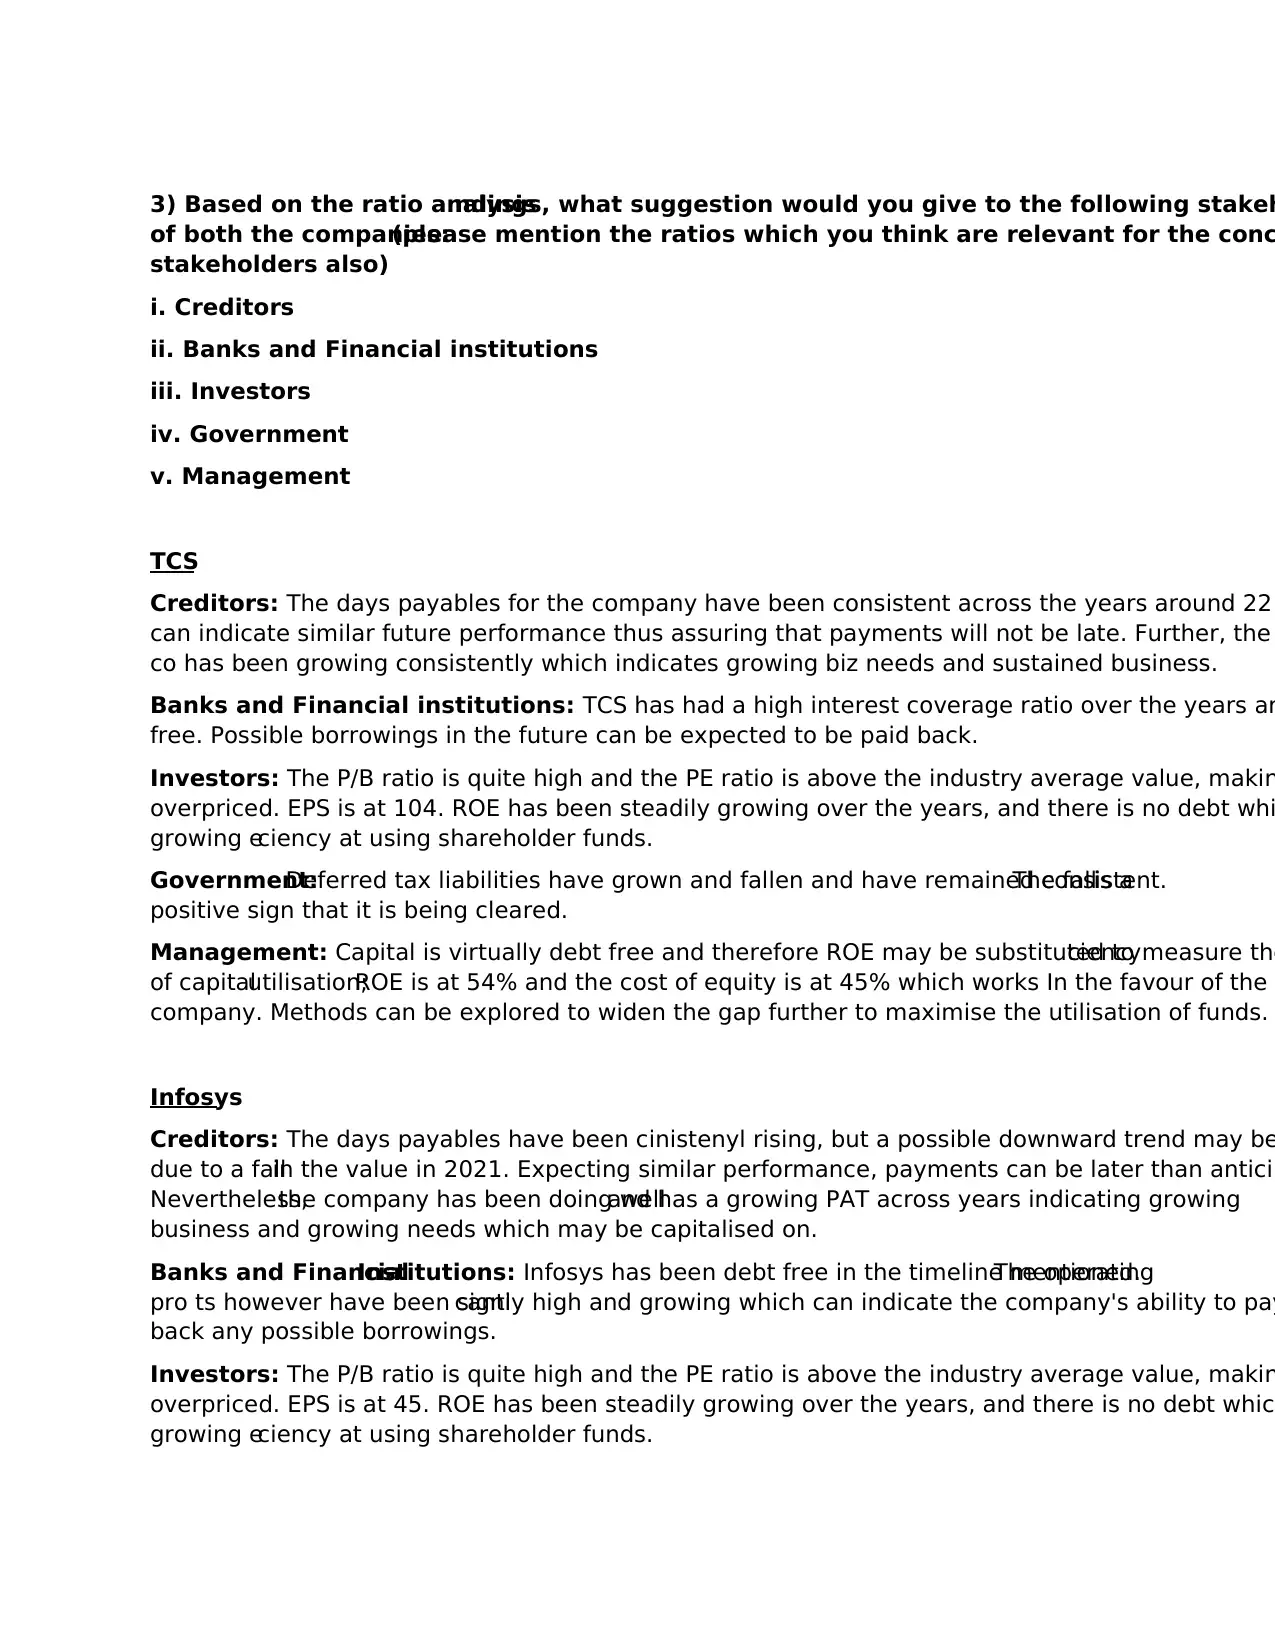
of both the companies:(please mention the ratios which you think are relevant for the conc
stakeholders also)
i. Creditors
ii. Banks and Financial institutions
iii. Investors
iv. Government
v. Management
TCS
Creditors: The days payables for the company have been consistent across the years around 22
can indicate similar future performance thus assuring that payments will not be late. Further, the
co has been growing consistently which indicates growing biz needs and sustained business.
Banks and Financial institutions: TCS has had a high interest coverage ratio over the years an
free. Possible borrowings in the future can be expected to be paid back.
Investors: The P/B ratio is quite high and the PE ratio is above the industry average value, makin
overpriced. EPS is at 104. ROE has been steadily growing over the years, and there is no debt whi
growing eciency at using shareholder funds.
Government:Deferred tax liabilities have grown and fallen and have remained consistent.The fallis a
positive sign that it is being cleared.
Management: Capital is virtually debt free and therefore ROE may be substituted to measure theciency
of capitalutilisation;ROE is at 54% and the cost of equity is at 45% which works In the favour of the
company. Methods can be explored to widen the gap further to maximise the utilisation of funds.
Infosys
Creditors: The days payables have been cinistenyl rising, but a possible downward trend may be
due to a fallin the value in 2021. Expecting similar performance, payments can be later than anticip
Nevertheless,the company has been doing welland has a growing PAT across years indicating growing
business and growing needs which may be capitalised on.
Banks and FinancialInstitutions: Infosys has been debt free in the timeline mentioned.The operating
pro ts however have been signicantly high and growing which can indicate the company's ability to pay
back any possible borrowings.
Investors: The P/B ratio is quite high and the PE ratio is above the industry average value, makin
overpriced. EPS is at 45. ROE has been steadily growing over the years, and there is no debt which
growing eciency at using shareholder funds.
Paraphrase This Document
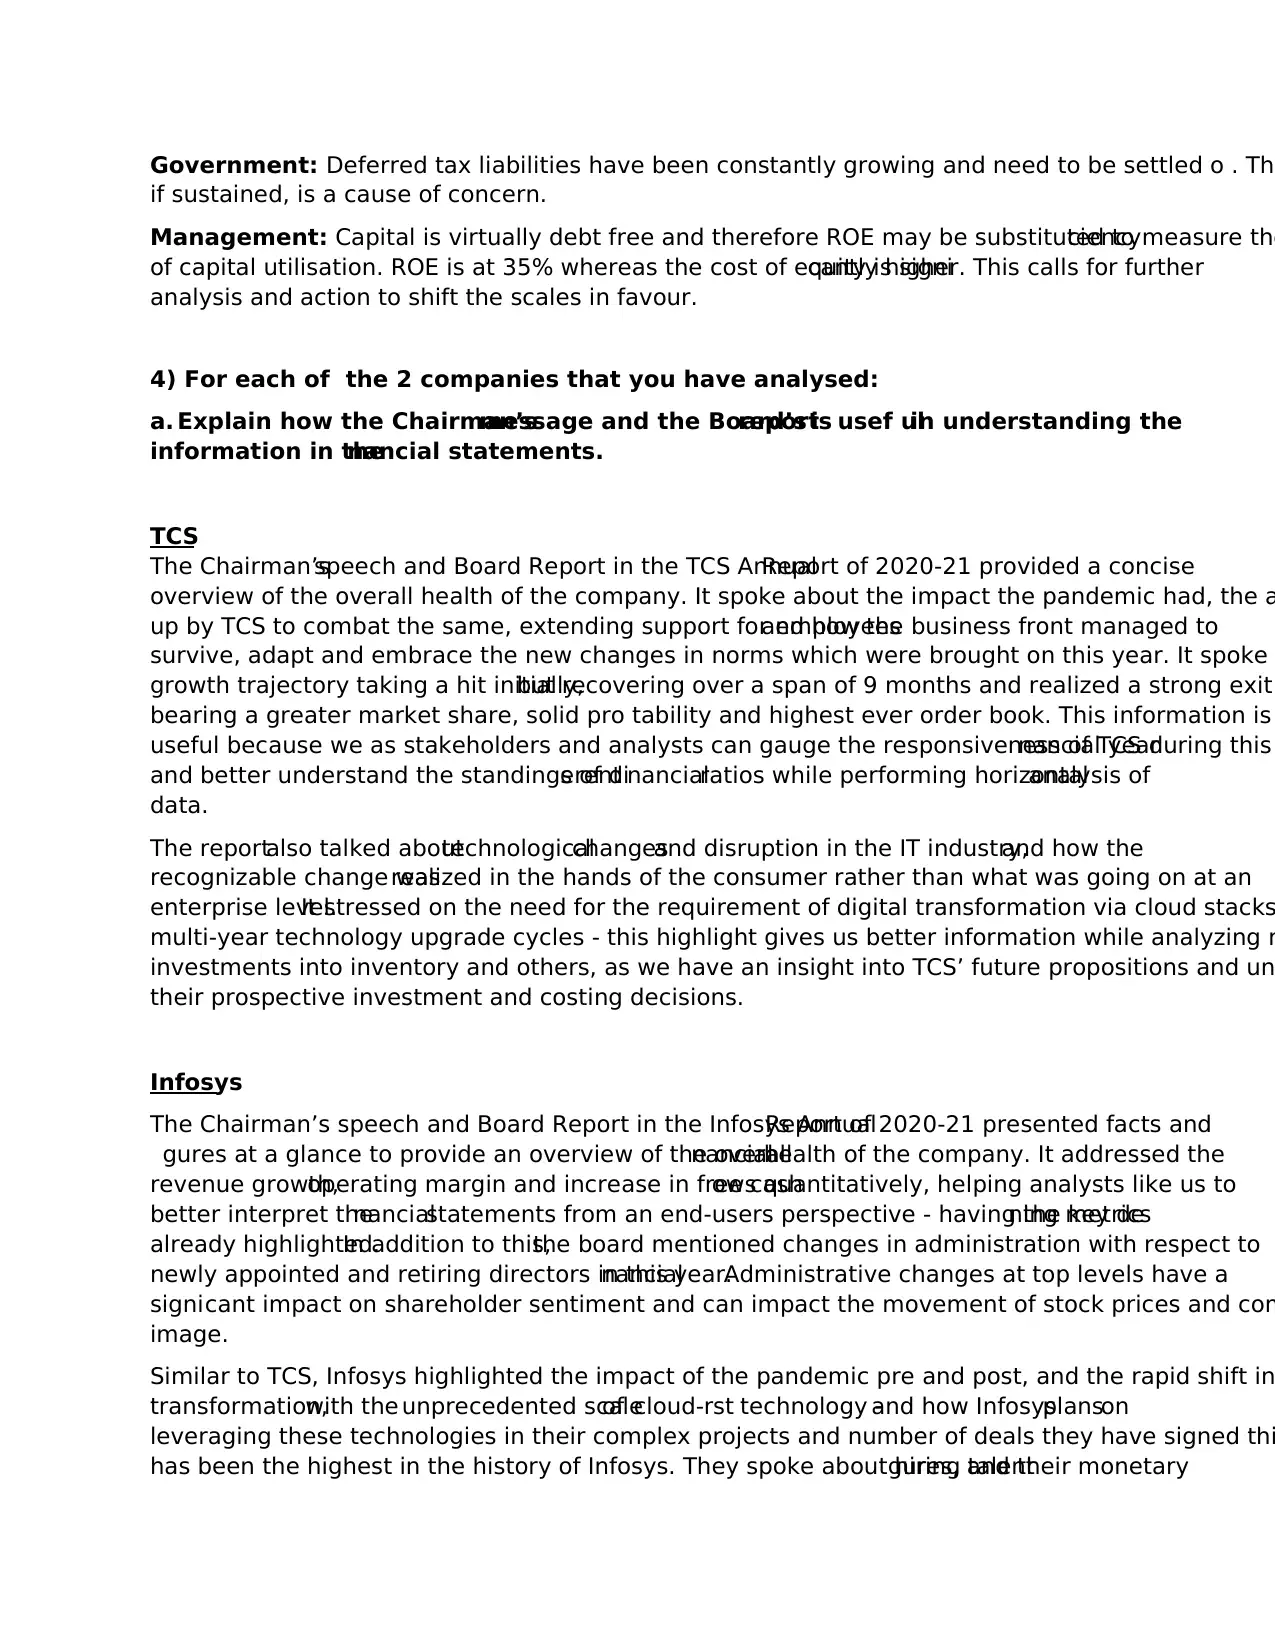
if sustained, is a cause of concern.
Management: Capital is virtually debt free and therefore ROE may be substituted to measure theciency
of capital utilisation. ROE is at 35% whereas the cost of equity is signicantly higher. This calls for further
analysis and action to shift the scales in favour.
4) For each of the 2 companies that you have analysed:
a. Explain how the Chairman’smessage and the Board’sreportis usef ulin understanding the
information in thenancial statements.
TCS
The Chairman’sspeech and Board Report in the TCS AnnualReport of 2020-21 provided a concise
overview of the overall health of the company. It spoke about the impact the pandemic had, the a
up by TCS to combat the same, extending support for employeesand how the business front managed to
survive, adapt and embrace the new changes in norms which were brought on this year. It spoke
growth trajectory taking a hit initially,but recovering over a span of 9 months and realized a strong exit
bearing a greater market share, solid pro tability and highest ever order book. This information is
useful because we as stakeholders and analysts can gauge the responsiveness of TCS during thisnancial year
and better understand the standings of dierent nancialratios while performing horizontalanalysis of
data.
The reportalso talked abouttechnologicalchangesand disruption in the IT industry,and how the
recognizable change wasrealized in the hands of the consumer rather than what was going on at an
enterprise level.It stressed on the need for the requirement of digital transformation via cloud stacks
multi-year technology upgrade cycles - this highlight gives us better information while analyzing n
investments into inventory and others, as we have an insight into TCS’ future propositions and un
their prospective investment and costing decisions.
Infosys
The Chairman’s speech and Board Report in the Infosys AnnualReport of 2020-21 presented facts and
gures at a glance to provide an overview of the overallnancialhealth of the company. It addressed the
revenue growth,operating margin and increase in free cashows quantitatively, helping analysts like us to
better interpret thenancialstatements from an end-users perspective - having the key dening metrics
already highlighted.In addition to this,the board mentioned changes in administration with respect to
newly appointed and retiring directors in thisnancialyear.Administrative changes at top levels have a
signicant impact on shareholder sentiment and can impact the movement of stock prices and com
image.
Similar to TCS, Infosys highlighted the impact of the pandemic pre and post, and the rapid shift in
transformation,with the unprecedented scaleof cloud-rst technology -and how Infosysplanson
leveraging these technologies in their complex projects and number of deals they have signed thi
has been the highest in the history of Infosys. They spoke about hiring talentgures, and their monetary
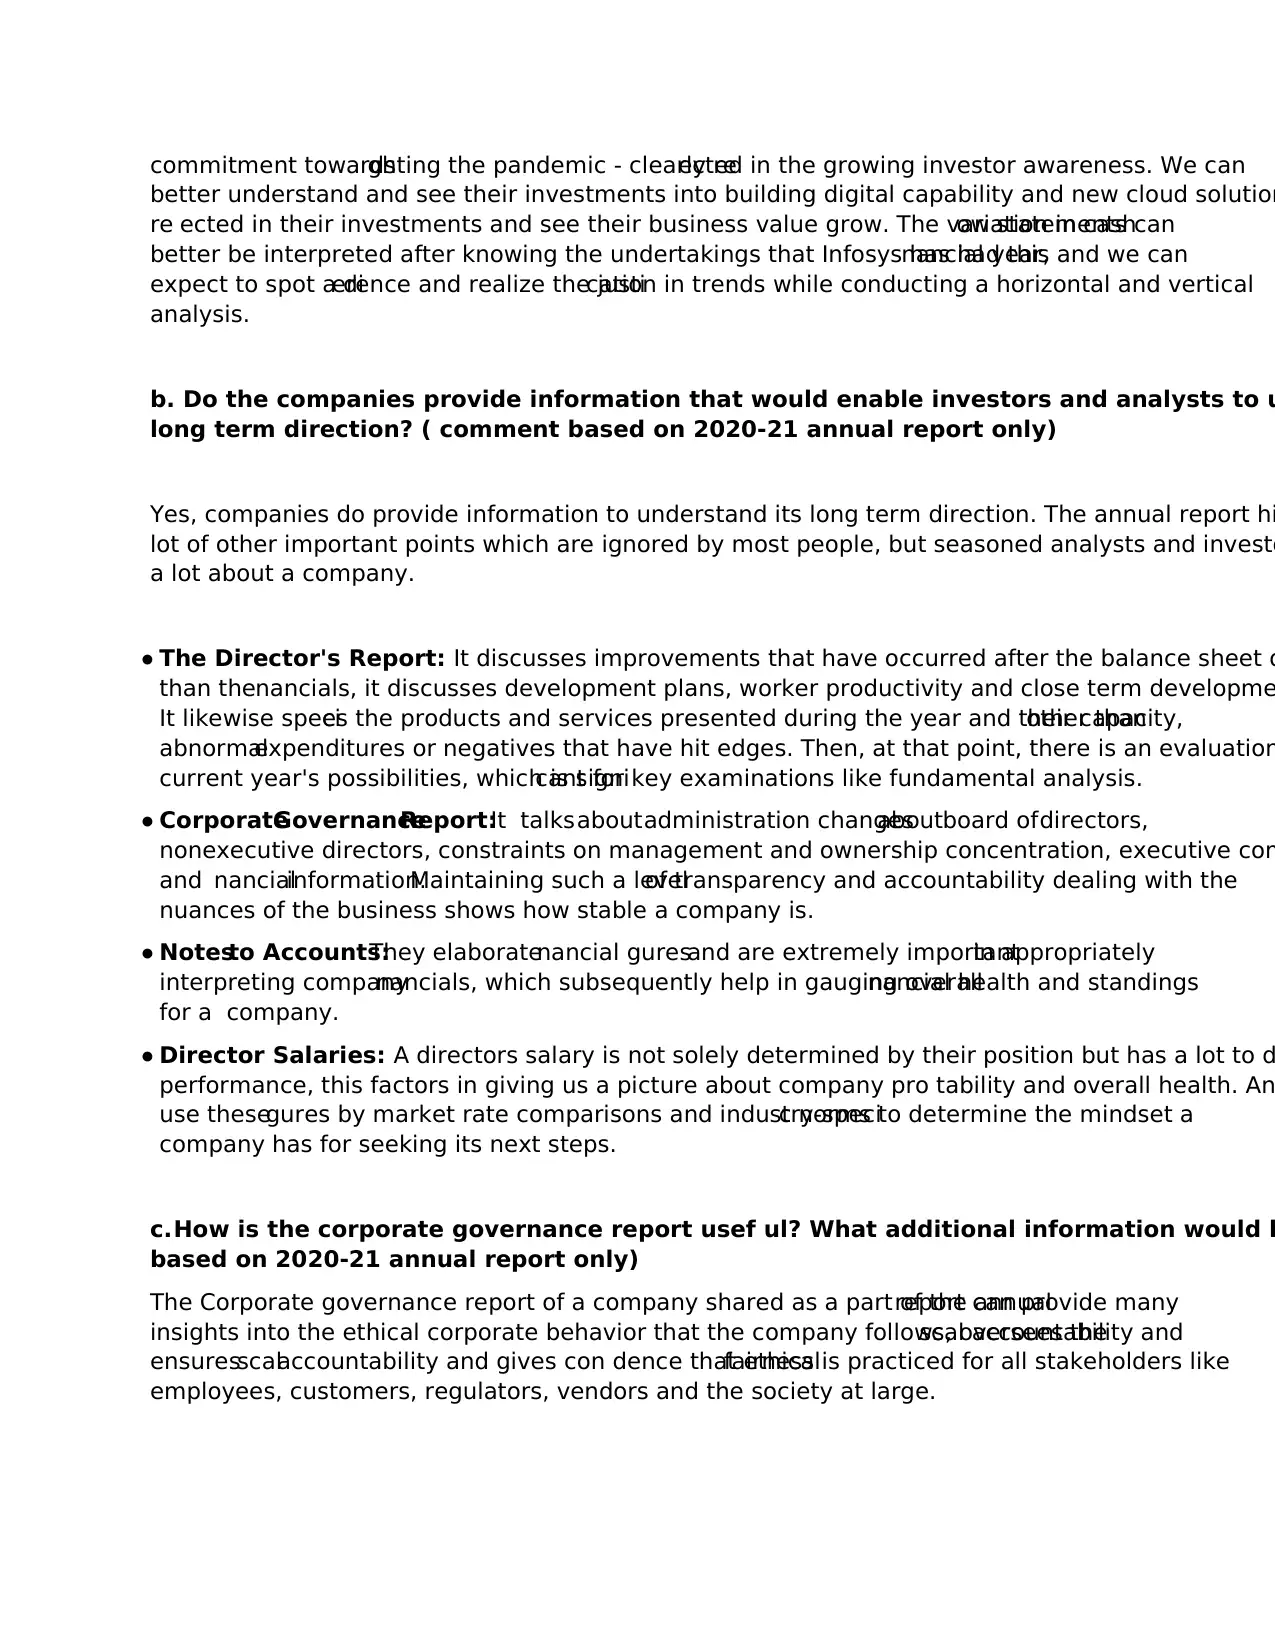
better understand and see their investments into building digital capability and new cloud solution
re ected in their investments and see their business value grow. The variation in cashow statements can
better be interpreted after knowing the undertakings that Infosys has had thisnancial year, and we can
expect to spot a dierence and realize the justication in trends while conducting a horizontal and vertical
analysis.
b. Do the companies provide information that would enable investors and analysts to u
long term direction? ( comment based on 2020-21 annual report only)
Yes, companies do provide information to understand its long term direction. The annual report hi
lot of other important points which are ignored by most people, but seasoned analysts and investo
a lot about a company.
● The Director's Report: It discusses improvements that have occurred after the balance sheet d
than thenancials, it discusses development plans, worker productivity and close term developme
It likewise species the products and services presented during the year and their capacity,other than
abnormalexpenditures or negatives that have hit edges. Then, at that point, there is an evaluation
current year's possibilities, which is signicant for key examinations like fundamental analysis.
● CorporateGovernanceReport:It talksaboutadministration changesaboutboard ofdirectors,
nonexecutive directors, constraints on management and ownership concentration, executive com
and nancialinformation.Maintaining such a levelof transparency and accountability dealing with the
nuances of the business shows how stable a company is.
● Notesto Accounts:They elaboratenancial guresand are extremely importantin appropriately
interpreting companynancials, which subsequently help in gauging overallnancial health and standings
for a company.
● Director Salaries: A directors salary is not solely determined by their position but has a lot to d
performance, this factors in giving us a picture about company pro tability and overall health. An
use thesegures by market rate comparisons and industry-specic norms to determine the mindset a
company has for seeking its next steps.
c.How is the corporate governance report usef ul? What additional information would b
based on 2020-21 annual report only)
The Corporate governance report of a company shared as a part of the annualreport can provide many
insights into the ethical corporate behavior that the company follows, oversees thescal accountability and
ensuresscalaccountability and gives con dence that ethicalfairness is practiced for all stakeholders like
employees, customers, regulators, vendors and the society at large.
You're viewing a preview
Unlock full access by subscribing today!
TCoC, Code of conduct for its non-executive directors,Tata Business Excellence Model,TCS CoC for
Prevention of insider trading and the Code of Corporate Disclosure Practices.
It can be used to get to know about things like:
● Succession Planning:It gives an idea on how the new executives will be hired and provides con dence
the stakeholders that the company has robust succession planning in place.
● The Tax Strategy: It provides info into the tax strategies that company had and the stakeholders
aware of the facts that the company abides by the tax laws and regulations prevalent in the coun
● Values,Ethics and Compliance:It gives an insight into the kind of ethical practices and codes that TCS
follows and what are the steps taken by the company to ensure that the same keep on getting fo
● Avoidance of Con ict of Interest: It gives info on how the company works in creating dierent executive
positions to make sure that there is no con ict of interest.
● Board Independence and minority shareholders’interest:It informsthe stakeholdersabout how the
company ensures that the board consists of highly qualied and independent directors.
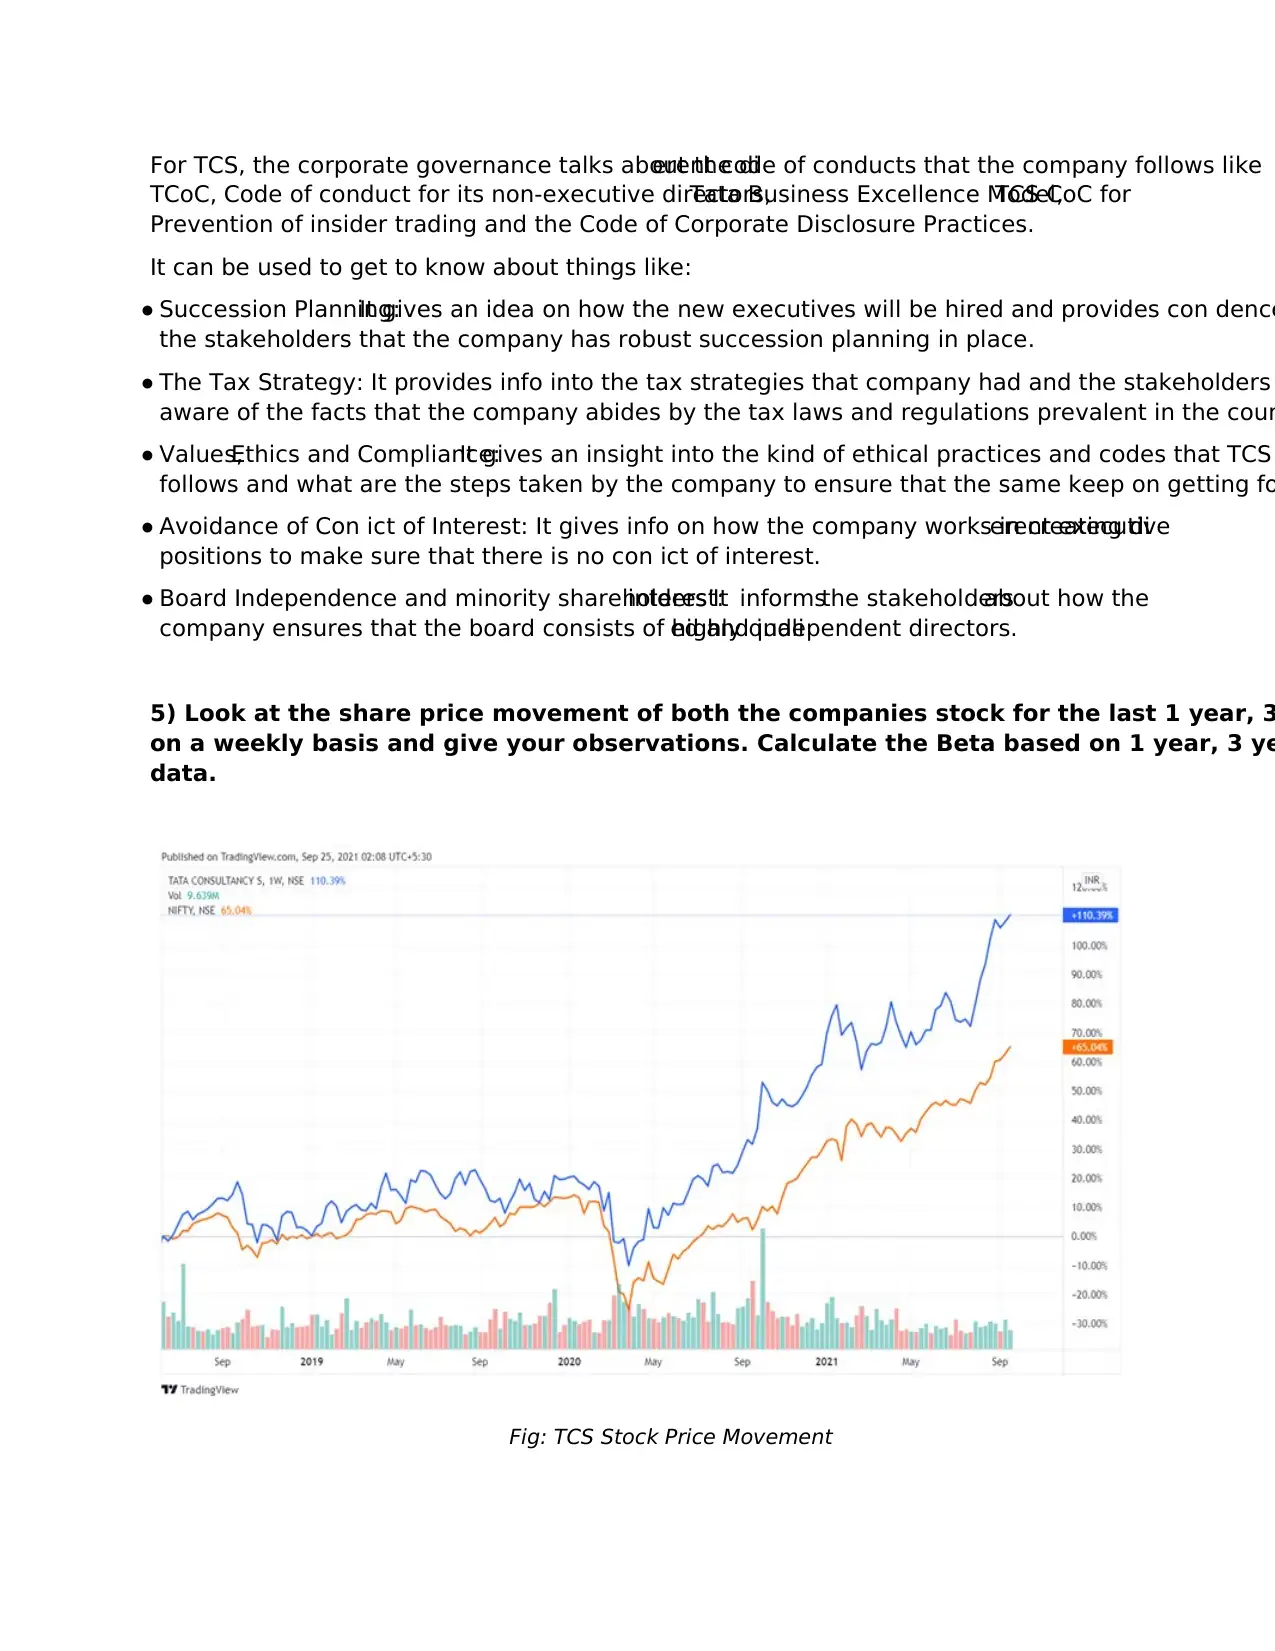
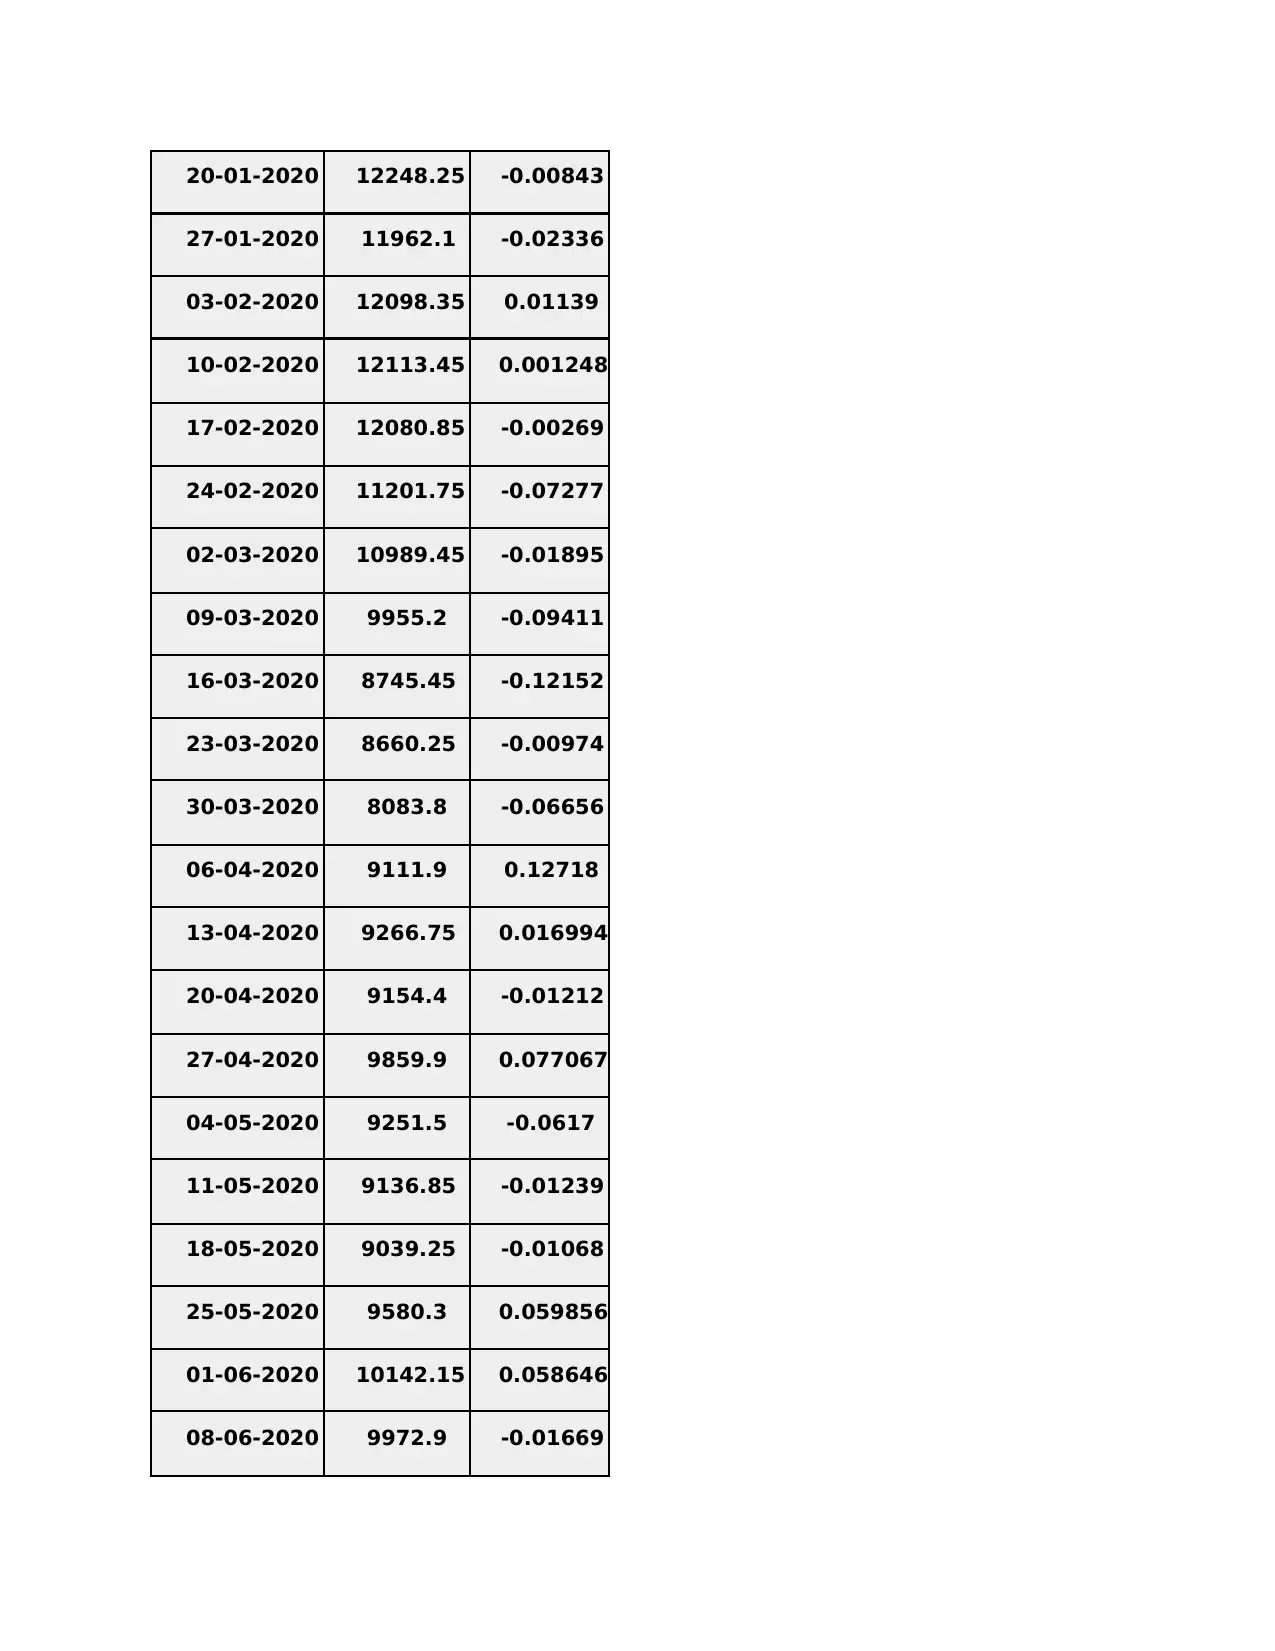
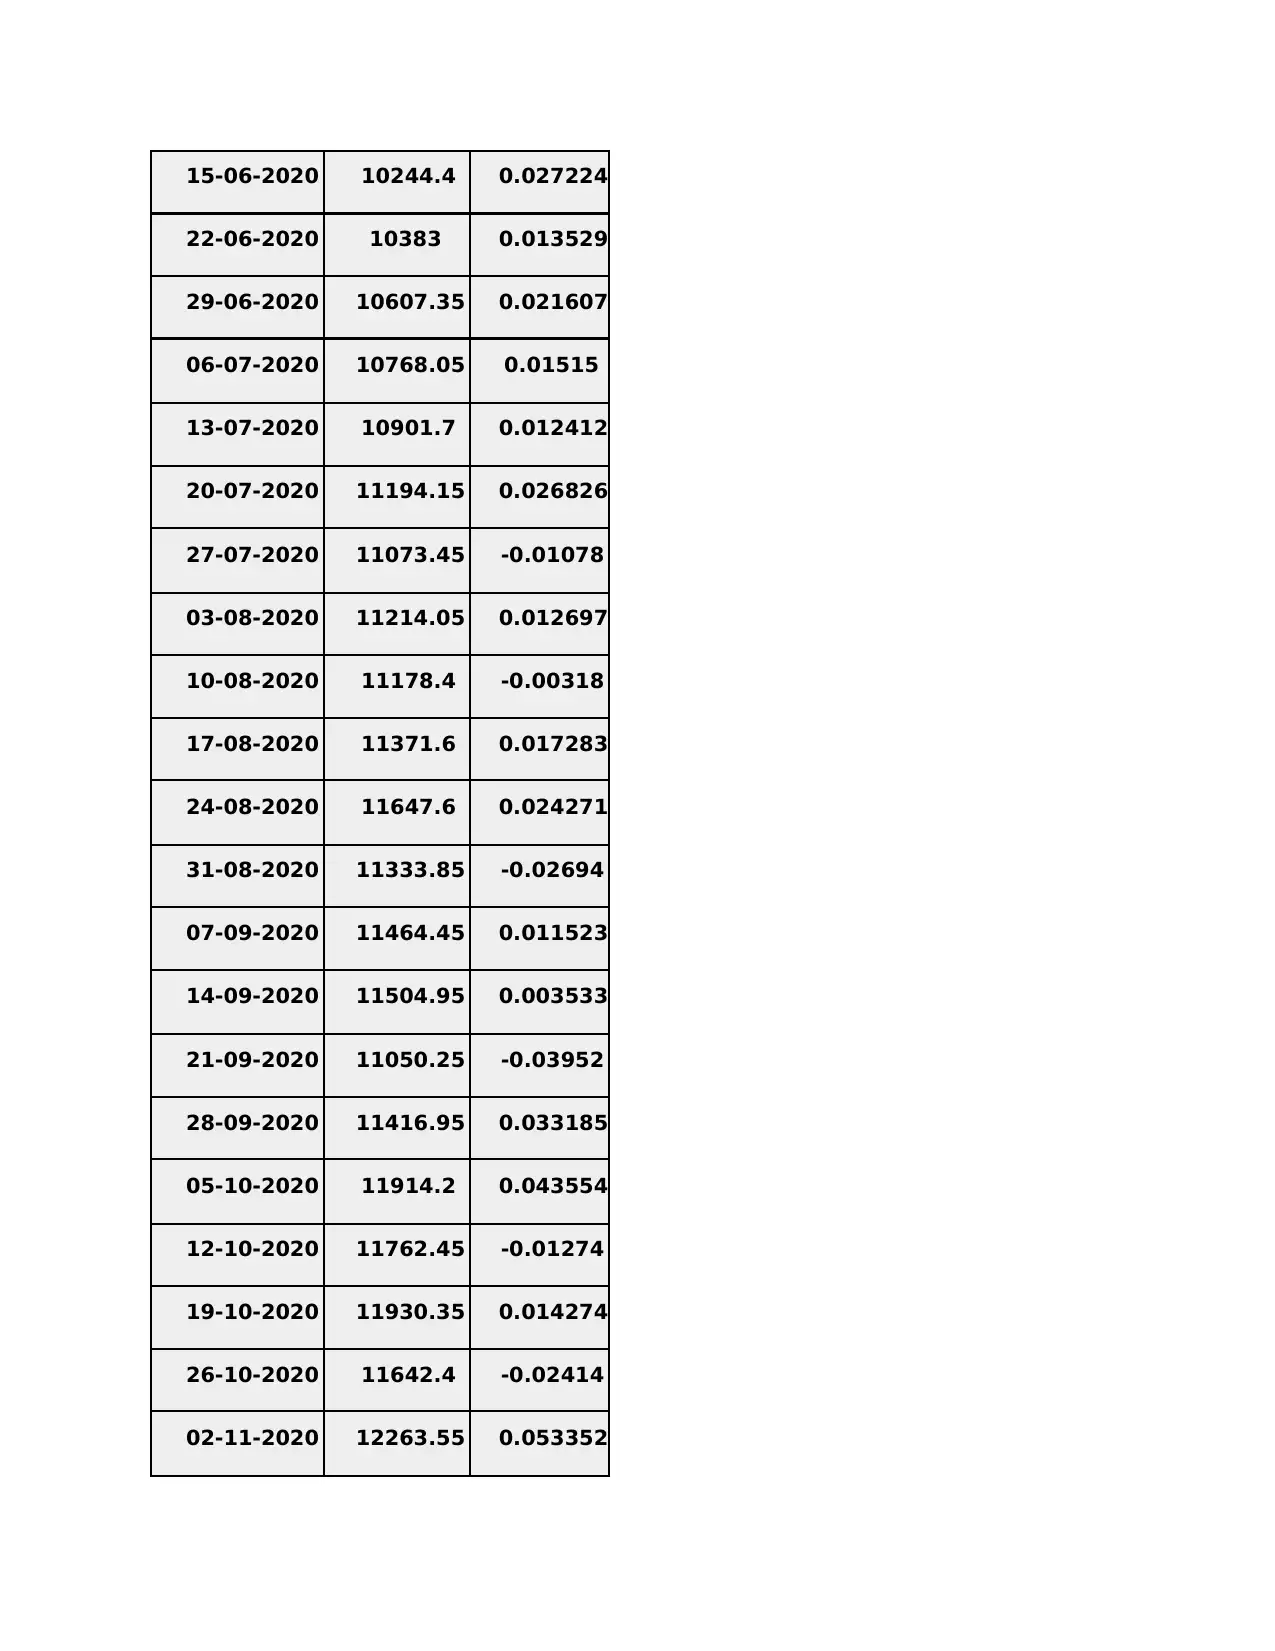
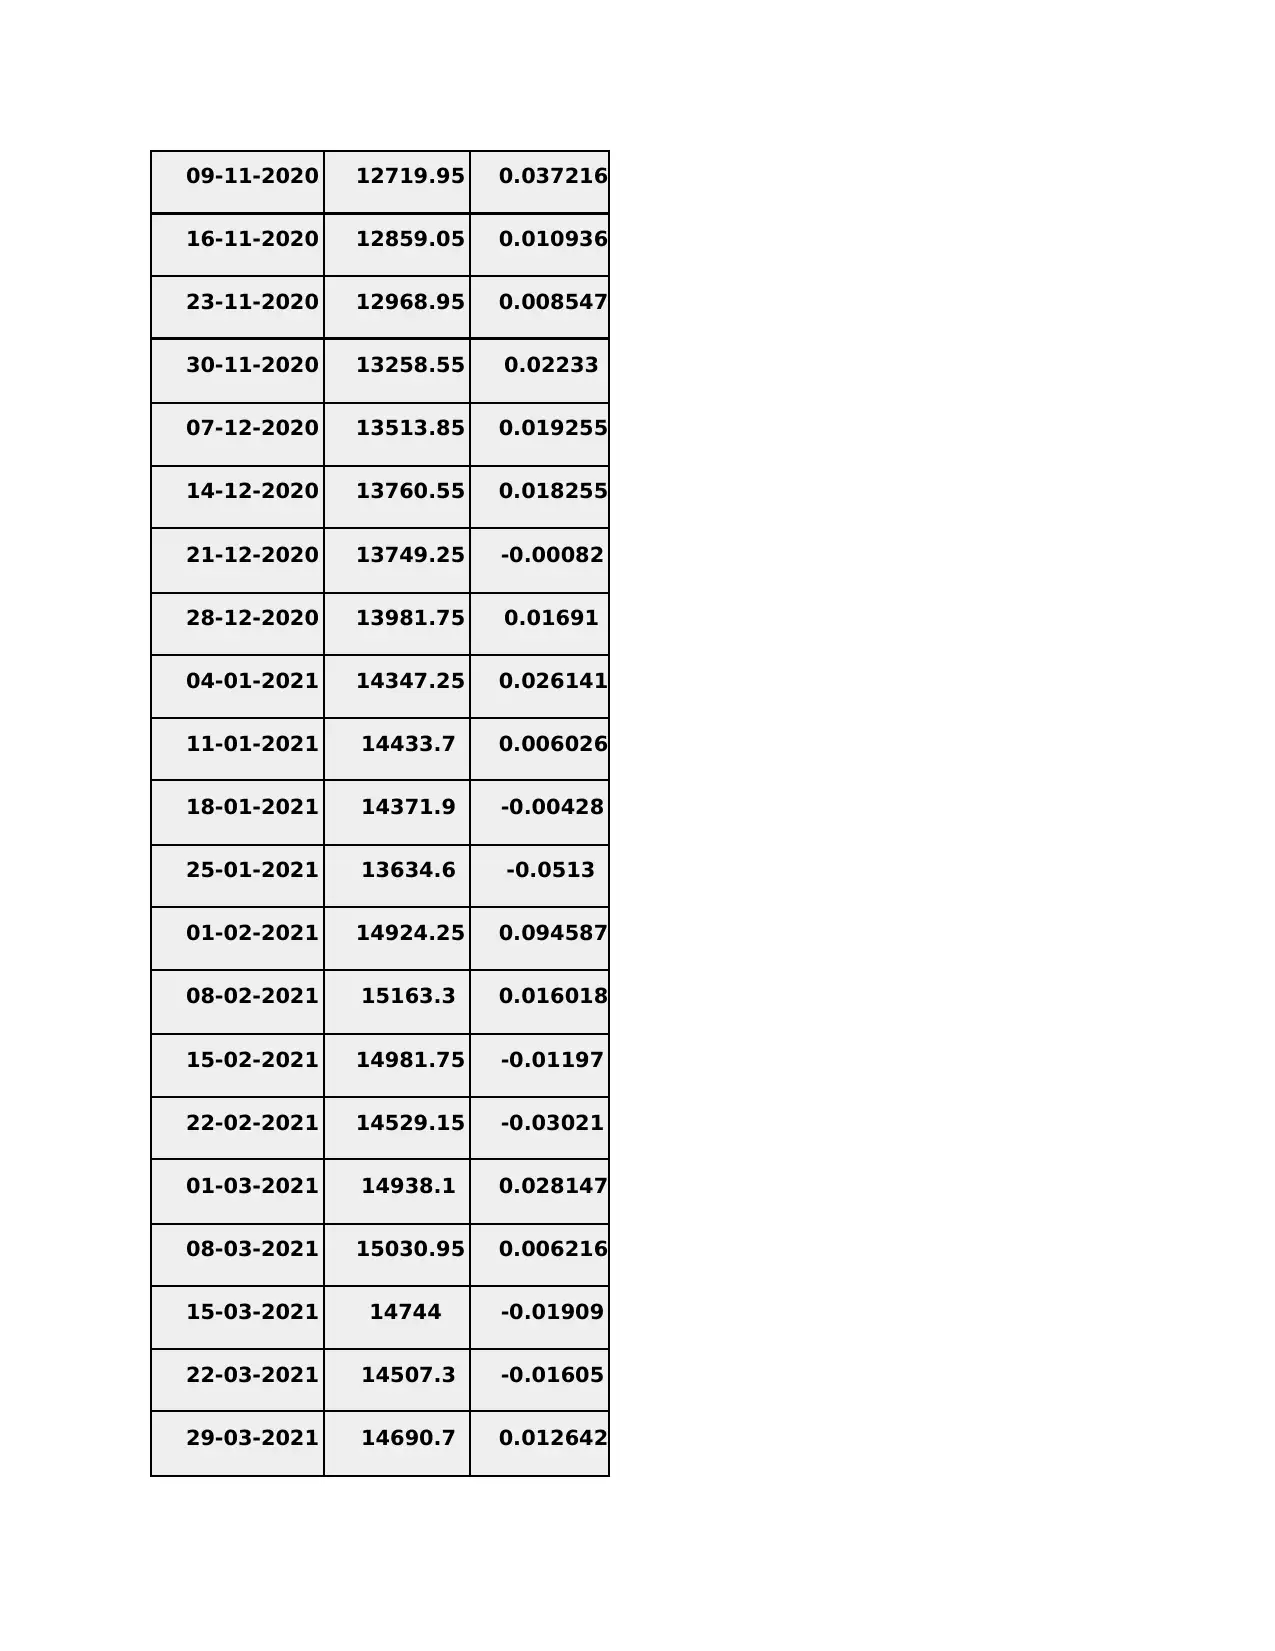
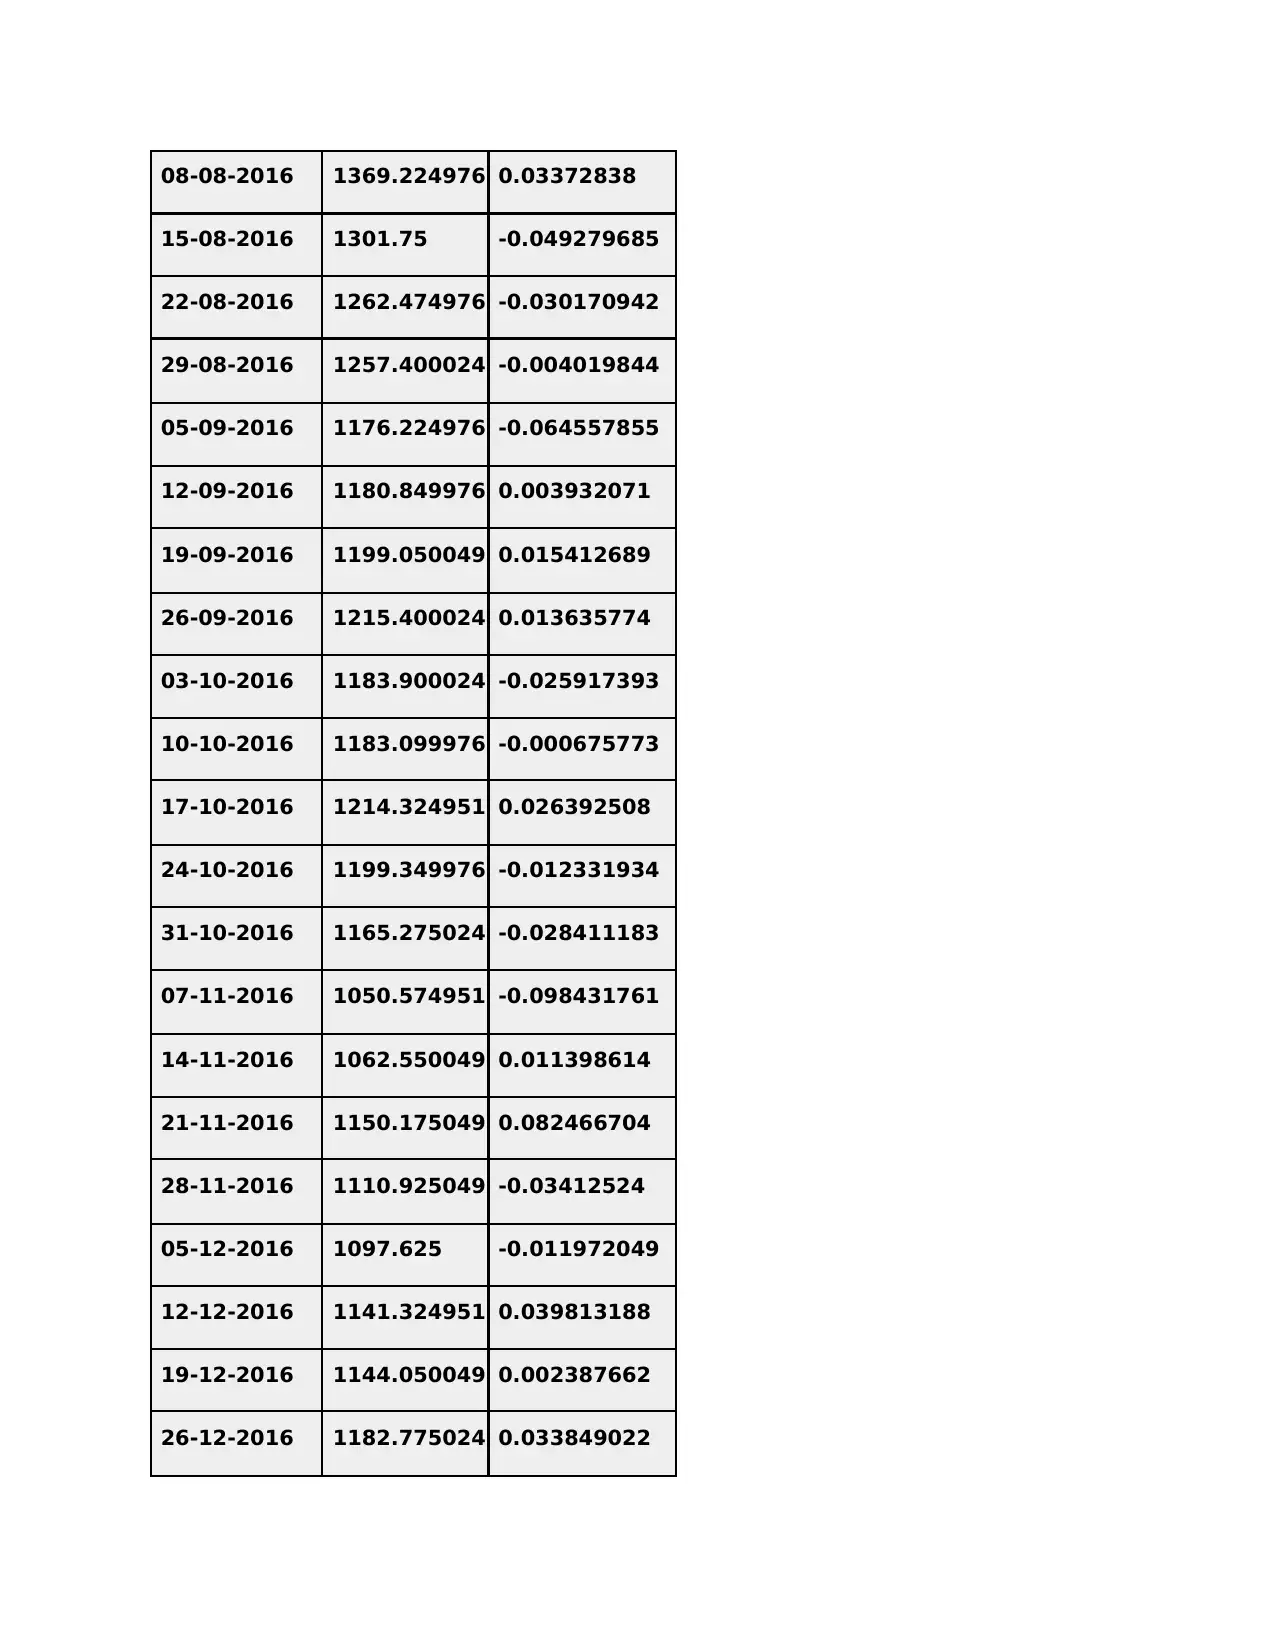
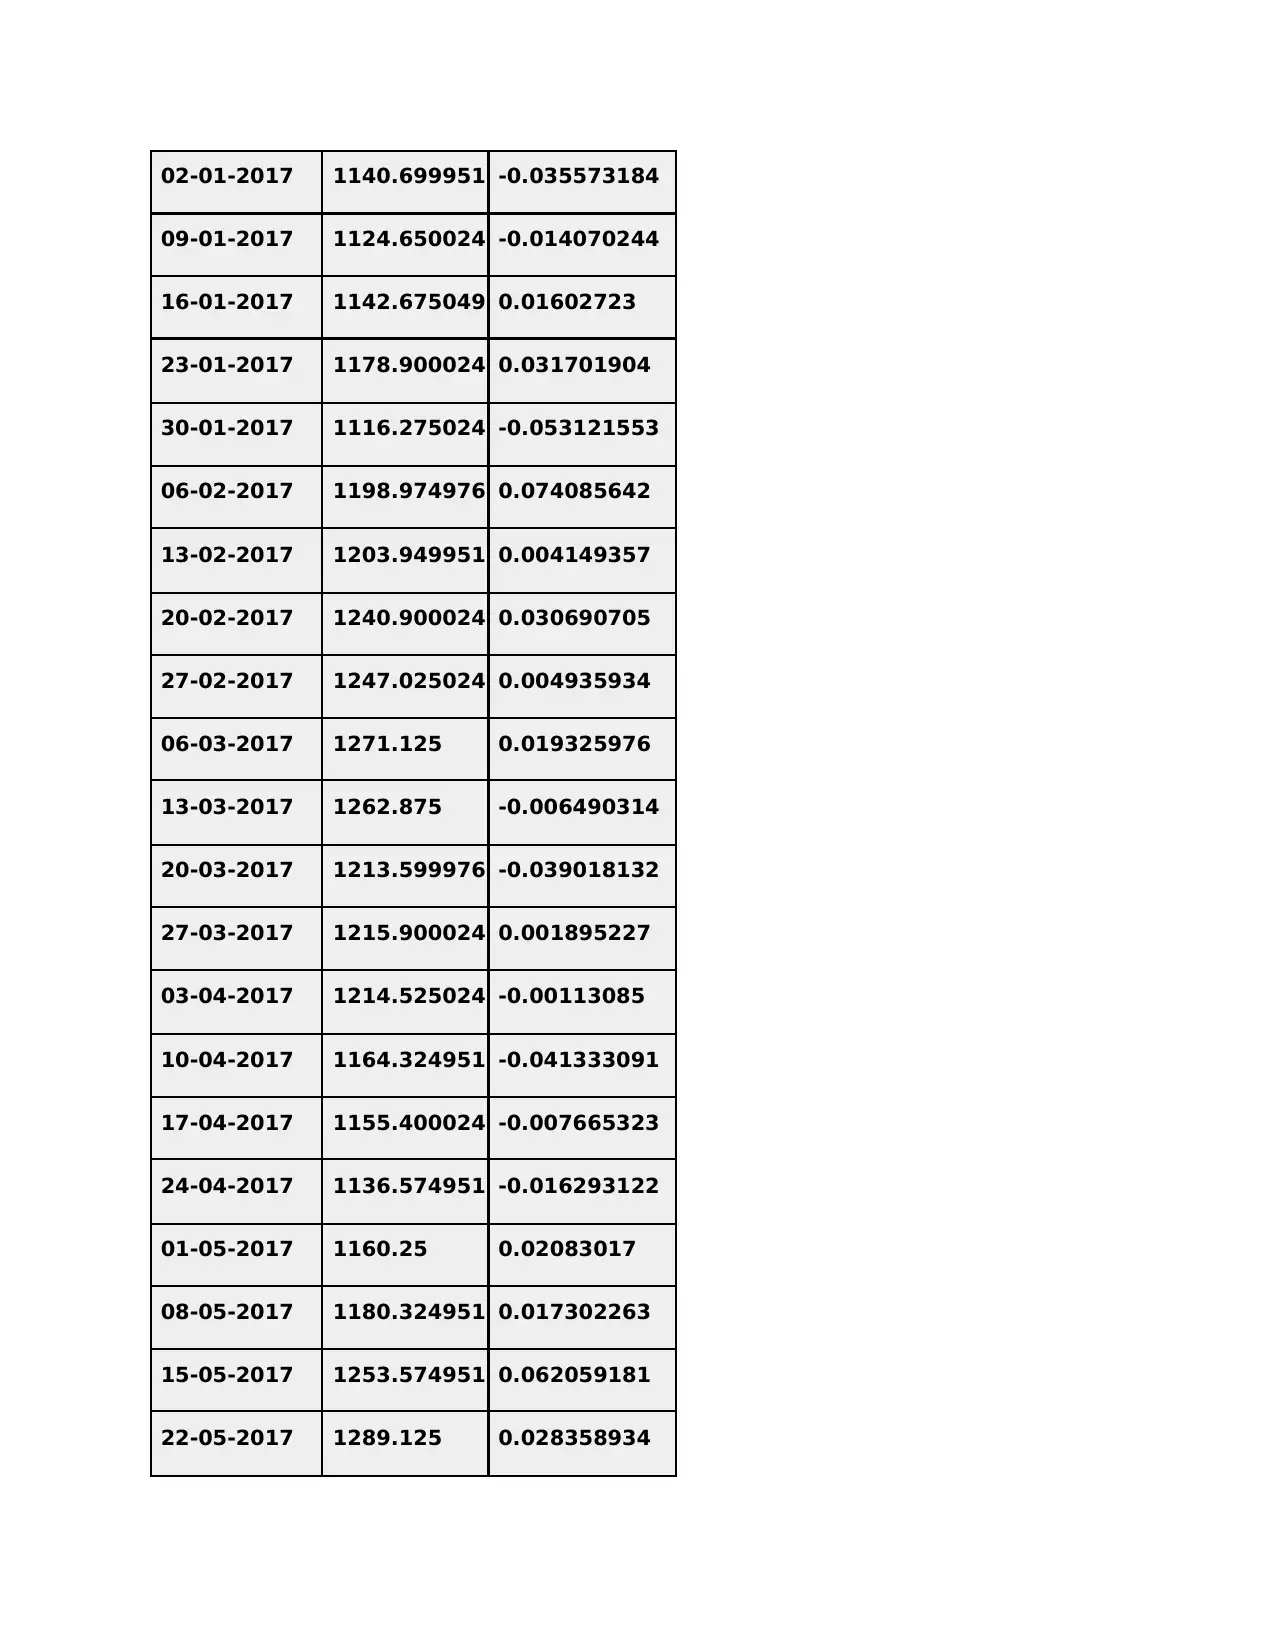
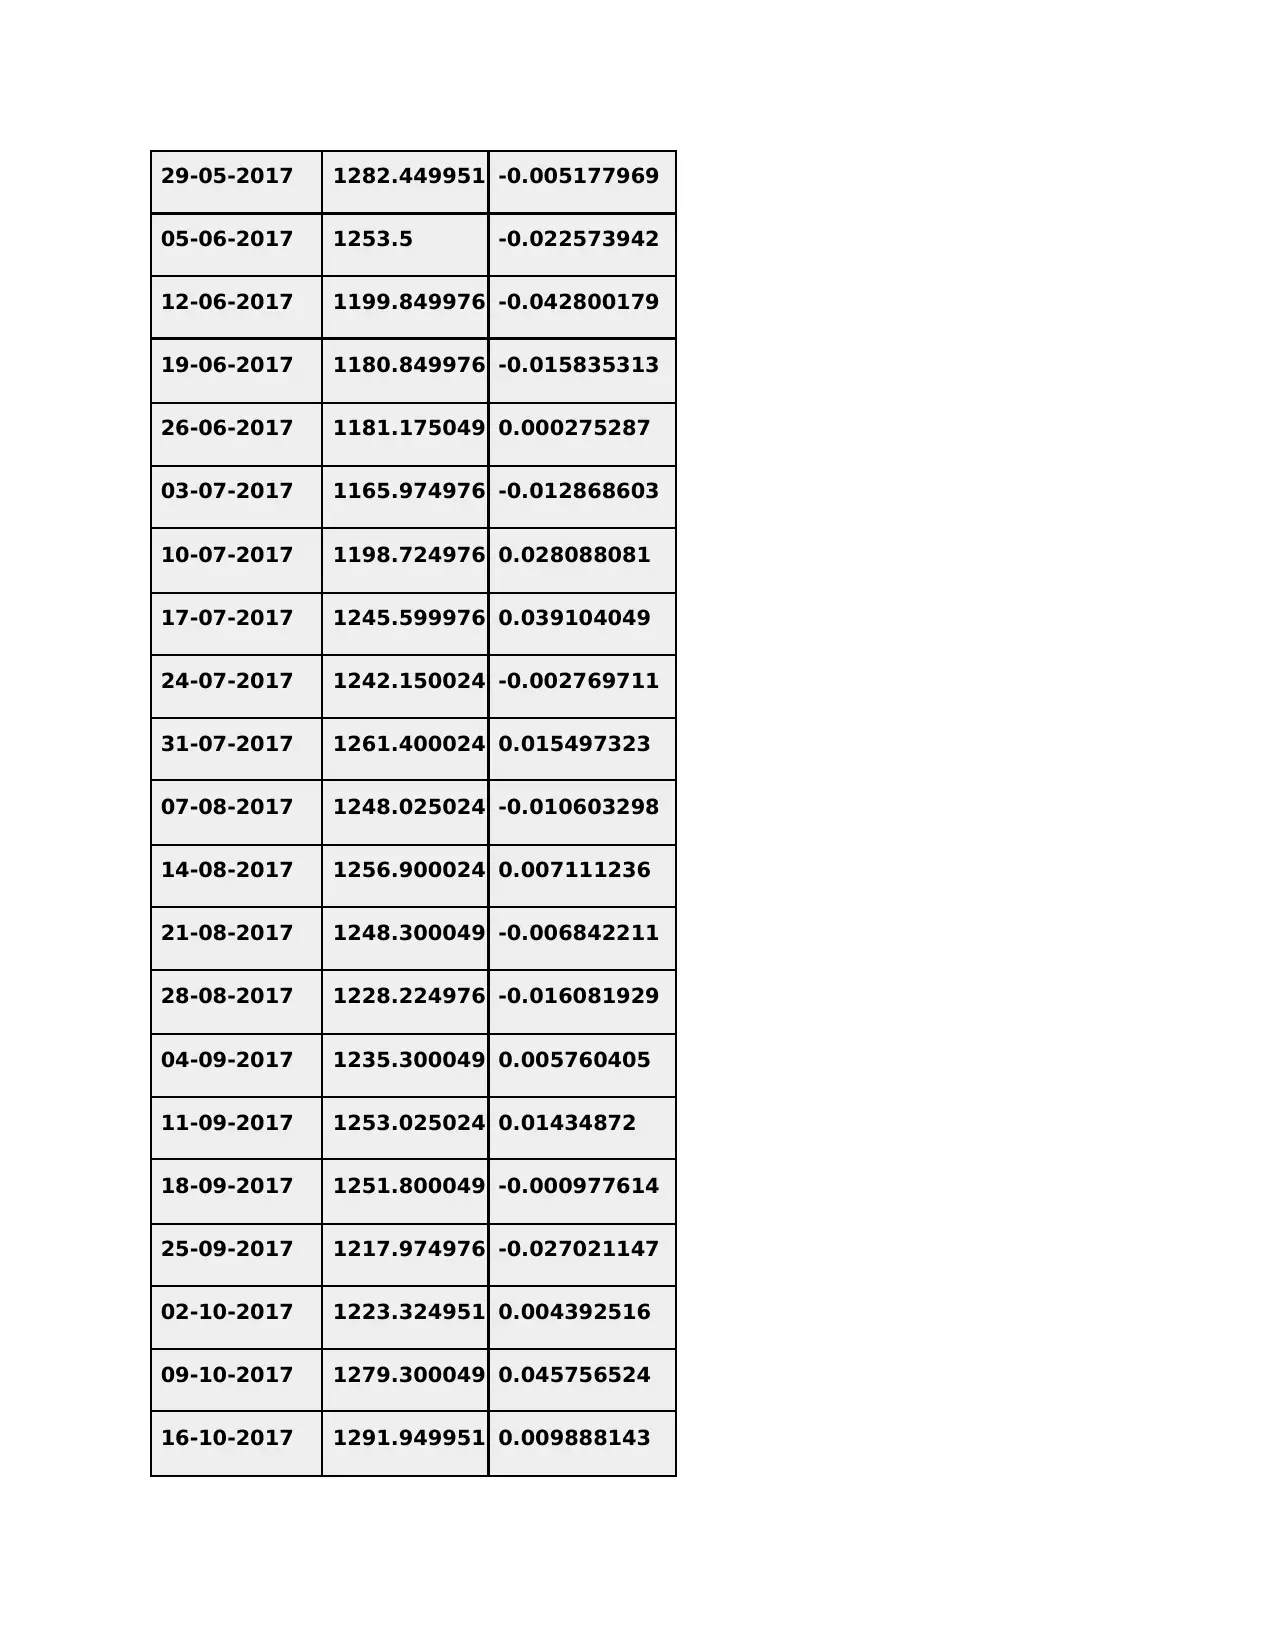
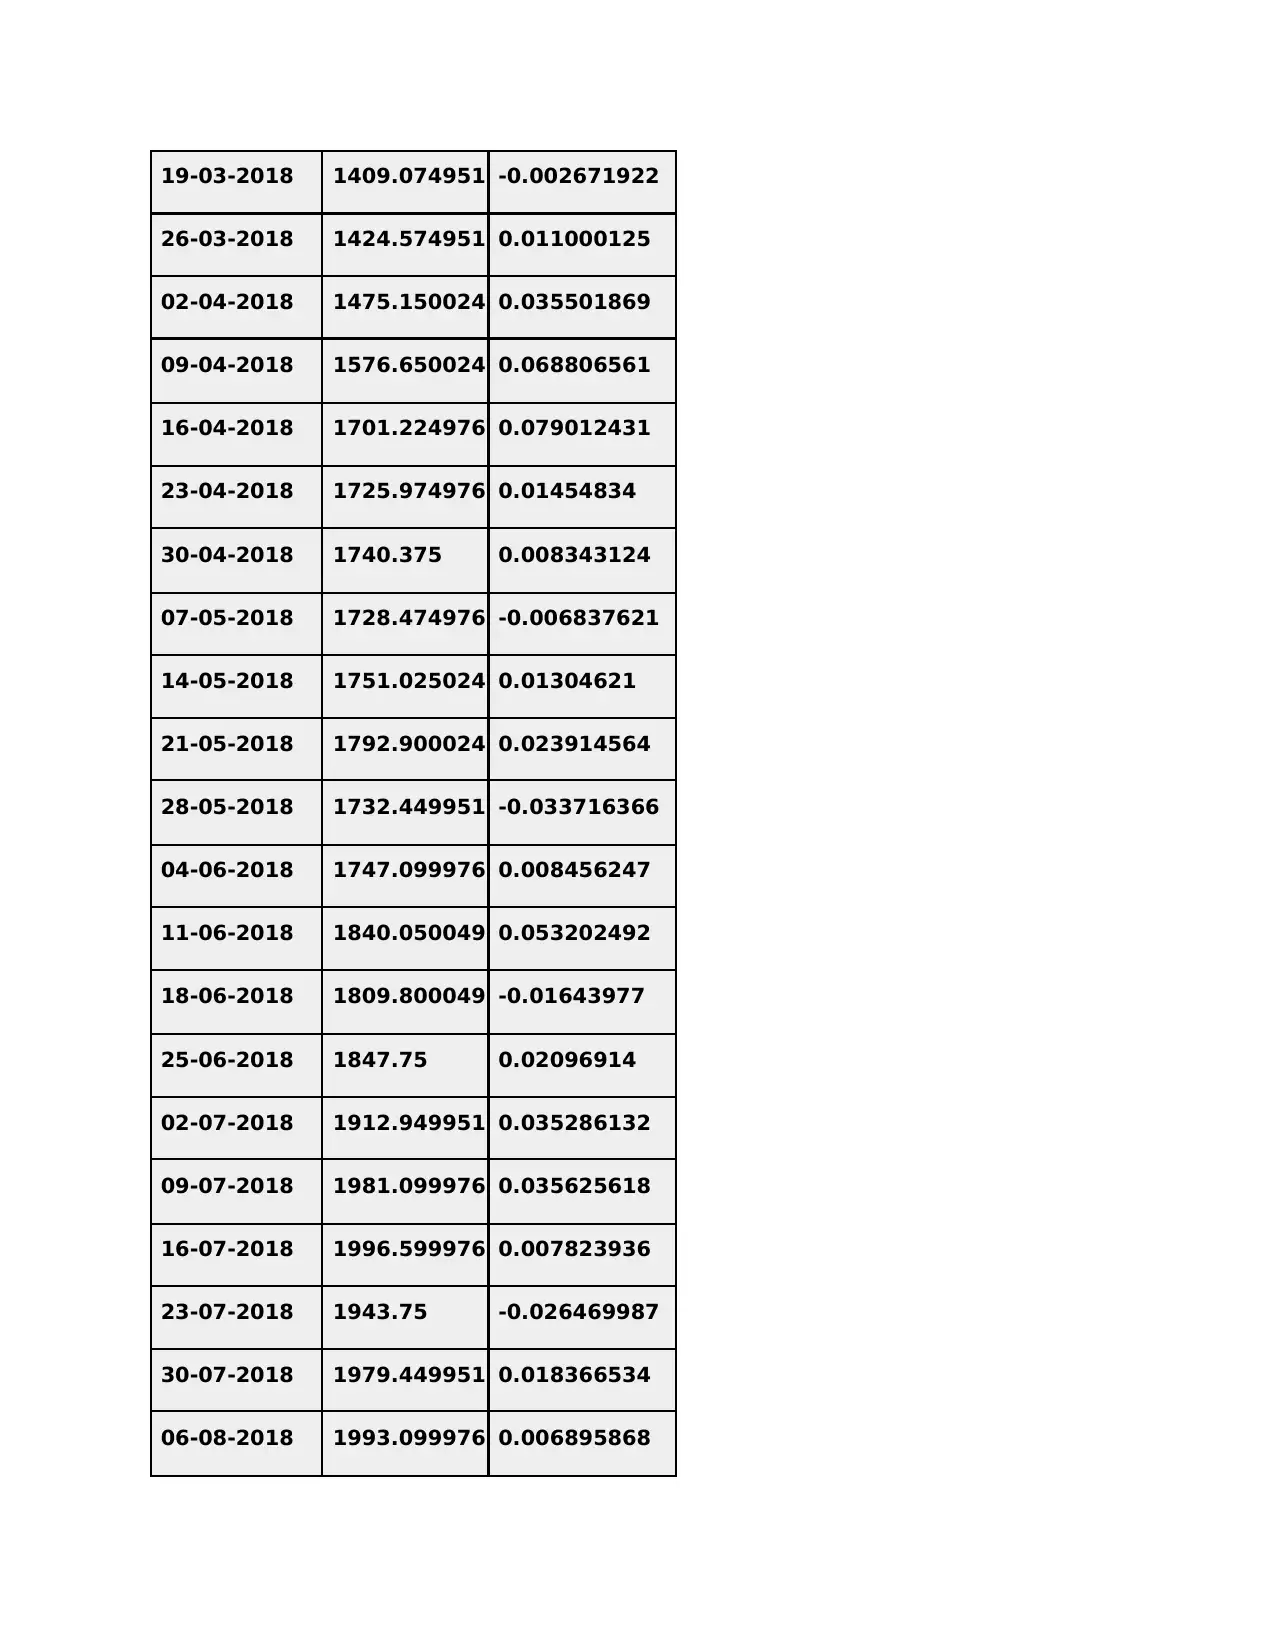
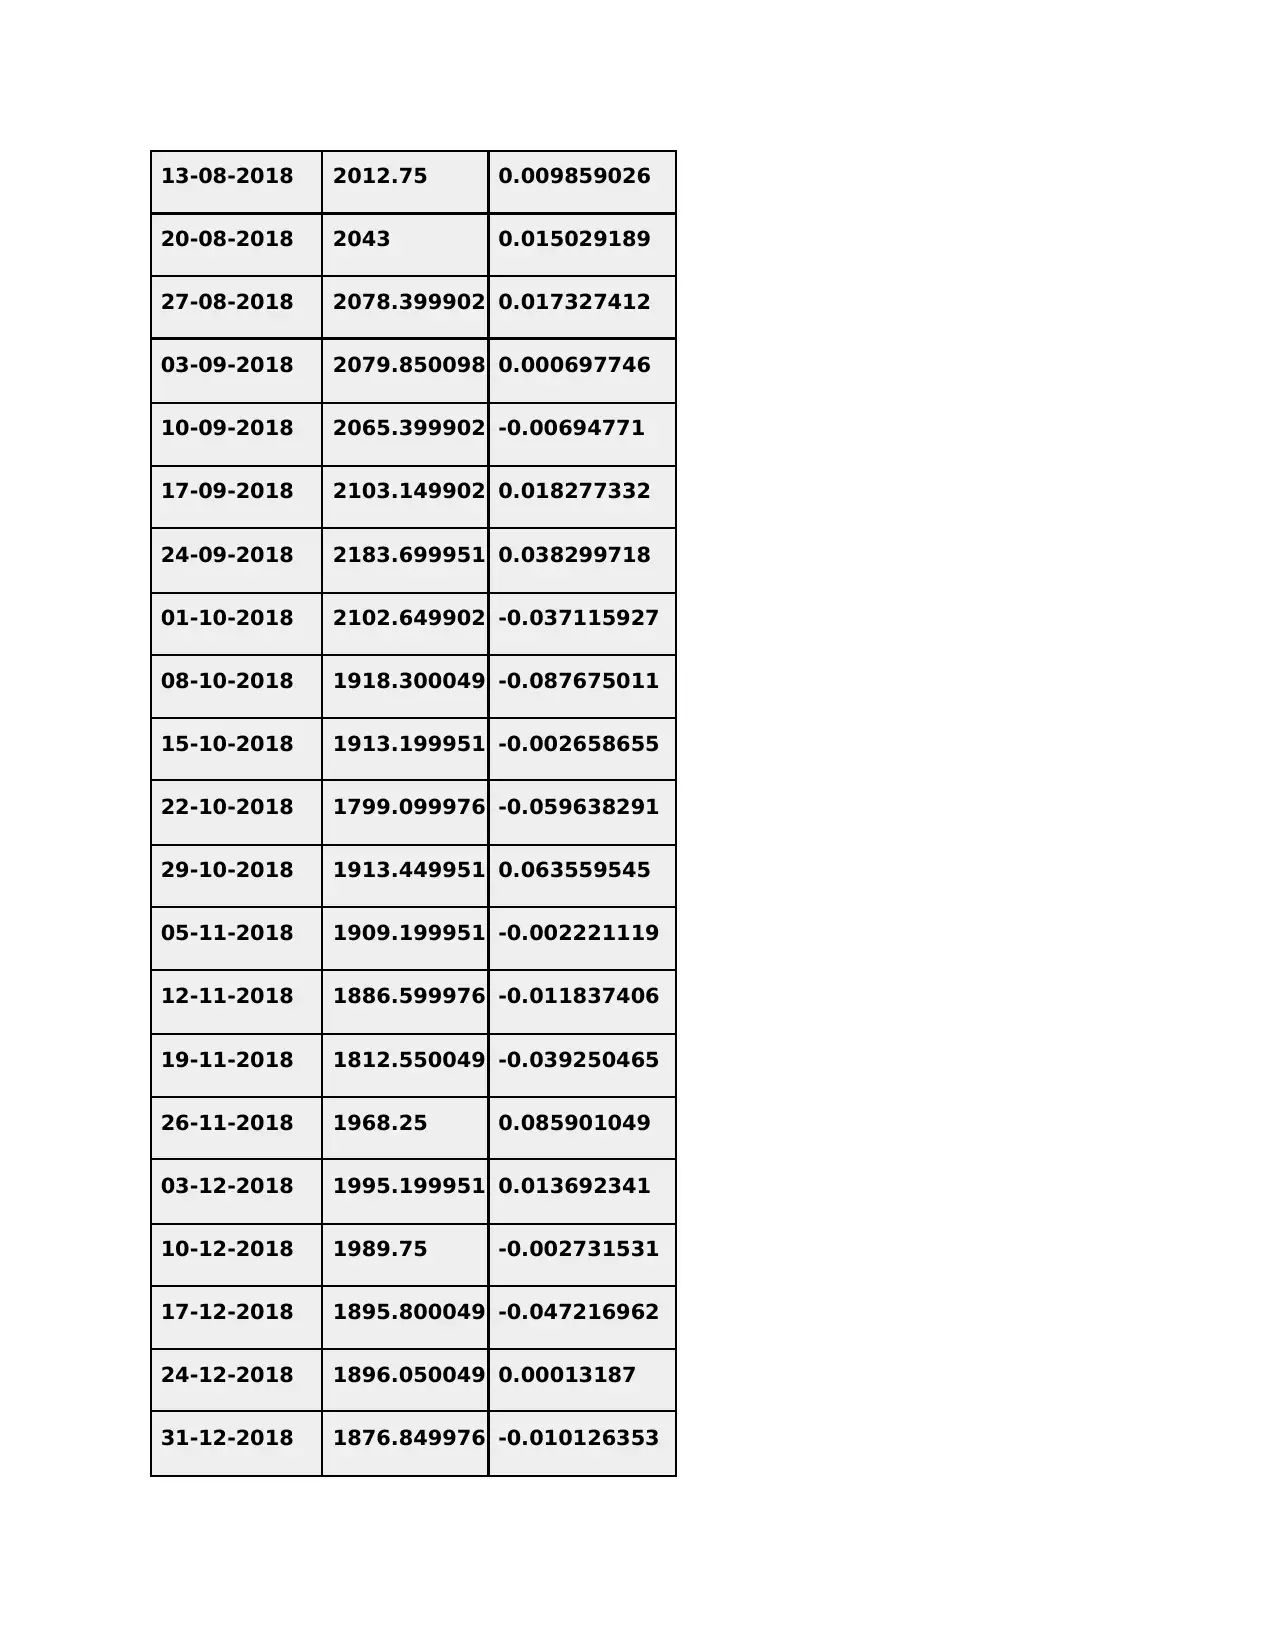
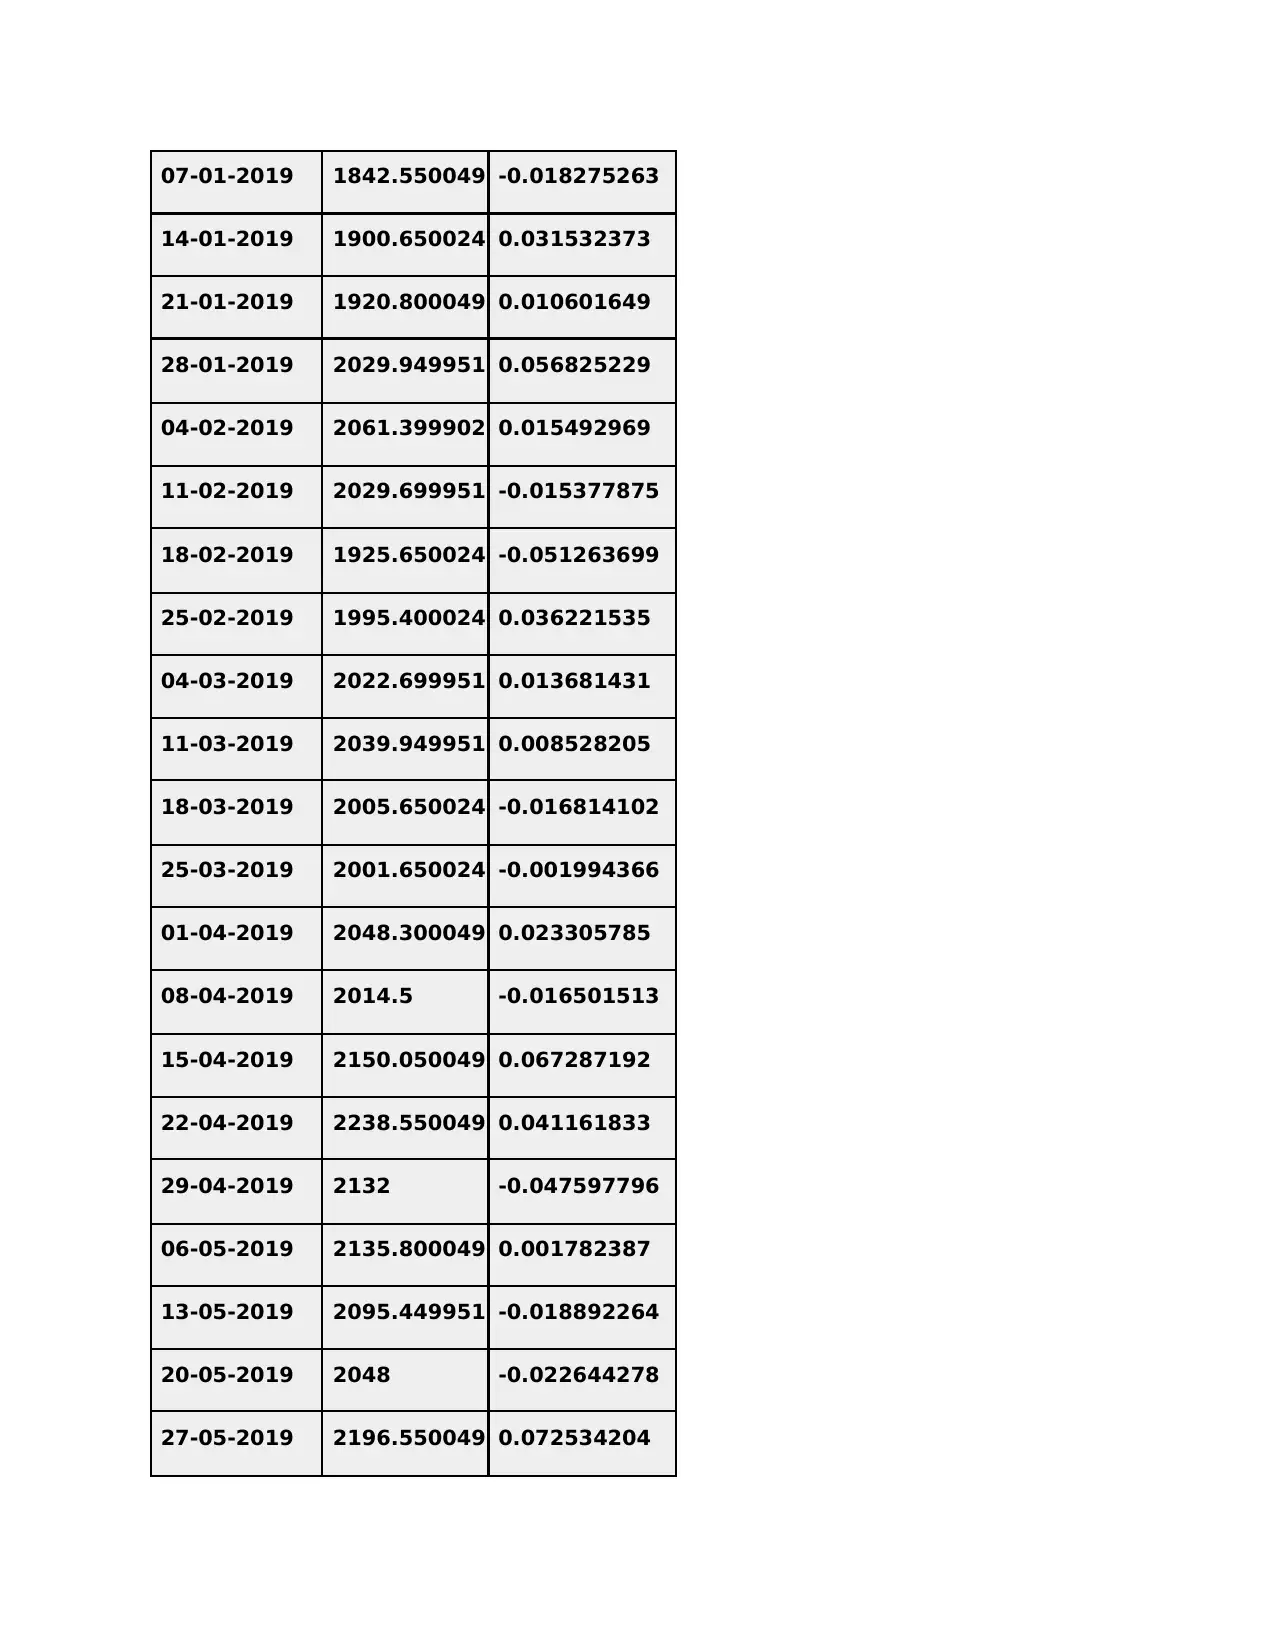
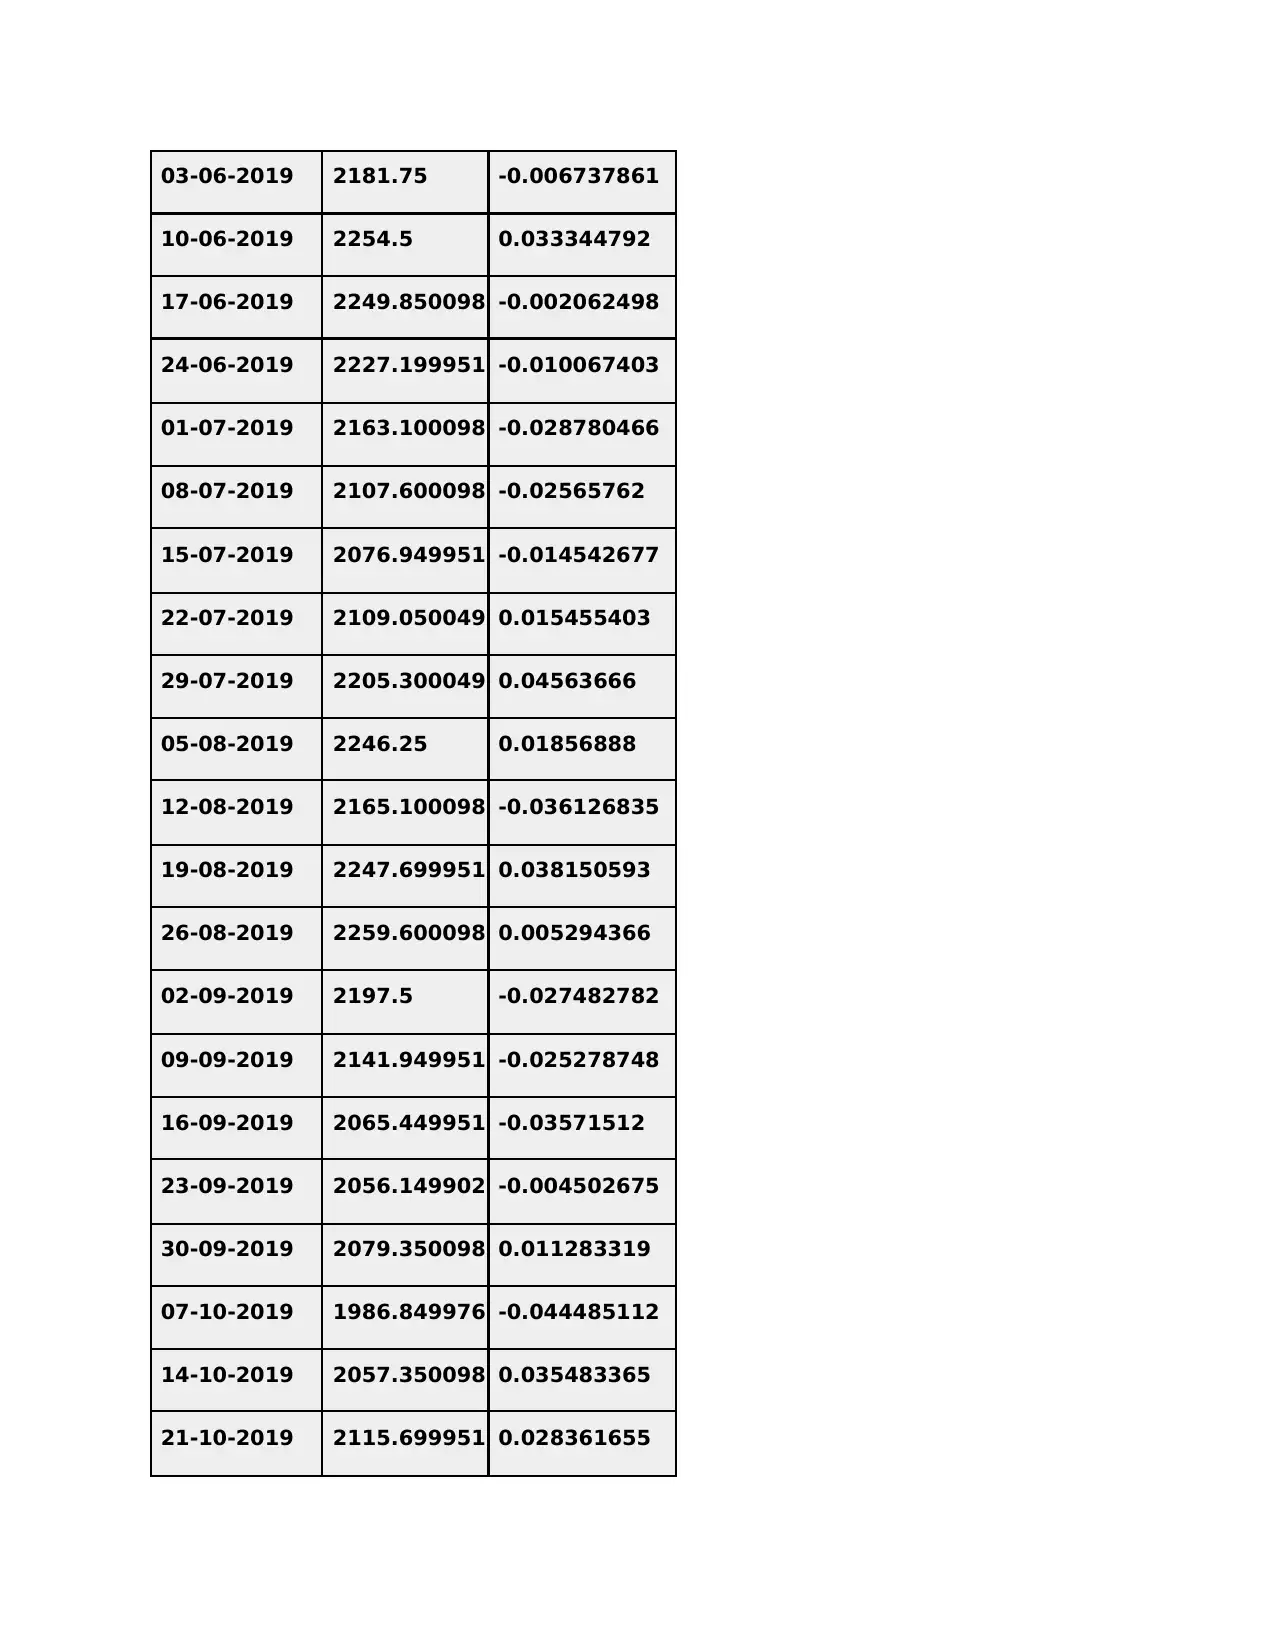
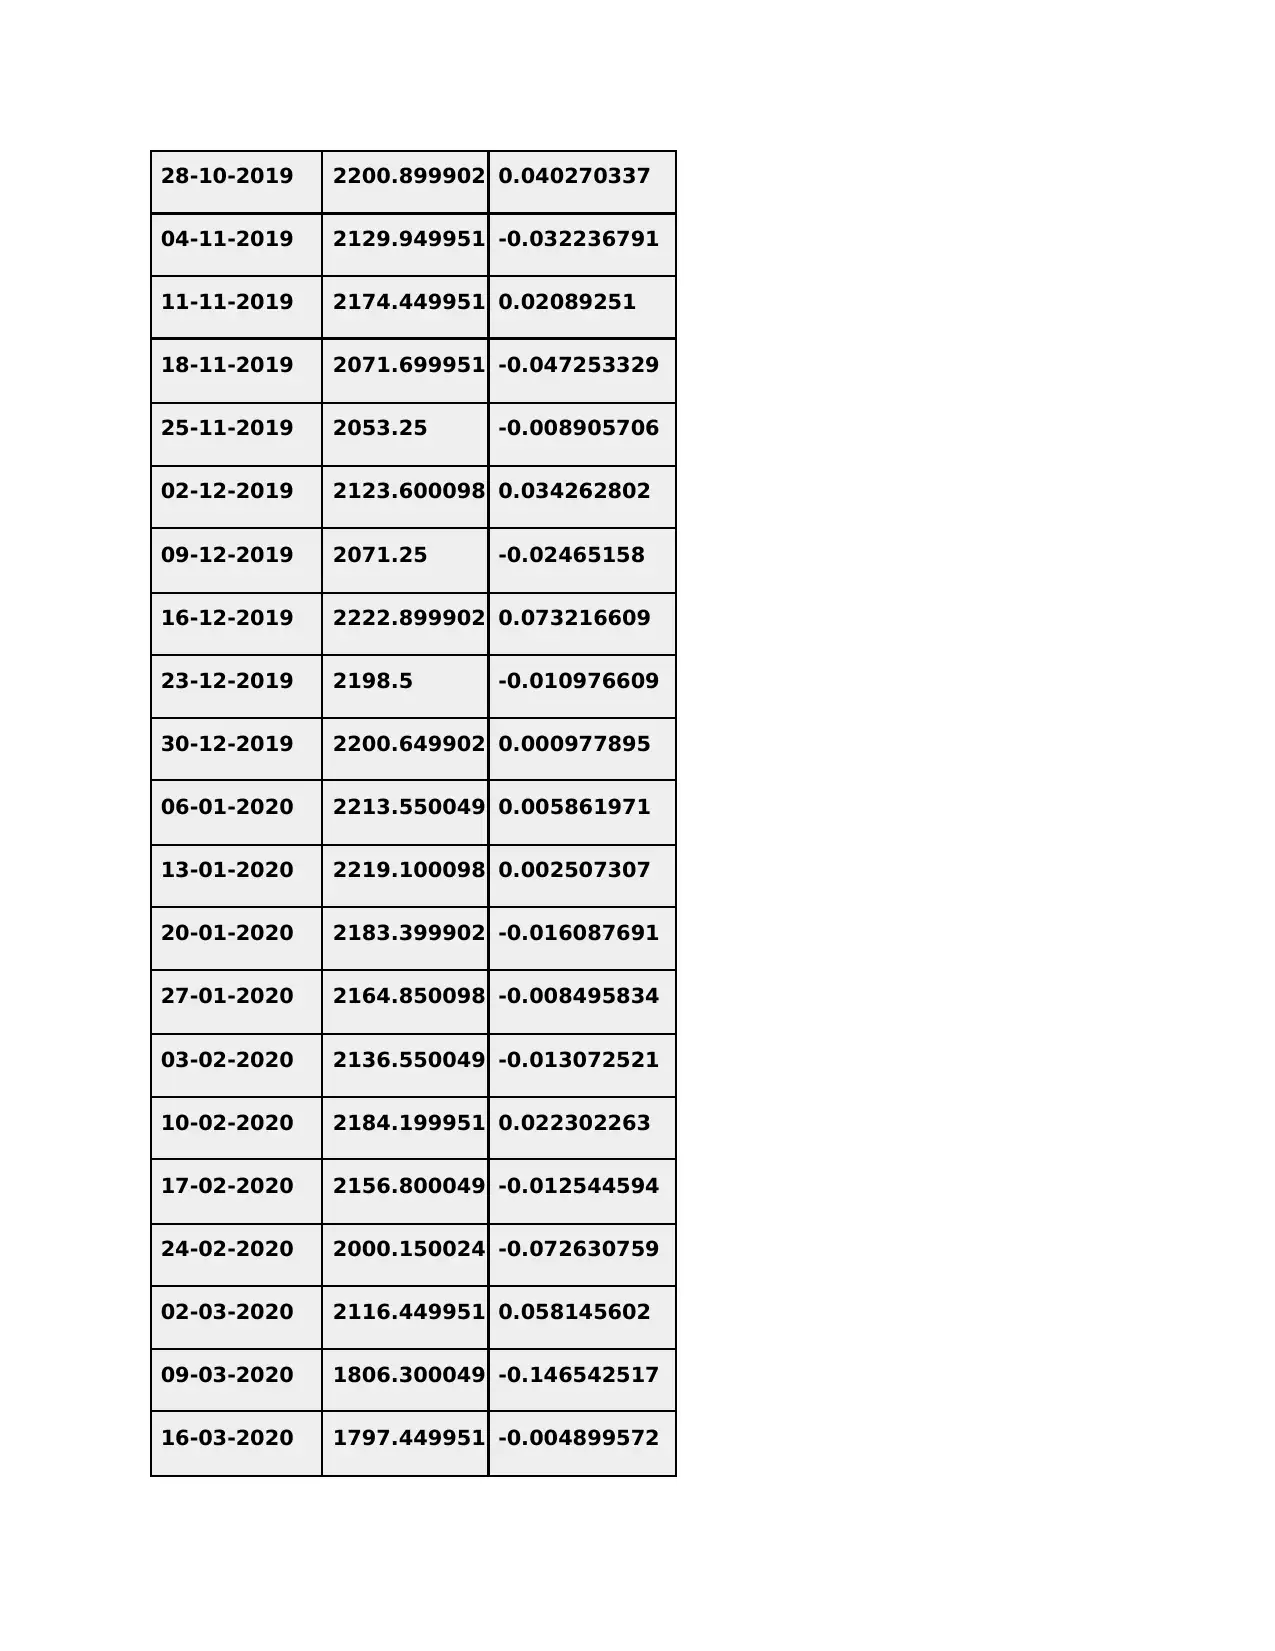
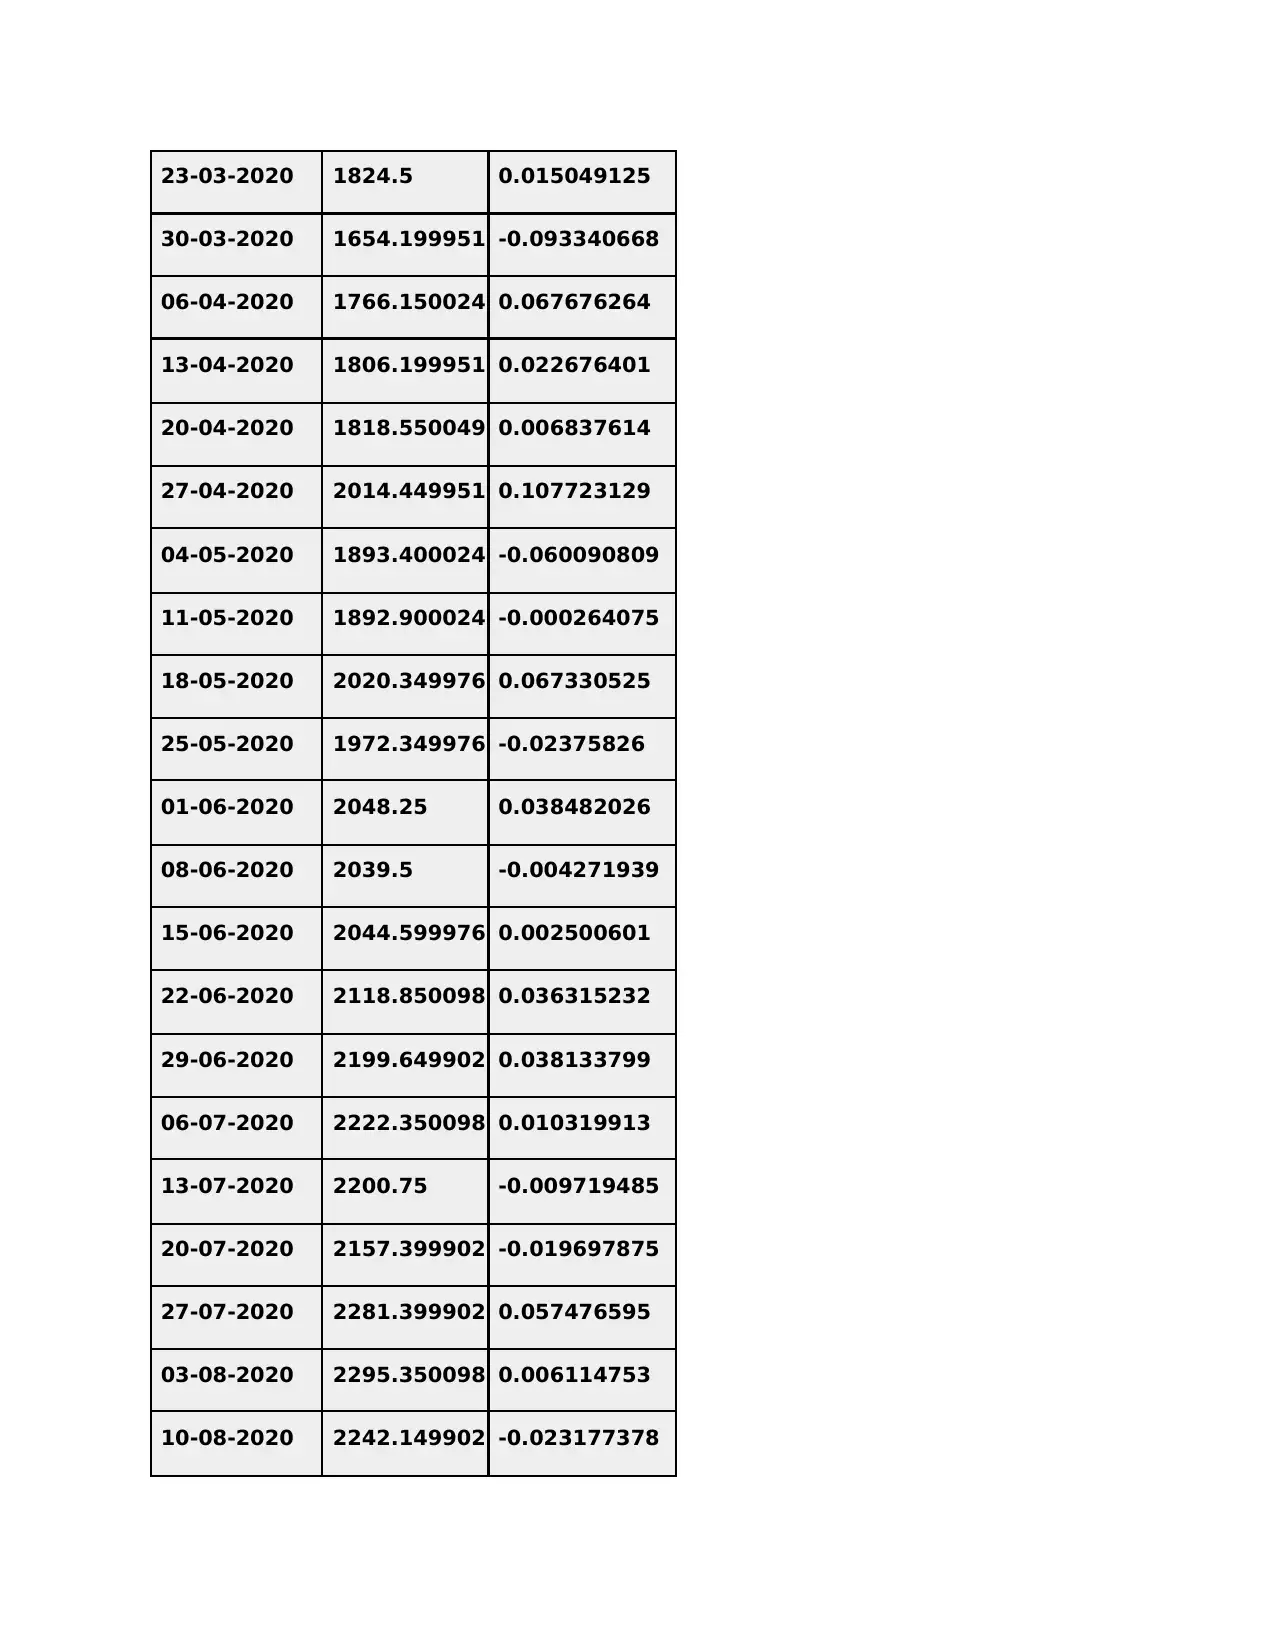
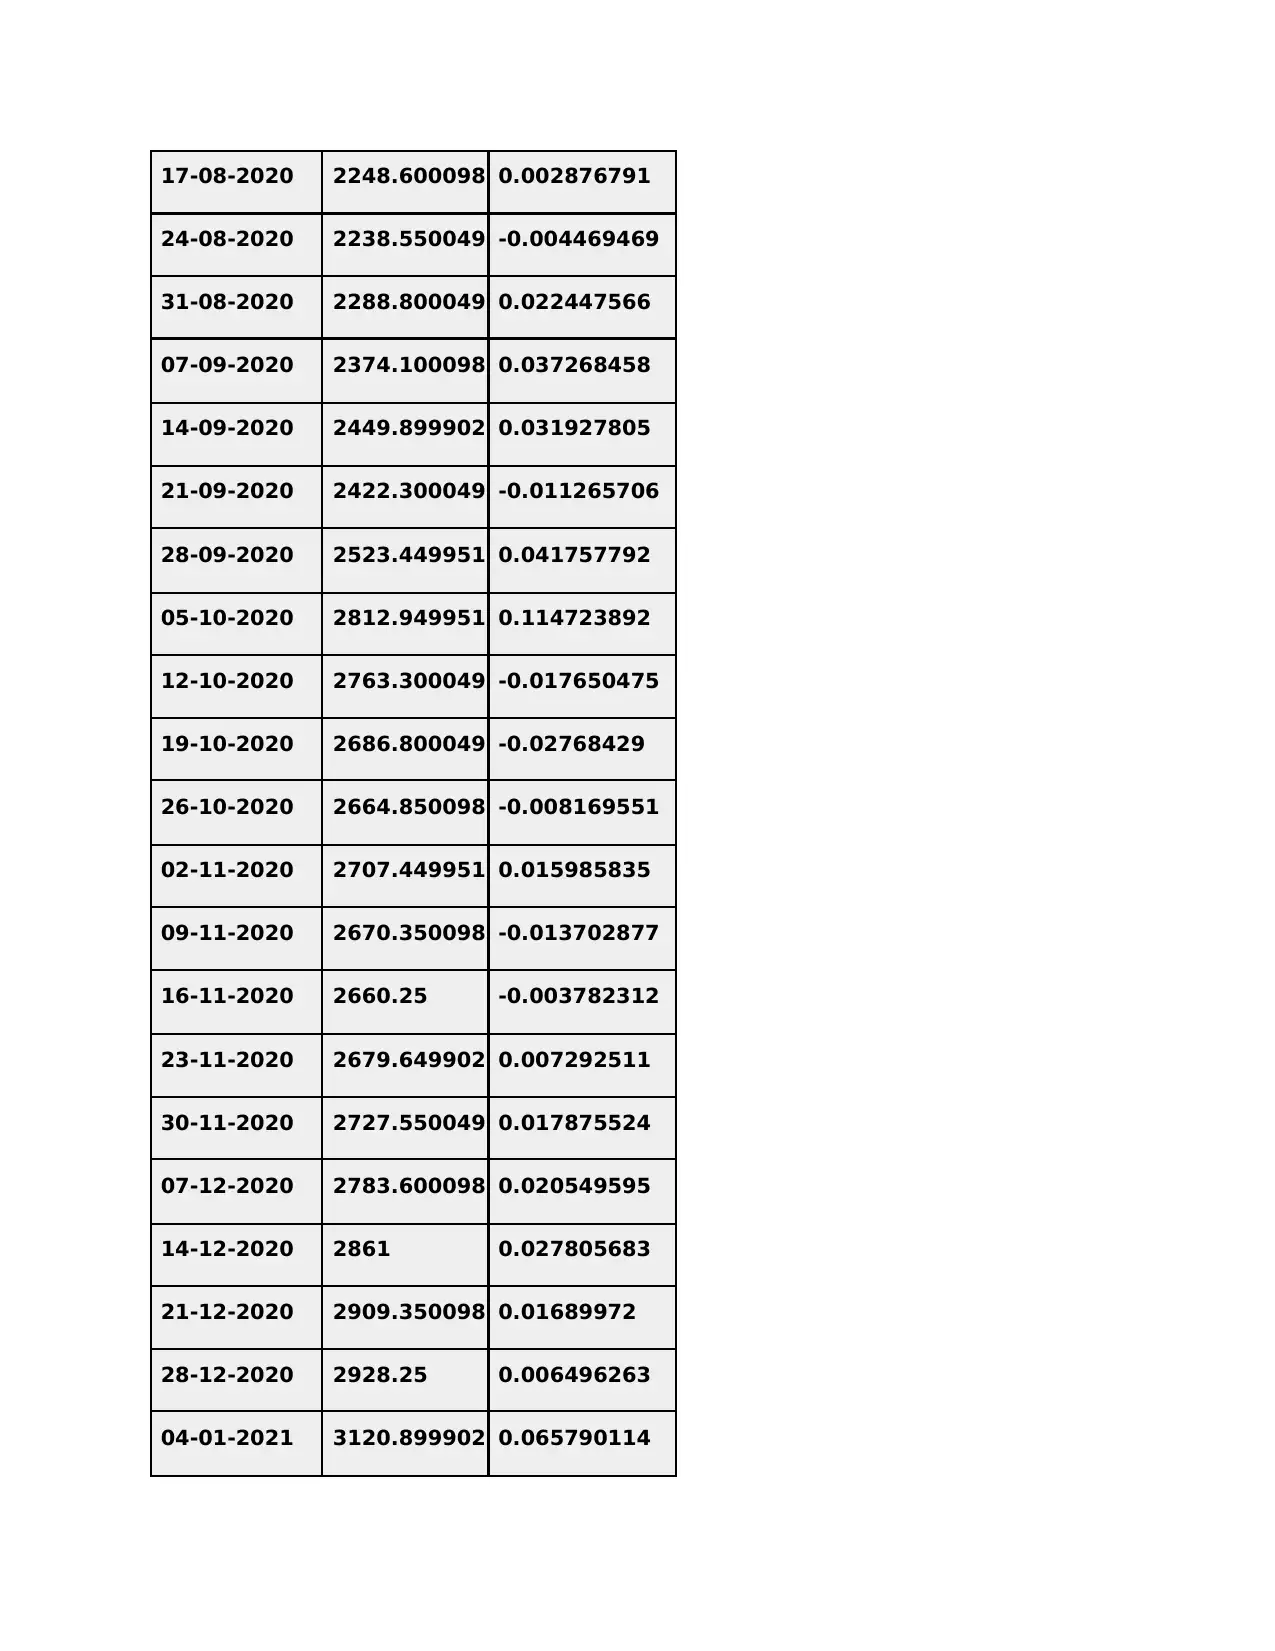
5) Look at the share price movement of both the companies stock for the last 1 year, 3
on a weekly basis and give your observations. Calculate the Beta based on 1 year, 3 ye
data.
Fig: TCS Stock Price Movement
Paraphrase This Document
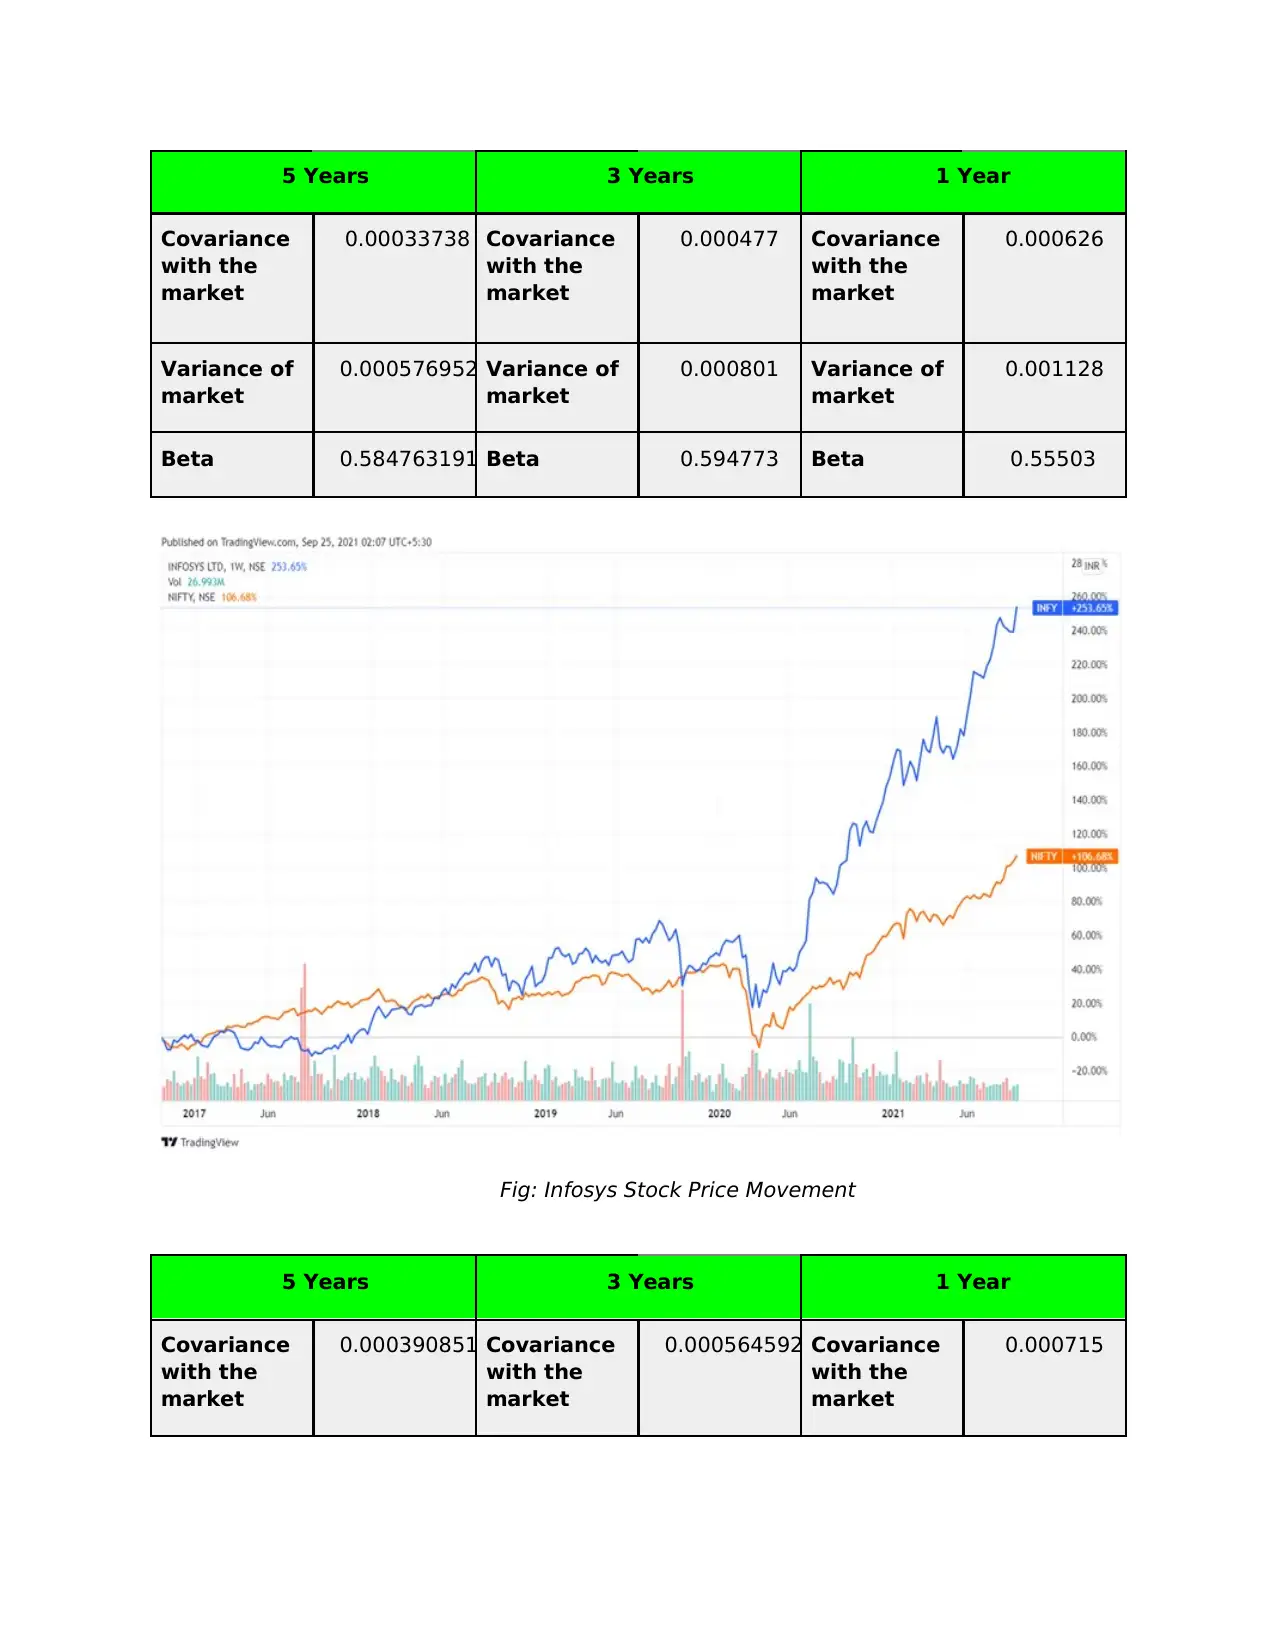
Covariance
with the
market
0.00033738 Covariance
with the
market
0.000477 Covariance
with the
market
0.000626
Variance of
market
0.000576952 Variance of
market
0.000801 Variance of
market
0.001128
Beta 0.584763191 Beta 0.594773 Beta 0.55503
Fig: Infosys Stock Price Movement
5 Years 3 Years 1 Year
Covariance
with the
market
0.000390851 Covariance
with the
market
0.000564592 Covariance
with the
market
0.000715
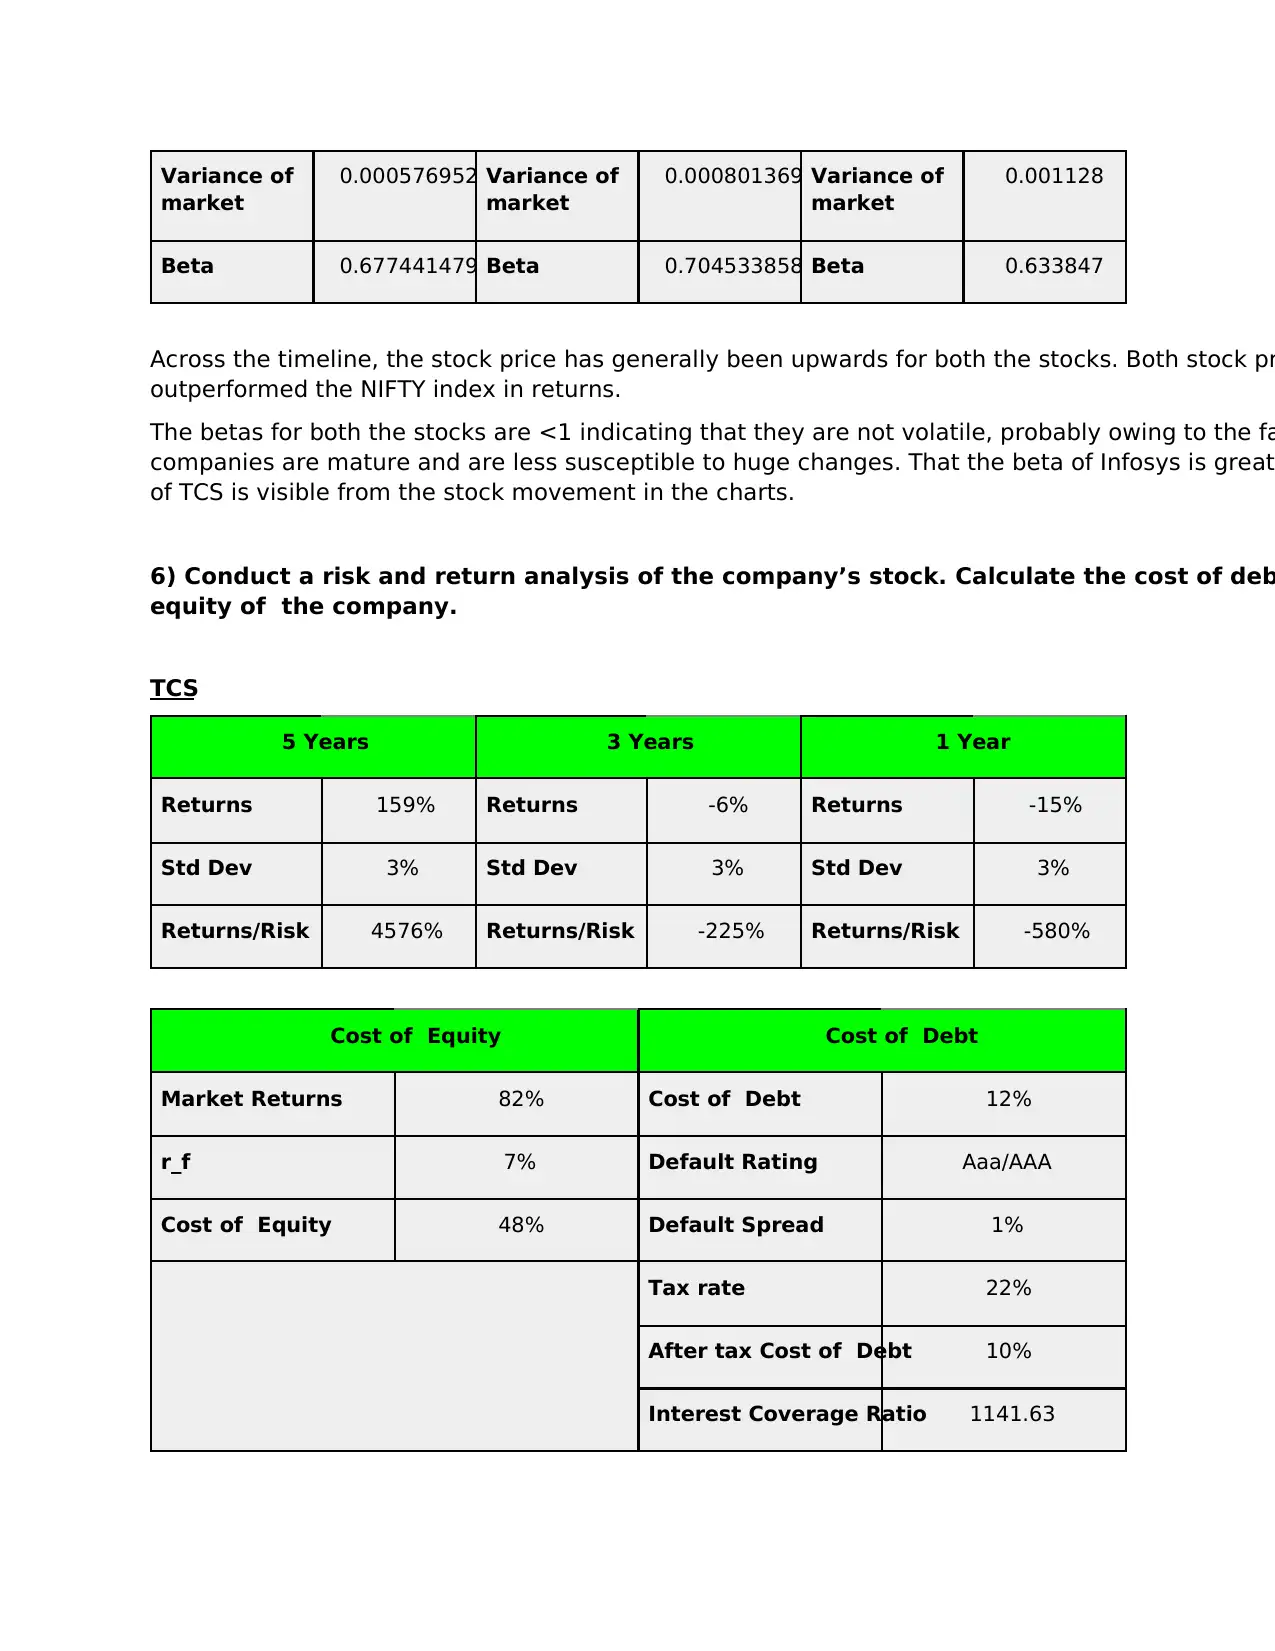
market
0.000576952 Variance of
market
0.000801369 Variance of
market
0.001128
Beta 0.677441479 Beta 0.704533858 Beta 0.633847
Across the timeline, the stock price has generally been upwards for both the stocks. Both stock pr
outperformed the NIFTY index in returns.
The betas for both the stocks are <1 indicating that they are not volatile, probably owing to the fa
companies are mature and are less susceptible to huge changes. That the beta of Infosys is greate
of TCS is visible from the stock movement in the charts.
6) Conduct a risk and return analysis of the company’s stock. Calculate the cost of deb
equity of the company.
TCS
5 Years 3 Years 1 Year
Returns 159% Returns -6% Returns -15%
Std Dev 3% Std Dev 3% Std Dev 3%
Returns/Risk 4576% Returns/Risk -225% Returns/Risk -580%
Cost of Equity Cost of Debt
Market Returns 82% Cost of Debt 12%
r_f 7% Default Rating Aaa/AAA
Cost of Equity 48% Default Spread 1%
Tax rate 22%
After tax Cost of Debt 10%
Interest Coverage Ratio 1141.63
You're viewing a preview
Unlock full access by subscribing today!
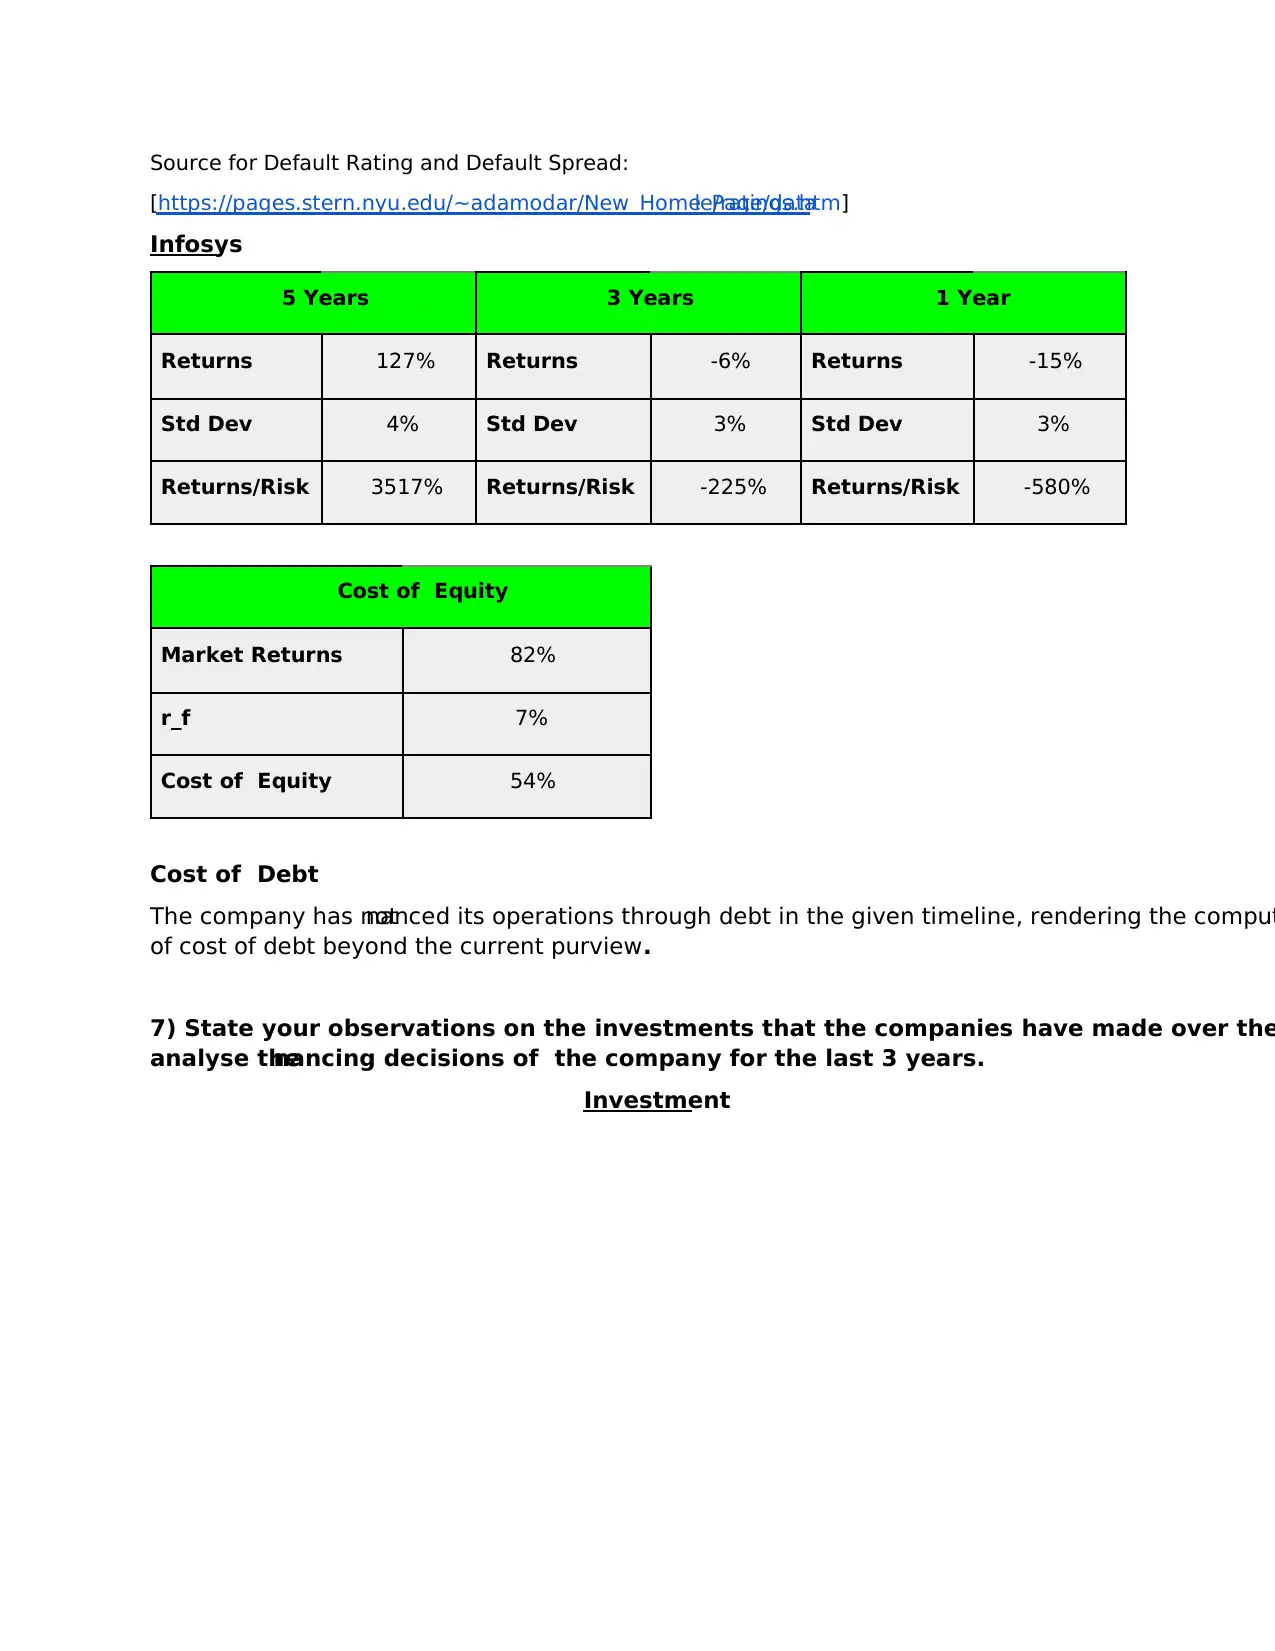
[https://pages.stern.nyu.edu/~adamodar/New_Home_Page/datale/ratings.htm]
Infosys
5 Years 3 Years 1 Year
Returns 127% Returns -6% Returns -15%
Std Dev 4% Std Dev 3% Std Dev 3%
Returns/Risk 3517% Returns/Risk -225% Returns/Risk -580%
Cost of Equity
Market Returns 82%
r_f 7%
Cost of Equity 54%
Cost of Debt
The company has notnanced its operations through debt in the given timeline, rendering the comput
of cost of debt beyond the current purview.
7) State your observations on the investments that the companies have made over the
analyse thenancing decisions of the company for the last 3 years.
Investment
Paraphrase This Document
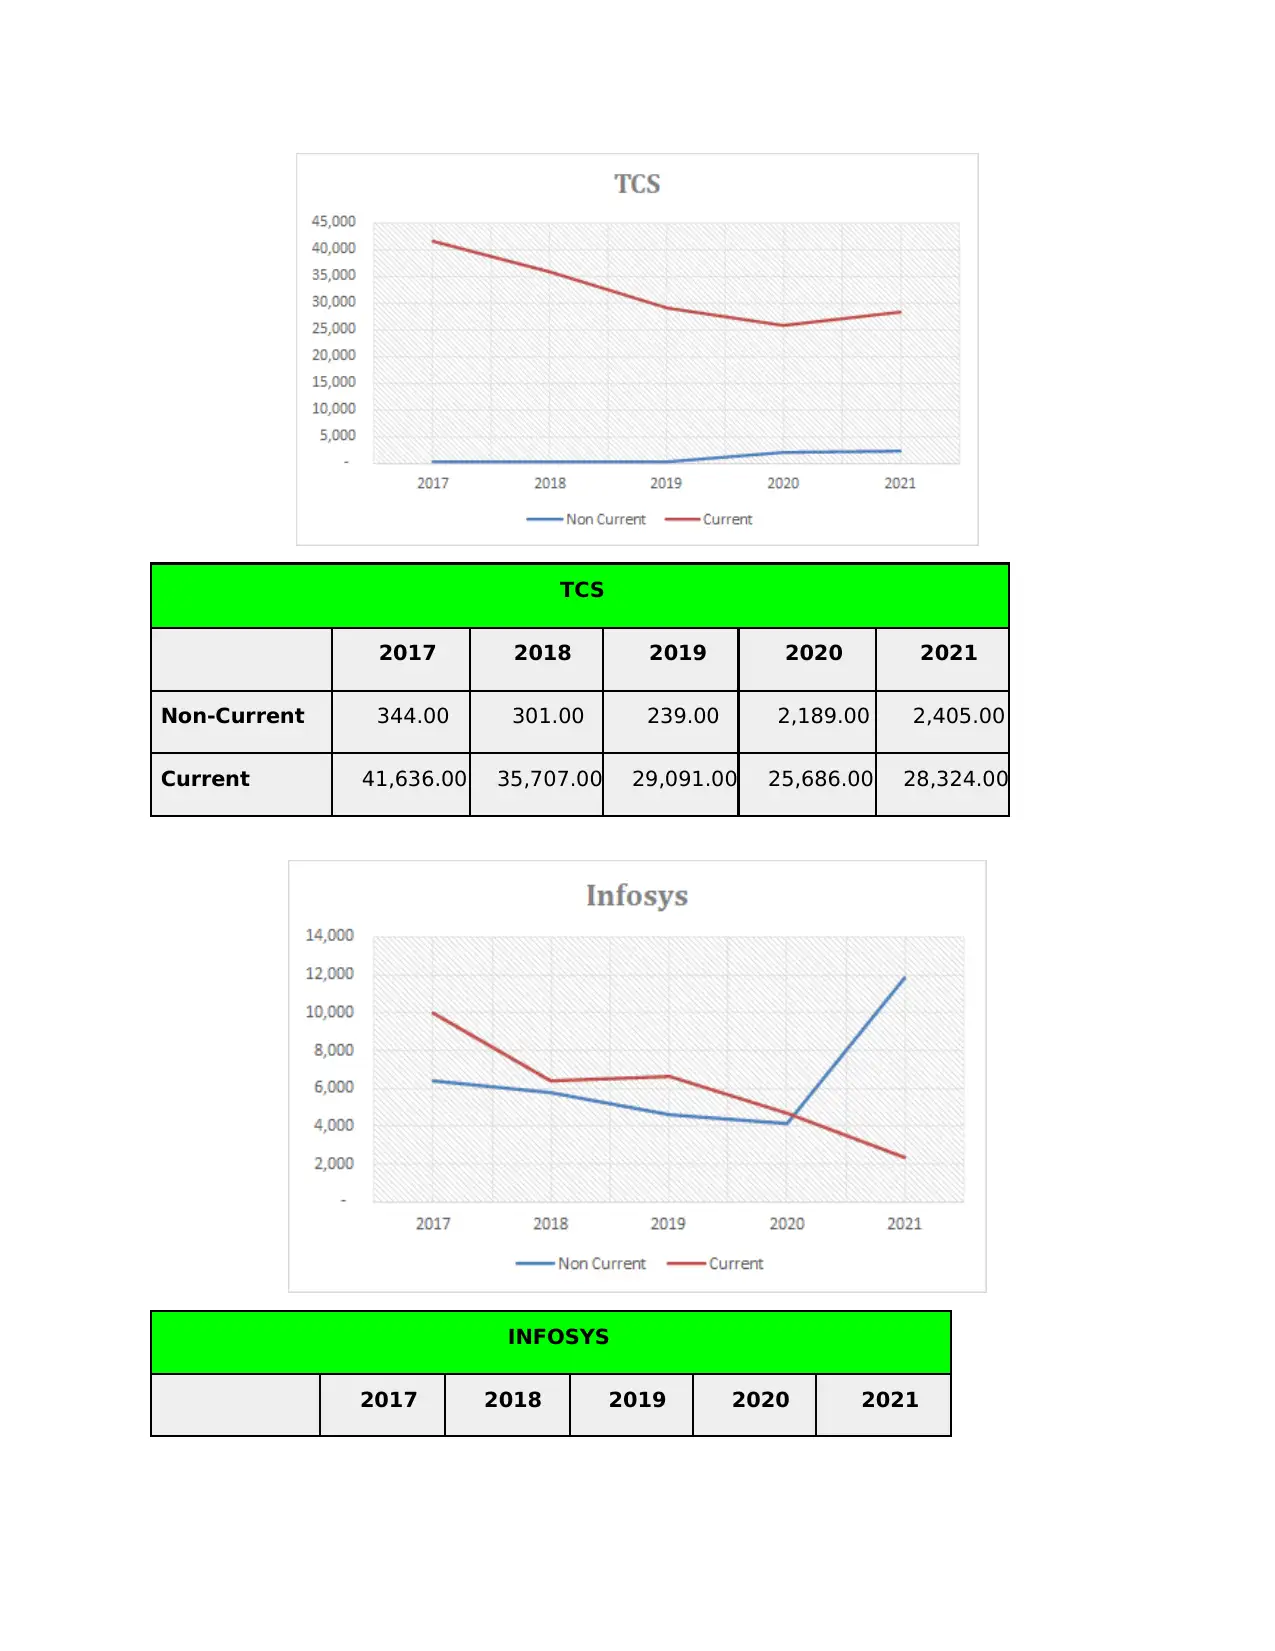
2017 2018 2019 2020 2021
Non-Current 344.00 301.00 239.00 2,189.00 2,405.00
Current 41,636.00 35,707.00 29,091.00 25,686.00 28,324.00
INFOSYS
2017 2018 2019 2020 2021
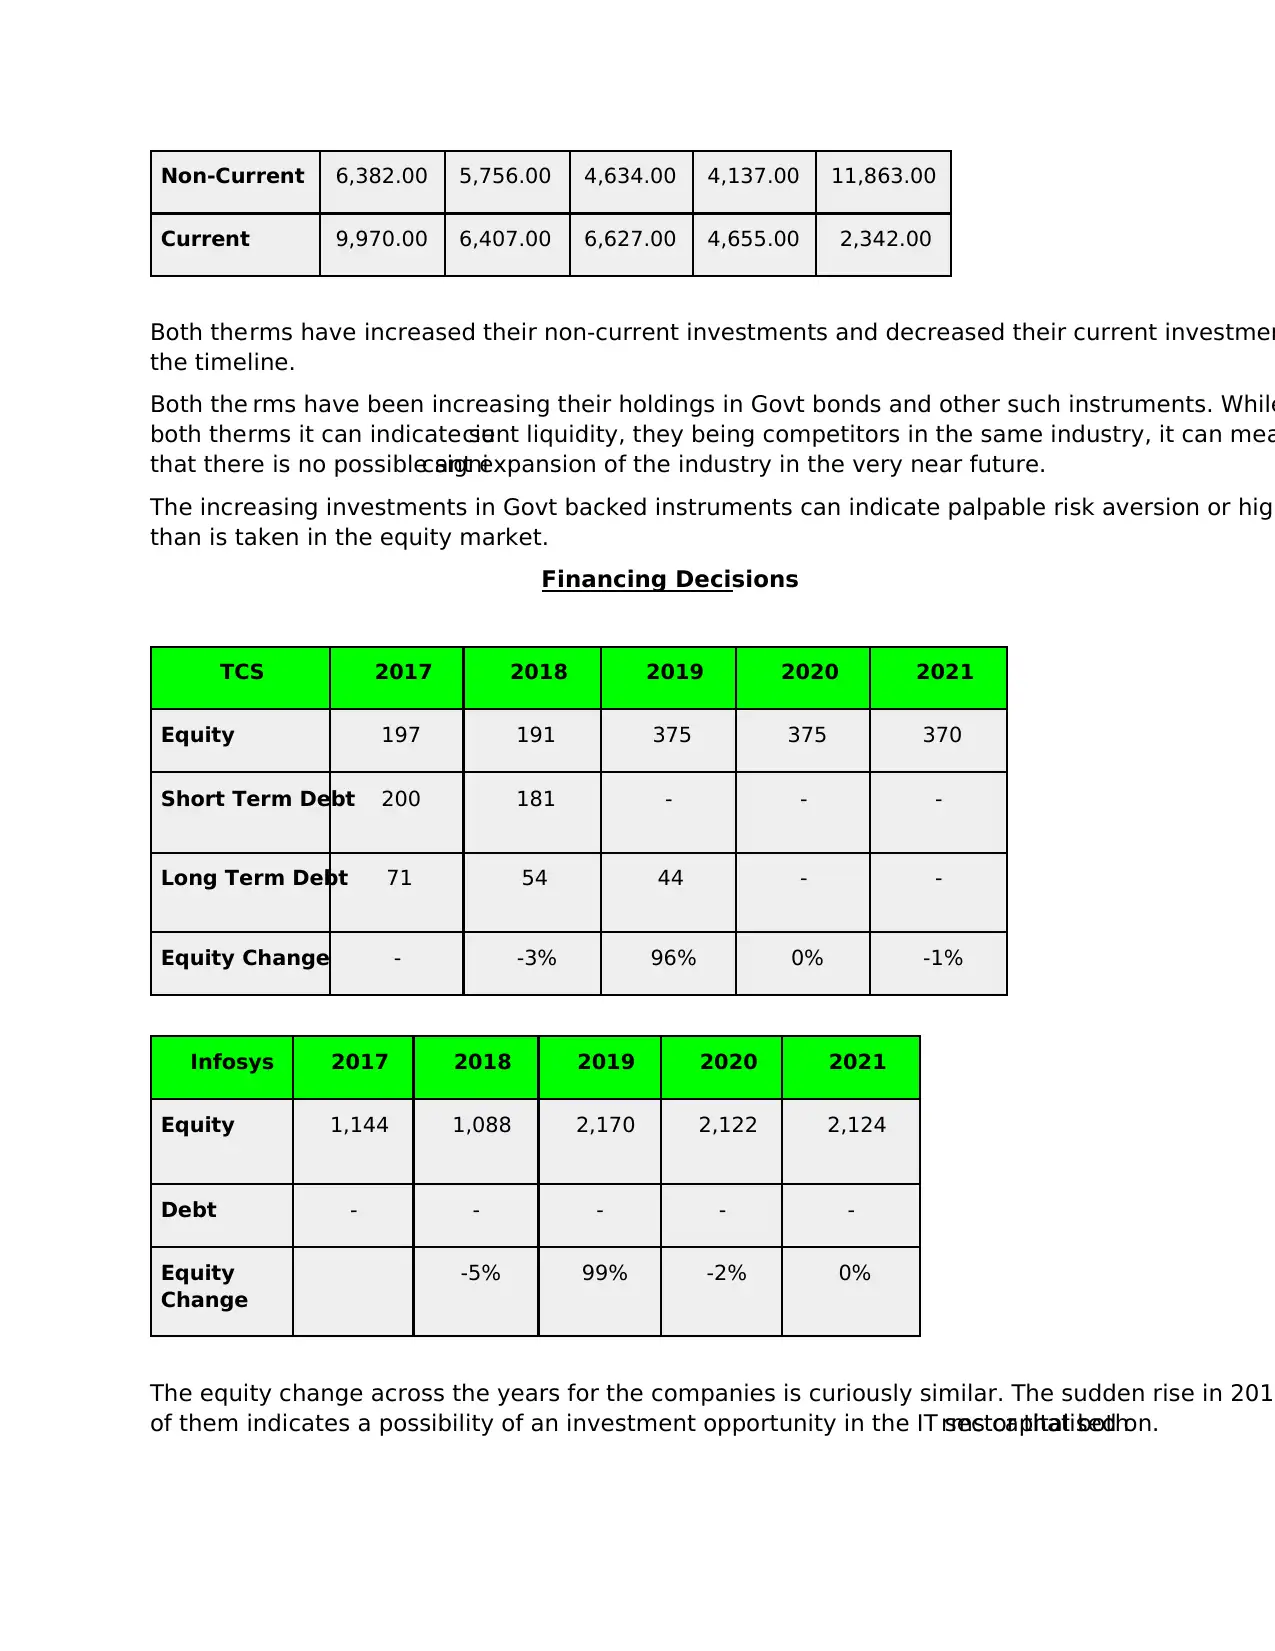
Current 9,970.00 6,407.00 6,627.00 4,655.00 2,342.00
Both therms have increased their non-current investments and decreased their current investmen
the timeline.
Both the rms have been increasing their holdings in Govt bonds and other such instruments. While
both therms it can indicate sucient liquidity, they being competitors in the same industry, it can mea
that there is no possible signicant expansion of the industry in the very near future.
The increasing investments in Govt backed instruments can indicate palpable risk aversion or high
than is taken in the equity market.
Financing Decisions
TCS 2017 2018 2019 2020 2021
Equity 197 191 375 375 370
Short Term Debt 200 181 - - -
Long Term Debt 71 54 44 - -
Equity Change - -3% 96% 0% -1%
Infosys 2017 2018 2019 2020 2021
Equity 1,144 1,088 2,170 2,122 2,124
Debt - - - - -
Equity
Change
-5% 99% -2% 0%
The equity change across the years for the companies is curiously similar. The sudden rise in 2019
of them indicates a possibility of an investment opportunity in the IT sector that bothrms capitalised on.
You're viewing a preview
Unlock full access by subscribing today!
rms are enjoying cheaper equity than debt.
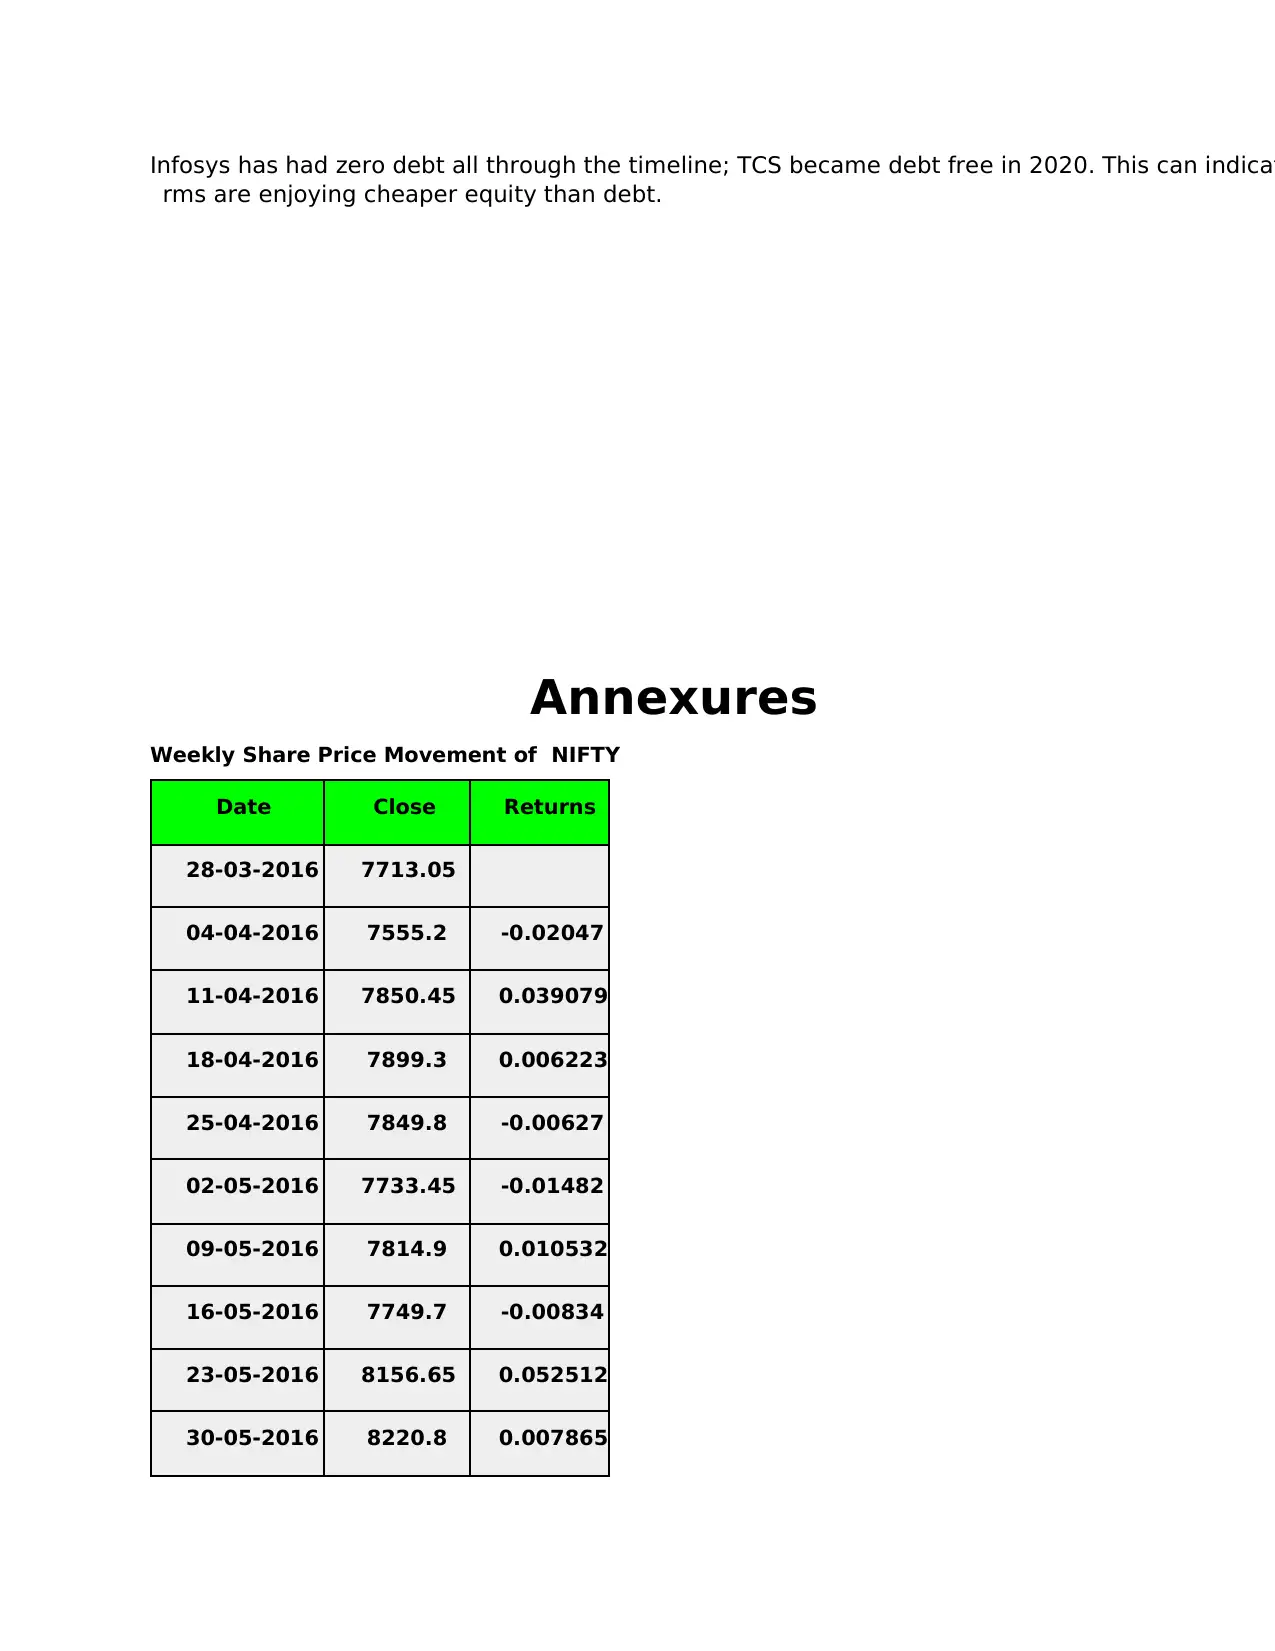
Annexures
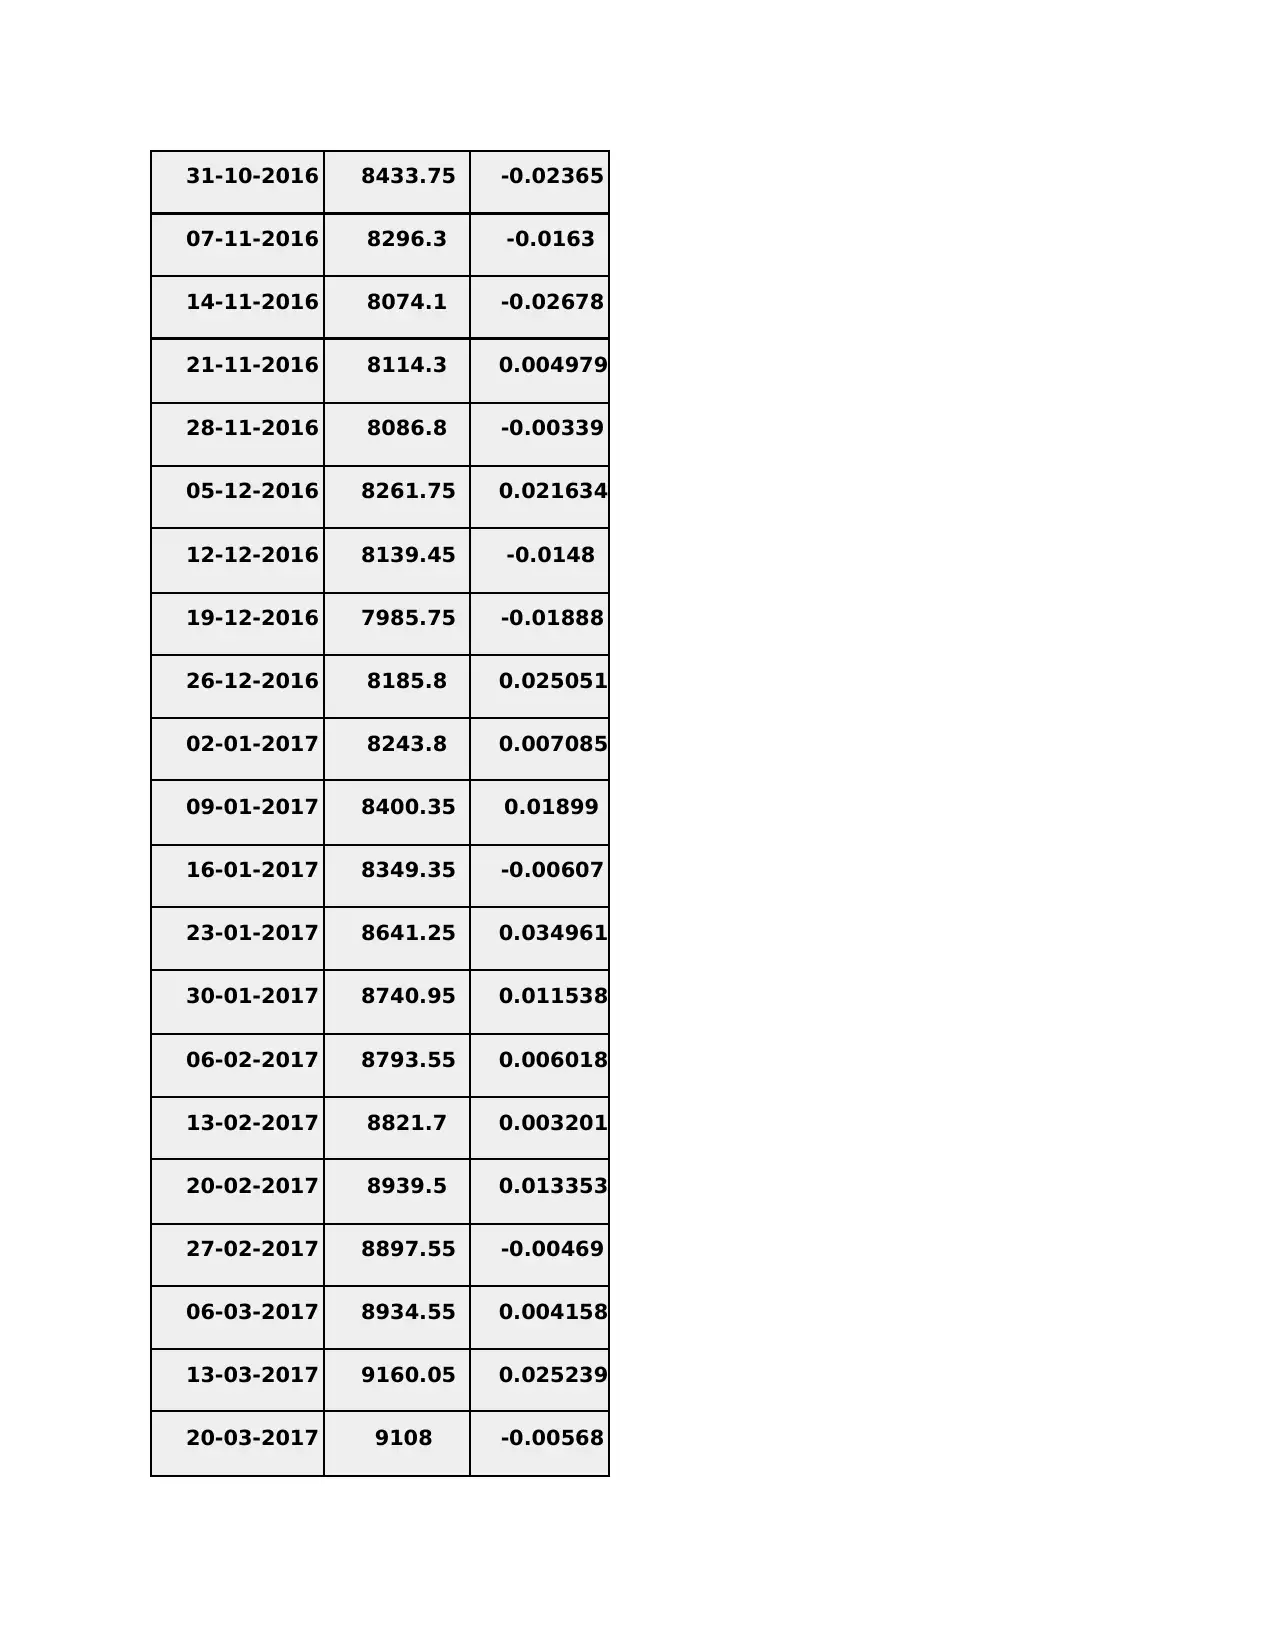
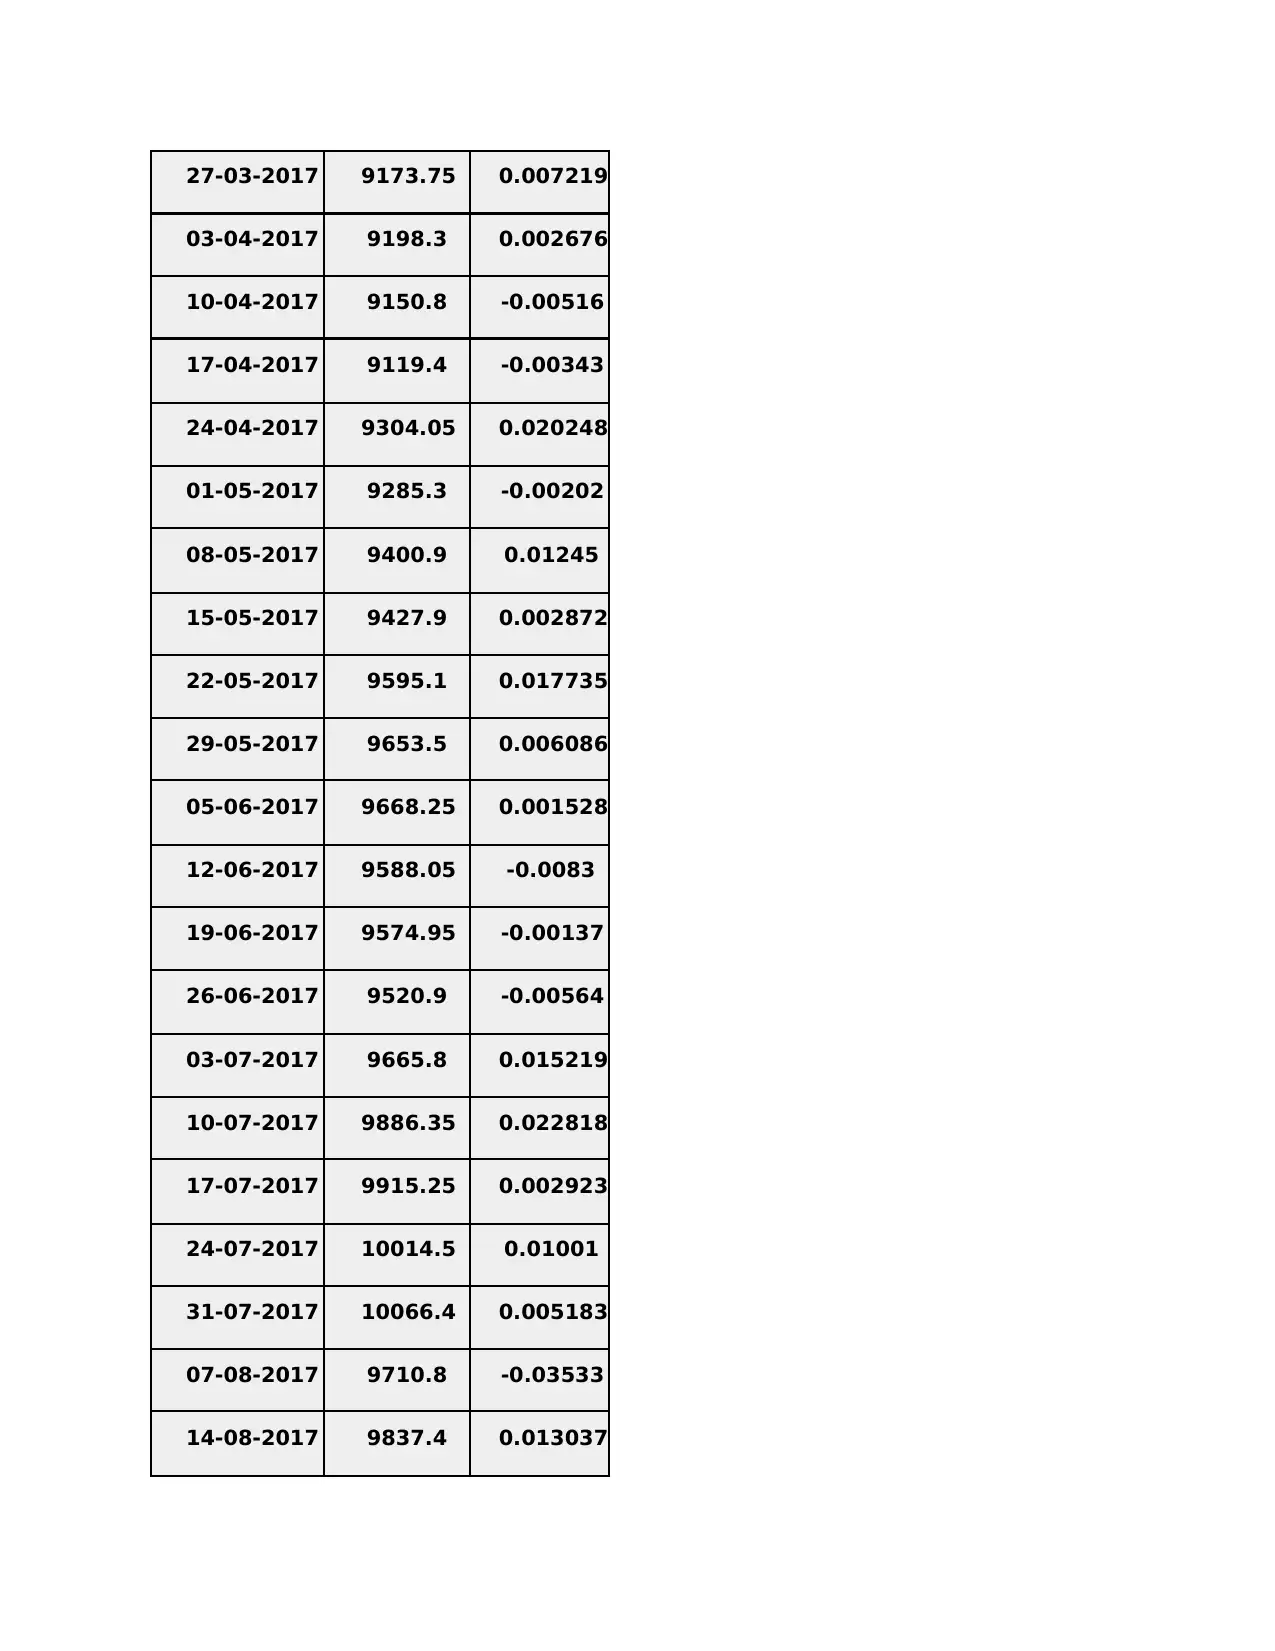
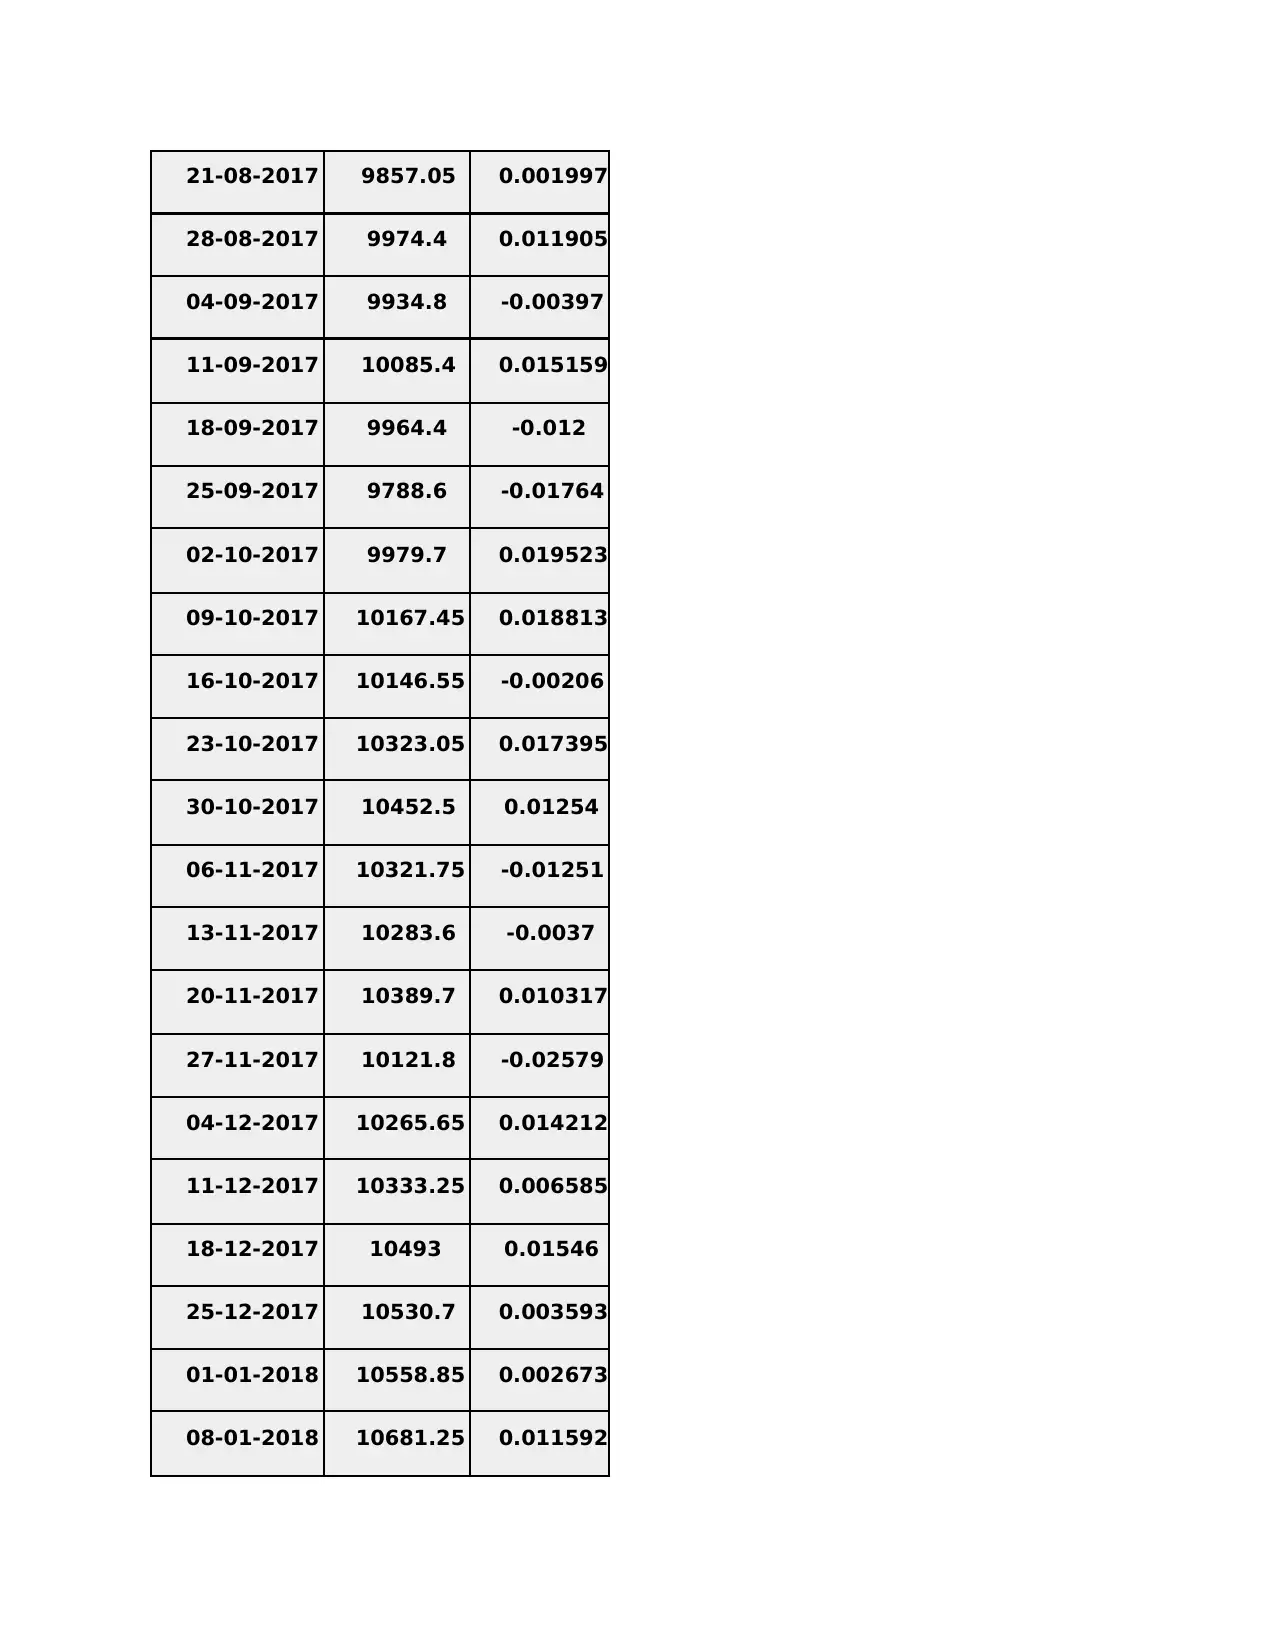
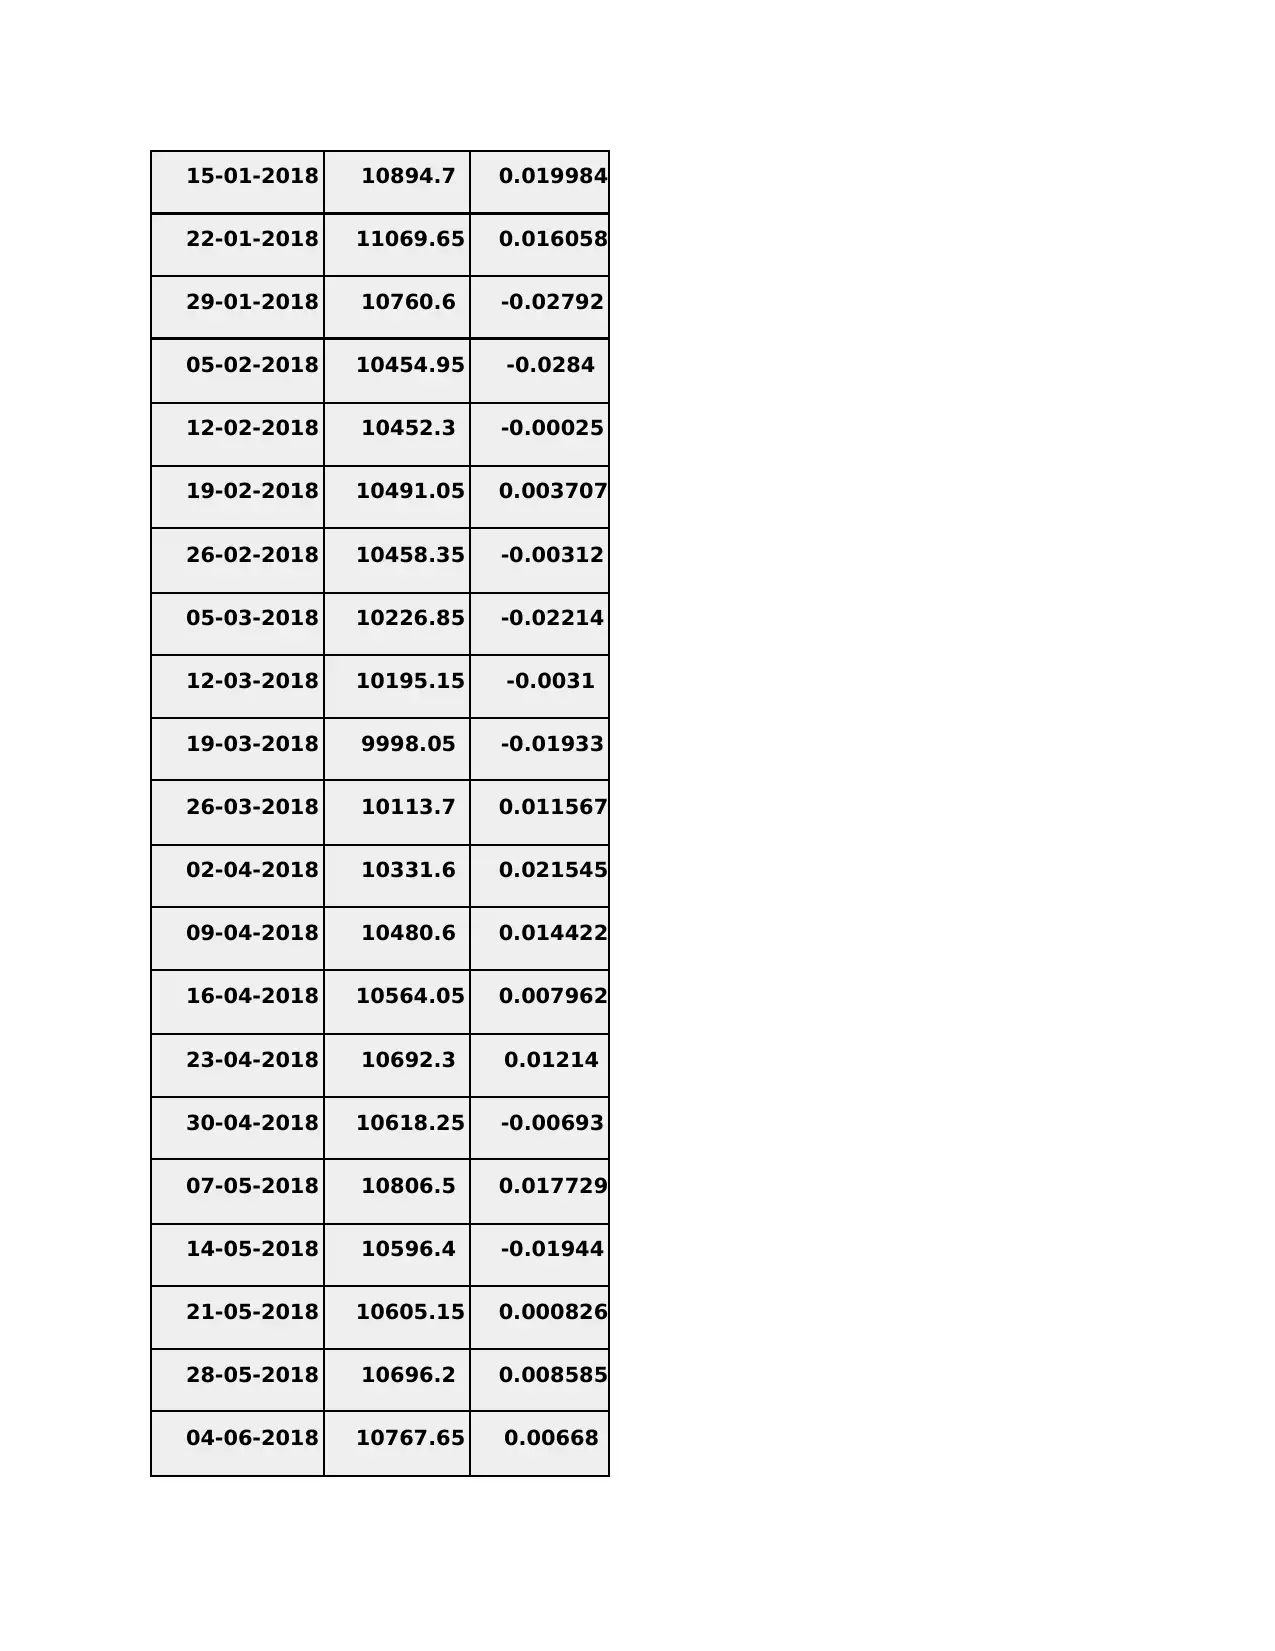
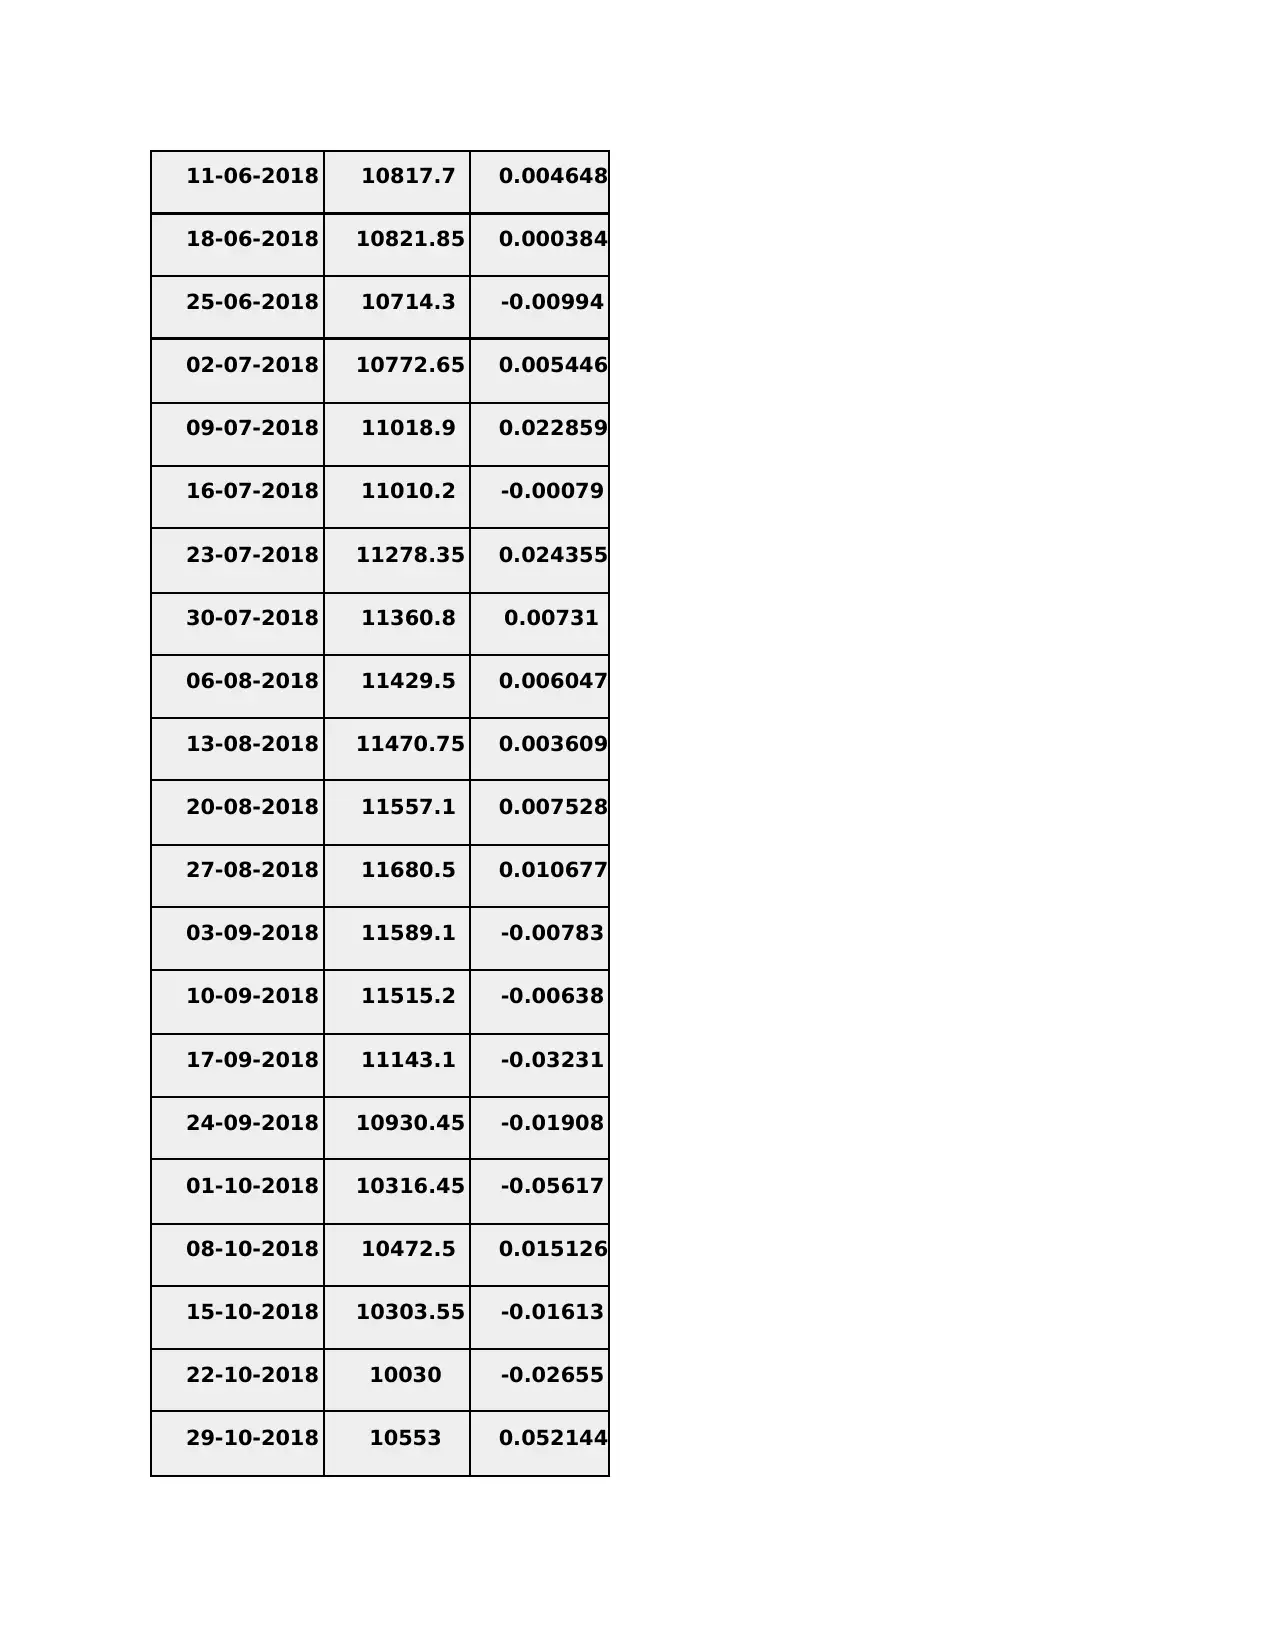
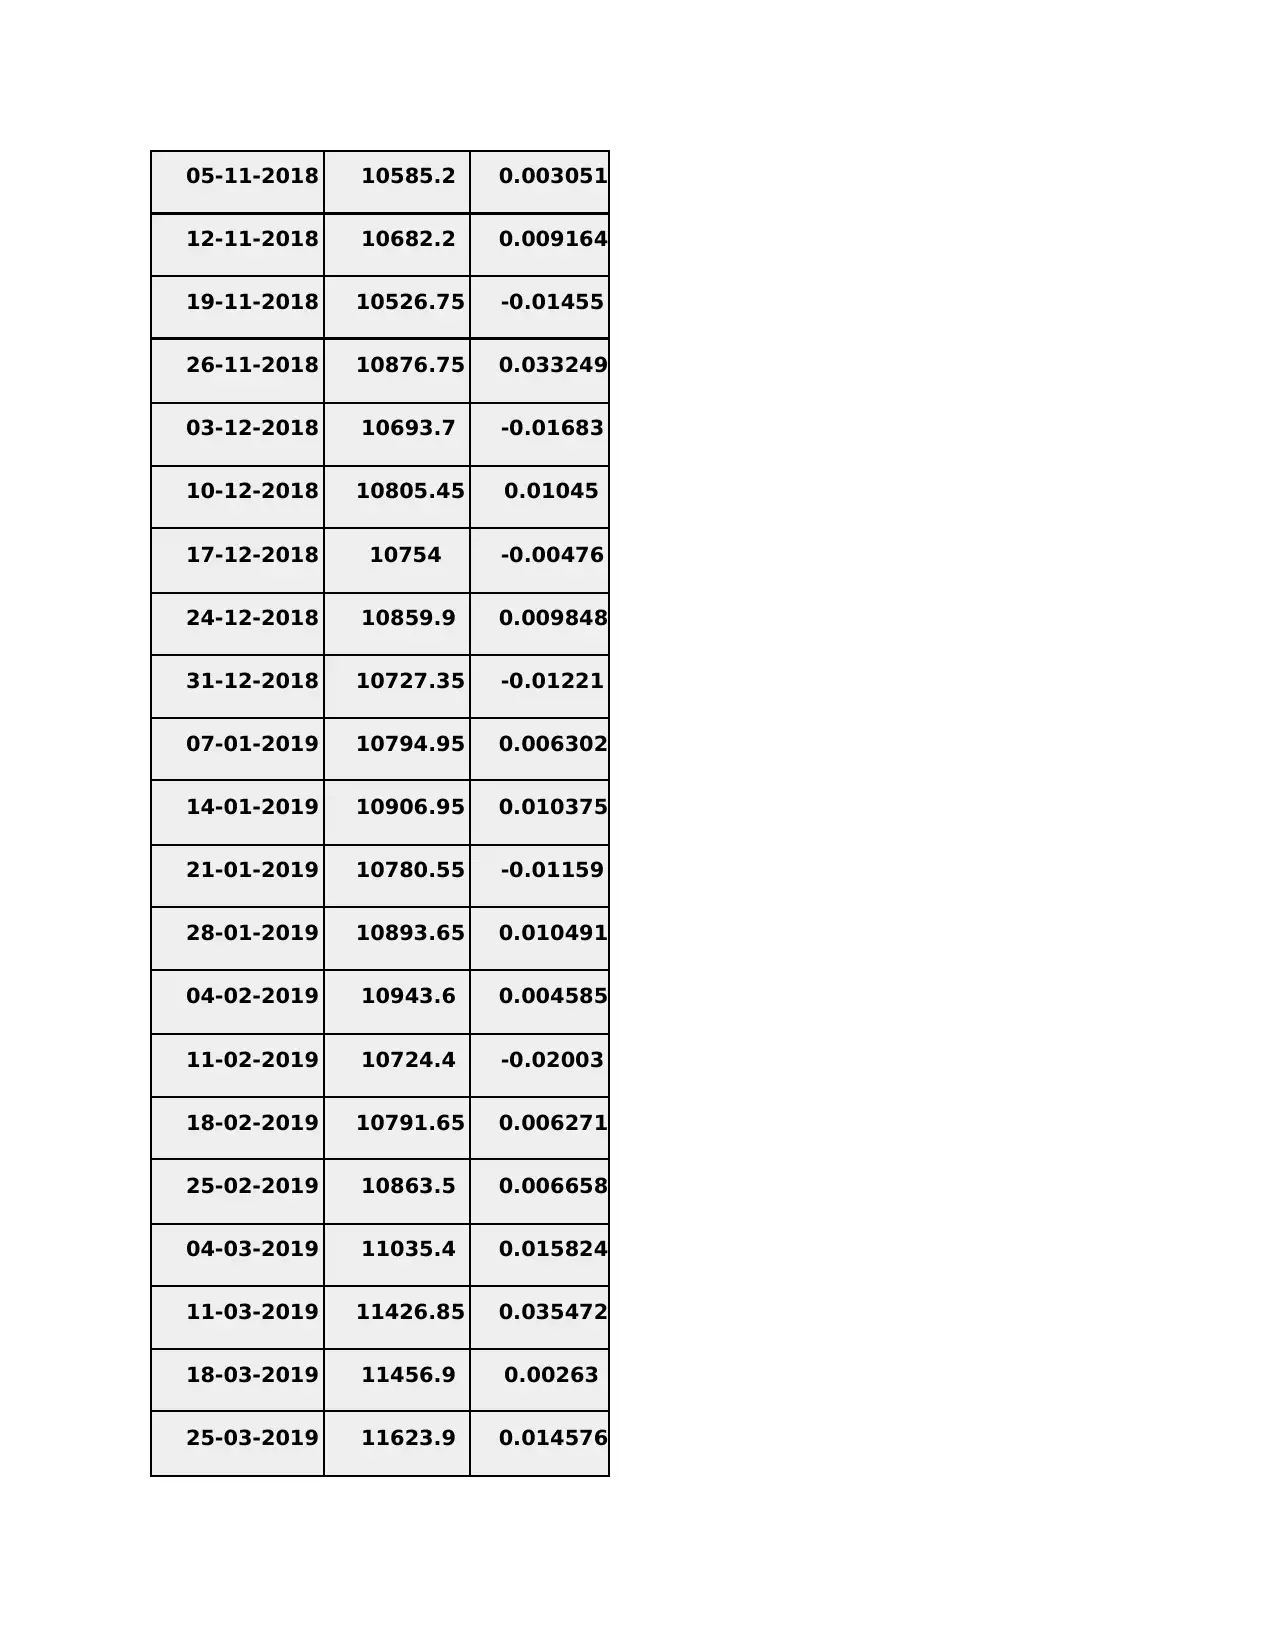
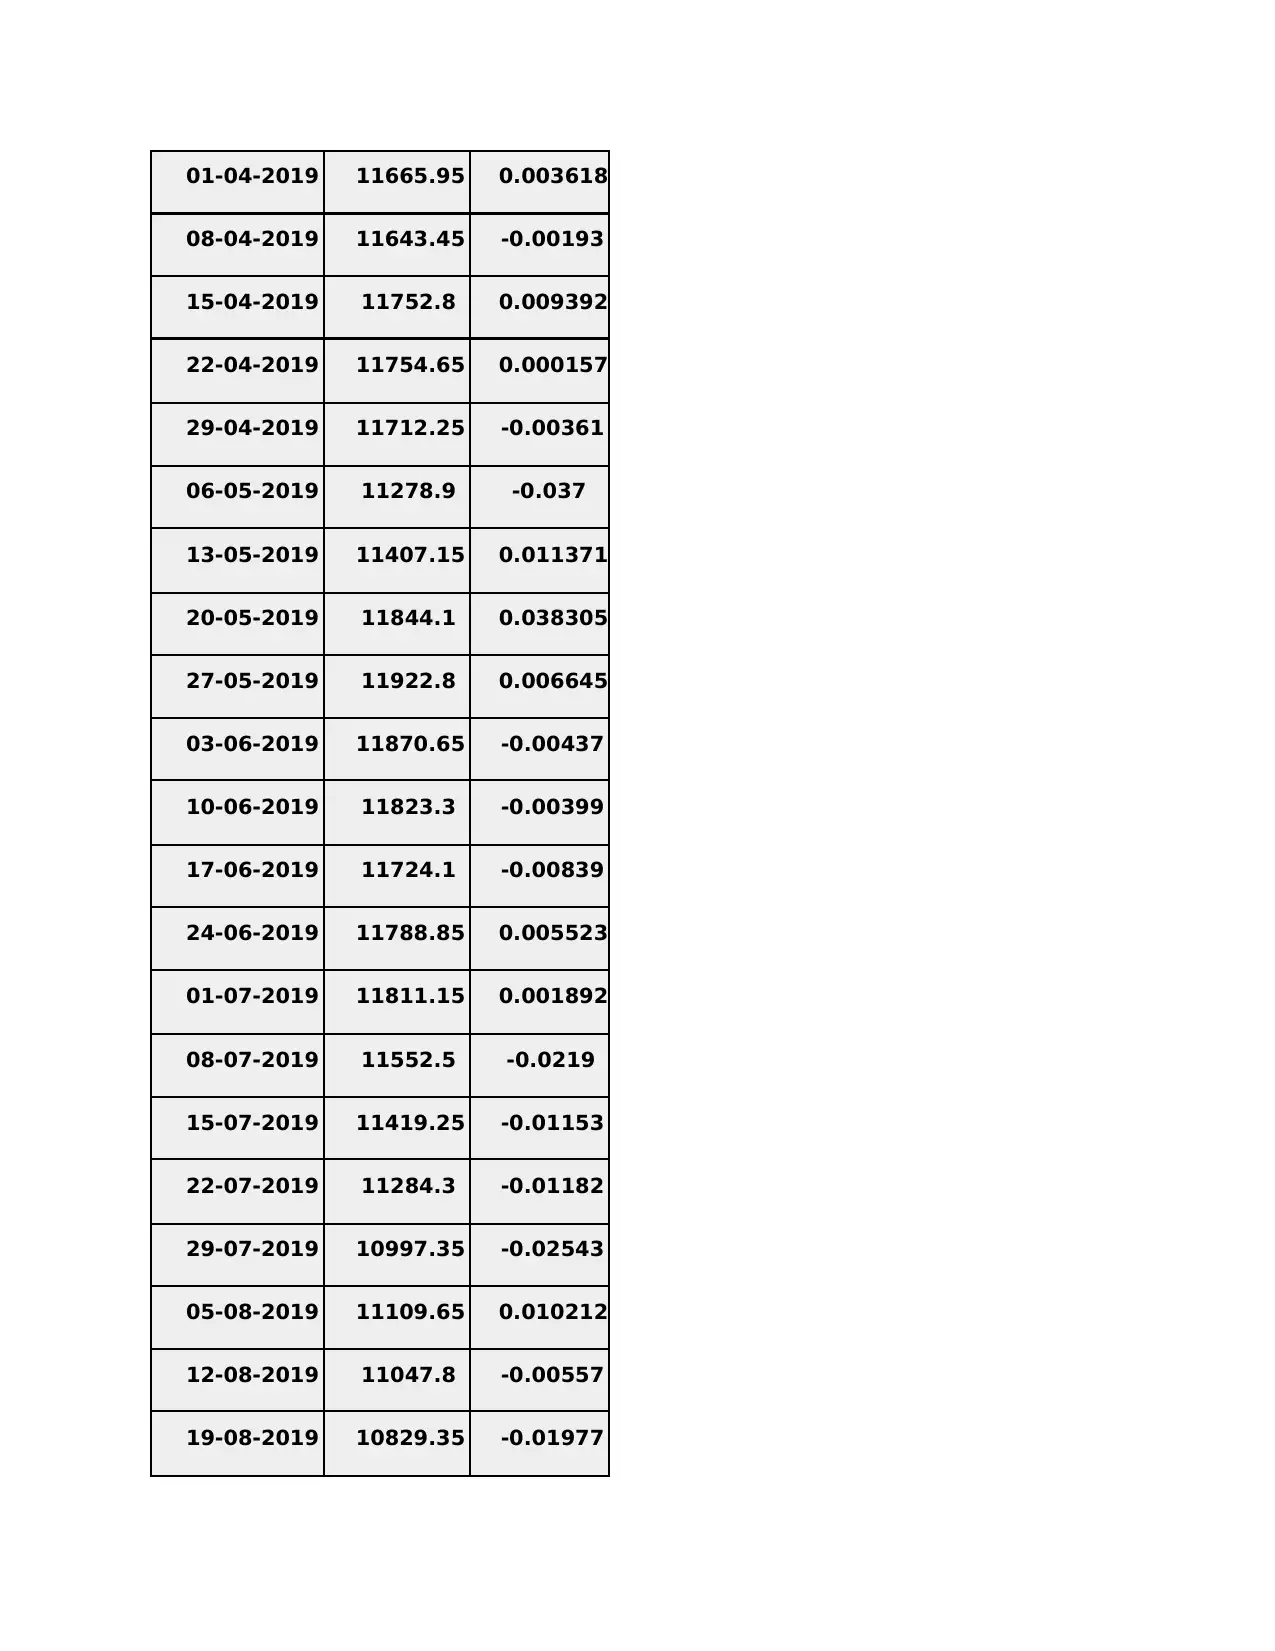
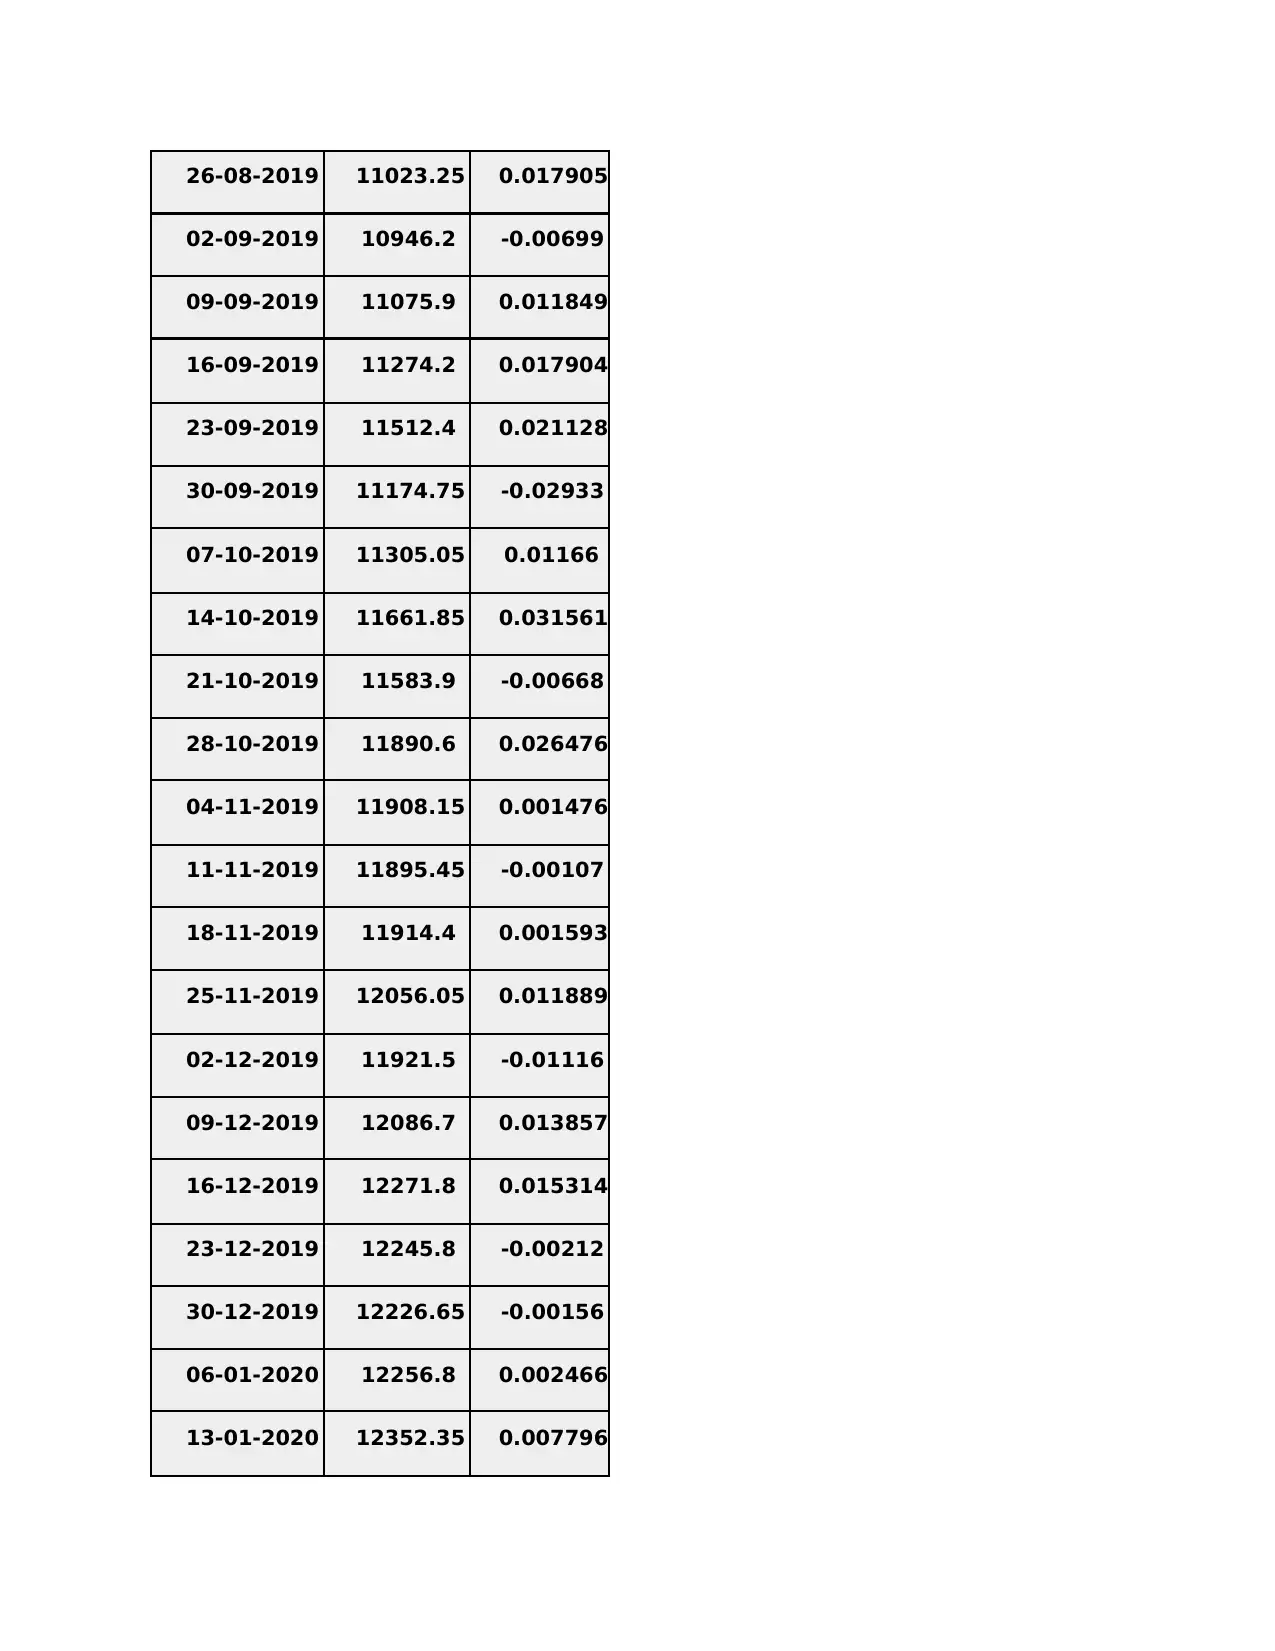
Weekly Share Price Movement of NIFTY
Date Close Returns
28-03-2016 7713.05
04-04-2016 7555.2 -0.02047
11-04-2016 7850.45 0.039079
18-04-2016 7899.3 0.006223
25-04-2016 7849.8 -0.00627
02-05-2016 7733.45 -0.01482
09-05-2016 7814.9 0.010532
16-05-2016 7749.7 -0.00834
23-05-2016 8156.65 0.052512
30-05-2016 8220.8 0.007865
Paraphrase This Document
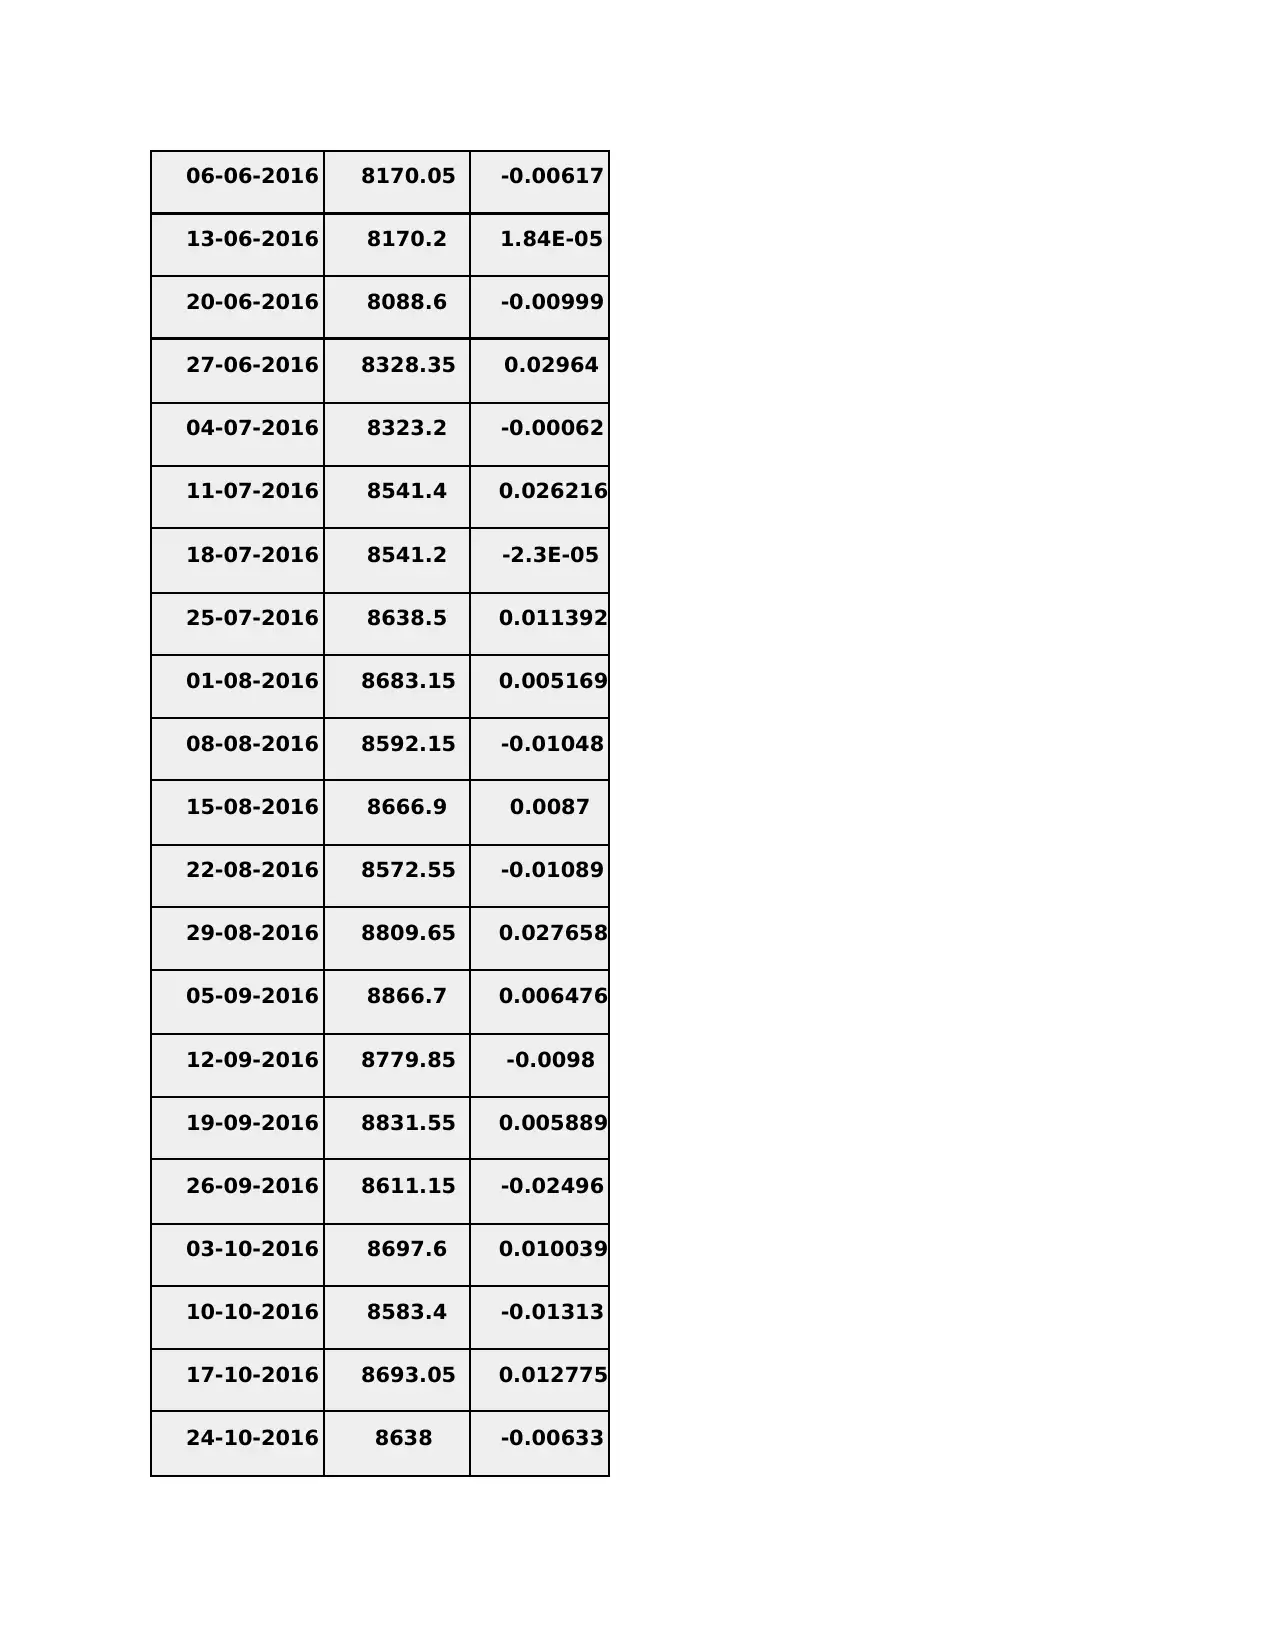
13-06-2016 8170.2 1.84E-05
20-06-2016 8088.6 -0.00999
27-06-2016 8328.35 0.02964
04-07-2016 8323.2 -0.00062
11-07-2016 8541.4 0.026216
18-07-2016 8541.2 -2.3E-05
25-07-2016 8638.5 0.011392
01-08-2016 8683.15 0.005169
08-08-2016 8592.15 -0.01048
15-08-2016 8666.9 0.0087
22-08-2016 8572.55 -0.01089
29-08-2016 8809.65 0.027658
05-09-2016 8866.7 0.006476
12-09-2016 8779.85 -0.0098
19-09-2016 8831.55 0.005889
26-09-2016 8611.15 -0.02496
03-10-2016 8697.6 0.010039
10-10-2016 8583.4 -0.01313
17-10-2016 8693.05 0.012775
24-10-2016 8638 -0.00633
07-11-2016 8296.3 -0.0163
14-11-2016 8074.1 -0.02678
21-11-2016 8114.3 0.004979
28-11-2016 8086.8 -0.00339
05-12-2016 8261.75 0.021634
12-12-2016 8139.45 -0.0148
19-12-2016 7985.75 -0.01888
26-12-2016 8185.8 0.025051
02-01-2017 8243.8 0.007085
09-01-2017 8400.35 0.01899
16-01-2017 8349.35 -0.00607
23-01-2017 8641.25 0.034961
30-01-2017 8740.95 0.011538
06-02-2017 8793.55 0.006018
13-02-2017 8821.7 0.003201
20-02-2017 8939.5 0.013353
27-02-2017 8897.55 -0.00469
06-03-2017 8934.55 0.004158
13-03-2017 9160.05 0.025239
20-03-2017 9108 -0.00568
You're viewing a preview
Unlock full access by subscribing today!
03-04-2017 9198.3 0.002676
10-04-2017 9150.8 -0.00516
17-04-2017 9119.4 -0.00343
24-04-2017 9304.05 0.020248
01-05-2017 9285.3 -0.00202
08-05-2017 9400.9 0.01245
15-05-2017 9427.9 0.002872
22-05-2017 9595.1 0.017735
29-05-2017 9653.5 0.006086
05-06-2017 9668.25 0.001528
12-06-2017 9588.05 -0.0083
19-06-2017 9574.95 -0.00137
26-06-2017 9520.9 -0.00564
03-07-2017 9665.8 0.015219
10-07-2017 9886.35 0.022818
17-07-2017 9915.25 0.002923
24-07-2017 10014.5 0.01001
31-07-2017 10066.4 0.005183
07-08-2017 9710.8 -0.03533
14-08-2017 9837.4 0.013037
Paraphrase This Document
28-08-2017 9974.4 0.011905
04-09-2017 9934.8 -0.00397
11-09-2017 10085.4 0.015159
18-09-2017 9964.4 -0.012
25-09-2017 9788.6 -0.01764
02-10-2017 9979.7 0.019523
09-10-2017 10167.45 0.018813
16-10-2017 10146.55 -0.00206
23-10-2017 10323.05 0.017395
30-10-2017 10452.5 0.01254
06-11-2017 10321.75 -0.01251
13-11-2017 10283.6 -0.0037
20-11-2017 10389.7 0.010317
27-11-2017 10121.8 -0.02579
04-12-2017 10265.65 0.014212
11-12-2017 10333.25 0.006585
18-12-2017 10493 0.01546
25-12-2017 10530.7 0.003593
01-01-2018 10558.85 0.002673
08-01-2018 10681.25 0.011592
22-01-2018 11069.65 0.016058
29-01-2018 10760.6 -0.02792
05-02-2018 10454.95 -0.0284
12-02-2018 10452.3 -0.00025
19-02-2018 10491.05 0.003707
26-02-2018 10458.35 -0.00312
05-03-2018 10226.85 -0.02214
12-03-2018 10195.15 -0.0031
19-03-2018 9998.05 -0.01933
26-03-2018 10113.7 0.011567
02-04-2018 10331.6 0.021545
09-04-2018 10480.6 0.014422
16-04-2018 10564.05 0.007962
23-04-2018 10692.3 0.01214
30-04-2018 10618.25 -0.00693
07-05-2018 10806.5 0.017729
14-05-2018 10596.4 -0.01944
21-05-2018 10605.15 0.000826
28-05-2018 10696.2 0.008585
04-06-2018 10767.65 0.00668
You're viewing a preview
Unlock full access by subscribing today!
18-06-2018 10821.85 0.000384
25-06-2018 10714.3 -0.00994
02-07-2018 10772.65 0.005446
09-07-2018 11018.9 0.022859
16-07-2018 11010.2 -0.00079
23-07-2018 11278.35 0.024355
30-07-2018 11360.8 0.00731
06-08-2018 11429.5 0.006047
13-08-2018 11470.75 0.003609
20-08-2018 11557.1 0.007528
27-08-2018 11680.5 0.010677
03-09-2018 11589.1 -0.00783
10-09-2018 11515.2 -0.00638
17-09-2018 11143.1 -0.03231
24-09-2018 10930.45 -0.01908
01-10-2018 10316.45 -0.05617
08-10-2018 10472.5 0.015126
15-10-2018 10303.55 -0.01613
22-10-2018 10030 -0.02655
29-10-2018 10553 0.052144
Paraphrase This Document
12-11-2018 10682.2 0.009164
19-11-2018 10526.75 -0.01455
26-11-2018 10876.75 0.033249
03-12-2018 10693.7 -0.01683
10-12-2018 10805.45 0.01045
17-12-2018 10754 -0.00476
24-12-2018 10859.9 0.009848
31-12-2018 10727.35 -0.01221
07-01-2019 10794.95 0.006302
14-01-2019 10906.95 0.010375
21-01-2019 10780.55 -0.01159
28-01-2019 10893.65 0.010491
04-02-2019 10943.6 0.004585
11-02-2019 10724.4 -0.02003
18-02-2019 10791.65 0.006271
25-02-2019 10863.5 0.006658
04-03-2019 11035.4 0.015824
11-03-2019 11426.85 0.035472
18-03-2019 11456.9 0.00263
25-03-2019 11623.9 0.014576
08-04-2019 11643.45 -0.00193
15-04-2019 11752.8 0.009392
22-04-2019 11754.65 0.000157
29-04-2019 11712.25 -0.00361
06-05-2019 11278.9 -0.037
13-05-2019 11407.15 0.011371
20-05-2019 11844.1 0.038305
27-05-2019 11922.8 0.006645
03-06-2019 11870.65 -0.00437
10-06-2019 11823.3 -0.00399
17-06-2019 11724.1 -0.00839
24-06-2019 11788.85 0.005523
01-07-2019 11811.15 0.001892
08-07-2019 11552.5 -0.0219
15-07-2019 11419.25 -0.01153
22-07-2019 11284.3 -0.01182
29-07-2019 10997.35 -0.02543
05-08-2019 11109.65 0.010212
12-08-2019 11047.8 -0.00557
19-08-2019 10829.35 -0.01977
You're viewing a preview
Unlock full access by subscribing today!
02-09-2019 10946.2 -0.00699
09-09-2019 11075.9 0.011849
16-09-2019 11274.2 0.017904
23-09-2019 11512.4 0.021128
30-09-2019 11174.75 -0.02933
07-10-2019 11305.05 0.01166
14-10-2019 11661.85 0.031561
21-10-2019 11583.9 -0.00668
28-10-2019 11890.6 0.026476
04-11-2019 11908.15 0.001476
11-11-2019 11895.45 -0.00107
18-11-2019 11914.4 0.001593
25-11-2019 12056.05 0.011889
02-12-2019 11921.5 -0.01116
09-12-2019 12086.7 0.013857
16-12-2019 12271.8 0.015314
23-12-2019 12245.8 -0.00212
30-12-2019 12226.65 -0.00156
06-01-2020 12256.8 0.002466
13-01-2020 12352.35 0.007796
Paraphrase This Document
27-01-2020 11962.1 -0.02336
03-02-2020 12098.35 0.01139
10-02-2020 12113.45 0.001248
17-02-2020 12080.85 -0.00269
24-02-2020 11201.75 -0.07277
02-03-2020 10989.45 -0.01895
09-03-2020 9955.2 -0.09411
16-03-2020 8745.45 -0.12152
23-03-2020 8660.25 -0.00974
30-03-2020 8083.8 -0.06656
06-04-2020 9111.9 0.12718
13-04-2020 9266.75 0.016994
20-04-2020 9154.4 -0.01212
27-04-2020 9859.9 0.077067
04-05-2020 9251.5 -0.0617
11-05-2020 9136.85 -0.01239
18-05-2020 9039.25 -0.01068
25-05-2020 9580.3 0.059856
01-06-2020 10142.15 0.058646
08-06-2020 9972.9 -0.01669
22-06-2020 10383 0.013529
29-06-2020 10607.35 0.021607
06-07-2020 10768.05 0.01515
13-07-2020 10901.7 0.012412
20-07-2020 11194.15 0.026826
27-07-2020 11073.45 -0.01078
03-08-2020 11214.05 0.012697
10-08-2020 11178.4 -0.00318
17-08-2020 11371.6 0.017283
24-08-2020 11647.6 0.024271
31-08-2020 11333.85 -0.02694
07-09-2020 11464.45 0.011523
14-09-2020 11504.95 0.003533
21-09-2020 11050.25 -0.03952
28-09-2020 11416.95 0.033185
05-10-2020 11914.2 0.043554
12-10-2020 11762.45 -0.01274
19-10-2020 11930.35 0.014274
26-10-2020 11642.4 -0.02414
02-11-2020 12263.55 0.053352
You're viewing a preview
Unlock full access by subscribing today!
16-11-2020 12859.05 0.010936
23-11-2020 12968.95 0.008547
30-11-2020 13258.55 0.02233
07-12-2020 13513.85 0.019255
14-12-2020 13760.55 0.018255
21-12-2020 13749.25 -0.00082
28-12-2020 13981.75 0.01691
04-01-2021 14347.25 0.026141
11-01-2021 14433.7 0.006026
18-01-2021 14371.9 -0.00428
25-01-2021 13634.6 -0.0513
01-02-2021 14924.25 0.094587
08-02-2021 15163.3 0.016018
15-02-2021 14981.75 -0.01197
22-02-2021 14529.15 -0.03021
01-03-2021 14938.1 0.028147
08-03-2021 15030.95 0.006216
15-03-2021 14744 -0.01909
22-03-2021 14507.3 -0.01605
29-03-2021 14690.7 0.012642
Paraphrase This Document
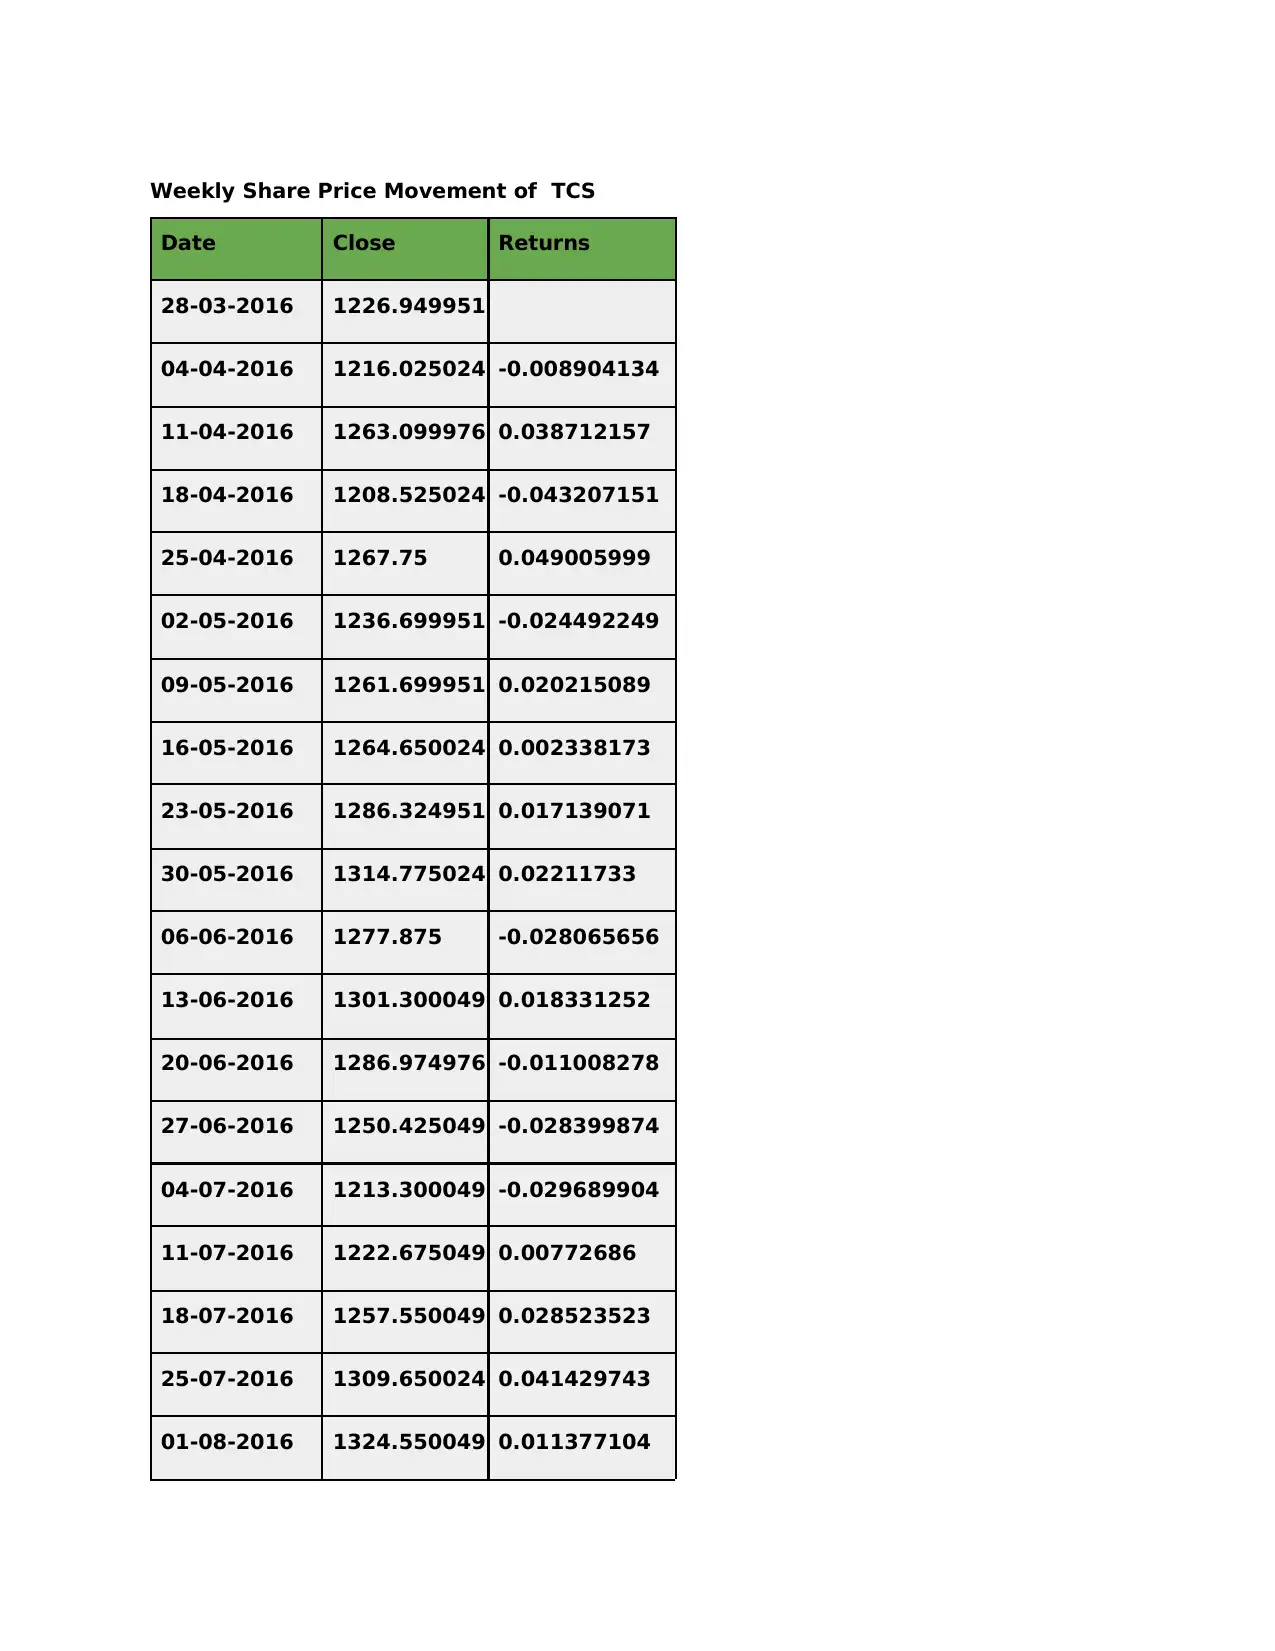
Date Close Returns
28-03-2016 1226.949951
04-04-2016 1216.025024 -0.008904134
11-04-2016 1263.099976 0.038712157
18-04-2016 1208.525024 -0.043207151
25-04-2016 1267.75 0.049005999
02-05-2016 1236.699951 -0.024492249
09-05-2016 1261.699951 0.020215089
16-05-2016 1264.650024 0.002338173
23-05-2016 1286.324951 0.017139071
30-05-2016 1314.775024 0.02211733
06-06-2016 1277.875 -0.028065656
13-06-2016 1301.300049 0.018331252
20-06-2016 1286.974976 -0.011008278
27-06-2016 1250.425049 -0.028399874
04-07-2016 1213.300049 -0.029689904
11-07-2016 1222.675049 0.00772686
18-07-2016 1257.550049 0.028523523
25-07-2016 1309.650024 0.041429743
01-08-2016 1324.550049 0.011377104
15-08-2016 1301.75 -0.049279685
22-08-2016 1262.474976 -0.030170942
29-08-2016 1257.400024 -0.004019844
05-09-2016 1176.224976 -0.064557855
12-09-2016 1180.849976 0.003932071
19-09-2016 1199.050049 0.015412689
26-09-2016 1215.400024 0.013635774
03-10-2016 1183.900024 -0.025917393
10-10-2016 1183.099976 -0.000675773
17-10-2016 1214.324951 0.026392508
24-10-2016 1199.349976 -0.012331934
31-10-2016 1165.275024 -0.028411183
07-11-2016 1050.574951 -0.098431761
14-11-2016 1062.550049 0.011398614
21-11-2016 1150.175049 0.082466704
28-11-2016 1110.925049 -0.03412524
05-12-2016 1097.625 -0.011972049
12-12-2016 1141.324951 0.039813188
19-12-2016 1144.050049 0.002387662
26-12-2016 1182.775024 0.033849022
You're viewing a preview
Unlock full access by subscribing today!
09-01-2017 1124.650024 -0.014070244
16-01-2017 1142.675049 0.01602723
23-01-2017 1178.900024 0.031701904
30-01-2017 1116.275024 -0.053121553
06-02-2017 1198.974976 0.074085642
13-02-2017 1203.949951 0.004149357
20-02-2017 1240.900024 0.030690705
27-02-2017 1247.025024 0.004935934
06-03-2017 1271.125 0.019325976
13-03-2017 1262.875 -0.006490314
20-03-2017 1213.599976 -0.039018132
27-03-2017 1215.900024 0.001895227
03-04-2017 1214.525024 -0.00113085
10-04-2017 1164.324951 -0.041333091
17-04-2017 1155.400024 -0.007665323
24-04-2017 1136.574951 -0.016293122
01-05-2017 1160.25 0.02083017
08-05-2017 1180.324951 0.017302263
15-05-2017 1253.574951 0.062059181
22-05-2017 1289.125 0.028358934
Paraphrase This Document
05-06-2017 1253.5 -0.022573942
12-06-2017 1199.849976 -0.042800179
19-06-2017 1180.849976 -0.015835313
26-06-2017 1181.175049 0.000275287
03-07-2017 1165.974976 -0.012868603
10-07-2017 1198.724976 0.028088081
17-07-2017 1245.599976 0.039104049
24-07-2017 1242.150024 -0.002769711
31-07-2017 1261.400024 0.015497323
07-08-2017 1248.025024 -0.010603298
14-08-2017 1256.900024 0.007111236
21-08-2017 1248.300049 -0.006842211
28-08-2017 1228.224976 -0.016081929
04-09-2017 1235.300049 0.005760405
11-09-2017 1253.025024 0.01434872
18-09-2017 1251.800049 -0.000977614
25-09-2017 1217.974976 -0.027021147
02-10-2017 1223.324951 0.004392516
09-10-2017 1279.300049 0.045756524
16-10-2017 1291.949951 0.009888143

30-10-2017 1310.050049 0.0138529
06-11-2017 1354.375 0.033834548
13-11-2017 1353.650024 -0.000535285
20-11-2017 1344.025024 -0.007110405
27-11-2017 1314.974976 -0.021614217
04-12-2017 1300.75 -0.010817678
11-12-2017 1272.800049 -0.021487566
18-12-2017 1323.375 0.039735189
25-12-2017 1350.599976 0.020572382
01-01-2018 1344.599976 -0.00444247
08-01-2018 1388.175049 0.032407462
15-01-2018 1479.650024 0.06589585
22-01-2018 1560.525024 0.054658195
29-01-2018 1576.824951 0.010445156
05-02-2018 1485.849976 -0.057695038
12-02-2018 1466.525024 -0.013005991
19-02-2018 1537.900024 0.048669473
26-02-2018 1518.849976 -0.012387052
05-03-2018 1517.050049 -0.001185059
12-03-2018 1412.849976 -0.068685982
You're viewing a preview
Unlock full access by subscribing today!
26-03-2018 1424.574951 0.011000125
02-04-2018 1475.150024 0.035501869
09-04-2018 1576.650024 0.068806561
16-04-2018 1701.224976 0.079012431
23-04-2018 1725.974976 0.01454834
30-04-2018 1740.375 0.008343124
07-05-2018 1728.474976 -0.006837621
14-05-2018 1751.025024 0.01304621
21-05-2018 1792.900024 0.023914564
28-05-2018 1732.449951 -0.033716366
04-06-2018 1747.099976 0.008456247
11-06-2018 1840.050049 0.053202492
18-06-2018 1809.800049 -0.01643977
25-06-2018 1847.75 0.02096914
02-07-2018 1912.949951 0.035286132
09-07-2018 1981.099976 0.035625618
16-07-2018 1996.599976 0.007823936
23-07-2018 1943.75 -0.026469987
30-07-2018 1979.449951 0.018366534
06-08-2018 1993.099976 0.006895868
Paraphrase This Document
20-08-2018 2043 0.015029189
27-08-2018 2078.399902 0.017327412
03-09-2018 2079.850098 0.000697746
10-09-2018 2065.399902 -0.00694771
17-09-2018 2103.149902 0.018277332
24-09-2018 2183.699951 0.038299718
01-10-2018 2102.649902 -0.037115927
08-10-2018 1918.300049 -0.087675011
15-10-2018 1913.199951 -0.002658655
22-10-2018 1799.099976 -0.059638291
29-10-2018 1913.449951 0.063559545
05-11-2018 1909.199951 -0.002221119
12-11-2018 1886.599976 -0.011837406
19-11-2018 1812.550049 -0.039250465
26-11-2018 1968.25 0.085901049
03-12-2018 1995.199951 0.013692341
10-12-2018 1989.75 -0.002731531
17-12-2018 1895.800049 -0.047216962
24-12-2018 1896.050049 0.00013187
31-12-2018 1876.849976 -0.010126353
14-01-2019 1900.650024 0.031532373
21-01-2019 1920.800049 0.010601649
28-01-2019 2029.949951 0.056825229
04-02-2019 2061.399902 0.015492969
11-02-2019 2029.699951 -0.015377875
18-02-2019 1925.650024 -0.051263699
25-02-2019 1995.400024 0.036221535
04-03-2019 2022.699951 0.013681431
11-03-2019 2039.949951 0.008528205
18-03-2019 2005.650024 -0.016814102
25-03-2019 2001.650024 -0.001994366
01-04-2019 2048.300049 0.023305785
08-04-2019 2014.5 -0.016501513
15-04-2019 2150.050049 0.067287192
22-04-2019 2238.550049 0.041161833
29-04-2019 2132 -0.047597796
06-05-2019 2135.800049 0.001782387
13-05-2019 2095.449951 -0.018892264
20-05-2019 2048 -0.022644278
27-05-2019 2196.550049 0.072534204
You're viewing a preview
Unlock full access by subscribing today!
10-06-2019 2254.5 0.033344792
17-06-2019 2249.850098 -0.002062498
24-06-2019 2227.199951 -0.010067403
01-07-2019 2163.100098 -0.028780466
08-07-2019 2107.600098 -0.02565762
15-07-2019 2076.949951 -0.014542677
22-07-2019 2109.050049 0.015455403
29-07-2019 2205.300049 0.04563666
05-08-2019 2246.25 0.01856888
12-08-2019 2165.100098 -0.036126835
19-08-2019 2247.699951 0.038150593
26-08-2019 2259.600098 0.005294366
02-09-2019 2197.5 -0.027482782
09-09-2019 2141.949951 -0.025278748
16-09-2019 2065.449951 -0.03571512
23-09-2019 2056.149902 -0.004502675
30-09-2019 2079.350098 0.011283319
07-10-2019 1986.849976 -0.044485112
14-10-2019 2057.350098 0.035483365
21-10-2019 2115.699951 0.028361655
Paraphrase This Document
04-11-2019 2129.949951 -0.032236791
11-11-2019 2174.449951 0.02089251
18-11-2019 2071.699951 -0.047253329
25-11-2019 2053.25 -0.008905706
02-12-2019 2123.600098 0.034262802
09-12-2019 2071.25 -0.02465158
16-12-2019 2222.899902 0.073216609
23-12-2019 2198.5 -0.010976609
30-12-2019 2200.649902 0.000977895
06-01-2020 2213.550049 0.005861971
13-01-2020 2219.100098 0.002507307
20-01-2020 2183.399902 -0.016087691
27-01-2020 2164.850098 -0.008495834
03-02-2020 2136.550049 -0.013072521
10-02-2020 2184.199951 0.022302263
17-02-2020 2156.800049 -0.012544594
24-02-2020 2000.150024 -0.072630759
02-03-2020 2116.449951 0.058145602
09-03-2020 1806.300049 -0.146542517
16-03-2020 1797.449951 -0.004899572
30-03-2020 1654.199951 -0.093340668
06-04-2020 1766.150024 0.067676264
13-04-2020 1806.199951 0.022676401
20-04-2020 1818.550049 0.006837614
27-04-2020 2014.449951 0.107723129
04-05-2020 1893.400024 -0.060090809
11-05-2020 1892.900024 -0.000264075
18-05-2020 2020.349976 0.067330525
25-05-2020 1972.349976 -0.02375826
01-06-2020 2048.25 0.038482026
08-06-2020 2039.5 -0.004271939
15-06-2020 2044.599976 0.002500601
22-06-2020 2118.850098 0.036315232
29-06-2020 2199.649902 0.038133799
06-07-2020 2222.350098 0.010319913
13-07-2020 2200.75 -0.009719485
20-07-2020 2157.399902 -0.019697875
27-07-2020 2281.399902 0.057476595
03-08-2020 2295.350098 0.006114753
10-08-2020 2242.149902 -0.023177378
You're viewing a preview
Unlock full access by subscribing today!
24-08-2020 2238.550049 -0.004469469
31-08-2020 2288.800049 0.022447566
07-09-2020 2374.100098 0.037268458
14-09-2020 2449.899902 0.031927805
21-09-2020 2422.300049 -0.011265706
28-09-2020 2523.449951 0.041757792
05-10-2020 2812.949951 0.114723892
12-10-2020 2763.300049 -0.017650475
19-10-2020 2686.800049 -0.02768429
26-10-2020 2664.850098 -0.008169551
02-11-2020 2707.449951 0.015985835
09-11-2020 2670.350098 -0.013702877
16-11-2020 2660.25 -0.003782312
23-11-2020 2679.649902 0.007292511
30-11-2020 2727.550049 0.017875524
07-12-2020 2783.600098 0.020549595
14-12-2020 2861 0.027805683
21-12-2020 2909.350098 0.01689972
28-12-2020 2928.25 0.006496263
04-01-2021 3120.899902 0.065790114
Paraphrase This Document
18-01-2021 3303.100098 0.021572053
25-01-2021 3111.350098 -0.058051526
01-02-2021 3157.949951 0.014977374
08-02-2021 3190.800049 0.010402349
15-02-2021 3071.850098 -0.037279036
22-02-2021 2894.300049 -0.05779906
01-03-2021 3008.050049 0.039301385
08-03-2021 3057.949951 0.016588787
15-03-2021 3050.199951 -0.002534378
22-03-2021 3066.800049 0.005442298
29-03-2021 3177.850098 0.036210398
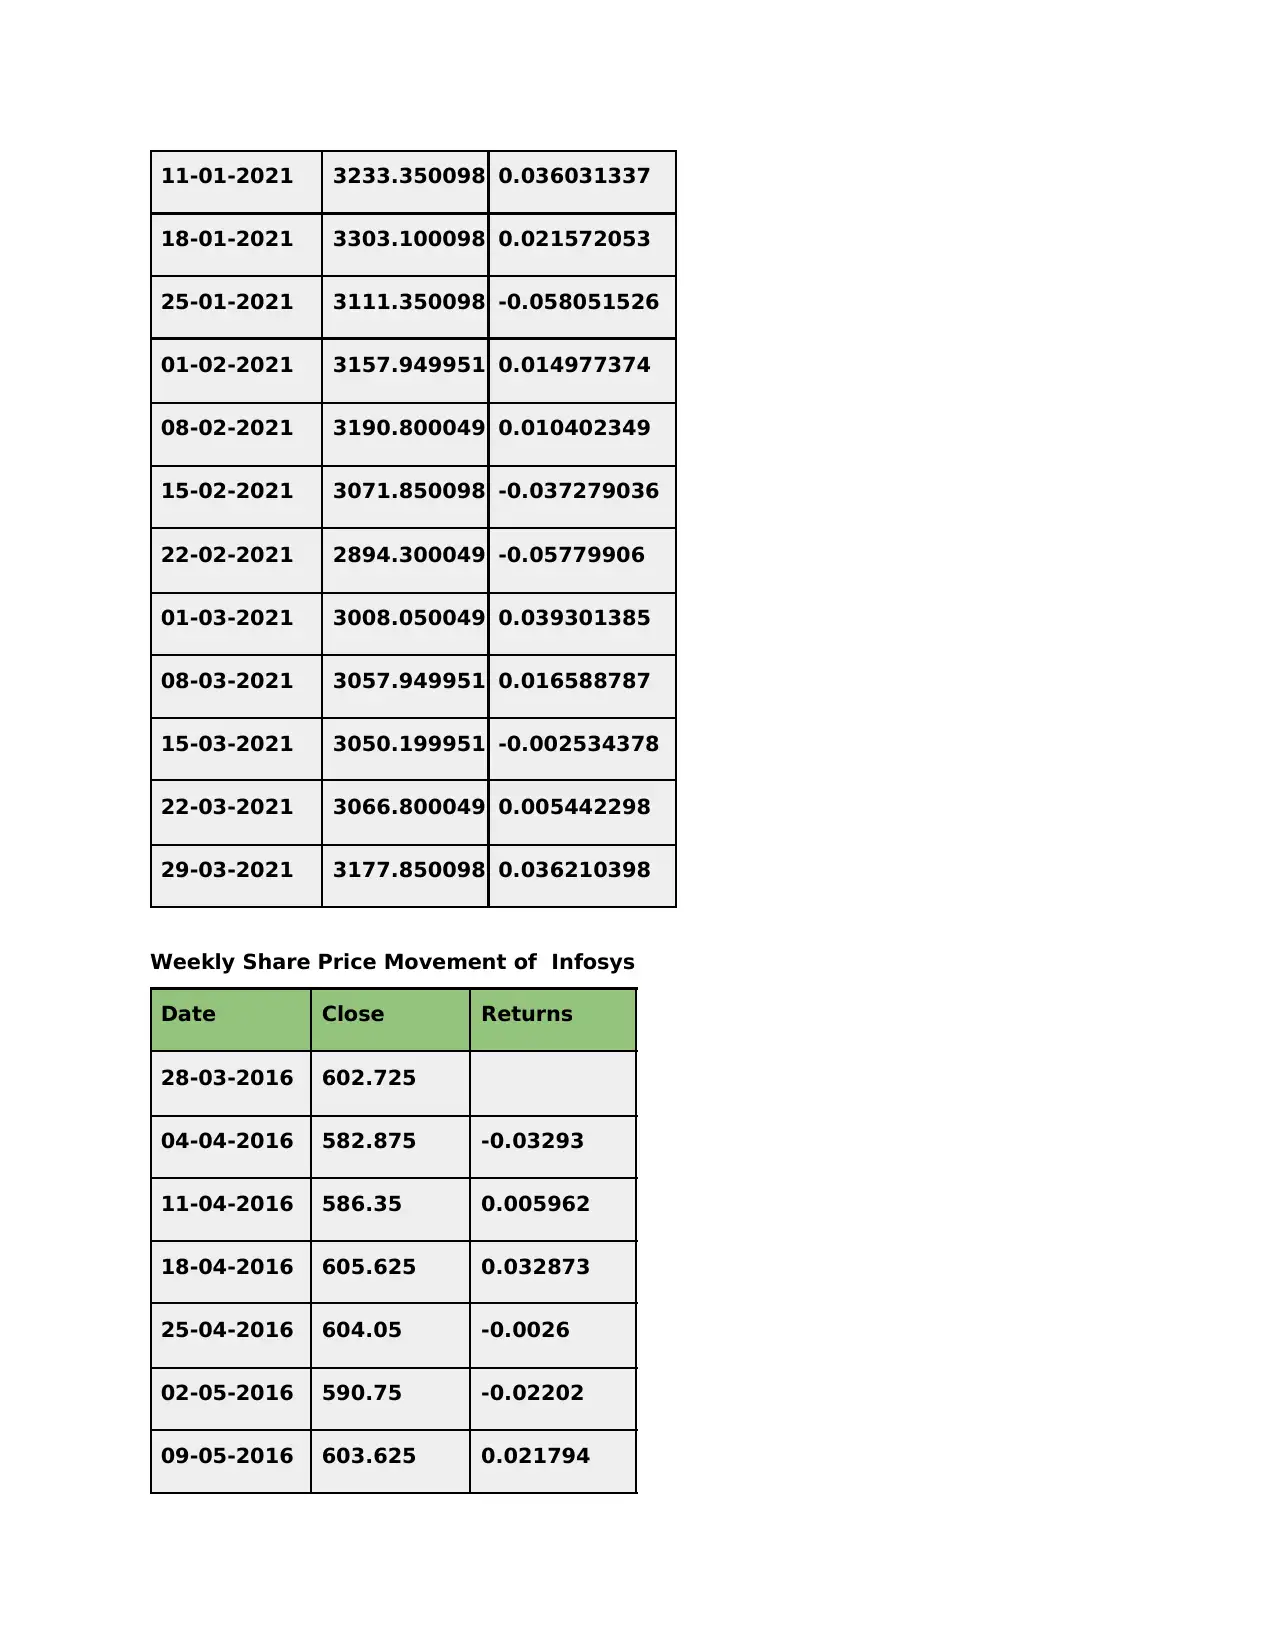
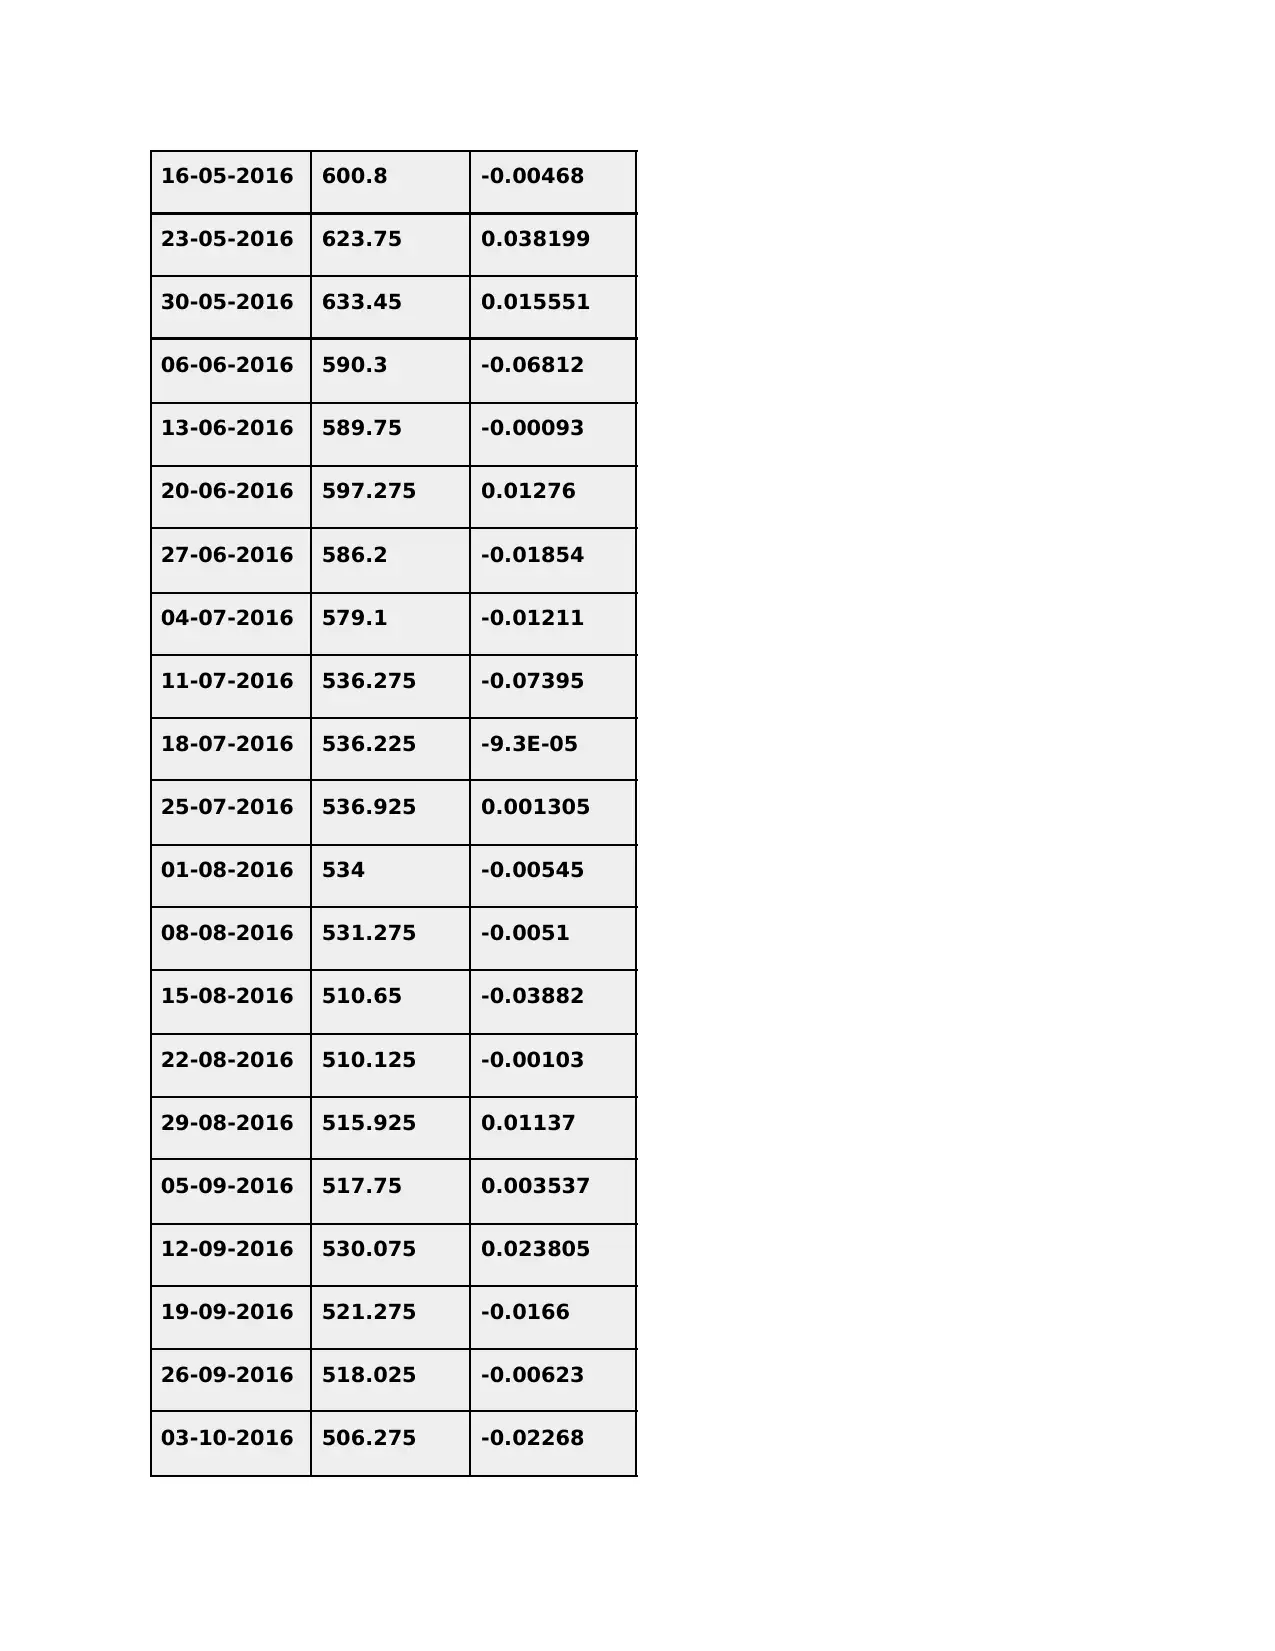
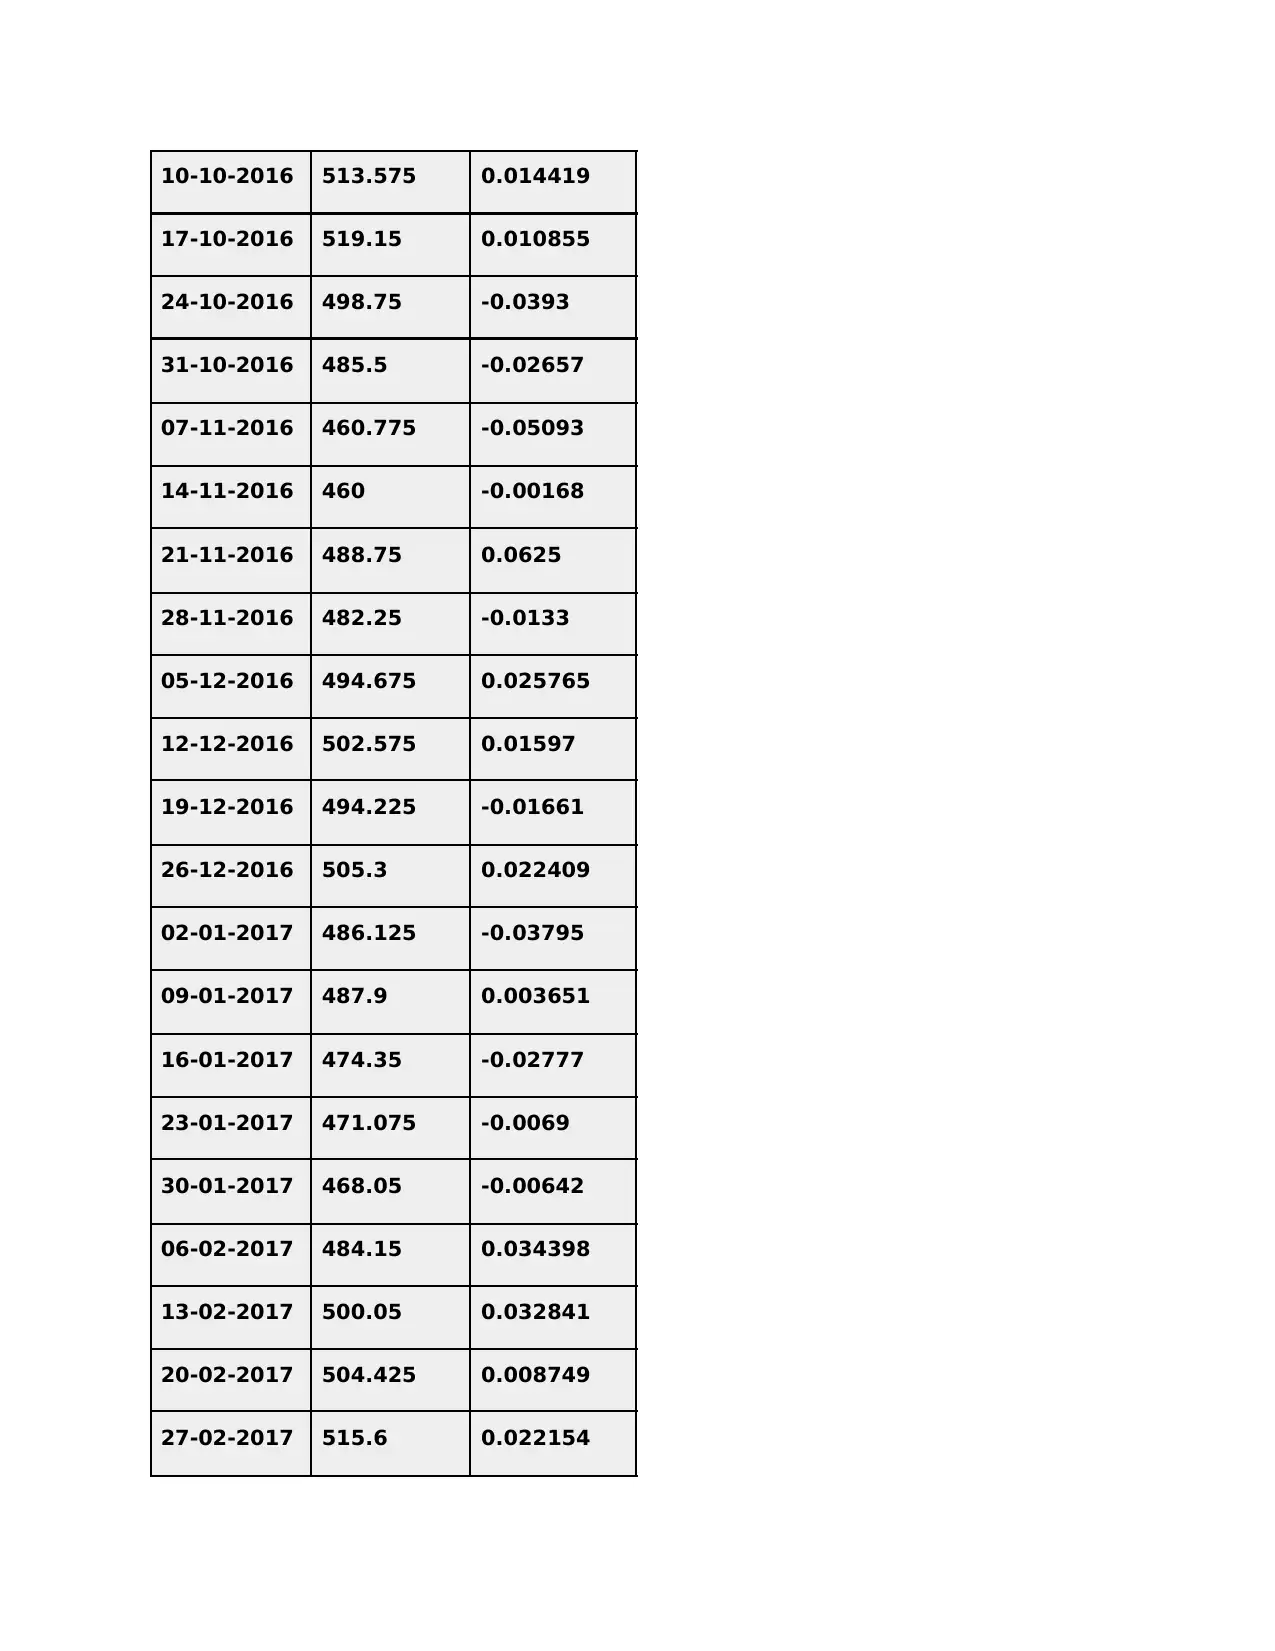
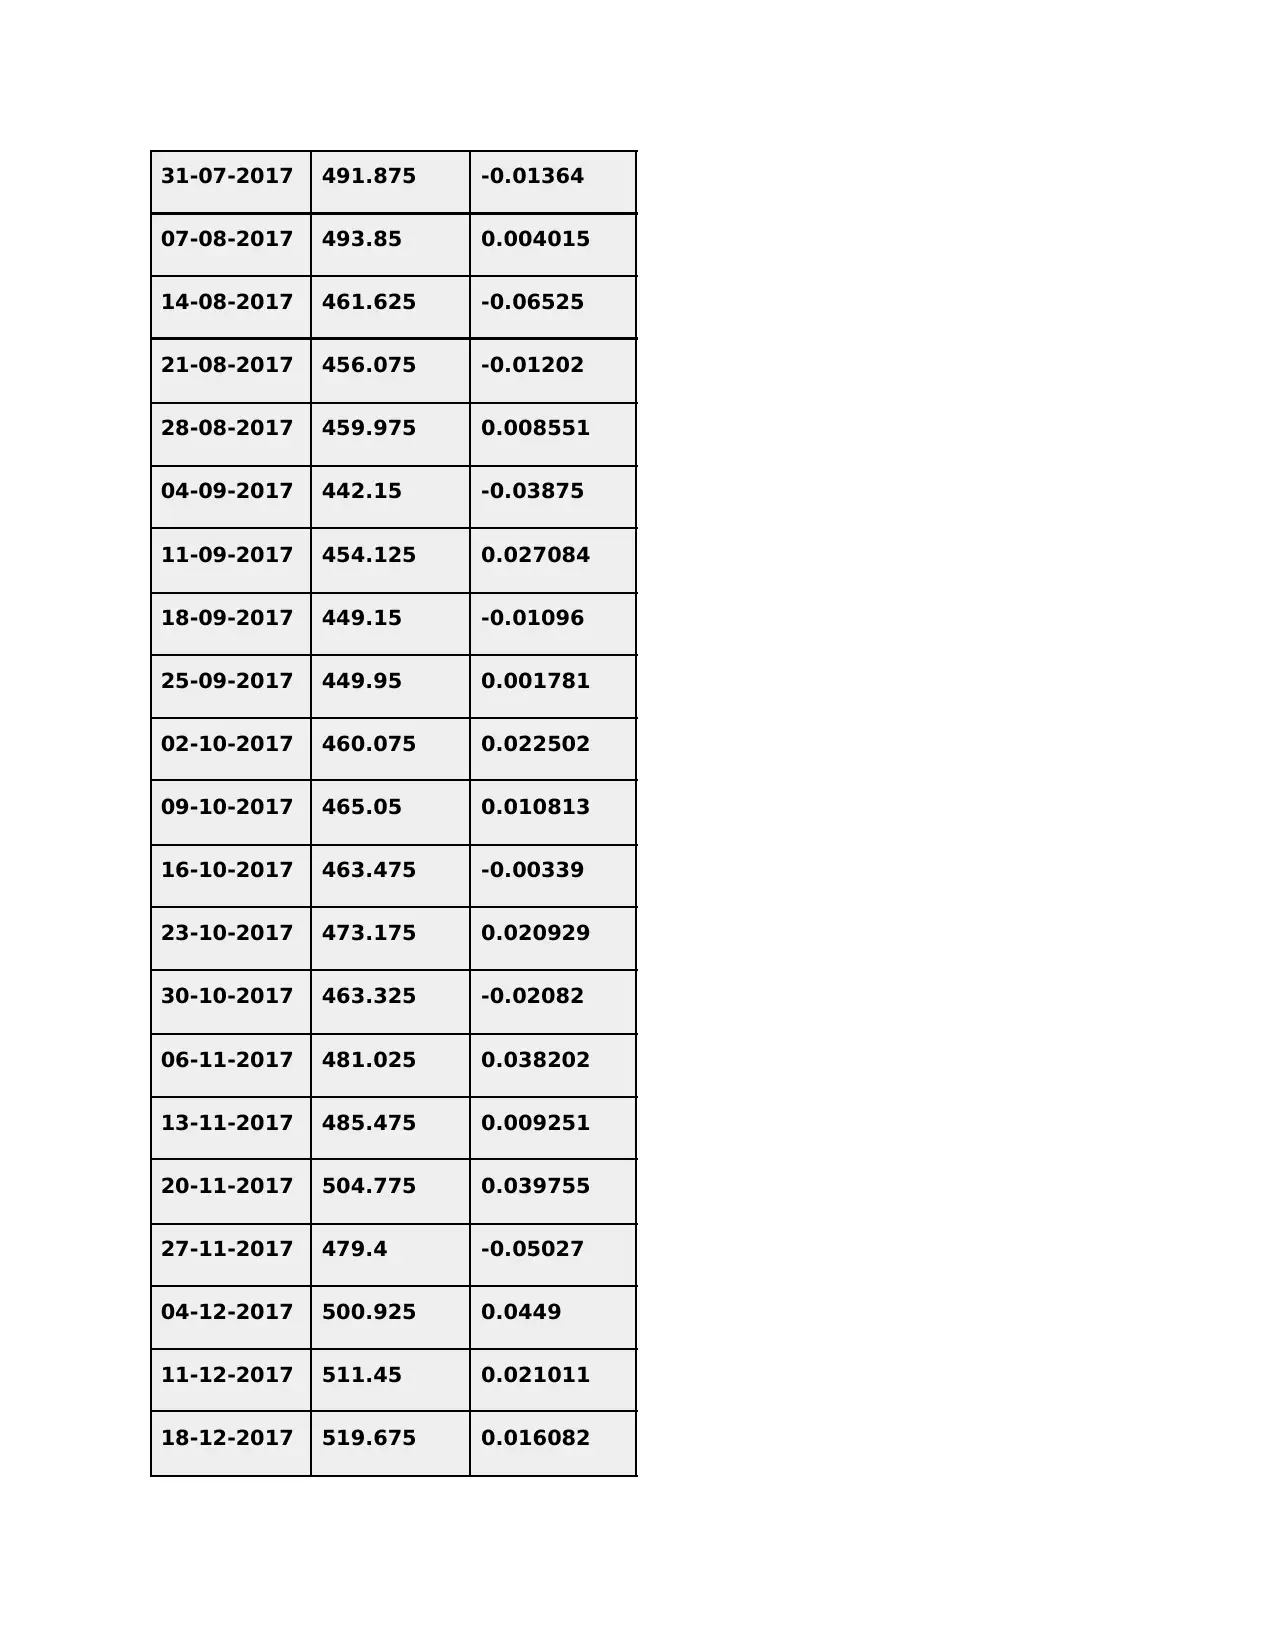
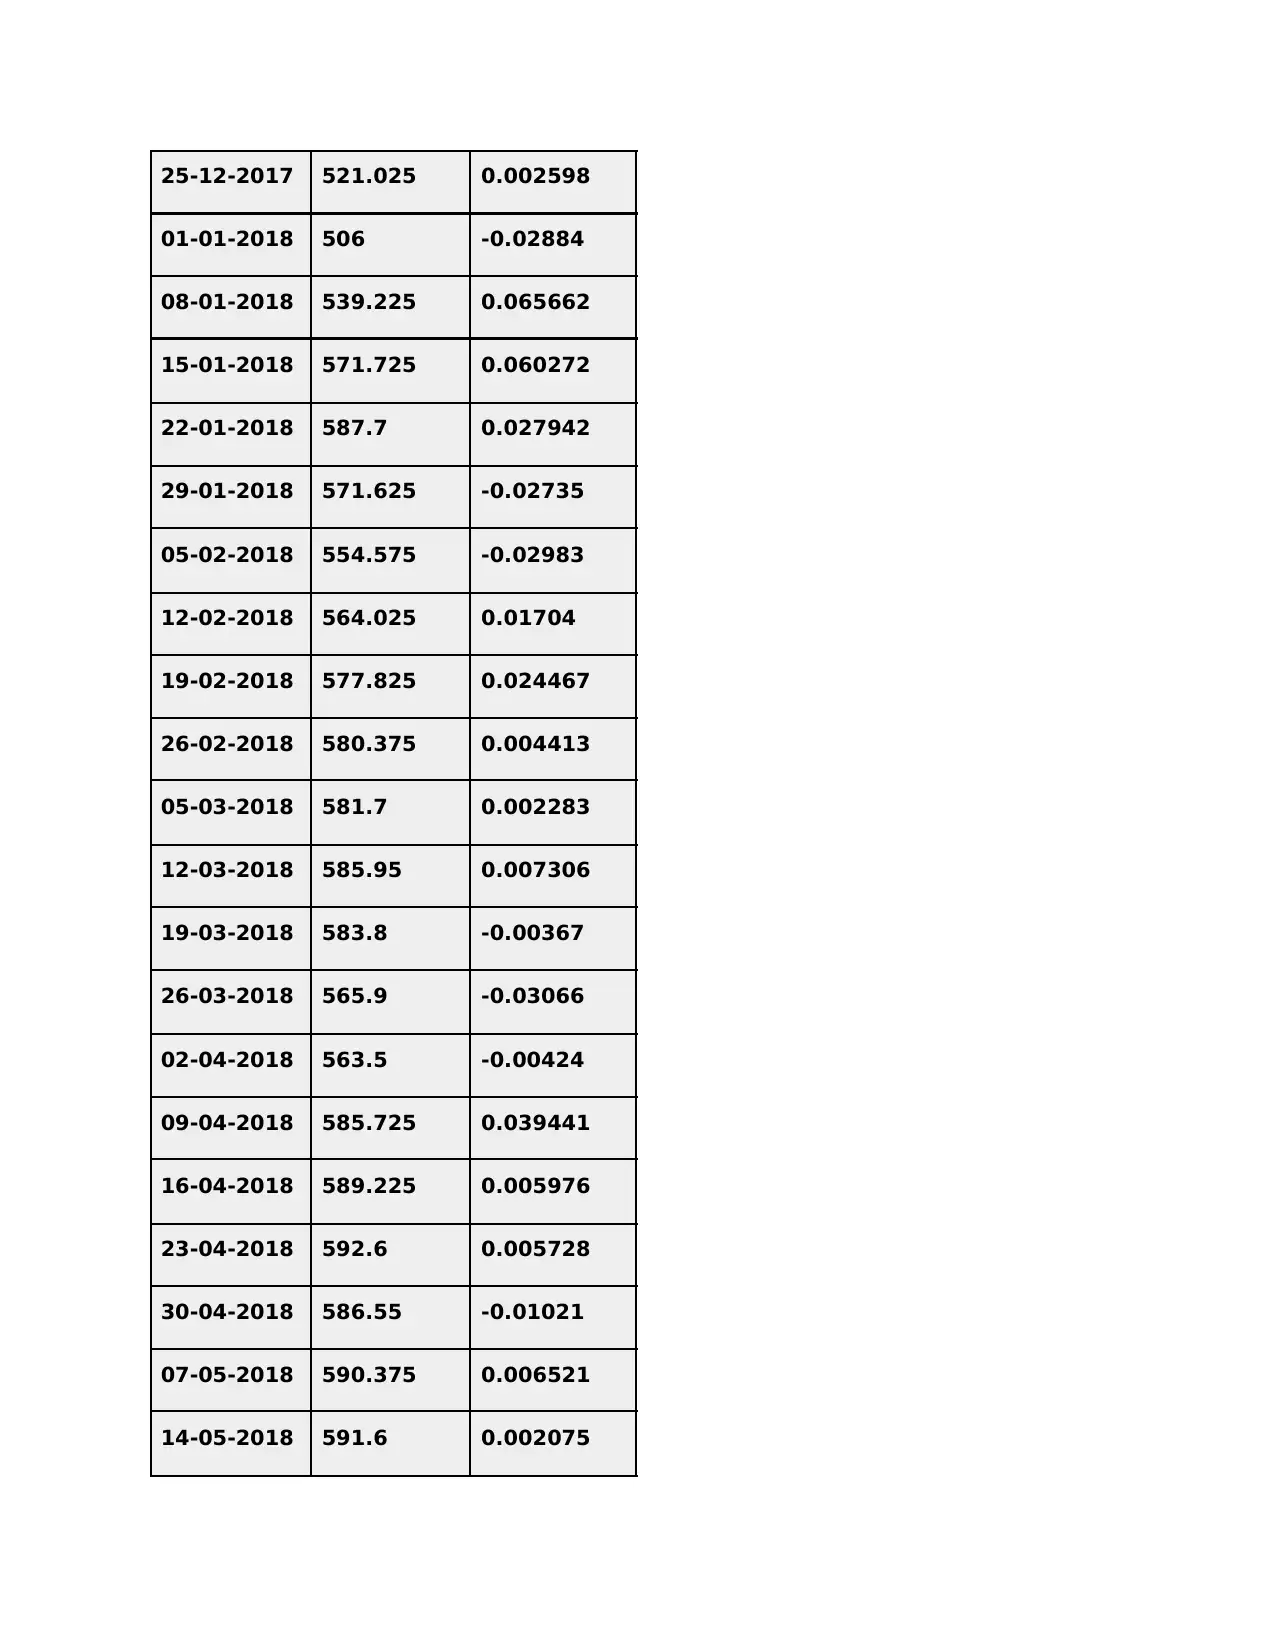
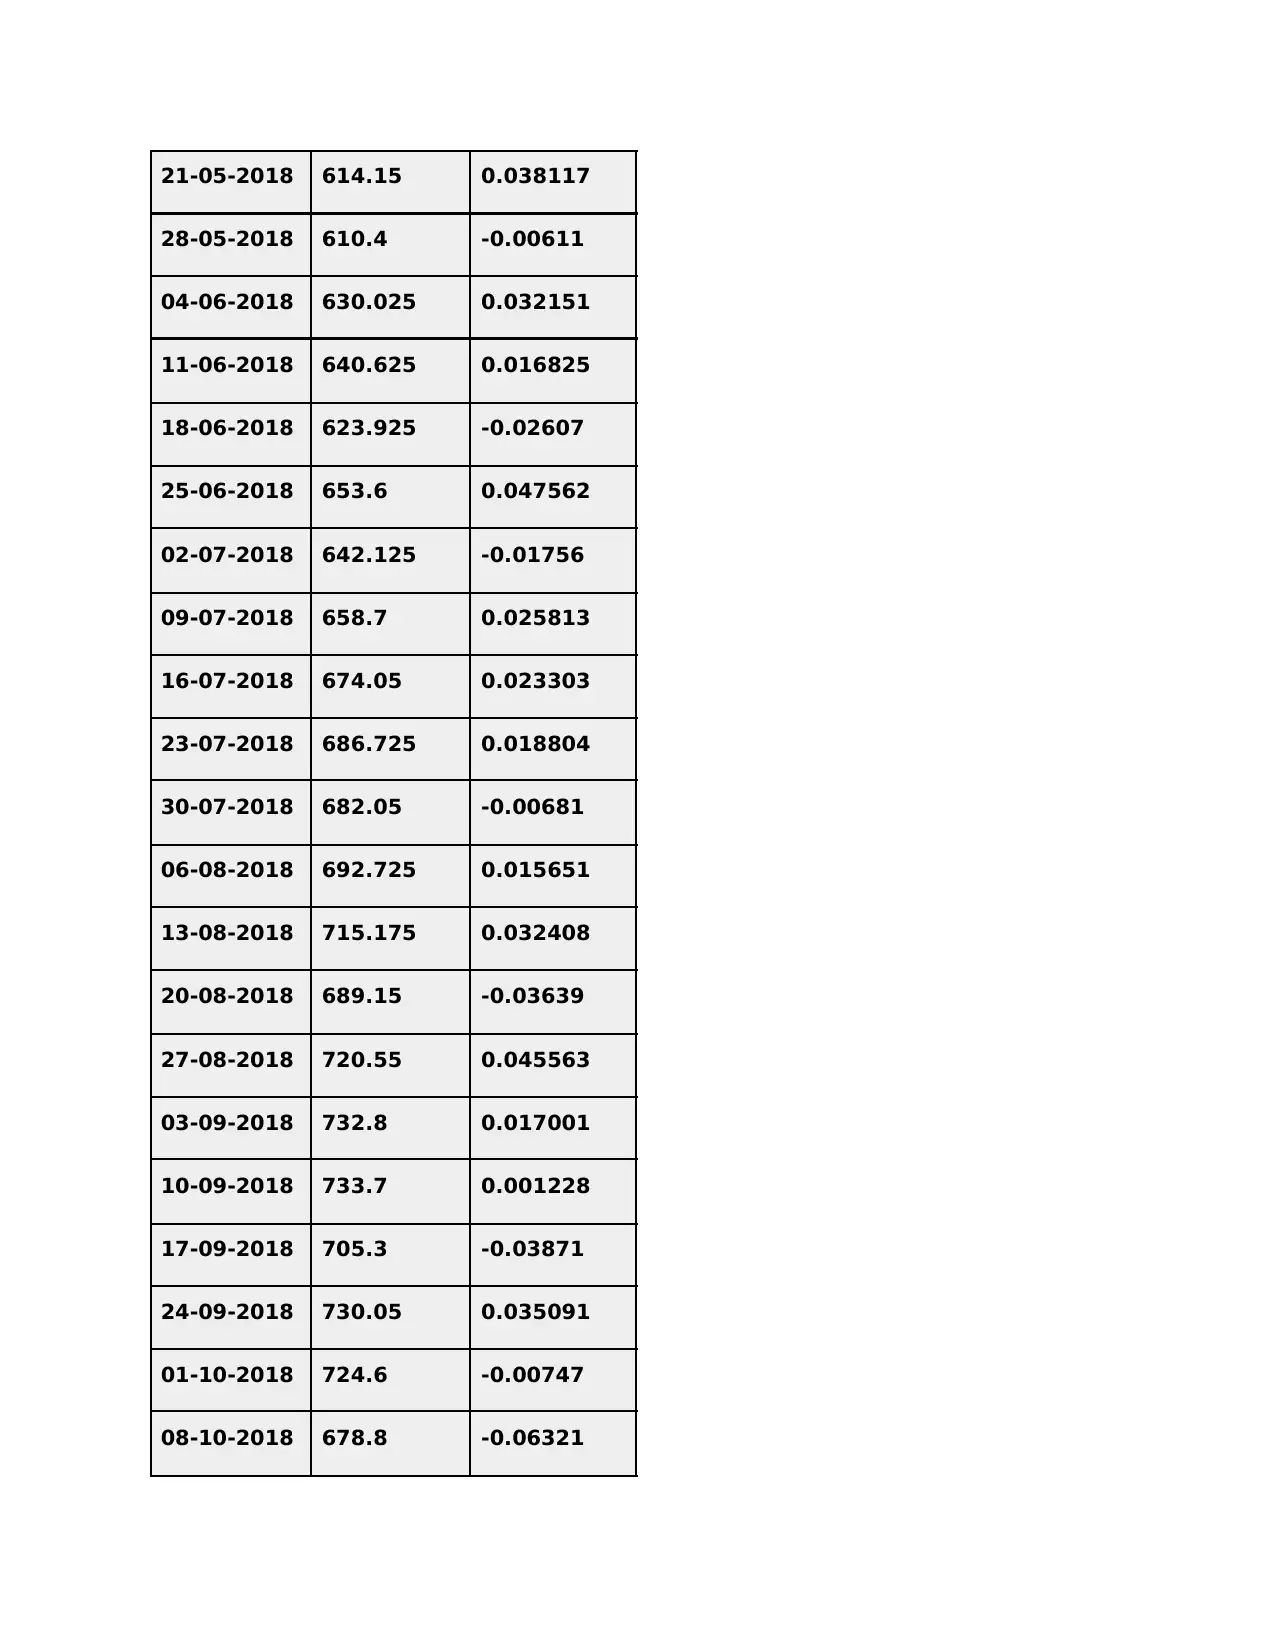
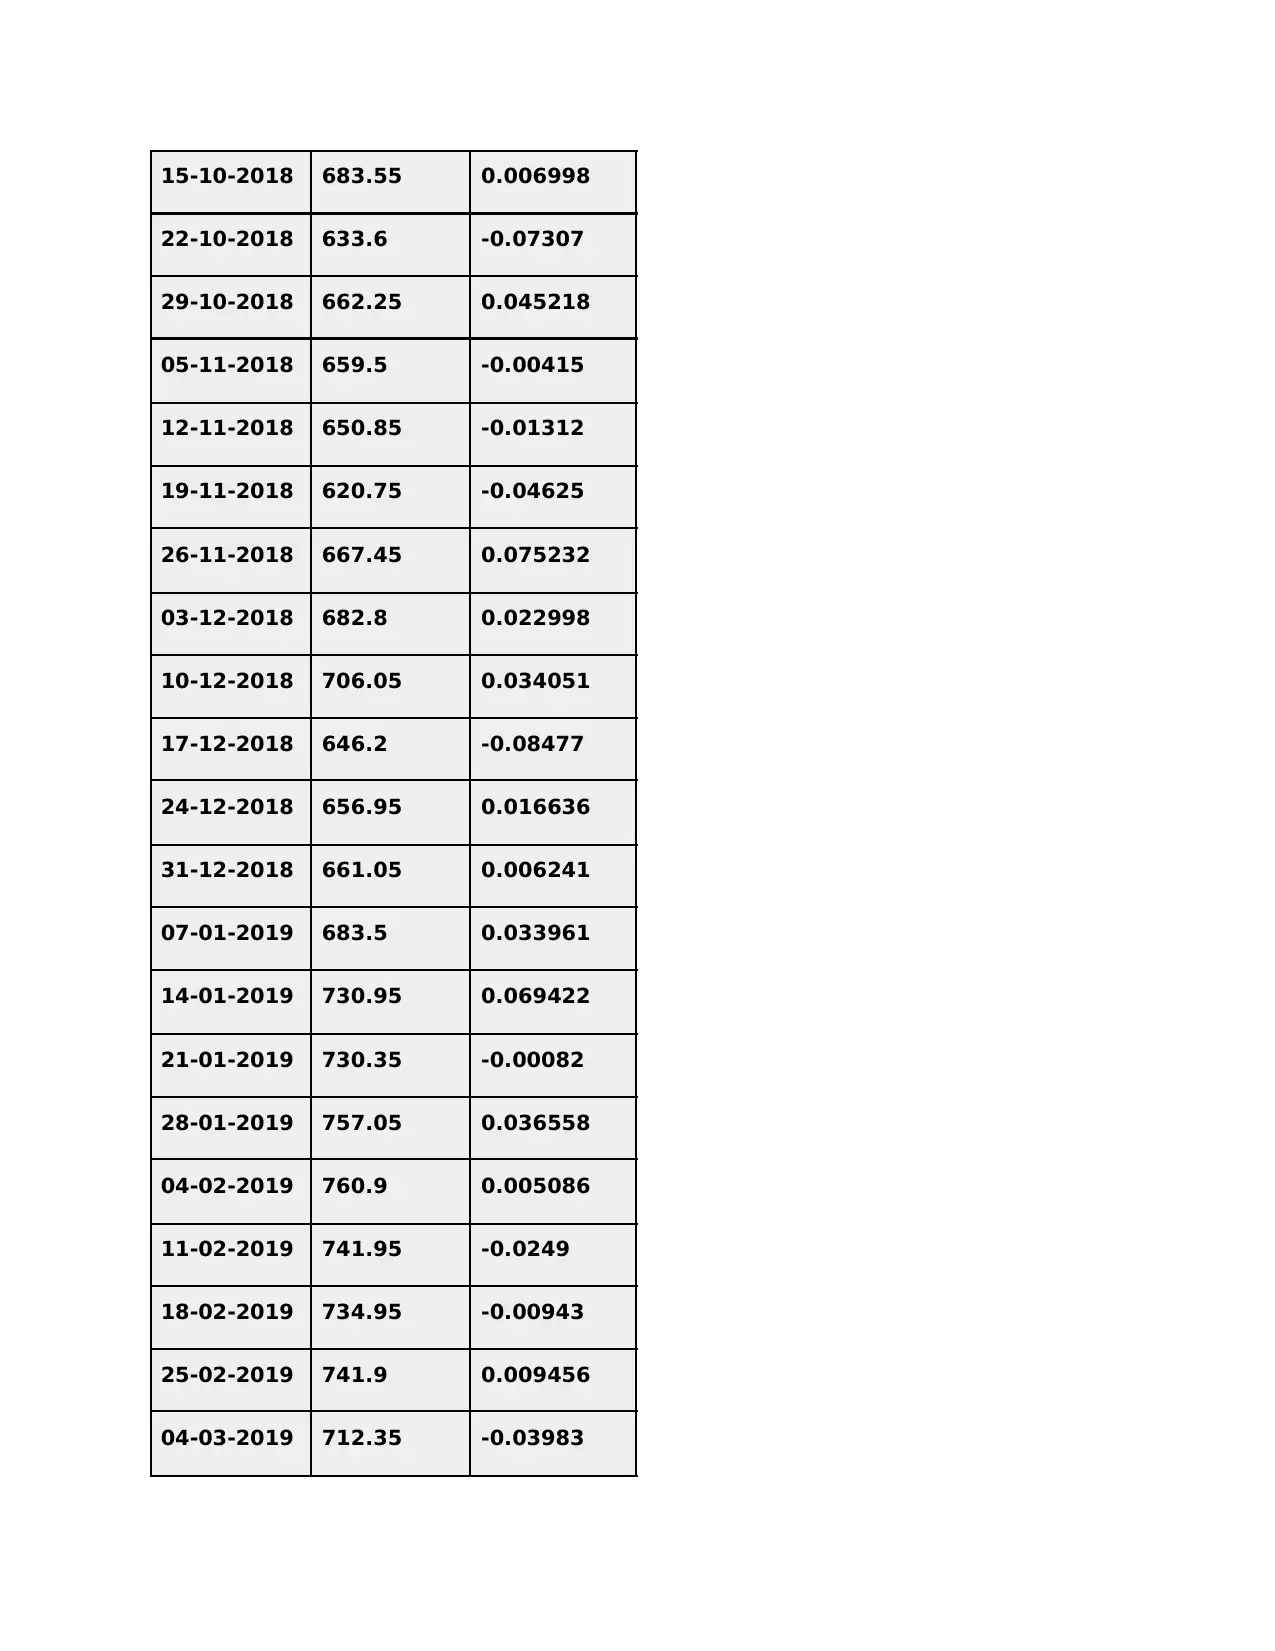
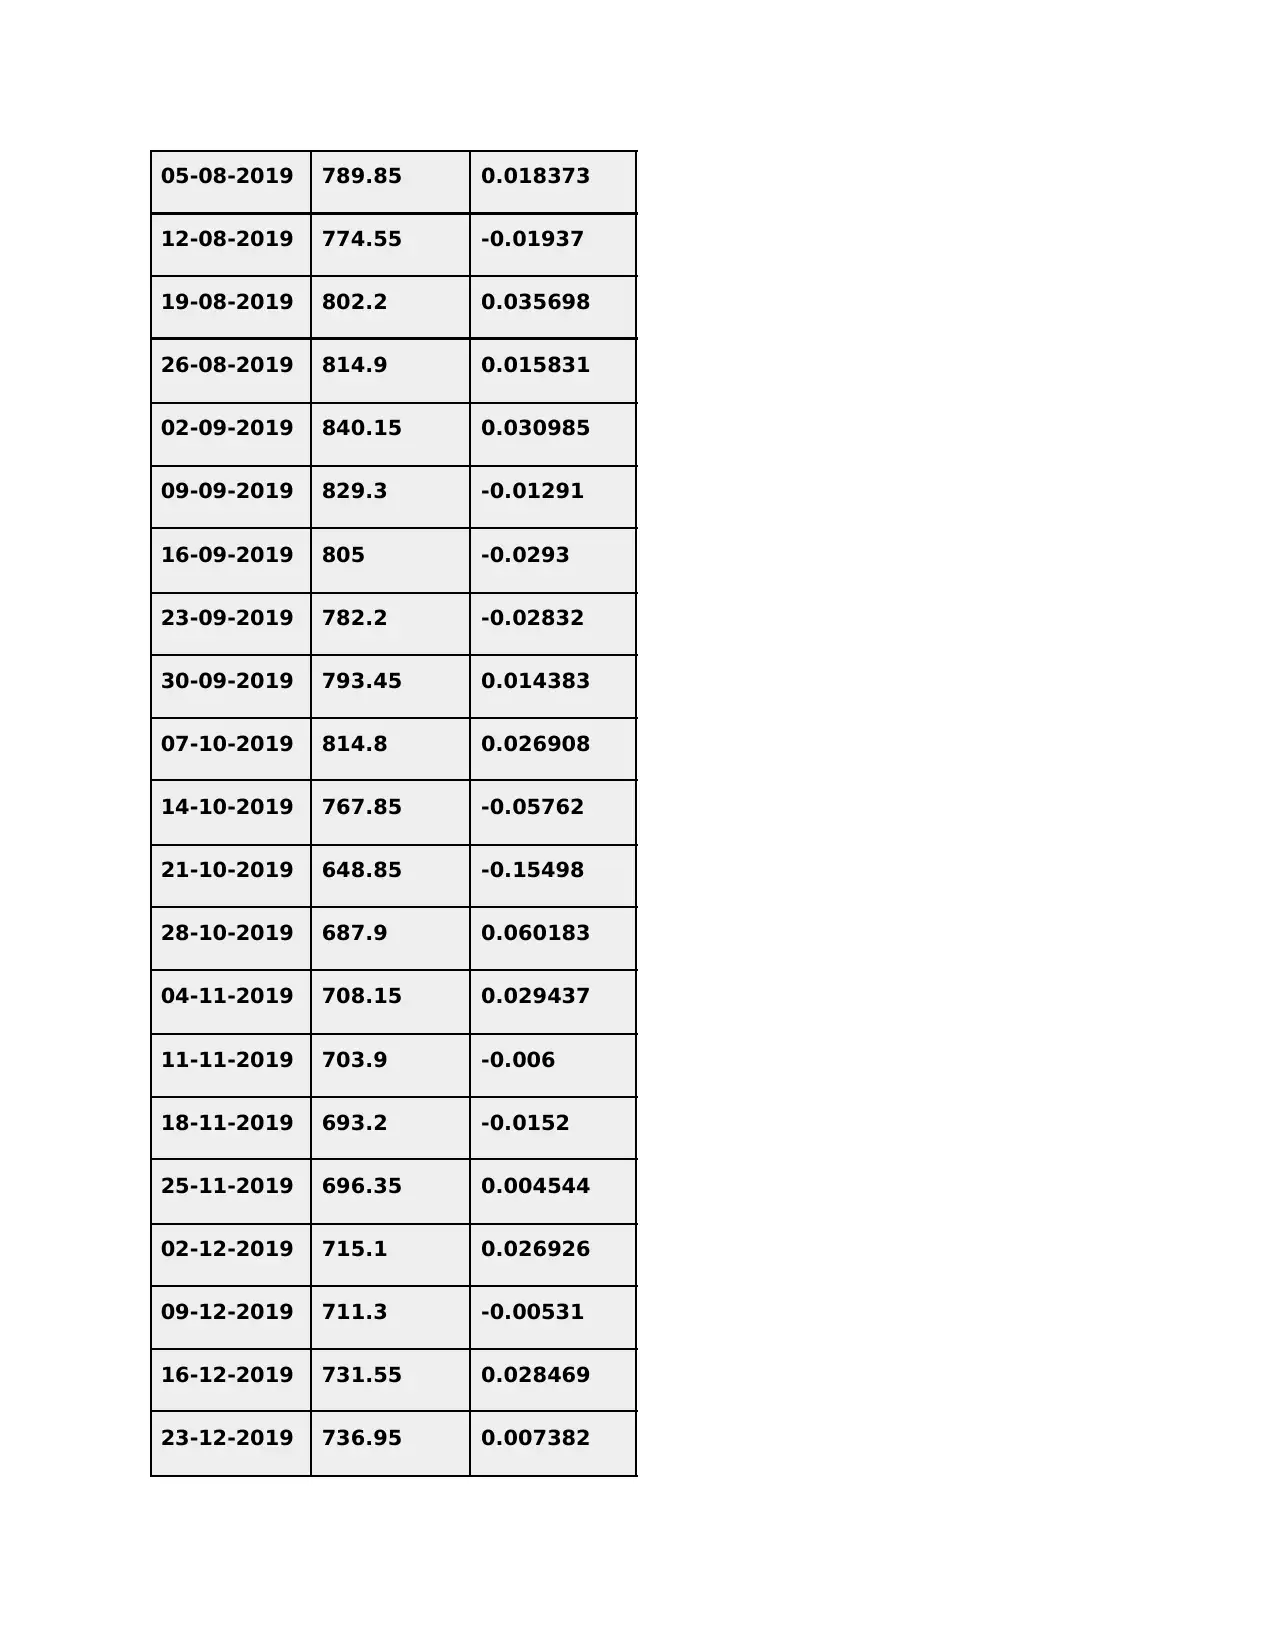
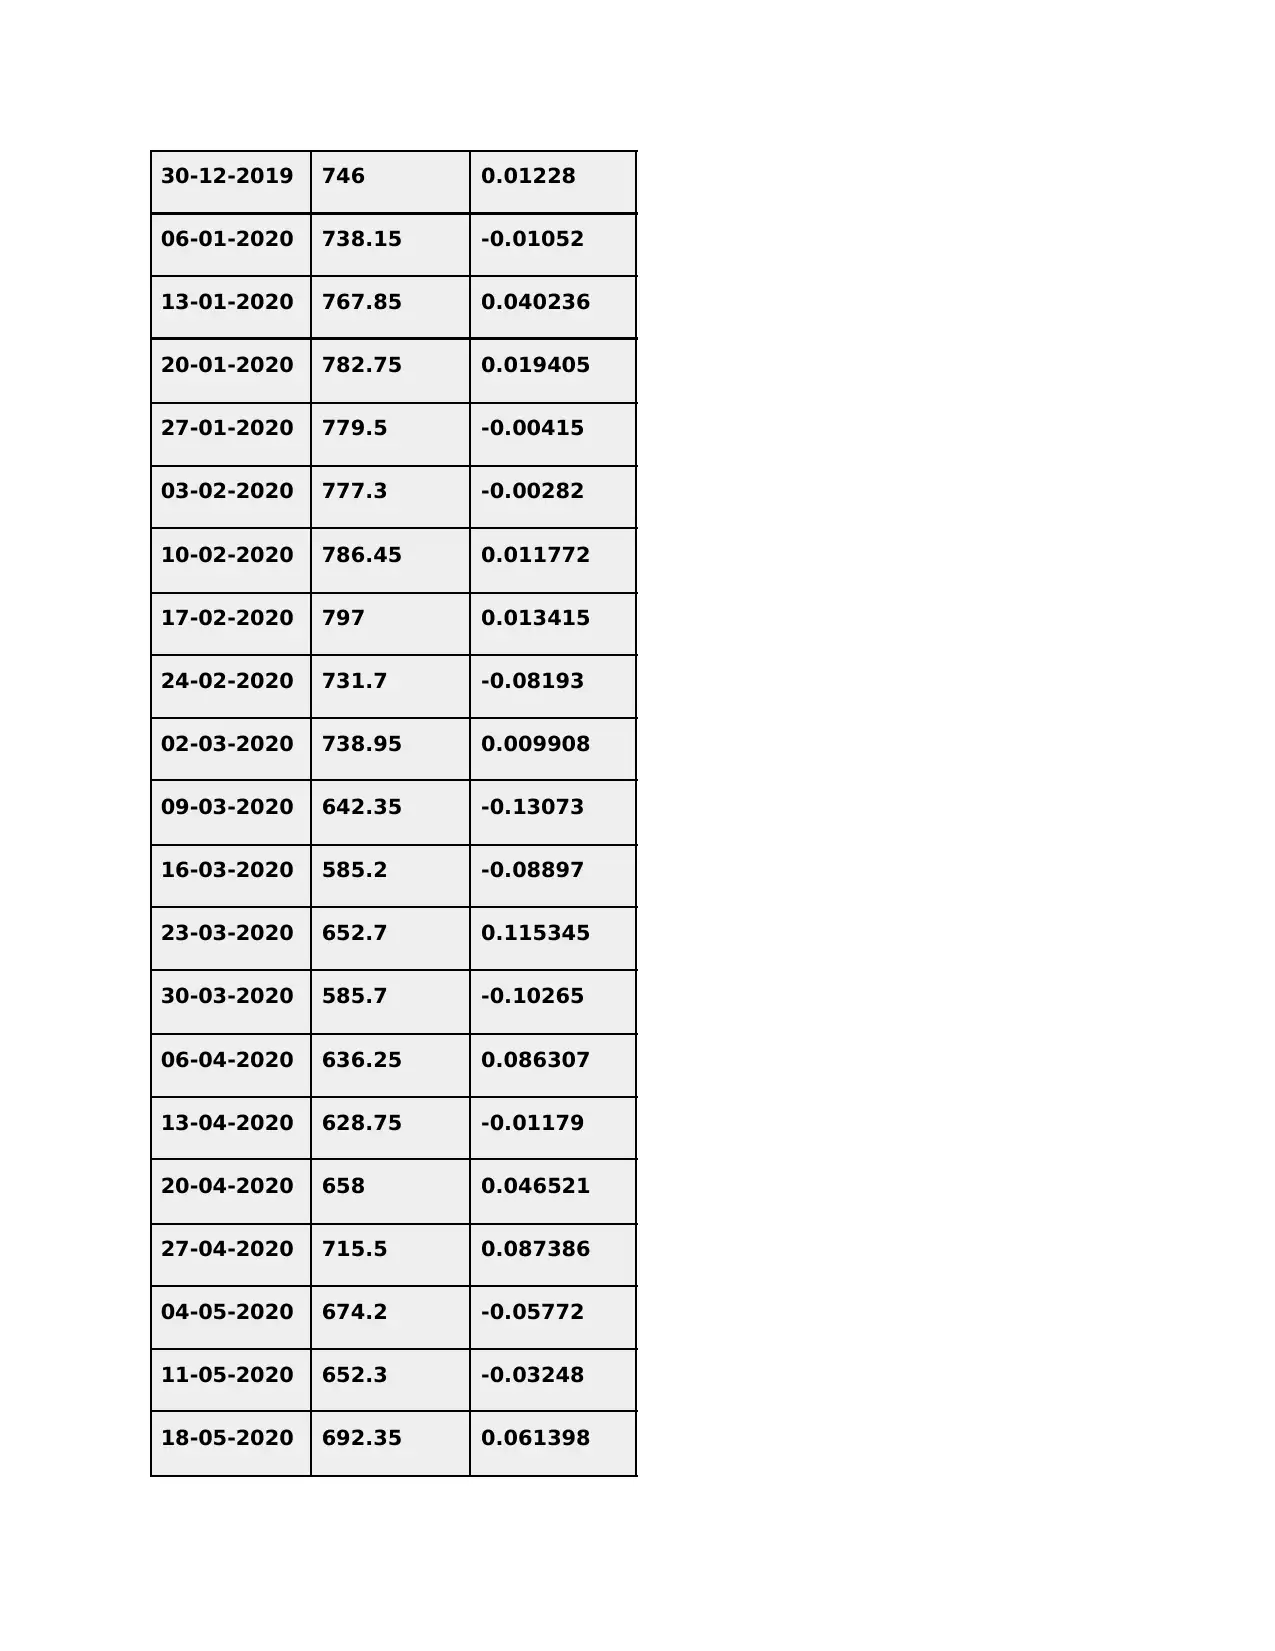
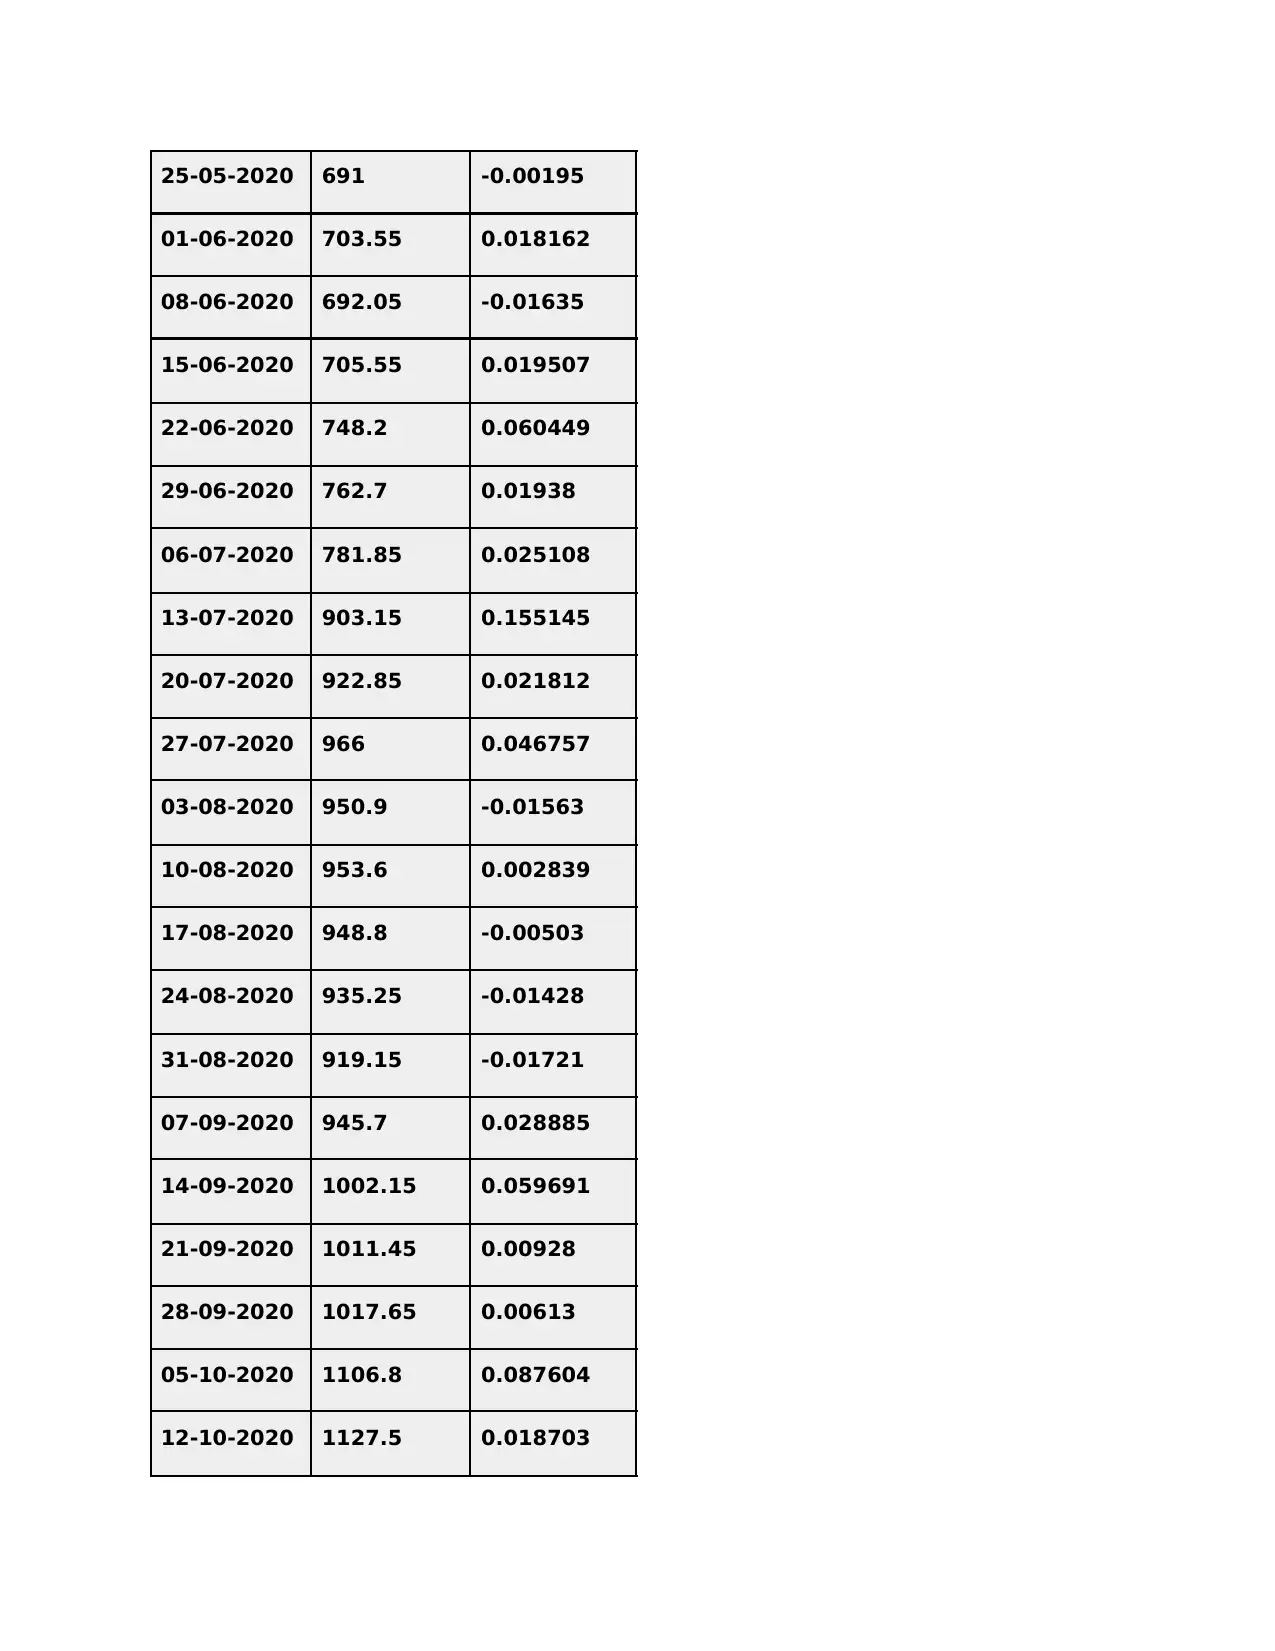
Weekly Share Price Movement of Infosys
Date Close Returns
28-03-2016 602.725
04-04-2016 582.875 -0.03293
11-04-2016 586.35 0.005962
18-04-2016 605.625 0.032873
25-04-2016 604.05 -0.0026
02-05-2016 590.75 -0.02202
09-05-2016 603.625 0.021794
23-05-2016 623.75 0.038199
30-05-2016 633.45 0.015551
06-06-2016 590.3 -0.06812
13-06-2016 589.75 -0.00093
20-06-2016 597.275 0.01276
27-06-2016 586.2 -0.01854
04-07-2016 579.1 -0.01211
11-07-2016 536.275 -0.07395
18-07-2016 536.225 -9.3E-05
25-07-2016 536.925 0.001305
01-08-2016 534 -0.00545
08-08-2016 531.275 -0.0051
15-08-2016 510.65 -0.03882
22-08-2016 510.125 -0.00103
29-08-2016 515.925 0.01137
05-09-2016 517.75 0.003537
12-09-2016 530.075 0.023805
19-09-2016 521.275 -0.0166
26-09-2016 518.025 -0.00623
03-10-2016 506.275 -0.02268
You're viewing a preview
Unlock full access by subscribing today!
17-10-2016 519.15 0.010855
24-10-2016 498.75 -0.0393
31-10-2016 485.5 -0.02657
07-11-2016 460.775 -0.05093
14-11-2016 460 -0.00168
21-11-2016 488.75 0.0625
28-11-2016 482.25 -0.0133
05-12-2016 494.675 0.025765
12-12-2016 502.575 0.01597
19-12-2016 494.225 -0.01661
26-12-2016 505.3 0.022409
02-01-2017 486.125 -0.03795
09-01-2017 487.9 0.003651
16-01-2017 474.35 -0.02777
23-01-2017 471.075 -0.0069
30-01-2017 468.05 -0.00642
06-02-2017 484.15 0.034398
13-02-2017 500.05 0.032841
20-02-2017 504.425 0.008749
27-02-2017 515.6 0.022154
Paraphrase This Document

13-03-2017 520.15 0.018056
20-03-2017 515.7 -0.00856
27-03-2017 511.125 -0.00887
03-04-2017 490.775 -0.03981
10-04-2017 465.7 -0.05109
17-04-2017 461.85 -0.00827
24-04-2017 459.475 -0.00514
01-05-2017 465.75 0.013657
08-05-2017 482.125 0.035158
15-05-2017 478.975 -0.00653
22-05-2017 497.85 0.039407
29-05-2017 484.725 -0.02636
05-06-2017 474.3 -0.02151
12-06-2017 470.125 -0.0088
19-06-2017 471.625 0.003191
26-06-2017 467.775 -0.00816
03-07-2017 467.7 -0.00016
10-07-2017 486.025 0.039181
17-07-2017 490.05 0.008281
24-07-2017 498.675 0.0176
07-08-2017 493.85 0.004015
14-08-2017 461.625 -0.06525
21-08-2017 456.075 -0.01202
28-08-2017 459.975 0.008551
04-09-2017 442.15 -0.03875
11-09-2017 454.125 0.027084
18-09-2017 449.15 -0.01096
25-09-2017 449.95 0.001781
02-10-2017 460.075 0.022502
09-10-2017 465.05 0.010813
16-10-2017 463.475 -0.00339
23-10-2017 473.175 0.020929
30-10-2017 463.325 -0.02082
06-11-2017 481.025 0.038202
13-11-2017 485.475 0.009251
20-11-2017 504.775 0.039755
27-11-2017 479.4 -0.05027
04-12-2017 500.925 0.0449
11-12-2017 511.45 0.021011
18-12-2017 519.675 0.016082
You're viewing a preview
Unlock full access by subscribing today!
01-01-2018 506 -0.02884
08-01-2018 539.225 0.065662
15-01-2018 571.725 0.060272
22-01-2018 587.7 0.027942
29-01-2018 571.625 -0.02735
05-02-2018 554.575 -0.02983
12-02-2018 564.025 0.01704
19-02-2018 577.825 0.024467
26-02-2018 580.375 0.004413
05-03-2018 581.7 0.002283
12-03-2018 585.95 0.007306
19-03-2018 583.8 -0.00367
26-03-2018 565.9 -0.03066
02-04-2018 563.5 -0.00424
09-04-2018 585.725 0.039441
16-04-2018 589.225 0.005976
23-04-2018 592.6 0.005728
30-04-2018 586.55 -0.01021
07-05-2018 590.375 0.006521
14-05-2018 591.6 0.002075
Paraphrase This Document
28-05-2018 610.4 -0.00611
04-06-2018 630.025 0.032151
11-06-2018 640.625 0.016825
18-06-2018 623.925 -0.02607
25-06-2018 653.6 0.047562
02-07-2018 642.125 -0.01756
09-07-2018 658.7 0.025813
16-07-2018 674.05 0.023303
23-07-2018 686.725 0.018804
30-07-2018 682.05 -0.00681
06-08-2018 692.725 0.015651
13-08-2018 715.175 0.032408
20-08-2018 689.15 -0.03639
27-08-2018 720.55 0.045563
03-09-2018 732.8 0.017001
10-09-2018 733.7 0.001228
17-09-2018 705.3 -0.03871
24-09-2018 730.05 0.035091
01-10-2018 724.6 -0.00747
08-10-2018 678.8 -0.06321
22-10-2018 633.6 -0.07307
29-10-2018 662.25 0.045218
05-11-2018 659.5 -0.00415
12-11-2018 650.85 -0.01312
19-11-2018 620.75 -0.04625
26-11-2018 667.45 0.075232
03-12-2018 682.8 0.022998
10-12-2018 706.05 0.034051
17-12-2018 646.2 -0.08477
24-12-2018 656.95 0.016636
31-12-2018 661.05 0.006241
07-01-2019 683.5 0.033961
14-01-2019 730.95 0.069422
21-01-2019 730.35 -0.00082
28-01-2019 757.05 0.036558
04-02-2019 760.9 0.005086
11-02-2019 741.95 -0.0249
18-02-2019 734.95 -0.00943
25-02-2019 741.9 0.009456
04-03-2019 712.35 -0.03983
You're viewing a preview
Unlock full access by subscribing today!

18-03-2019 743.1 0.034166
25-03-2019 743.85 0.001009
01-04-2019 759.3 0.02077
08-04-2019 747.75 -0.01521
15-04-2019 717.05 -0.04106
22-04-2019 738 0.029217
29-04-2019 723.6 -0.01951
06-05-2019 716.85 -0.00933
13-05-2019 723.9 0.009835
20-05-2019 709.2 -0.02031
27-05-2019 737.75 0.040257
03-06-2019 739.1 0.00183
10-06-2019 740.45 0.001827
17-06-2019 750.2 0.013168
24-06-2019 732 -0.02426
01-07-2019 718 -0.01913
08-07-2019 726.75 0.012187
15-07-2019 785.4 0.080702
22-07-2019 787 0.002037
29-07-2019 775.6 -0.01449
Paraphrase This Document
12-08-2019 774.55 -0.01937
19-08-2019 802.2 0.035698
26-08-2019 814.9 0.015831
02-09-2019 840.15 0.030985
09-09-2019 829.3 -0.01291
16-09-2019 805 -0.0293
23-09-2019 782.2 -0.02832
30-09-2019 793.45 0.014383
07-10-2019 814.8 0.026908
14-10-2019 767.85 -0.05762
21-10-2019 648.85 -0.15498
28-10-2019 687.9 0.060183
04-11-2019 708.15 0.029437
11-11-2019 703.9 -0.006
18-11-2019 693.2 -0.0152
25-11-2019 696.35 0.004544
02-12-2019 715.1 0.026926
09-12-2019 711.3 -0.00531
16-12-2019 731.55 0.028469
23-12-2019 736.95 0.007382
06-01-2020 738.15 -0.01052
13-01-2020 767.85 0.040236
20-01-2020 782.75 0.019405
27-01-2020 779.5 -0.00415
03-02-2020 777.3 -0.00282
10-02-2020 786.45 0.011772
17-02-2020 797 0.013415
24-02-2020 731.7 -0.08193
02-03-2020 738.95 0.009908
09-03-2020 642.35 -0.13073
16-03-2020 585.2 -0.08897
23-03-2020 652.7 0.115345
30-03-2020 585.7 -0.10265
06-04-2020 636.25 0.086307
13-04-2020 628.75 -0.01179
20-04-2020 658 0.046521
27-04-2020 715.5 0.087386
04-05-2020 674.2 -0.05772
11-05-2020 652.3 -0.03248
18-05-2020 692.35 0.061398
You're viewing a preview
Unlock full access by subscribing today!
01-06-2020 703.55 0.018162
08-06-2020 692.05 -0.01635
15-06-2020 705.55 0.019507
22-06-2020 748.2 0.060449
29-06-2020 762.7 0.01938
06-07-2020 781.85 0.025108
13-07-2020 903.15 0.155145
20-07-2020 922.85 0.021812
27-07-2020 966 0.046757
03-08-2020 950.9 -0.01563
10-08-2020 953.6 0.002839
17-08-2020 948.8 -0.00503
24-08-2020 935.25 -0.01428
31-08-2020 919.15 -0.01721
07-09-2020 945.7 0.028885
14-09-2020 1002.15 0.059691
21-09-2020 1011.45 0.00928
28-09-2020 1017.65 0.00613
05-10-2020 1106.8 0.087604
12-10-2020 1127.5 0.018703
Paraphrase This Document
26-10-2020 1060.6 -0.05514
02-11-2020 1112.75 0.04917
09-11-2020 1133.45 0.018603
16-11-2020 1103.35 -0.02656
23-11-2020 1100 -0.00304
30-11-2020 1134.65 0.0315
07-12-2020 1163.2 0.025162
14-12-2020 1189.8 0.022868
21-12-2020 1236.05 0.038872
28-12-2020 1260.45 0.01974
04-01-2021 1312.1 0.040977
11-01-2021 1344.95 0.025036
18-01-2021 1340.85 -0.00305
25-01-2021 1239.05 -0.07592
01-02-2021 1272.1 0.026674
08-02-2021 1309.8 0.029636
15-02-2021 1291.3 -0.01412
22-02-2021 1253.3 -0.02943
01-03-2021 1316.7 0.050586
08-03-2021 1374.85 0.044163
22-03-2021 1336.2 -0.00614
29-03-2021 1368.05 0.023836
You're viewing a preview
Unlock full access by subscribing today!
Related Documents


Your All-in-One AI-Powered Toolkit for Academic Success.
+13062052269
info@desklib.com
Available 24*7 on WhatsApp / Email
![[object Object]](/_next/static/media/star-bottom.7253800d.svg)
© 2024 | Zucol Services PVT LTD | All rights reserved.