Perceived Fairness, Emotions, and Intention of Fast Food Chain Restaurants Customers in Indonesia
VerifiedAdded on 2023/01/24
|26
|13577
|60
AI Summary
This study aims to investigate interrelationships among perceived service fairness, emotions, and behavioral intentions in a fast food chain restaurant context. The study uses purposive sampling and the survey method to generate a sample of 800 respondents from big cities in Indonesia. The data are analyzed using Structural Equation Modeling (SEM). The results show different roles for each fairness perception in relation to peoples’ emotions and behavioral intentions, based on the Mehrabian-Russel model.
Contribute Materials
Your contribution can guide someone’s learning journey. Share your
documents today.
229
Gadjah Mada International Journal of Business– May-August, Vol. 20, No. 2, 2018
Gadjah Mada International Journal of Business
Vol. 20, No. 2 (May-August 2018): 229-253
* Corresponding author’s e-mail: hetyvirgo89@gmail.com
ISSN: 1141-1128
http://journal.ugm.ac.id/gamaijb
Perceived Fairness, Emotions, and Intention
of Fast Food Chain Restaurants Customers
in Indonesia
Hety Budiyanti,1* andShine Pintor Siolemba Patiro2
1 State University Makassar, Indonesia
2 Facilitator of HR Development Board Central Sulawesi Province, Indonesia
Abstract: This study aims to investigate interrelationships among perceived service fairne
and behavioral intentions in a fast food chain restaurant context. we use terms that are co
the study of fairness or justice perception. This study uses purposive sampling and the su
generate our sample which consists of 800 respondents from big cities in Indonesia, name
Semarang, Surabaya, Medan, and Makassar. The data are analyzed using Structural Equa
(SEM). The results show different roles for each fairness perception in relation to peoples’
behavioral intentions, based on the Mehrabian-Russel model. Three fairness variables (pri
come fairness and interactional fairness) have positive and significant effects on customer
tions, while, procedural fairness does not influence the formation of a positive emotion. Fu
positive emotion has a positive influence on a customer’s behavioral intention. Data collec
are limited to the context of the restaurant industry, therefore, precaution must be taken
ing these results to other industries. The results of this study can serve as guidelines for m
restaurant industry to develop effective and efficient strategies for ensuring their services
ness and its impact on both customers’ retention rates and the companies’ financial gains.
Keywords:behavioral intention; emotions; service fairness; structural equation mode
JEL classification: C3, M31, M39
Secure Best Marks with AI Grader
Need help grading? Try our AI Grader for instant feedback on your assignments.
BudiyantiandPatiro
230
Introduction
Over the last decade, fairness principles
(distributive fairness, procedural fairness, and
interactional fairness) have been applied to
numerous studies such as management, psy-
chology, and organizational attitudes (Azar
and Darvishi 2011; Blader et al. 2013), as
well as legal and political studies (i.e. Zmerli
and Castillo 2015). For example, Azarand
Darvishi (2011) created a measure for
organisational fairness based on the fairness
theory from Folger and Cropanzano (1998),
where they measure organizational fairness
based on fairnesses’ perception. They show
that the use of a different measurement for
organisational fairness will produce a differ-
ent result.
Academics and practitioners’ interest in
conceptualizing service fairness has increased
along with the development of service mar-
keting literature (Aggarwal and Larrick
2012). The studies by Heo and Lee (2011),
Liang et al. (2017), Wang et al. (2018) all show
that when customers are aware of any devia-
tion from the fairness principles, it may trig-
ger a perception of unfairness. Moreover, con-
sumers’ individual characteristics will influ-
ence their perception of fairness depending
on what they experience. In line with these
studies, Aggarwal and Larrick (2012) show
that consumers’ responses toward perceived
interactional fairness are contingent on the
form of their social relationship (communal
and exchange), including the conditon of per-
ceived distributive fairness. Linking its effects
on emotions and attitudes, Smith and Bolton
(2002) argue that customers are involved in
a psychological contract with the service pro-
vider who gratifies their needs and treats them
fairly (Chalmers 2016). When a service pro-
vider neglects fairness when providing a ser-
vice to their customers, it may create a nega-
tive emotion among the customers, which
could lead them to boycott the service pro-
vider, or make public their unpleaseant ex-
perience (Kaura et al. 2015; Liang et al. 2017;
Liu et al. 2017)
For customers, fairness and quality ser-
vice are inseparable points (Sekhon et al.
2016). Fairness is not merely one dimension
of service, rather, it embraces all the dimen-
sions of good quality service (Aggarwal and
Larrick 2012; Naquin et al. 2015). Giovanis
et al. (2015) and Nikbin et al. (2016) argue
that poor service is not a service that equates
with low quality service, it is a distinct phe-
nomenon. In relation to the quality of ser-
vice, the fairness principle offers a specific
framework to understand the process of a
service’s consumption related to it’s fairness,
and this may be use as a substantial compo-
nent in evaluating the service (Cropanzano
et al. 2008; Heo and Lee 2011). Therefore, it
is worthwhile studying the appropriateness of
fairness as one of the instruments when
evaluating any service (Aggarwal and Larrick
2012).
It has been widely recognized that con-
siderations regarding fairness elicit emotional
responses, particularly, when unfairness oc-
curs (Cohen-Charash and Spector 2001;
Barclay et al. 2005) and finally lead to be-
havioral reactions such as complaints, nega-
tive word-of-mouth recommendations, or
support (Adams 1966). Furthermore, despite
previous fairness theory and other studies
having shown that emotion forms a part of
the relationship between experiencing unfair-
ness and wanting to retaliate, there are only a
few studies that have tested the relationship
between fairness, emotion, and behavioral
intention (Cohen-Charash and Spector 2001;
Barclay et al. 2005).
231
Gadjah Mada International Journal of Business– May-August, Vol. 20, No. 2, 2018
For example, Cropanzano and Stein
(2009) show that organizational unfairness is
capable of influencing the ocurrence of em-
ployees’ negative emotions, which can lead
to their unethical behavior as a result of the
unfairness they experienced. Tzafrir and
Hareli (2009) conducted a study into the in-
fluence of organizational justice on the for-
mation of employees’ positive and negative
emotions when they receive a promotion.
Their study only focused on two variables of
organizational fairness, which were proce-
dural justice and distributive justice. Reuben
and van Winden (2010) argue that a per-
ceived unfairness by an individual will form
a perceived negative emotion (guilt and hu-
miliation) but has no consequence on the for-
mation of certain behavior. Radke et al.
(2013) studied the irrational behavior carried
out by individuals who experience depression
as a result of perceived unfairness towards
their negative emotions. They employed a
unidimensional fairness concept in their re-
search, aside from the fairness concept, which
comprised of procedural, distributive, and
interactional fairness. A study by Uludag
(2014) on the infuence of fairness toward
verbal and physical aggresion does not fully
explain the measure of the dimension of fair-
ness towards aggresion as a form of negative
emotion. Moreover, the study by Silva and
Caetano (2016) into organizational fairness
across different cultures shows that differ-
ences in the perception of an organization’s
members toward organizational fairness is
related to the culture where the organization
belongs. They state that the consequences that
arise from organizational unfairness are posi-
tive and negative emotions which are ex-
pressed by the employees both verbally and
nonverbally.
According to the previous studies, as
mentioned above, this study concluded that
those studies tended to be conducted in som
type of organizational setting and not in the
area of service hospitality organizations,
such as hotels or restaurants. The fairnes
concept used mostly in those studies is based
on the concept of the equity theory proposed
by Adams (1966); while this study uses t
fairness concept proposed by Seiders and
Berry (1998). Consumers perceive and asses
fairness or unfairness based on the situation
related to the potential of maximizing prof-
its by minimizing personal investment or sac
rifice (Chou et al. 2009). Therefore, accord-
ing to this study, the benefits received by cus
tomers and their sacrifices are related to the
actual context of the fairness theory (distribu
tive fairness, procedural fairness, and inte
actional fairness). Thus, this study hopes to
obtain a better understanding concerning
service’s fairness that captures all the va
ous service contexts based on consumers’
sacrifices and the benefits they receive. Mon
etary and time costs, which are associate
with the experience of customers’ consump-
tion, are consider as constructs representing
sacrifices made by customers, while product
(services non-interactions) and personnel (th
way customers are treated) obtained by cus-
tomers while consuming products or services
are consider as constructs representing cus-
tomers’ benefits.
In order to fill this research gap, thi
study proposes a theoretical model which re-
lates to service fairness, emotion, and behav
ioral intentions, and examines this empirical
in the context of the service industry, espe-
cially for restaurants. The definition of ser-
vice fairness used in this study is the service
fairness perception of customers related t
the service behavior of organizations or com
panies (Namkung and Jang 2010). The back-
ground of this study is the customers of fast-
food chain restaurants in Indonesia. Based o
BudiyantiandPatiro
232
the data from Euromonitor International: Fast
Food in Indonesia year 2016, there are 7,236
fast-food chain restaurants throughout Indo-
nesia, which are mainly located in the big cit-
ies. According to data from AAFC Kanada,
part of the Ministry of Farming and Agri-
food, in 2015, the fast-food chain industry in
Indonesia is predicted to grow at roughly
around 9.2 percent between 2015 and 2019.
Therefore, it is appropriate to select fast-food
restaurants for our study’s setting.
This study was conducted in the big cit-
ies in Indonesia, such as Jakarta, Semarang,
Surabaya, Medan, and Makassar, where some
of these fast-food chain restaurants are lo-
cated. The selection of research locations is
based on the areas that have high economic
growth and big populations. These fast-food
chain restaurants have always emphasized
they satisfy their customers with the quality
of their service.
Based on the previous discussions, the
main objectives of this study are to deter-
mine the relationship between service fair-
ness, emotions, and behavioral intentions,
and to discern the level of importance of each
dimension of service fairness in the context
of restaurant services, and to provide infor-
mation for fast-food chain restaurant entre-
preneurs to evaluate their service’s qualities
in terms of their service’s fairness.
Literature Review
The Effect of Fairness on Service
Marketing
Fairness is defined as an action which
is deemed appropriate from an individual’s
perception (Aggarwal and Larrick 2012). The
term fairness is often used with regard to the
ability to make unbiased, concrete and spe-
cific judgements about a particular case with-
out referring to one’s own fe elin gs
(Goldenberg et al. 2016; Faullant et al. 2017).
In connection with the marketing of
services, Bagozzi (1975) introduces the con-
cept of fairness/equity into the marketing
exchange theory. He examines the relation-
ship of fairness in the context of dyadic reci-
procity and the equality needed to maintain
the process of ongoing exchanges between
the customer and the marketer. Aggarwal and
Larrick (2012) and Blader et al. (2013) also
discuss the consumers’ perceptions of mar-
keting practices which are unfair, and so have
consequences
Seiders and Berry (1998) summarize
the relevant principles based on three catego-
ries of fairness (procedural, distributive, and
interactional) and show these principles are
appropriate for customers to assess the fair-
ness they have experienced. Aggarwal and
Larrick (2012) and Lee et al. (2013) also
found that three types of fairness are likely
to be relevant for background services, such
as those found in banks, medical facilities,
fast-food restaurants, and luxury restaurants,
and hence these may be used as a basis for
assessment by consumers.
The role of fairness in the context of
the recovery of service failures has also been
the focus of attention in many studies. Ac-
cording to Chou et al. (2009) the role of fair-
ness, in the context of the recovery of ser-
vice failures, is particulary significant for
some service industries, such as hairdressers,
restaurants or cafes, supermarkets, and banks.
By adding a moderating effect of loyalty, Hur
et al. (2014) found that both types of fair-
ness (distributive fairness and procedural fair-
ness), when performing recovery services,
have a significant influence on the reactions
of loyal customers. Although the principles
Secure Best Marks with AI Grader
Need help grading? Try our AI Grader for instant feedback on your assignments.
233
Gadjah Mada International Journal of Business– May-August, Vol. 20, No. 2, 2018
of fairness have provided a better under-
standing concerning the influence of fairness,
especially in the context of service failures
and service recovery, yet other areas of re-
search outside these two contexts are limited
and not well developed.
Mehrabian-Russell Model
This study is based on a model devel-
oped by Mehrabian and Russell (1974) for
environmental psychology. They proposed
that environmental stimuli (S) lead to an
emotional reaction (O) which, in turn, drives
consumers’ behavioral response (R), based on
the Stimulus–Organism–Response (S–O–R)
paradigm. They posited that consumers have
three emotional states in response to envi-
ronmental stimuli: Pleasure, arousal, and
dominance. According to their study, these
emotional responses result in two contrast-
ing behaviors: Approach or avoidance. Ap-
proach behavior involves a desire to stay,
explore, and affiliate with others in the envi-
ronment, whereas avoidance behavior in-
cludes escaping from the environment and
ignoring any communication attempts from
other people (Jang and Namkung 2009;
Namkung and Jang 2010). Using Mehrabian
and Russell’s model, many studies have been
conducted on the role of environmental
stimuli as a predictor of emotional responses,
such as pleasure or arousal, and as a predic-
tor of consumers’ behavior, such as the ex-
tra-time they spend in a store and their ac-
tual incremental spending (Jang and Namkung
2009).
Based on the Mehrabian-Russell model,
environmental stimuli will affect the individu-
als’ emotions and as a result will affect their
response in the form of approach or avoid-
ance (Namkung and Jang 2010). In their re-
search model, stimuli are the stimuli is lo-
cated externally from people and consist of
various elements of physical atmosphere.
Furthermore, the organism refers to structur
and internal processes which consequently
will intervene in the relationship between the
external stimuli of people and the attitud
being demonstrated or responded to. This
suggests that the impact of the stimuli o
human behavioral intentions is mediated by
emotion.
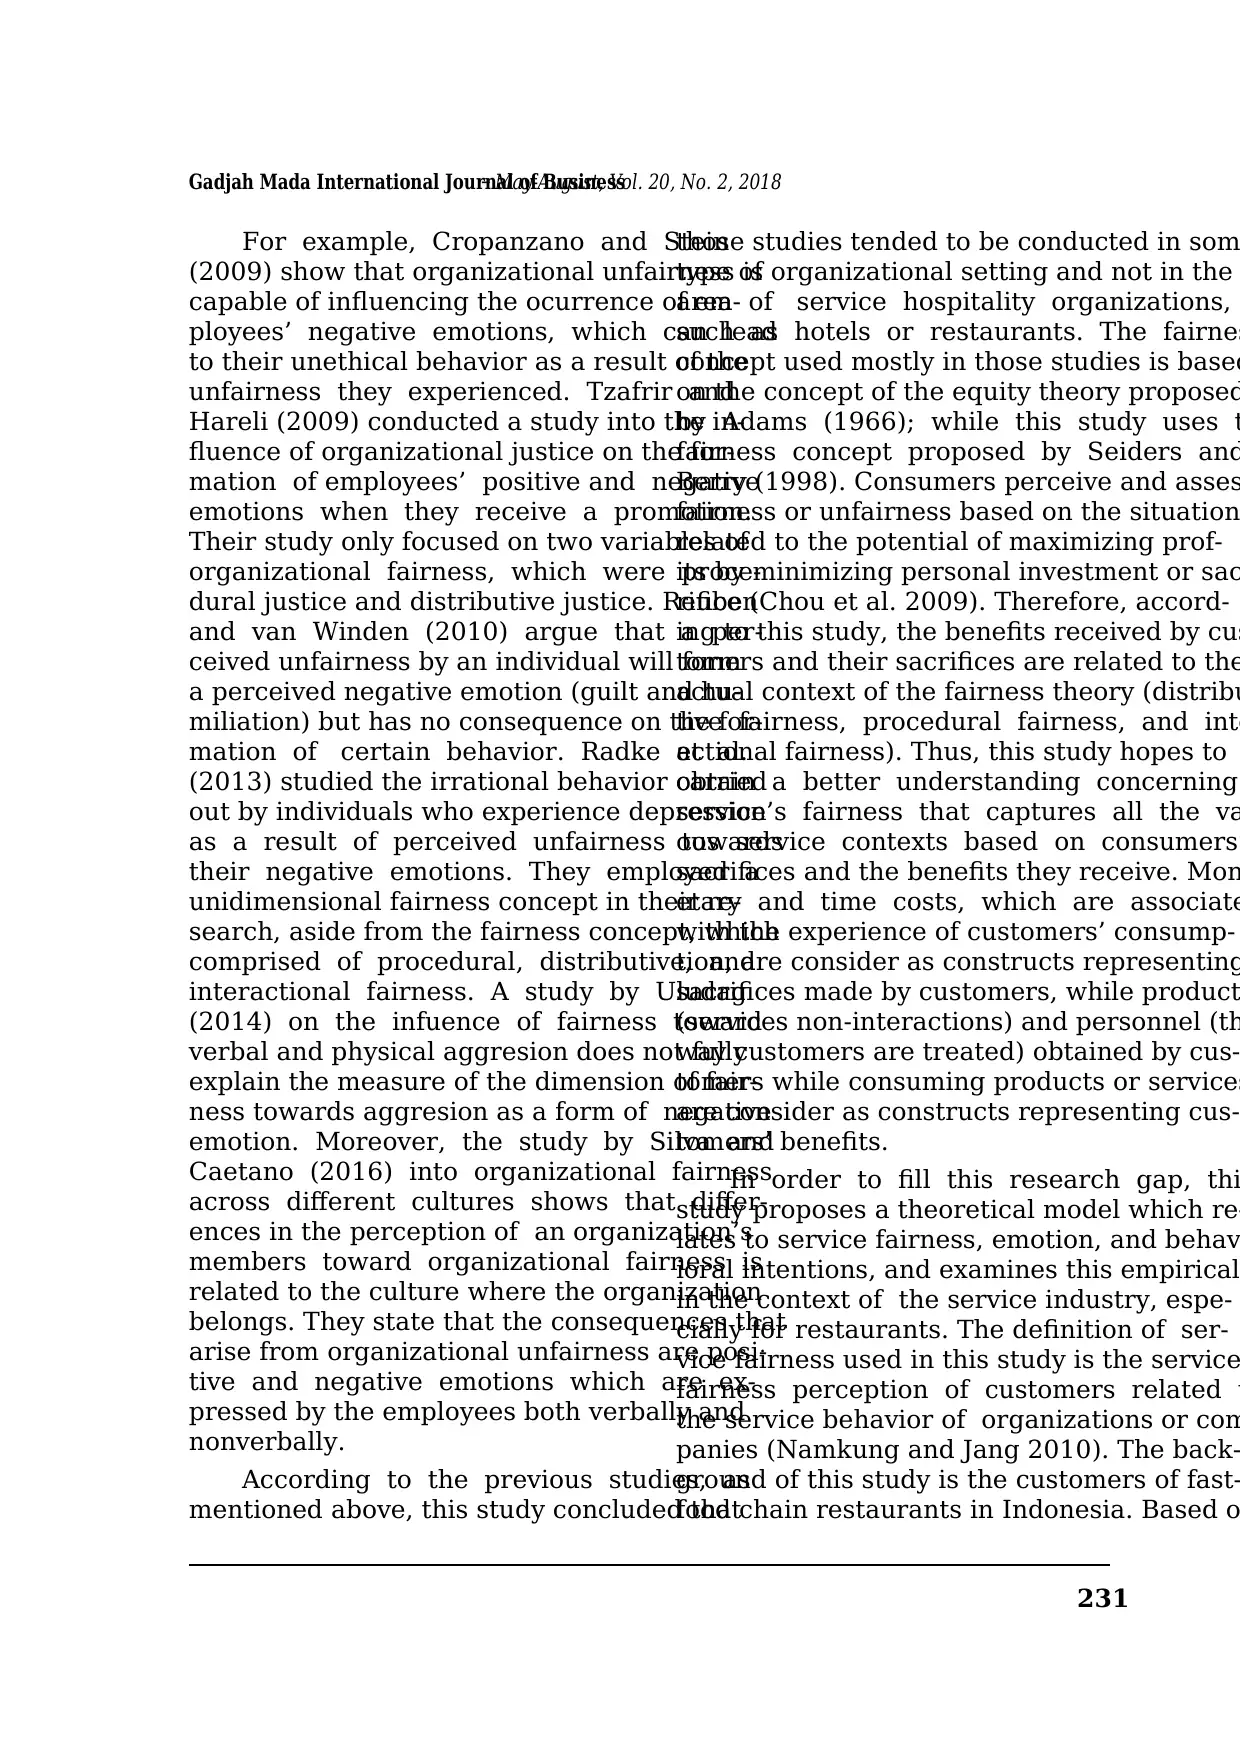
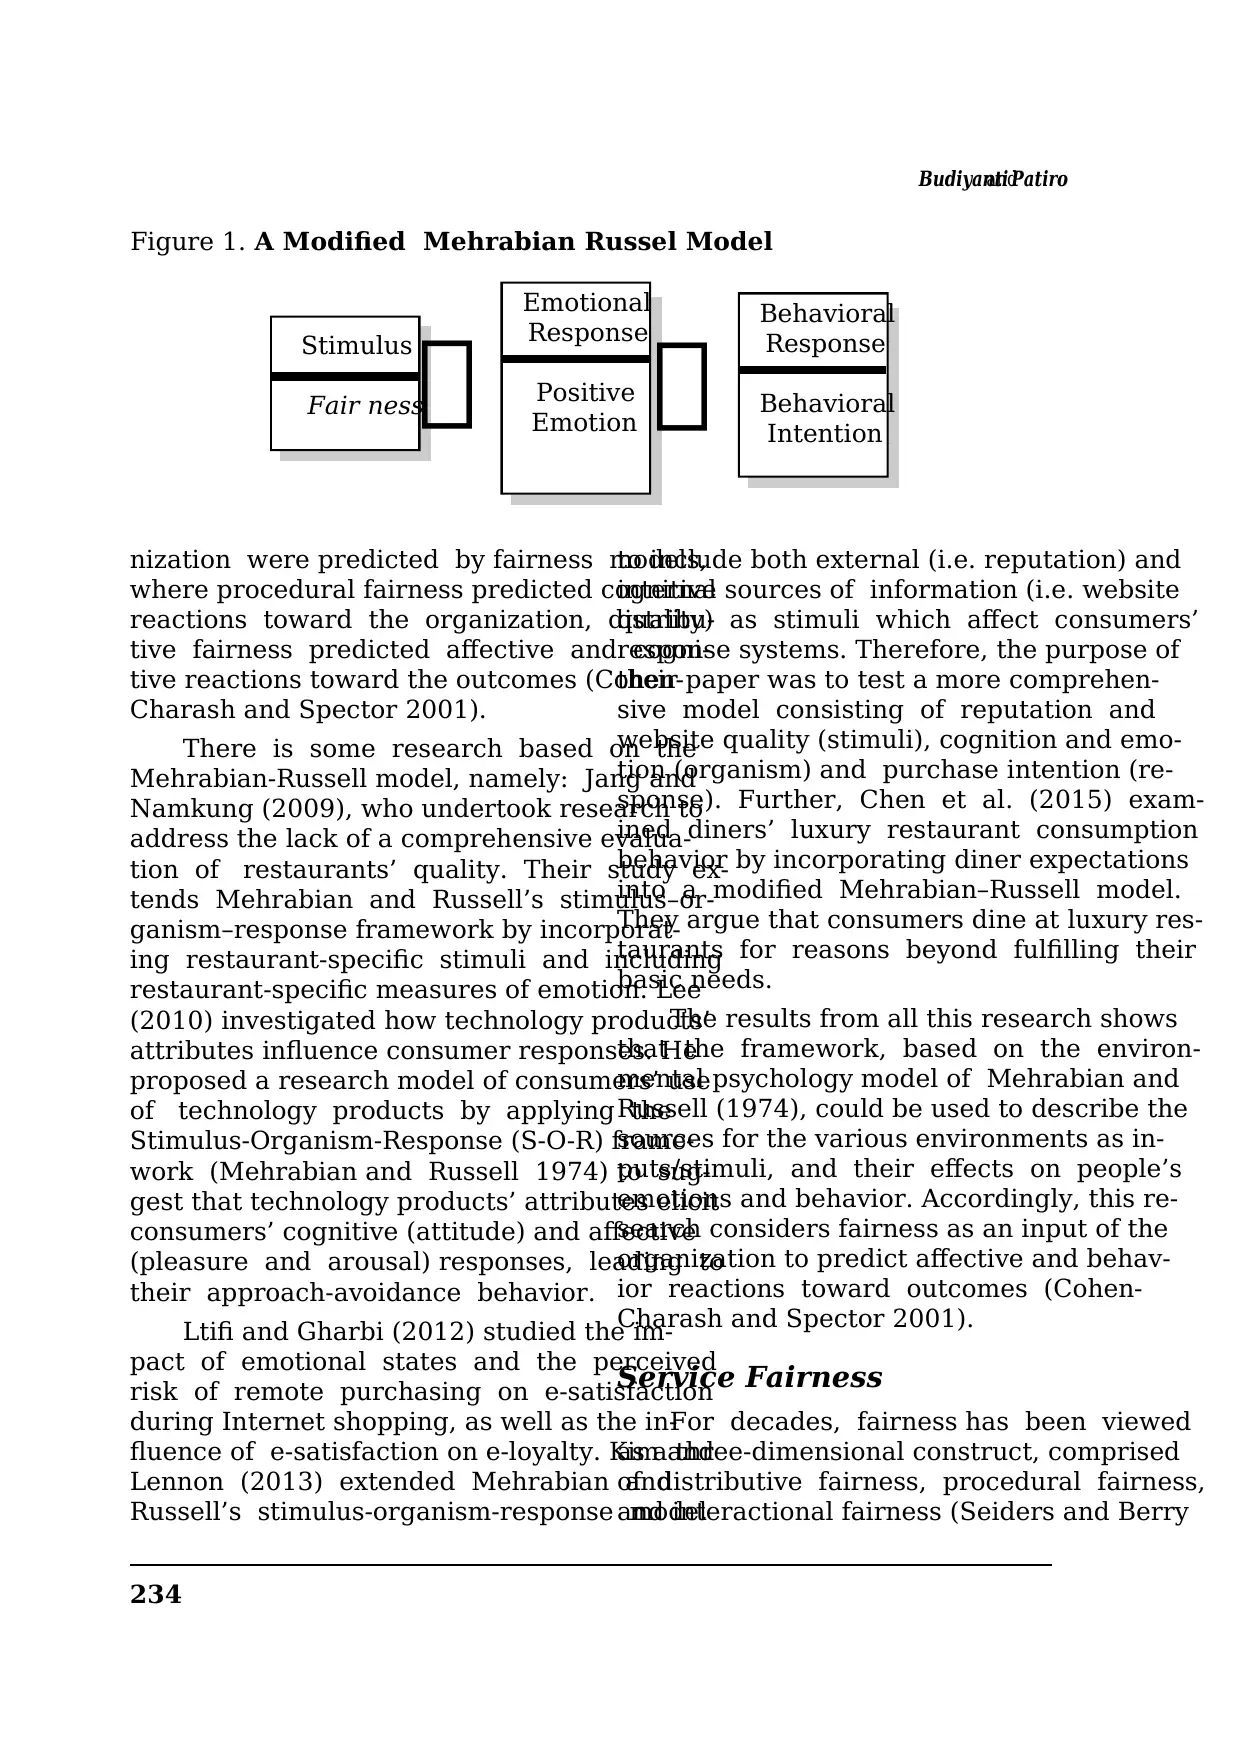
According to Mehrabian and Russell
(1974), there are three forms of emotion
namely: Pleasure, passion, and power. Fu
thermore, the response to the environment
can be classified as either an approach o
avoidance. Approach behavior includes such
things as: Desire to stay, observe the are
around you, explore the environment, and
communicate with others in the environment
Avoidance behavior is the opposite of ap
proach behavior. Our study applies the mode
of Mehrabian and Russell (1974) and modi-
fies it in accordance with the background of
this research (see Figure 1).
In line with Mehrabian and Russell
(1974), some justice researchers rely on the
social exchange theory to predict relation
tween perceived fairness and its outcome
(Cropanzano et al. 2007; Cropanzano et a
2008; Cropanzano and Stein 2009). The so-
cial exchange theory views organizations
arenas for long-term, mutual social transac-
tions between employees and their organiza-
tion (Cropanzano et al. 2007; Cropanzano et
al. 2008; Cropanzano and Stein 2009). Ju
tice is considered to be an input of the orga-
nization to the exchange relationship and
derives from either (a) the organization or (b
the direct supervisor (Cohen-Charash and
Spector 2001). Futhermore, according to
Cohen-Charash and Spector (2001), attitudi-
nal and affective reactions toward the orga-
Gadjah Mada International Journal of Business– May-August, Vol. 20, No. 2, 2018
of fairness have provided a better under-
standing concerning the influence of fairness,
especially in the context of service failures
and service recovery, yet other areas of re-
search outside these two contexts are limited
and not well developed.
Mehrabian-Russell Model
This study is based on a model devel-
oped by Mehrabian and Russell (1974) for
environmental psychology. They proposed
that environmental stimuli (S) lead to an
emotional reaction (O) which, in turn, drives
consumers’ behavioral response (R), based on
the Stimulus–Organism–Response (S–O–R)
paradigm. They posited that consumers have
three emotional states in response to envi-
ronmental stimuli: Pleasure, arousal, and
dominance. According to their study, these
emotional responses result in two contrast-
ing behaviors: Approach or avoidance. Ap-
proach behavior involves a desire to stay,
explore, and affiliate with others in the envi-
ronment, whereas avoidance behavior in-
cludes escaping from the environment and
ignoring any communication attempts from
other people (Jang and Namkung 2009;
Namkung and Jang 2010). Using Mehrabian
and Russell’s model, many studies have been
conducted on the role of environmental
stimuli as a predictor of emotional responses,
such as pleasure or arousal, and as a predic-
tor of consumers’ behavior, such as the ex-
tra-time they spend in a store and their ac-
tual incremental spending (Jang and Namkung
2009).
Based on the Mehrabian-Russell model,
environmental stimuli will affect the individu-
als’ emotions and as a result will affect their
response in the form of approach or avoid-
ance (Namkung and Jang 2010). In their re-
search model, stimuli are the stimuli is lo-
cated externally from people and consist of
various elements of physical atmosphere.
Furthermore, the organism refers to structur
and internal processes which consequently
will intervene in the relationship between the
external stimuli of people and the attitud
being demonstrated or responded to. This
suggests that the impact of the stimuli o
human behavioral intentions is mediated by
emotion.
According to Mehrabian and Russell
(1974), there are three forms of emotion
namely: Pleasure, passion, and power. Fu
thermore, the response to the environment
can be classified as either an approach o
avoidance. Approach behavior includes such
things as: Desire to stay, observe the are
around you, explore the environment, and
communicate with others in the environment
Avoidance behavior is the opposite of ap
proach behavior. Our study applies the mode
of Mehrabian and Russell (1974) and modi-
fies it in accordance with the background of
this research (see Figure 1).
In line with Mehrabian and Russell
(1974), some justice researchers rely on the
social exchange theory to predict relation
tween perceived fairness and its outcome
(Cropanzano et al. 2007; Cropanzano et a
2008; Cropanzano and Stein 2009). The so-
cial exchange theory views organizations
arenas for long-term, mutual social transac-
tions between employees and their organiza-
tion (Cropanzano et al. 2007; Cropanzano et
al. 2008; Cropanzano and Stein 2009). Ju
tice is considered to be an input of the orga-
nization to the exchange relationship and
derives from either (a) the organization or (b
the direct supervisor (Cohen-Charash and
Spector 2001). Futhermore, according to
Cohen-Charash and Spector (2001), attitudi-
nal and affective reactions toward the orga-
BudiyantiandPatiro
234
nization were predicted by fairness models,
where procedural fairness predicted cognitive
reactions toward the organization, distribu-
tive fairness predicted affective and cogni-
tive reactions toward the outcomes (Cohen-
Charash and Spector 2001).
There is some research based on the
Mehrabian-Russell model, namely: Jang and
Namkung (2009), who undertook research to
address the lack of a comprehensive evalua-
tion of restaurants’ quality. Their study ex-
tends Mehrabian and Russell’s stimulus–or-
ganism–response framework by incorporat-
ing restaurant-specific stimuli and including
restaurant-specific measures of emotion. Lee
(2010) investigated how technology products’
attributes influence consumer responses. He
proposed a research model of consumers’ use
of technology products by applying the
Stimulus-Organism-Response (S-O-R) frame-
work (Mehrabian and Russell 1974) to sug-
gest that technology products’ attributes elicit
consumers’ cognitive (attitude) and affective
(pleasure and arousal) responses, leading to
their approach-avoidance behavior.
Ltifi and Gharbi (2012) studied the im-
pact of emotional states and the perceived
risk of remote purchasing on e-satisfaction
during Internet shopping, as well as the in-
fluence of e-satisfaction on e-loyalty. Kim and
Lennon (2013) extended Mehrabian and
Russell’s stimulus-organism-response model
to include both external (i.e. reputation) and
internal sources of information (i.e. website
quality) as stimuli which affect consumers’
response systems. Therefore, the purpose of
their paper was to test a more comprehen-
sive model consisting of reputation and
website quality (stimuli), cognition and emo-
tion (organism) and purchase intention (re-
sponse). Further, Chen et al. (2015) exam-
ined diners’ luxury restaurant consumption
behavior by incorporating diner expectations
into a modified Mehrabian–Russell model.
They argue that consumers dine at luxury res-
taurants for reasons beyond fulfilling their
basic needs.
The results from all this research shows
that the framework, based on the environ-
mental psychology model of Mehrabian and
Russell (1974), could be used to describe the
sources for the various environments as in-
puts/stimuli, and their effects on people’s
emotions and behavior. Accordingly, this re-
search considers fairness as an input of the
organization to predict affective and behav-
ior reactions toward outcomes (Cohen-
Charash and Spector 2001).
Service Fairness
For decades, fairness has been viewed
as a three-dimensional construct, comprised
of distributive fairness, procedural fairness,
and interactional fairness (Seiders and Berry
Emotional
Response
Positive
Emotion
Behavioral
Response
Behavioral
Intention
Stimulus
Fair ness
Figure 1. A Modified Mehrabian Russel Model
235
Gadjah Mada International Journal of Business– May-August, Vol. 20, No. 2, 2018
1998; Cropanzano et al. 2008; Aggarwal and
Larrick 2012; Hur et al. 2014). Although the
principles of fairness developed in social psy-
chology may be useful in the contexts for
which they are developed, they may have
limitations when applied to specific con-
sumption situations. For example, Deutsch
(1985) criticizes the measurement capabili-
ties of the original theory of fairness, because
it is difficult for consumers to assess the in-
put and output values at the same time. Chou
et al. (2009) in their study also argued that
when equity is accounted for in the process
of changing inputs into outputs, with a cer-
tain outcome for a customer, it will create
problems with the operationalization of fair-
ness itself. Since there are conflicting views
about the dimensions of fairness, a consen-
sus is growing that the perception of fairness
is a dependent context, which is not only ap-
propriate for the service failure situation, but
it may also be applied in other situations
(Azar and Darvishi 2011; Aggarwal and
Larrick 2012; Blader et al. 2013).
According to Seiders and Berry (1998),
restaurant patrons who are dissatisfied with
the food served to them, due to its poor qual-
ity, which they believe is not equivalent with
the price they are paying, will question the
distributive fairness of the transaction. If
these patrons are kept waiting for a table de-
spite having a reservation, and also for food
and beverage service (once seated), they will
question the procedural fairness. Moreover,
if they experience insulting treatment or a
disrespectful attitude from the service staff,
they will also question the interactional fair-
ness. From the perspective of the customers’
sacrifice in consuming the product or service,
the price to be paid (price fairness) and time
spent (procedural fairness) are substantial
factors (Seiders and Berry 1998). In general,
price will appear in any situation, and in par-
ticular it is the magnitude of the econom
costs sacrificed in any transactions. Thus,
price fairness is defined as the customers
assessment of the difference between wha
they expect to receive and what they actually
receive (Kahneman et al. 1986). That is, con-
sumers generally have internal standards set
for the actual price, and compliance with
these standards will be verified when a judg-
ment is made as to whether it is equitable or
not.
The perception of fairness is the judg-
ment of whether or not customers accept an
outcome and/or a transaction process as be-
ing reasonable, acceptable, and just (Heo an
Lee 2011; Su et al. 2015; Su et al. 2016). Sin
assessments of price fairness are subjective
some studies have focused on consumers’
perceptions regarding relative prices (Haw
and Bearden 2006; Gielissen et al. 2008; Xia
et al. 2004). A study by Homburg et al. (2014
shows that the price stated in the menu may
be assessed differently by a customer, depen
ing on the stimulus (stimuli) provided by the
restaurant. Daskalopoulou (2008) found evi-
dence that a price’s fairness perception i
based on the acceptance level of the ind
vidual and the prevailing social standards. Th
concept of price in this study is different from
the concept of price from previous studies,
which stated that prices are fixed and abso-
lute (Kukar-Kinney et al. 2007). Thus, to
expand the understanding of consumers’ per
ceptions of prices’ fairness, this study pro
poses that the definition of price fairness is
the assessment of the overall consumers’
price based on a comparison between the
actual price and the acceptable price, accord
ing to social standards and conformance lev-
els (Homburg et al. 2014).
As one of the aspects of customers’
sacrifices, time is viewed as a limited resourc
(Croonen 2010; Liang et al. 2017; Chun et
Paraphrase This Document
Need a fresh take? Get an instant paraphrase of this document with our AI Paraphraser
BudiyantiandPatiro
236
al. 2018). Customers’ evaluations toward the
waiting process are not only altered objec-
tively but also subjectively (Azarand Darvishi
2011). When there are two customers who
assess time differently, but who are kept wait-
ing for the same duration, they will differ in
paying for the services they receieved (Blader
et al. 2013). In restaurants, the waiting time
derives from conditions which require extra
time, such as service preparation (i.e. how to
serve the food) or a level of demand beyond
the system’s capacity (i.e. customers arrive
when the requirement for service already ex-
ceeds the providers ability to accomodate it).
Thus, with regard to this discussion, the con-
cept of procedural fairness can be defined as
the accuracy of time and the efficiency of
the service system as a part of the custom-
ers’ sacrifice, since waiting time and delayed
service are categorized as drawbacks.
On its relationship with the benefits
perceived by customers, studies into fairness
show that fairness behavior, as demonstrated
by the service provider, is not only impor-
tant for the instrumental aspect, but also im-
portant for the relational aspe ct
(Namasivayam2004; Croonen 2010;
Azarand Darvishi 2011). Thus, service evalu-
ations by customers do not only come from
fairness, regarding the tangible outcome of
fairness, but also from the intagible outcome
of fairness, which is interactional fairness
(Hur et al. 2014). According to Gronroos
(2007) providing exceptional products and
service is one of the main interests of the
service business. However, he argues that
fairness regarding the perceived outcome of
fairness will affect the emotions of the cus-
tomers, and their behavioral intentions.
Furthermore, in restaurants there are
some human intearctions. Lee et al. (2013)
and Hur et al. (2014) define a service con-
tact as a period of time where customers di-
rectly interact with the service. The service
contact is the critical moment of truth when
customers often attain unforgettable impres-
sions concerning a business (Lee et al. 2013;
Hur et al. 2014). This condition only lasts
for a few minutes, and may satisfy the cus-
tomers, or frustrate them (Liang and Zhang
2011). Therefore, interactional fairness in this
study refers to the interest and respect shown
by service providers to customers, and as a
result, customers will feel that they are
treated fairly during the interaction (Aggarwal
and Larrick 2012). Thus, in general, our study
develops a model of fairness services con-
sisting of four variables of fairness, namely:
Price fairness, procedural fairness, outcome
fairness, and interactional fairness, all of
which will be tested empirically in the con-
text of restaurant service, specifically fast-
food chain restaurants.
The Effect of Price Fairness on
Positive Emotions
Positive and negative emotions felt dur-
ing the process of fairness may be character-
ized in various ways; they may stand alone
(positive or negative) or as a whole (positive
and negative); or they are experienced or ex-
pressed (Heo and Lee 2011; Lee et al. 2013).
Some studies of fairness also use the emo-
tional approach in isolation, which shows that
the perception of price unfairness is associ-
ated with feelings of disappointment or an-
ger (Xia et al. 2004; Xiaand Monroe 2010).
Similarly, in the study of social fairness, the
effect of procedural fairness on separated
emotional responses describes emotions of
happiness in the form of happiness, joy, and
feelings of pride, along with emotions of sad-
ness in the form of disappointment, anger,
and frustration (Barclay et al. 2005; Blader
et al. 2013). Based on the descriptions above,
the first hypothesis proposed in this study is:
237
Gadjah Mada International Journal of Business– May-August, Vol. 20, No. 2, 2018
H1: Perceived price fairness has a positive effect on
positive emotions
The Effect of Procedural Fairness
on Positive Emotions
Lind and Tyler (1988) argue that the
perceived fairness of outcomes was not only
considered as a determinant of perceived
organizational justice, but the perceived fair-
ness of the process in which the outcomes
were achieved was also considered to be im-
portant. In some cases, the fairness of the
process was considered to be the most im-
portant determinant of perceived organiza-
tional justice (Blader et al. 2013).
Futhermore, Hur et al. (2014) show that pro-
cedural justice, as the fairness of the process
in which outcomes are determined, is con-
sidered to exist when there are procedures
which embody certain types of normatively
accepted principles. Accordingly, when a pro-
cess leading to a certain outcome is perceived
to be unfair, a person’s reactions are predicted
to be directed at the service provider rather
than at the specific outcome in question
(Namkung and Jang 2010). Therefore, the
second hypothesis proposed in this study is:
H2: Perceived procedural fairness has a positive ef-
fect on positive emotions.
The Effect of Outcome Fairness on
Positive Emotions
Emotion is an individual’s reaction to
an event or stimulus (Cassar and Buttigieg
2015) and it is fundamentally a social phe-
nomenon (Tangney and Fischer 1995). So-
cial scientists acknowledge that issues of fair-
ness can lead to emotional reactions,
particulary when unfairness occurs. Adams
(1966) stated that when a violation of fair-
ness occurs, it will cause an individual to feel
unhappy, and he/she will try to eliminate that
negative feeling (Barclay and Skarlicki 2009
Homans (1961) also argues that when th
outcome gained is lower than what was ex-
pected, it will lead to resentment in the re-
cipient (Blader et al. 2013). In relation with
the scheme of positive emotions and nega-
tive emotions, Lazarus (1991) states that
positive emotions, such as pleasure or pride,
arise in situations where individuals’ need
are fulfiled. In contrast, negative emotion
such as shame and anger, arise when the ful
fillment of an individual’s need is blocke
(Cassar and Buttigieg 2015). Therefore, t
third hypothesis proposed in this study is:
H3: Perceived outcome fairness has a positive
on positive emotions.
The Effect of Interactional
Fairness on Positive Emotions
Liiand Sy (2009) found that failure in
the application of interactional fairness stan-
dards in service contacts will result in nega-
tive emotional responses (Cassar and
Buttigieg 2014). In the study of emotion in
the customer service area, Dube and Menon,
as cited in Swartz et al. (1998), illustrate the
importance of the role of socialization in the
formation of exchange relationships betwee
customers and service providers (Schlett and
Ziegler 2014). Customers’ satisfaction wit
service contacts is generally influenced by th
level of loyalty, and consistency from the ser
vice provider in service fairness (Skarlicki et
al. 2008). Thus, it should be noticed that
emotions may be generated from stimuli that
are relevant to the service. Therefore, servic
fairness plays a role as a producer of in
viduals’ emotions, as presented in this re
search model. Our fourth hypothesis pro-
posed in this study is:
H4: Perceived interactional fairness has a
effect on positive emotions.
BudiyantiandPatiro
238
Behavioral Intention
Modification of the relationship be-
tween a stimulus and its emotional response
will lead to consumer behavior. Zaltman et
al., as cited in Hunt (1978), examined con-
sumers’ behavior when faced with unfair
marketing practices at different stages,
namely at the stage prior to purchase; the time
of purchase; and the time after the purchase
(Skarlicki et al. 2008). Their study shows that
an increase in the awareness of unfair prac-
tices and fraud will increase the tendency of
consumers to complain (Skarlicki et al. 2008).
White et al. (2012) proposed a model of con-
sumers’ complaint behavior and concluded
that perceived fairness influenced the con-
sumers grumbling, word-of-mouth opinion,
and patronage behavior. The patronage be-
havior is measure with the intention to stay
and intention to deliver positive opinions of
the products to family, friends, and colleagues.
This behavior have the ability to predict con-
sumer purchase behavior and Customer’s fair-
ness perceptions are key driver of this be-
havior (White et al. 2012). Behavioral inten-
tion is defined as the rate at which individu-
als consciously want to display or not display
certain behaviors in the future (Tzafrirand
Hareli 2009; Fishbeinand Ajzen 2010; White
et al. 2012). Therefore, the intention to be-
have is a proxy for certain behaviors
(Fishbein and Ajzen 2010). Thus, this study
also applied the intention to behave as a con-
struct of the perceived result, where the in-
tention to behave is influence by positive
emotions.
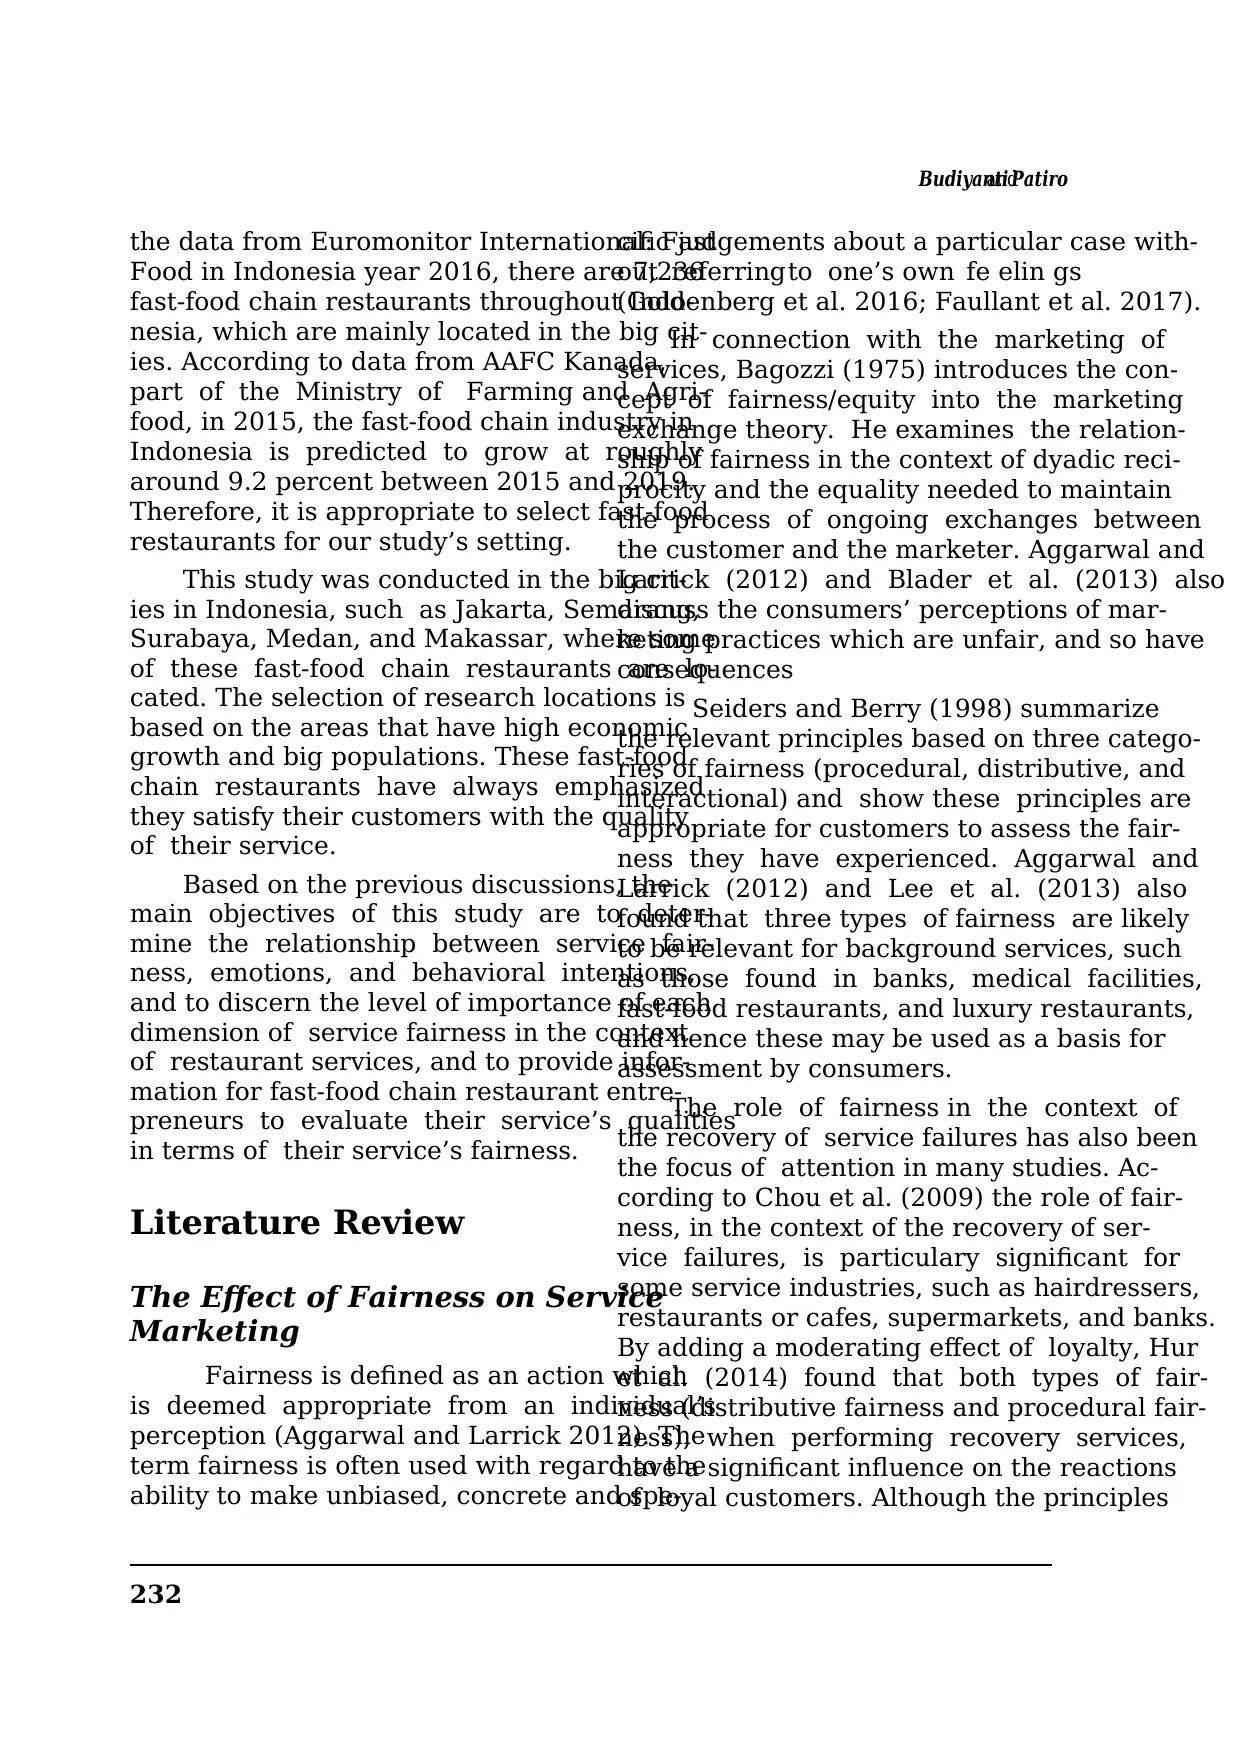
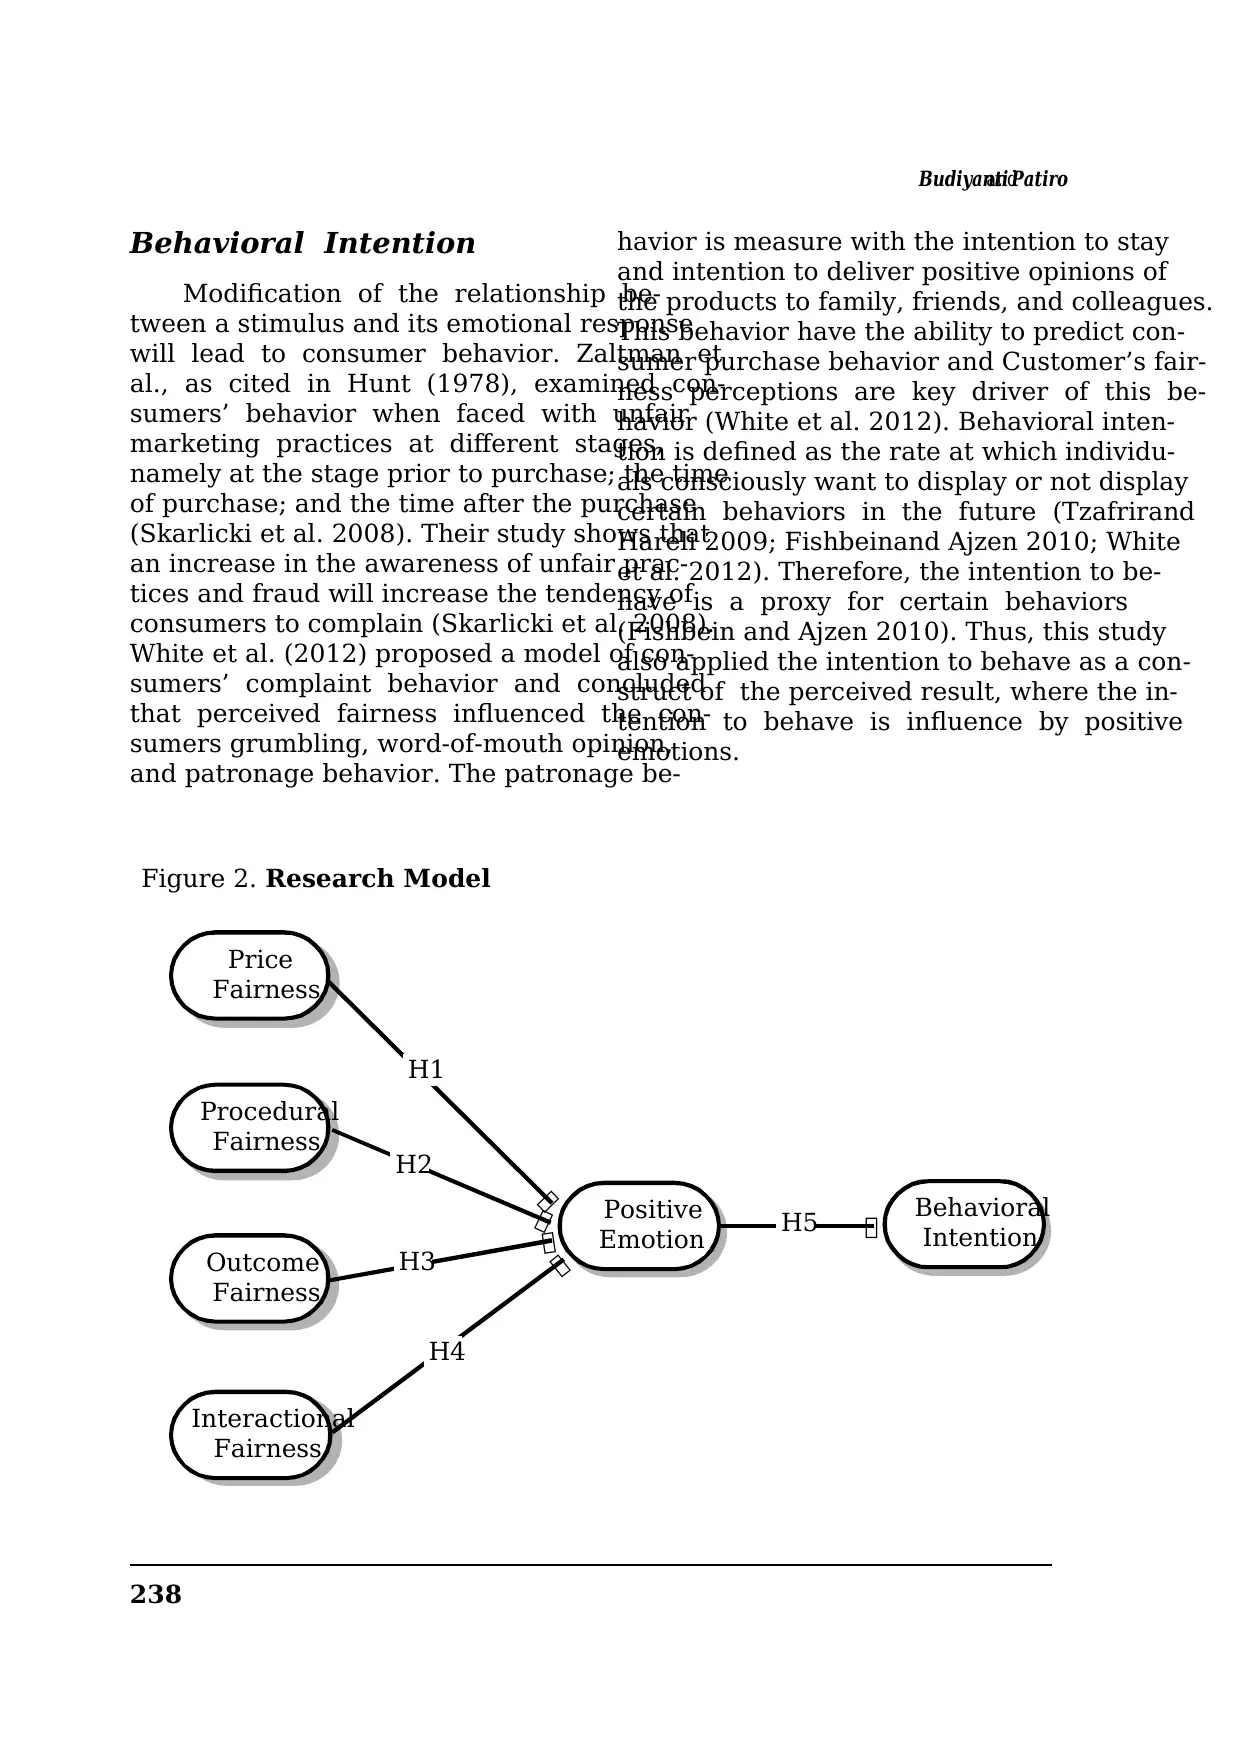
Figure 2. Research Model
Procedural
Fairness
Price
Fairness
Outcome
Fairness
Interactional
Fairness
Positive
Emotion
Behavioral
Intention
H1
H2
H3
H4
H5
238
Behavioral Intention
Modification of the relationship be-
tween a stimulus and its emotional response
will lead to consumer behavior. Zaltman et
al., as cited in Hunt (1978), examined con-
sumers’ behavior when faced with unfair
marketing practices at different stages,
namely at the stage prior to purchase; the time
of purchase; and the time after the purchase
(Skarlicki et al. 2008). Their study shows that
an increase in the awareness of unfair prac-
tices and fraud will increase the tendency of
consumers to complain (Skarlicki et al. 2008).
White et al. (2012) proposed a model of con-
sumers’ complaint behavior and concluded
that perceived fairness influenced the con-
sumers grumbling, word-of-mouth opinion,
and patronage behavior. The patronage be-
havior is measure with the intention to stay
and intention to deliver positive opinions of
the products to family, friends, and colleagues.
This behavior have the ability to predict con-
sumer purchase behavior and Customer’s fair-
ness perceptions are key driver of this be-
havior (White et al. 2012). Behavioral inten-
tion is defined as the rate at which individu-
als consciously want to display or not display
certain behaviors in the future (Tzafrirand
Hareli 2009; Fishbeinand Ajzen 2010; White
et al. 2012). Therefore, the intention to be-
have is a proxy for certain behaviors
(Fishbein and Ajzen 2010). Thus, this study
also applied the intention to behave as a con-
struct of the perceived result, where the in-
tention to behave is influence by positive
emotions.
Figure 2. Research Model
Procedural
Fairness
Price
Fairness
Outcome
Fairness
Interactional
Fairness
Positive
Emotion
Behavioral
Intention
H1
H2
H3
H4
H5
Secure Best Marks with AI Grader
Need help grading? Try our AI Grader for instant feedback on your assignments.
239
Gadjah Mada International Journal of Business– May-August, Vol. 20, No. 2, 2018
Emotions’ Influence on
Behavioral Intention
Numerous studies have shown that af-
fection is a significant factor in consumer
behavior (Yang and Chang 2008; Tzafrir and
Hareli 2009). The underlying concept of this
theory is people often make judgments con-
cerning external events based on their affec-
tive reactions that arise at that time. There-
fore, they use affection as the basis of their
assessment when they assess something they
like and are feeling happy (Williamson and
Williams 2011). Positive emotions (such as
joy, excitment, and happiness) have been rec-
ognized to have a consistent effect on an
individual’s behavior (Jangand Namkung
2009). When positive emotions are consis-
tent during service contacts, the expectation
is to be able to deliver a good experience for
the consumer (Tu 2004). Associated with
perceived fairness, people will use positive
emotions to evaluate their assessment of their
preferred service company (Nguyenand
Klaus 2013). Furthermore, they will be will-
ing to spread a positive opinion of the com-
pany by word-of-mouth to other people or to
re-visit their preferred service company
(Nguyen and Klaus 2013). As stated by
Adams (1966), the negative feelings result-
ing from unfairness are an emotional state-
ment to restore the sense of fairness (Jangand
Namkung 2009; Namkung and Jang 2010).
Thus, the fifth hypothesis proposed by this
study is:
H5: Positive emotions have a positive influence on
the customer’s behavioral intentions.
The hypotheses in this study can be visual-
ized as in Figure 2.
Methods
Method of Phase 1
This study consists of two phases,
namely: Phase 1 which is the qualitative
phase, and Phase 2 the quantitative phas
In Phase 1, the researchers conduct an e
planatory study. This stage aims to determin
the form of the percieved fairness felt b
customers of fast-food chain retaurants, and
the positive emotions that are formed when
someone perceives the fairness, and their
behavioral intention in the future related to
their preference for fast-food chain restau
rants.
The first step was to conduct a prelimi-
nary interview with customers of fast-food
chain restaurants located in the capital cities
of 2 Indonesian provinces, namely Jakarta (3
restaurants) and Surabaya (2 restaurants). T
number of customers selected for these ini-
tial interviews were 15 customers from each
restaurant. The determination of the custom
ers to be interviewed at this stage was based
on the following considerations: (1) They
were eating in the restaurant; and (2) they w
willing to engage in the research. In addition
to these preliminary interviews, the custom-
ers were also asked to write down on a piece
of paper how often they ate there, what im-
pressions they have regarding the service pr
vided when they are eating at the restaurant
and why they chose to eat at that restaurant.
From these interviews, the items men-
tioned by at least 10 percent of the respon-
dents (Fishbein and Middlestadt 1995) were
considered to be essential factors in the de-
velopment of a questionnaire to be use for
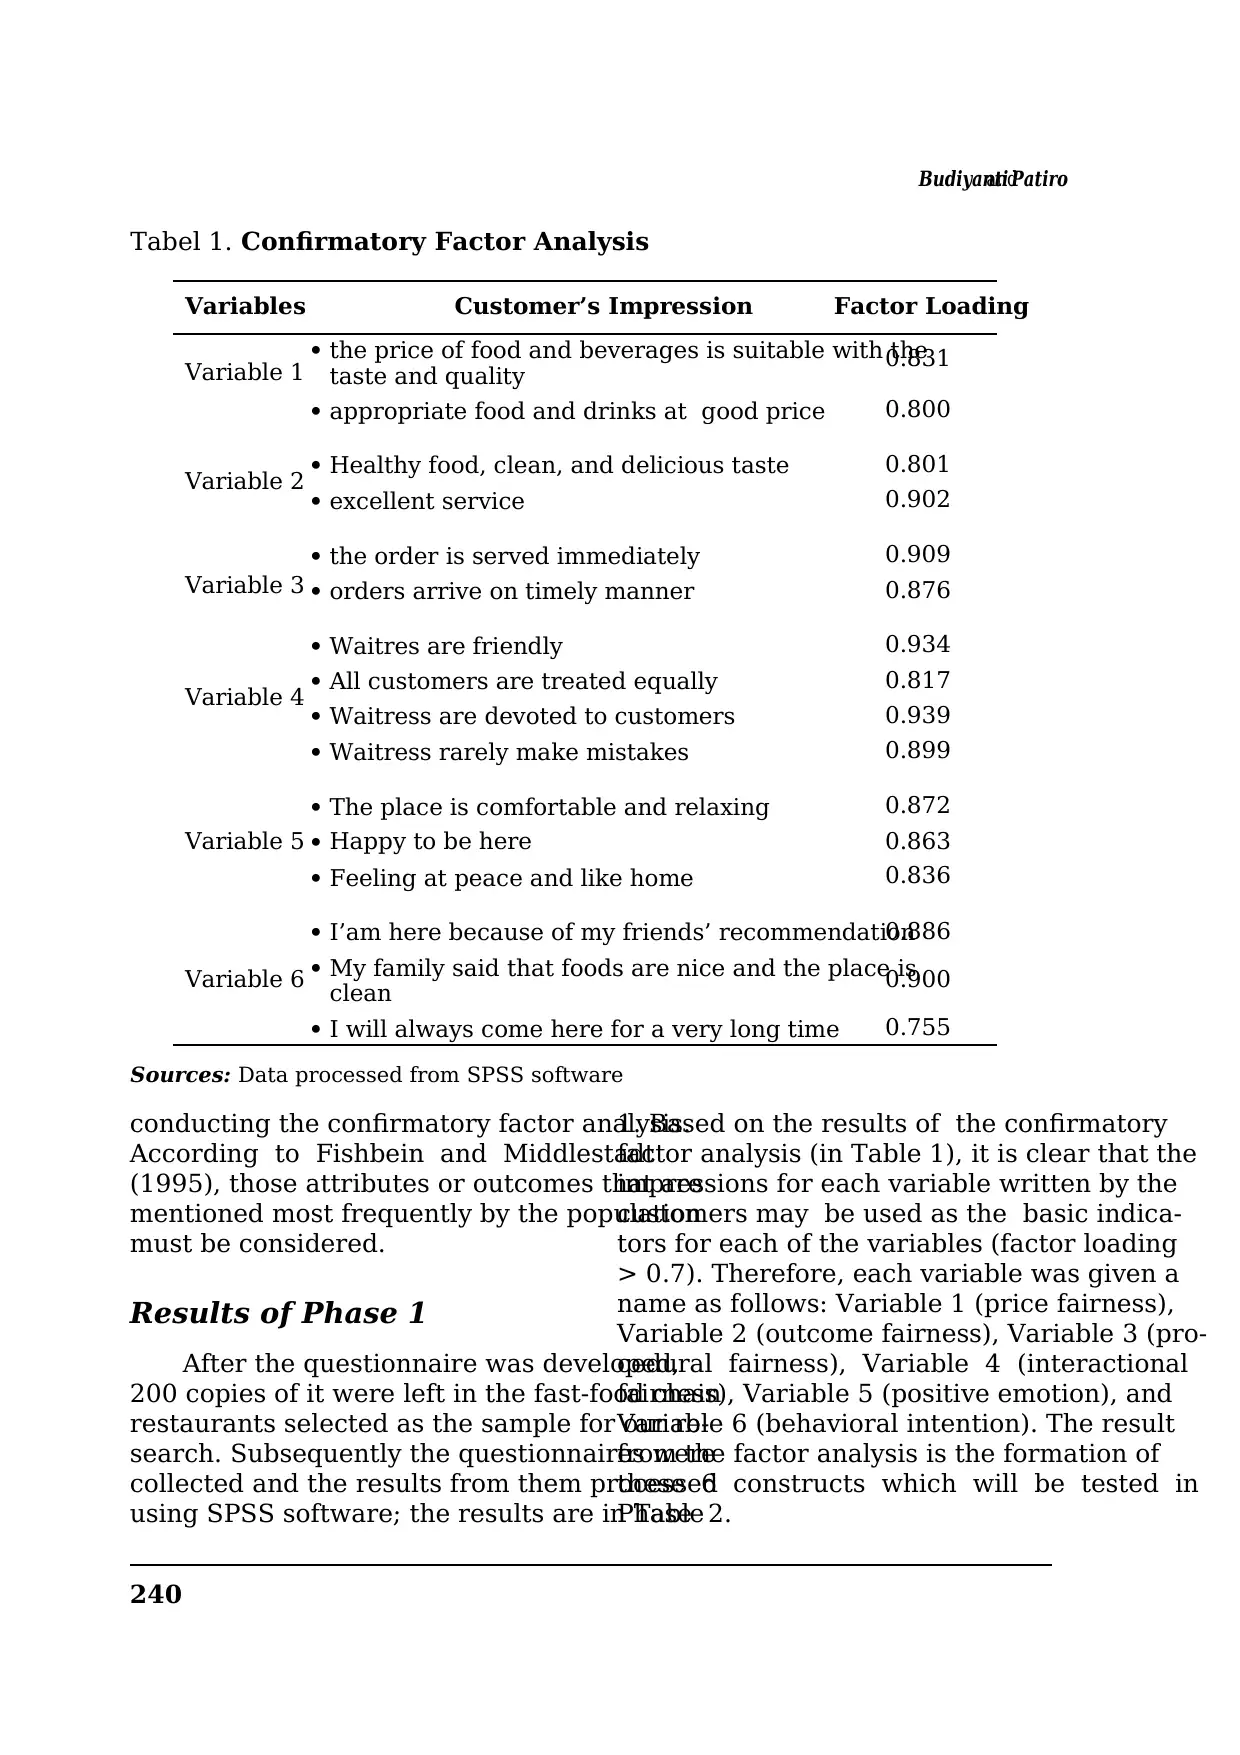
BudiyantiandPatiro
240
conducting the confirmatory factor analysis.
According to Fishbein and Middlestadt
(1995), those attributes or outcomes that are
mentioned most frequently by the population
must be considered.
Results of Phase 1
After the questionnaire was developed,
200 copies of it were left in the fast-food chain
restaurants selected as the sample for our re-
search. Subsequently the questionnaires were
collected and the results from them processed
using SPSS software; the results are in Table
1. Based on the results of the confirmatory
factor analysis (in Table 1), it is clear that the
impressions for each variable written by the
customers may be used as the basic indica-
tors for each of the variables (factor loading
> 0.7). Therefore, each variable was given a
name as follows: Variable 1 (price fairness),
Variable 2 (outcome fairness), Variable 3 (pro-
cedural fairness), Variable 4 (interactional
fairness), Variable 5 (positive emotion), and
Variable 6 (behavioral intention). The result
from the factor analysis is the formation of
these 6 constructs which will be tested in
Phase 2.
Variables Customer’s Impression Factor Loading
Variable 1 the price of food and beverages is suitable with the
taste and quality 0.831
appropriate food and drinks at good price 0.800
Variable 2 Healthy food, clean, and delicious taste 0.801
excellent service 0.902
Variable 3
the order is served immediately 0.909
orders arrive on timely manner 0.876
Variable 4
Waitres are friendly 0.934
All customers are treated equally 0.817
Waitress are devoted to customers 0.939
Waitress rarely make mistakes 0.899
Variable 5
The place is comfortable and relaxing 0.872
Happy to be here 0.863
Feeling at peace and like home 0.836
Variable 6
I’am here because of my friends’ recommendation0.886
My family said that foods are nice and the place is
clean 0.900
I will always come here for a very long time 0.755
Tabel 1. Confirmatory Factor Analysis
Sources: Data processed from SPSS software
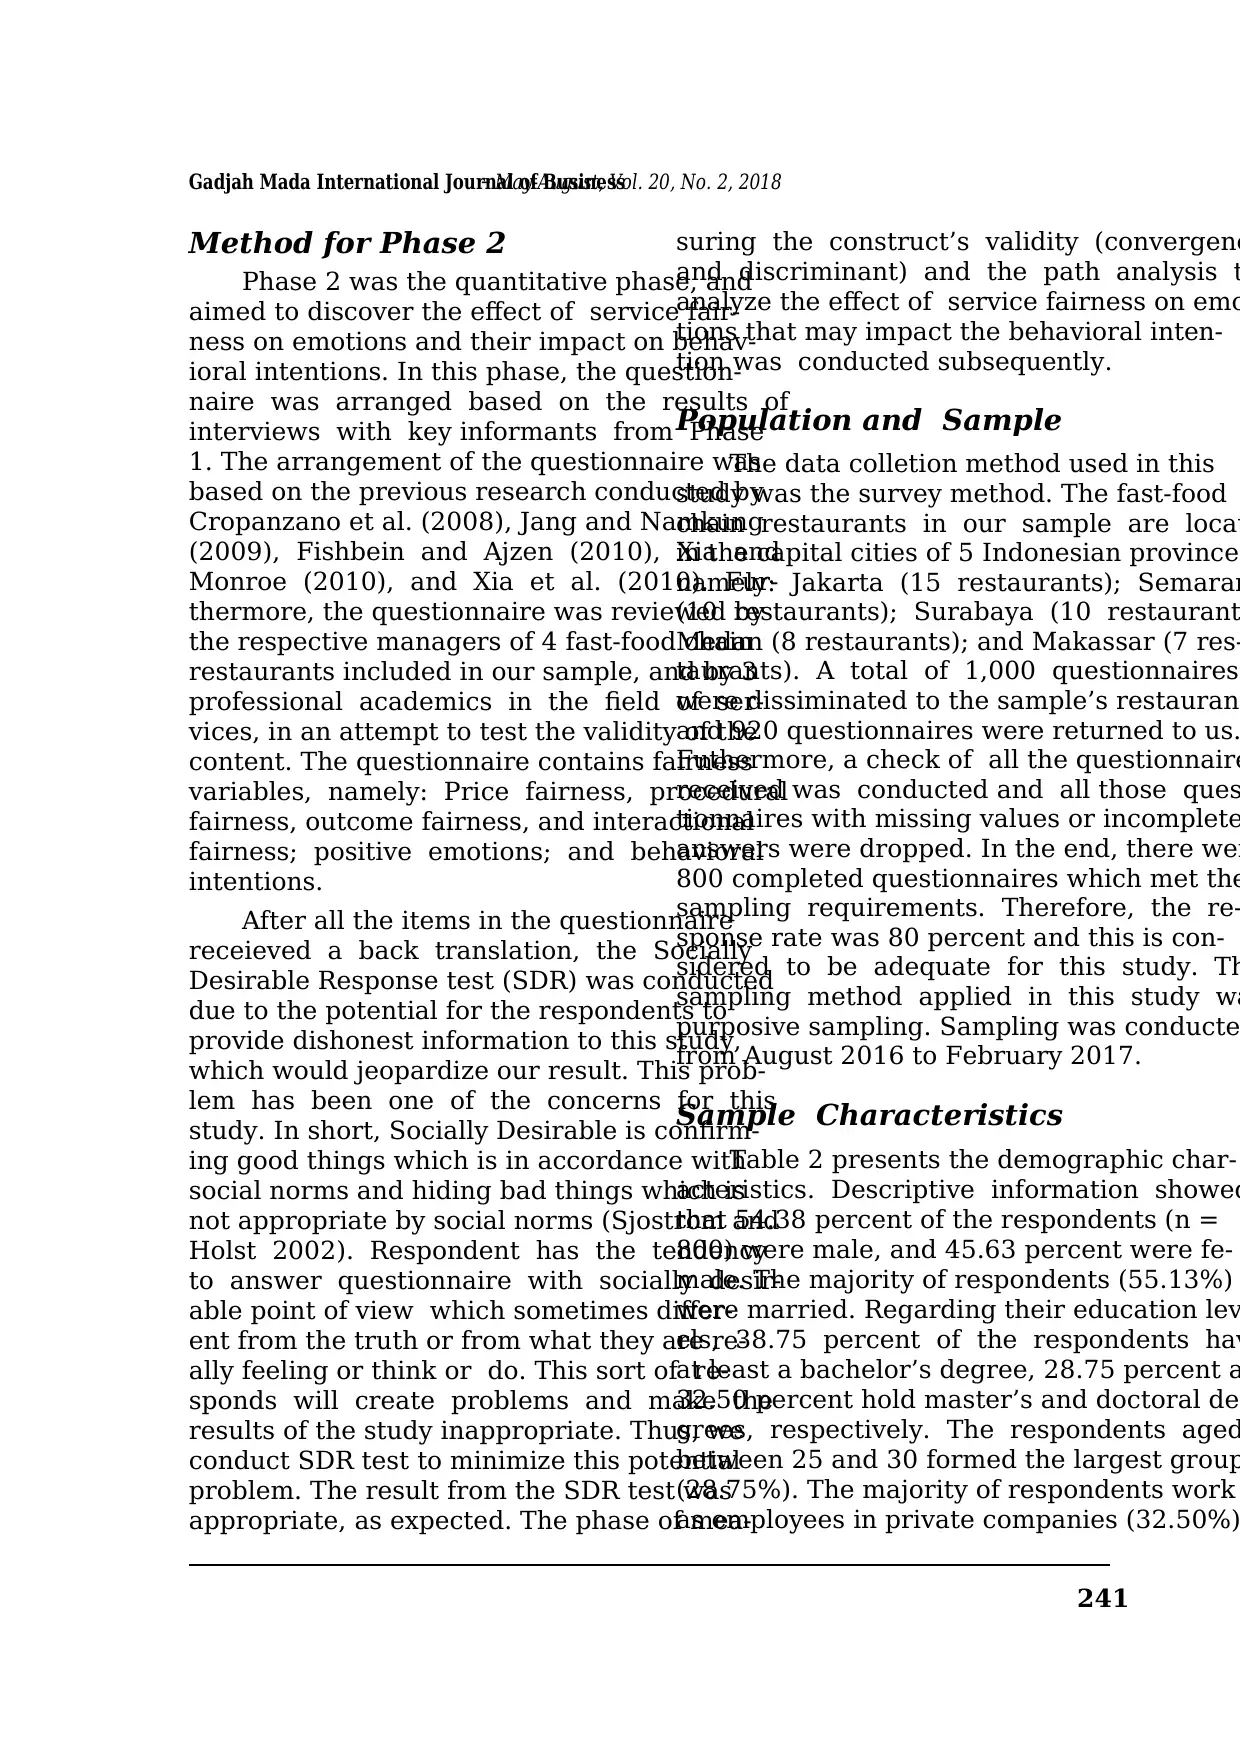
241
Gadjah Mada International Journal of Business– May-August, Vol. 20, No. 2, 2018
Method for Phase 2
Phase 2 was the quantitative phase, and
aimed to discover the effect of service fair-
ness on emotions and their impact on behav-
ioral intentions. In this phase, the question-
naire was arranged based on the results of
interviews with key informants from Phase
1. The arrangement of the questionnaire was
based on the previous research conducted by
Cropanzano et al. (2008), Jang and Namkung
(2009), Fishbein and Ajzen (2010), Xia and
Monroe (2010), and Xia et al. (2010). Fur-
thermore, the questionnaire was reviewed by
the respective managers of 4 fast-food chain
restaurants included in our sample, and by 3
professional academics in the field of ser-
vices, in an attempt to test the validity of the
content. The questionnaire contains fairness
variables, namely: Price fairness, procedural
fairness, outcome fairness, and interactional
fairness; positive emotions; and behavioral
intentions.
After all the items in the questionnaire
receieved a back translation, the Socially
Desirable Response test (SDR) was conducted
due to the potential for the respondents to
provide dishonest information to this study,
which would jeopardize our result. This prob-
lem has been one of the concerns for this
study. In short, Socially Desirable is confirm-
ing good things which is in accordance with
social norms and hiding bad things which is
not appropriate by social norms (Sjostrom and
Holst 2002). Respondent has the tendency
to answer questionnaire with socially desir-
able point of view which sometimes differ-
ent from the truth or from what they are re-
ally feeling or think or do. This sort of re-
sponds will create problems and make the
results of the study inappropriate. Thus, we
conduct SDR test to minimize this potential
problem. The result from the SDR test was
appropriate, as expected. The phase of mea-
suring the construct’s validity (convergenc
and discriminant) and the path analysis t
analyze the effect of service fairness on emo
tions that may impact the behavioral inten-
tion was conducted subsequently.
Population and Sample
The data colletion method used in this
study was the survey method. The fast-food
chain restaurants in our sample are locat
in the capital cities of 5 Indonesian provinces
namely: Jakarta (15 restaurants); Semaran
(10 restaurants); Surabaya (10 restaurant
Medan (8 restaurants); and Makassar (7 res-
taurants). A total of 1,000 questionnaires
were dissiminated to the sample’s restaurant
and 920 questionnaires were returned to us.
Futhermore, a check of all the questionnaire
received was conducted and all those ques
tionnaires with missing values or incomplete
answers were dropped. In the end, there wer
800 completed questionnaires which met the
sampling requirements. Therefore, the re-
sponse rate was 80 percent and this is con-
sidered to be adequate for this study. Th
sampling method applied in this study wa
purposive sampling. Sampling was conducte
from August 2016 to February 2017.
Sample Characteristics
Table 2 presents the demographic char-
acteristics. Descriptive information showed
that 54.38 percent of the respondents (n =
800) were male, and 45.63 percent were fe-
male. The majority of respondents (55.13%)
were married. Regarding their education lev
els, 38.75 percent of the respondents hav
at least a bachelor’s degree, 28.75 percent a
32.50 percent hold master’s and doctoral de-
grees, respectively. The respondents aged
between 25 and 30 formed the largest group
(28.75%). The majority of respondents work
as employees in private companies (32.50%)
Paraphrase This Document
Need a fresh take? Get an instant paraphrase of this document with our AI Paraphraser
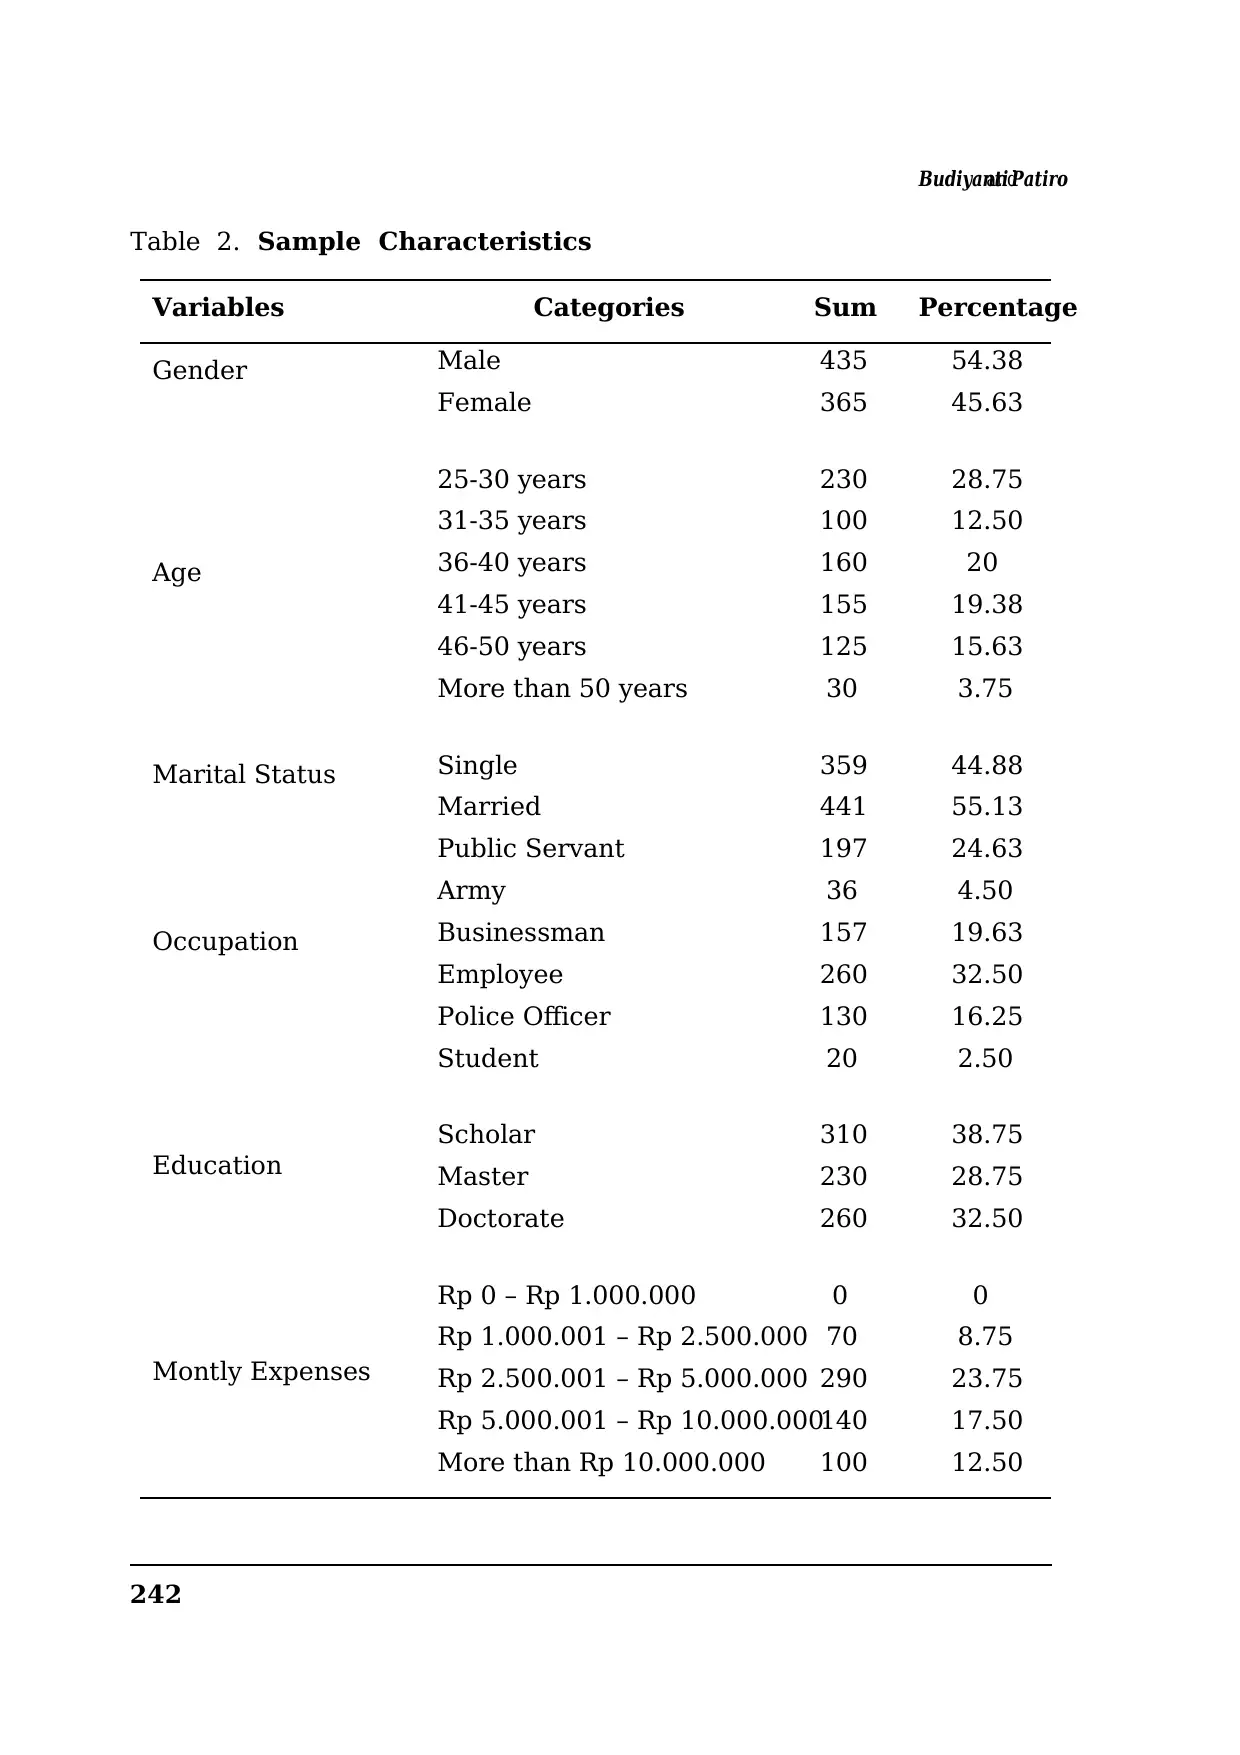
BudiyantiandPatiro
242
Variables Categories Sum Percentage
Gender Male 435 54.38
Female 365 45.63
Age
25-30 years 230 28.75
31-35 years 100 12.50
36-40 years 160 20
41-45 years 155 19.38
46-50 years 125 15.63
More than 50 years 30 3.75
Marital Status Single 359 44.88
Married 441 55.13
Occupation
Public Servant 197 24.63
Army 36 4.50
Businessman 157 19.63
Employee 260 32.50
Police Officer 130 16.25
Student 20 2.50
Education
Scholar 310 38.75
Master 230 28.75
Doctorate 260 32.50
Montly Expenses
Rp 0 – Rp 1.000.000 0 0
Rp 1.000.001 – Rp 2.500.000 70 8.75
Rp 2.500.001 – Rp 5.000.000 290 23.75
Rp 5.000.001 – Rp 10.000.000140 17.50
More than Rp 10.000.000 100 12.50
Table 2. Sample Characteristics
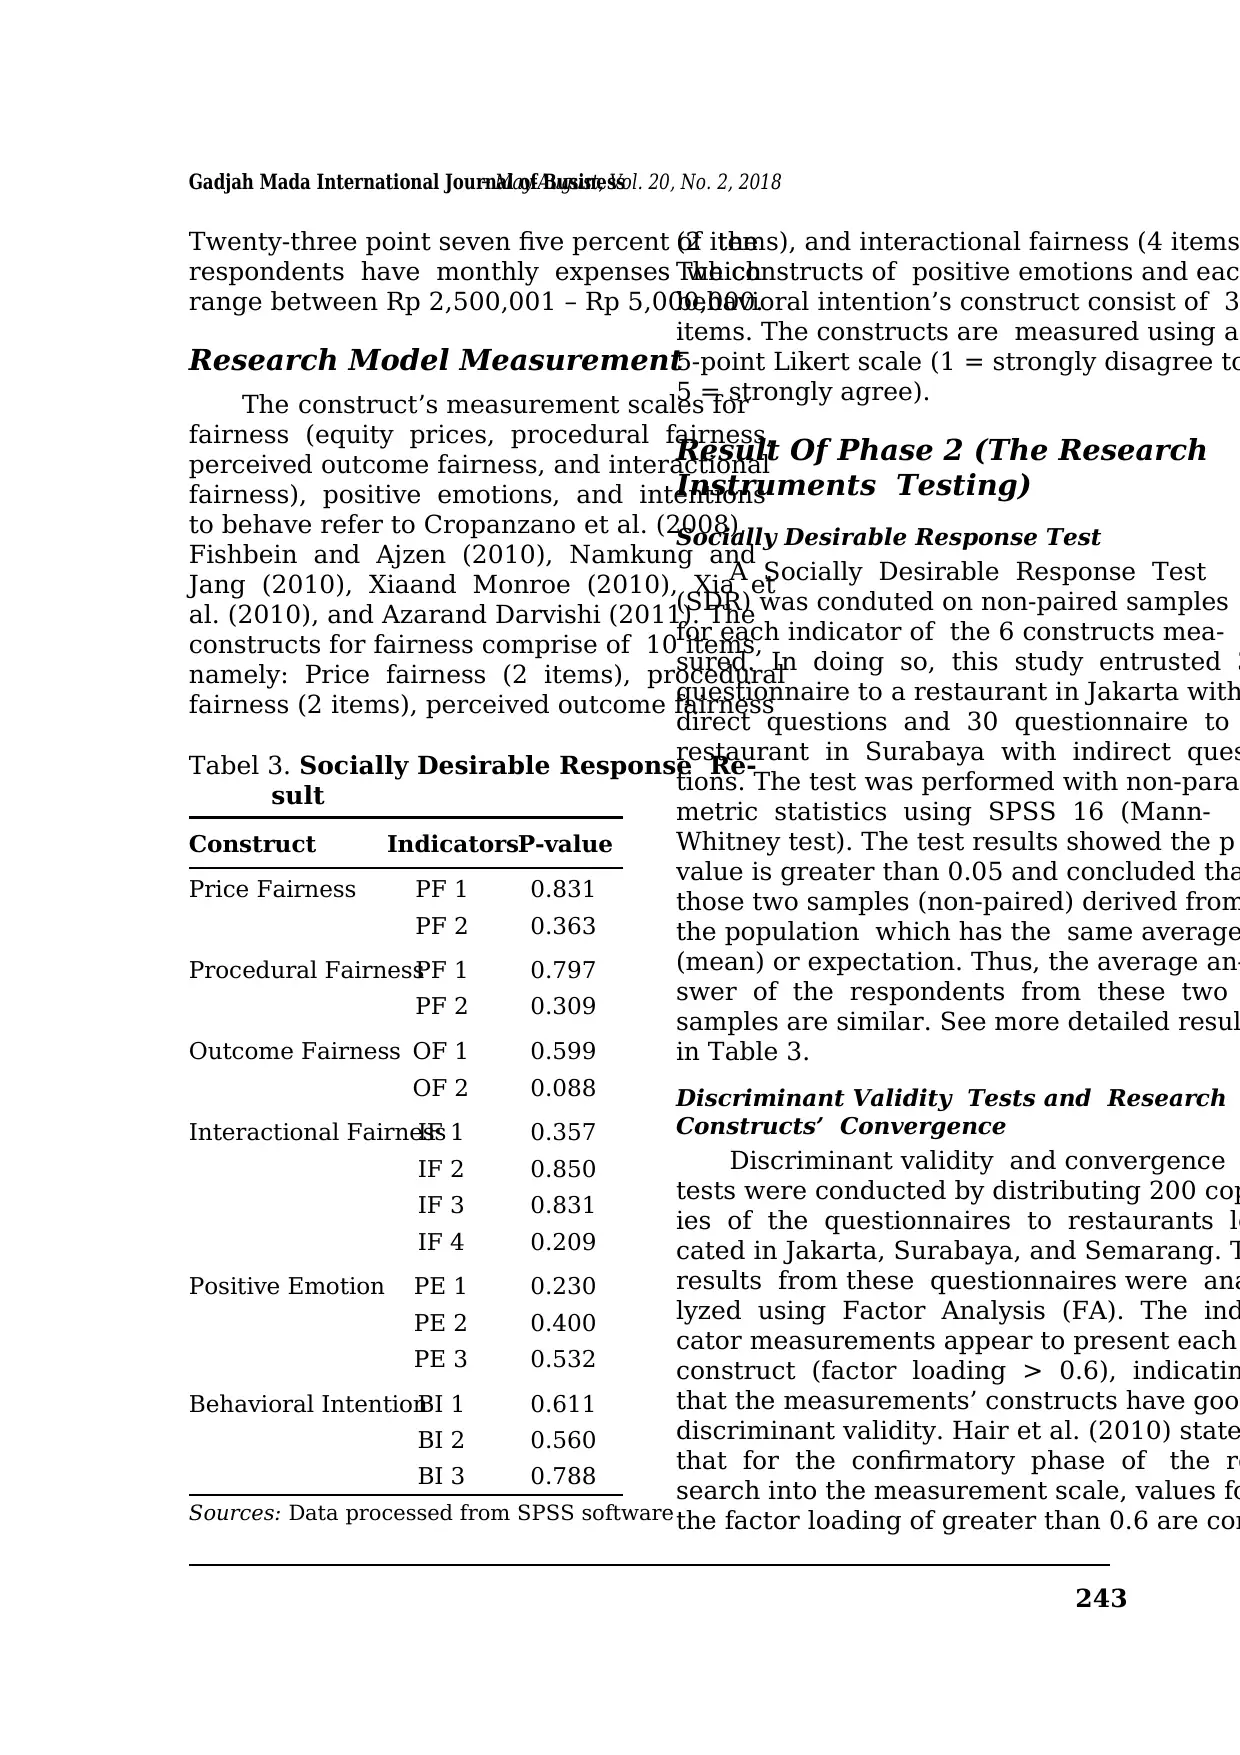
243
Gadjah Mada International Journal of Business– May-August, Vol. 20, No. 2, 2018
Twenty-three point seven five percent of the
respondents have monthly expenses which
range between Rp 2,500,001 – Rp 5,000,000.
Research Model Measurement
The construct’s measurement scales for
fairness (equity prices, procedural fairness,
perceived outcome fairness, and interactional
fairness), positive emotions, and intentions
to behave refer to Cropanzano et al. (2008),
Fishbein and Ajzen (2010), Namkung and
Jang (2010), Xiaand Monroe (2010), Xia et
al. (2010), and Azarand Darvishi (2011). The
constructs for fairness comprise of 10 items,
namely: Price fairness (2 items), procedural
fairness (2 items), perceived outcome fairness
(2 items), and interactional fairness (4 items
The constructs of positive emotions and eac
behavioral intention’s construct consist of 3
items. The constructs are measured using a
5-point Likert scale (1 = strongly disagree to
5 = strongly agree).
Result Of Phase 2 (The Research
Instruments Testing)
Socially Desirable Response Test
A Socially Desirable Response Test
(SDR) was conduted on non-paired samples
for each indicator of the 6 constructs mea-
sured. In doing so, this study entrusted 3
questionnaire to a restaurant in Jakarta with
direct questions and 30 questionnaire to
restaurant in Surabaya with indirect ques
tions. The test was performed with non-para
metric statistics using SPSS 16 (Mann-
Whitney test). The test results showed the p
value is greater than 0.05 and concluded tha
those two samples (non-paired) derived from
the population which has the same average
(mean) or expectation. Thus, the average an-
swer of the respondents from these two
samples are similar. See more detailed resul
in Table 3.
Discriminant Validity Tests and Research
Constructs’ Convergence
Discriminant validity and convergence
tests were conducted by distributing 200 cop
ies of the questionnaires to restaurants lo
cated in Jakarta, Surabaya, and Semarang. T
results from these questionnaires were ana
lyzed using Factor Analysis (FA). The ind
cator measurements appear to present each
construct (factor loading > 0.6), indicatin
that the measurements’ constructs have good
discriminant validity. Hair et al. (2010) state
that for the confirmatory phase of the re
search into the measurement scale, values fo
the factor loading of greater than 0.6 are con
Tabel 3. Socially Desirable Response Re-
sult
Construct IndicatorsP-value
Price Fairness PF 1 0.831
PF 2 0.363
Procedural FairnessPF 1 0.797
PF 2 0.309
Outcome Fairness OF 1 0.599
OF 2 0.088
Interactional FairnessIF 1 0.357
IF 2 0.850
IF 3 0.831
IF 4 0.209
Positive Emotion PE 1 0.230
PE 2 0.400
PE 3 0.532
Behavioral IntentionBI 1 0.611
BI 2 0.560
BI 3 0.788
Sources: Data processed from SPSS software
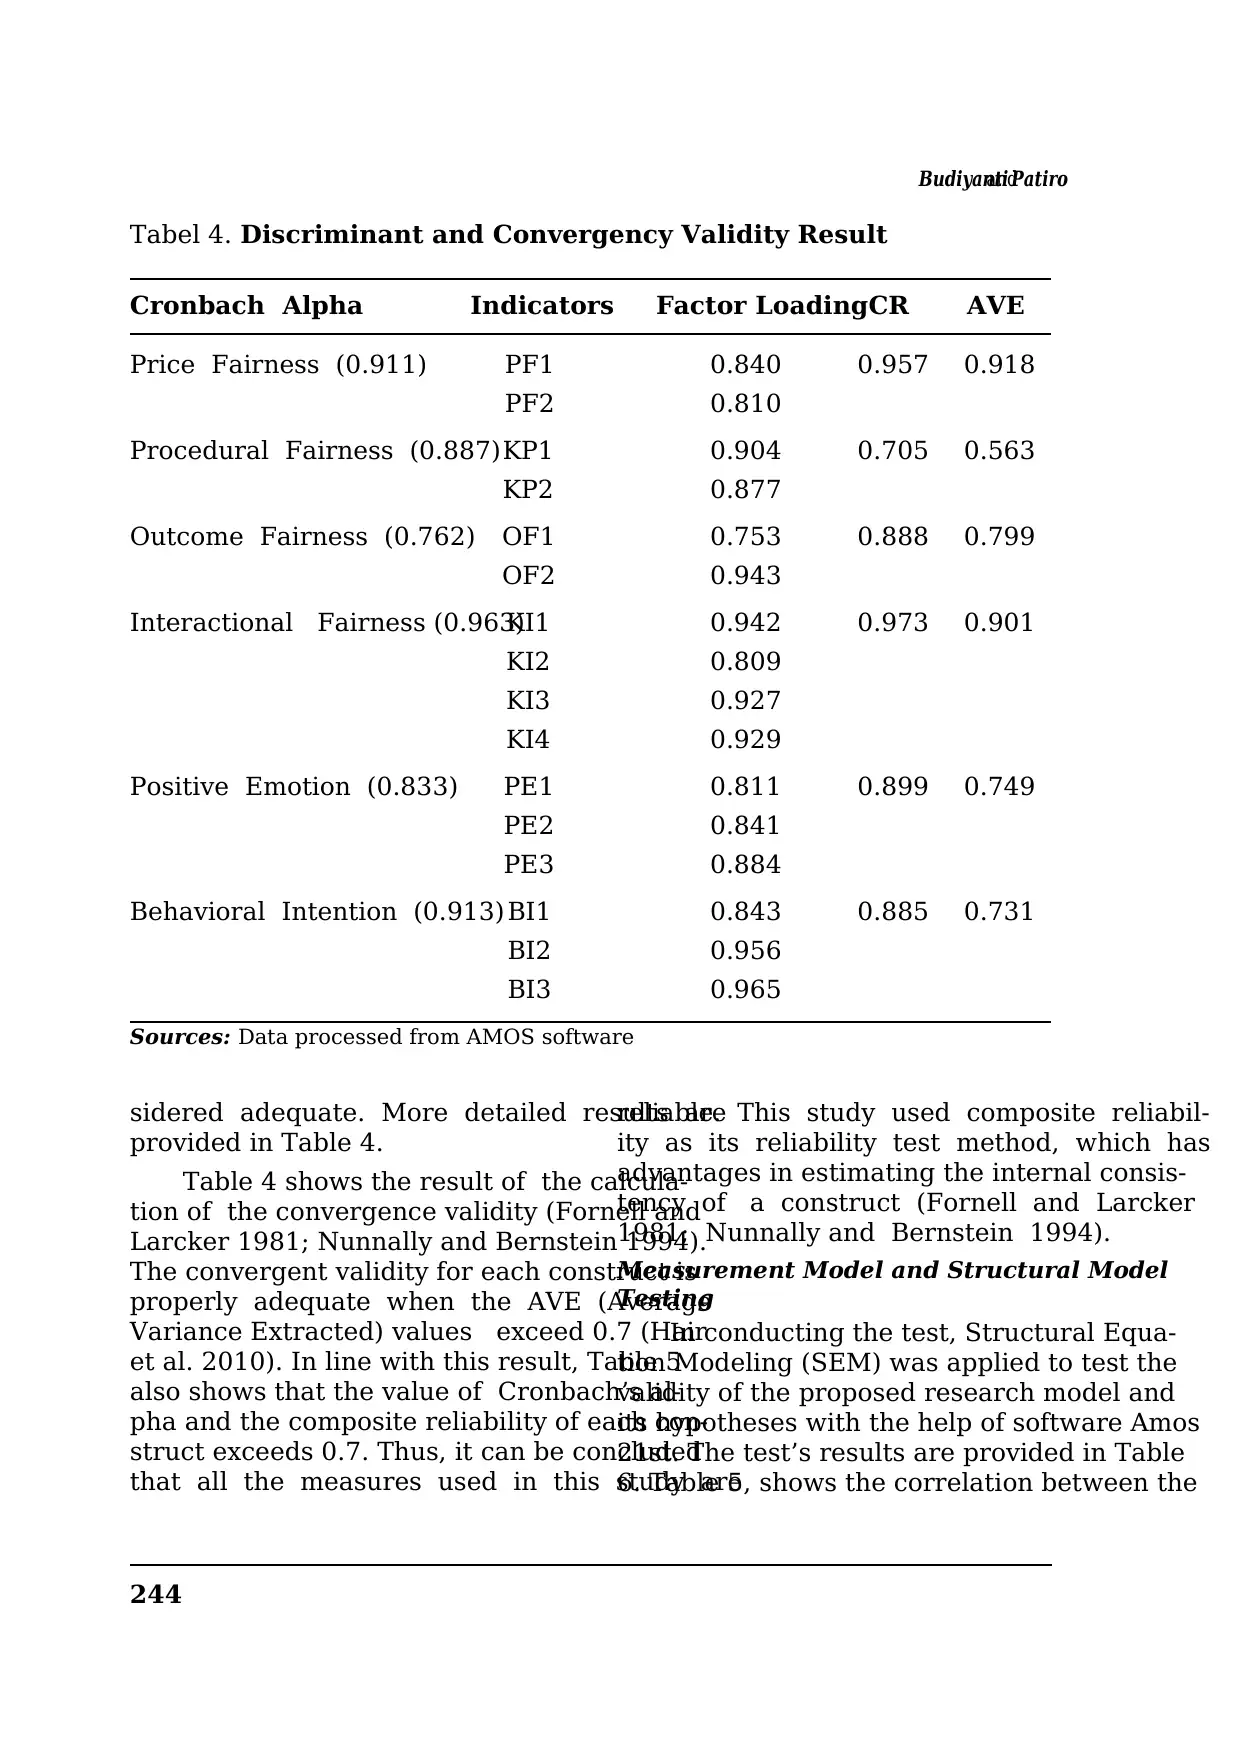
BudiyantiandPatiro
244
sidered adequate. More detailed results are
provided in Table 4.
Table 4 shows the result of the calcula-
tion of the convergence validity (Fornell and
Larcker 1981; Nunnally and Bernstein 1994).
The convergent validity for each construct is
properly adequate when the AVE (Average
Variance Extracted) values exceed 0.7 (Hair
et al. 2010). In line with this result, Table 5
also shows that the value of Cronbach’s al-
pha and the composite reliability of each con-
struct exceeds 0.7. Thus, it can be concluded
that all the measures used in this study are
reliable. This study used composite reliabil-
ity as its reliability test method, which has
advantages in estimating the internal consis-
tency of a construct (Fornell and Larcker
1981; Nunnally and Bernstein 1994).
Measurement Model and Structural Model
Testing
In conducting the test, Structural Equa-
tion Modeling (SEM) was applied to test the
validity of the proposed research model and
its hypotheses with the help of software Amos
21st. The test’s results are provided in Table
6. Table 5, shows the correlation between the
Cronbach Alpha Indicators Factor LoadingCR AVE
Price Fairness (0.911) PF1 0.840 0.957 0.918
PF2 0.810
Procedural Fairness (0.887)KP1 0.904 0.705 0.563
KP2 0.877
Outcome Fairness (0.762) OF1 0.753 0.888 0.799
OF2 0.943
Interactional Fairness (0.963)KI1 0.942 0.973 0.901
KI2 0.809
KI3 0.927
KI4 0.929
Positive Emotion (0.833) PE1 0.811 0.899 0.749
PE2 0.841
PE3 0.884
Behavioral Intention (0.913) BI1 0.843 0.885 0.731
BI2 0.956
BI3 0.965
Tabel 4. Discriminant and Convergency Validity Result
Sources: Data processed from AMOS software
Secure Best Marks with AI Grader
Need help grading? Try our AI Grader for instant feedback on your assignments.
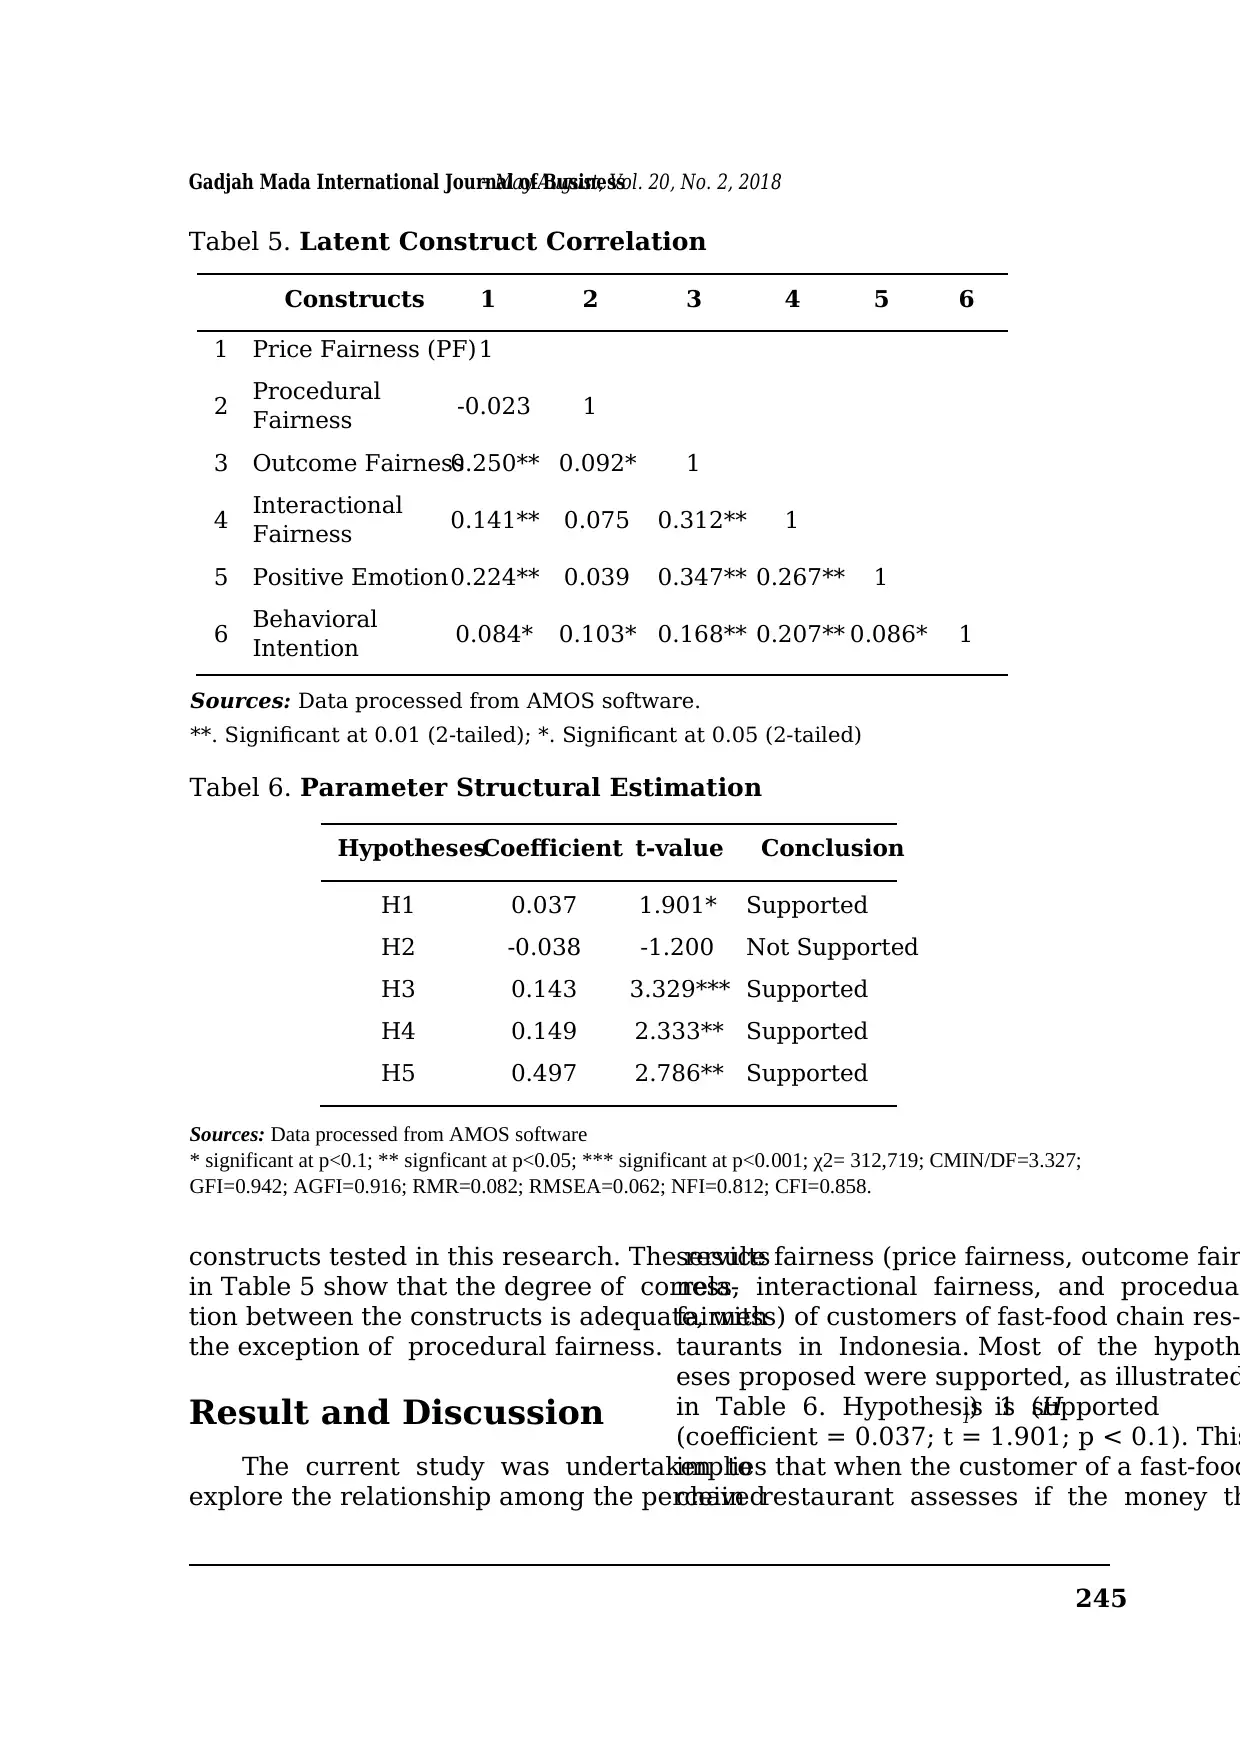
245
Gadjah Mada International Journal of Business– May-August, Vol. 20, No. 2, 2018
constructs tested in this research. The results
in Table 5 show that the degree of correla-
tion between the constructs is adequate, with
the exception of procedural fairness.
Result and Discussion
The current study was undertaken to
explore the relationship among the perceived
service fairness (price fairness, outcome fair
ness, interactional fairness, and procedual
fairness) of customers of fast-food chain res-
taurants in Indonesia. Most of the hypoth
eses proposed were supported, as illustrated
in Table 6. Hypothesis 1 (H1) is supported
(coefficient = 0.037; t = 1.901; p < 0.1). This
implies that when the customer of a fast-food
chain restaurant assesses if the money th
Constructs 1 2 3 4 5 6
1 Price Fairness (PF) 1
2 Procedural
Fairness -0.023 1
3 Outcome Fairness0.250** 0.092* 1
4 Interactional
Fairness 0.141** 0.075 0.312** 1
5 Positive Emotion0.224** 0.039 0.347** 0.267** 1
6 Behavioral
Intention 0.084* 0.103* 0.168** 0.207** 0.086* 1
Tabel 5. Latent Construct Correlation
Sources: Data processed from AMOS software.
**. Significant at 0.01 (2-tailed); *. Significant at 0.05 (2-tailed)
Tabel 6. Parameter Structural Estimation
Sources: Data processed from AMOS software
* significant at p<0.1; ** signficant at p<0.05; *** significant at p<0.001; χ2= 312,719; CMIN/DF=3.327;
GFI=0.942; AGFI=0.916; RMR=0.082; RMSEA=0.062; NFI=0.812; CFI=0.858.
HypothesesCoefficient t-value Conclusion
H1 0.037 1.901* Supported
H2 -0.038 -1.200 Not Supported
H3 0.143 3.329*** Supported
H4 0.149 2.333** Supported
H5 0.497 2.786** Supported
BudiyantiandPatiro
246
spent on their food and beverages is perti-
nent (fair) with the flavor (good), they will
feel a sense of fairness which will affect the
formation of positive emotions. This finding
is generally consistent with Namkung and
Jang (2010) and Wen and Geng-qing Chi
(2013) who concluded that from a customer
sacrifice’s perspective, price fairness was
found to be a significant predictor of posi-
tive emotions and ultimately future behav-
ioral intentions. Futhermore, since it was the
only dimension of fairness that had a signifi-
cant effect on the dependent constructs, the
significance of price fairness should be rec-
ognized.
Hypothesis 2 (H2) is not supported. This
result indicates that when customers assess
that the timeliness and efficiency of the ser-
vice provided to them are presumed to be in-
compatible (unfair), they will perceive an
unfair service which results in the failure to
form any positive emotions. This is in line
with Aggarwal and Larrick (2012) who ar-
gued that, as it is another aspect of customer
sacrifice, procedural fairness seems to act as
a basic requirement. Furthermore, they stated
that qualified procedural fairness should be a
basic requirement, in the sense that consum-
ers expect their service’s delivery to be effi-
cient and quick without any delays or decep-
tion.
Hypothesis 3 (H3) is supported (coeffi-
cient = 0.143; t = 3.329; p < 0.001). The
result indicates that when the customers of
fast-food chain restaurants assess their visit,
they are satisfied and content with the out-
comes they received, which they consider to
be a positive experience, so it will result in
the formation of positive emotions. As out-
lined by Jang and Namkung (2009), in a res-
taurant setting, many stimuli could influence
a customer’s emotional state. They stated that
these stimuli encompass both tangible and
intangible features of the restaurant, such as
its products’ attributes, the physical environ-
ment, and its service aspects.
Hypothesis 4 (H4) is supported (coeffi-
cient = 0.149; t = 2.333; p < 0.05). This re-
sult implies that the quality of service per-
ceived by the customers will result in a fair-
ness perception which will affect the forma-
tion of positive emotions. Thus, this finding
verified that customers are often influenced
by the knowledge and skills of the employ-
ees when forming opinions about the service
offered, and inadequate interactions may di-
rectly lead to unfavorable behavior (Jang and
Namkung 2009; Namkung and Jang 2010).
Given this result, it might be useful to con-
vey a perception of fair service that is char-
acterized by friendly and attentive staff who
exhibit equal service to all the customers,
without any bias.
Hypothesis 5 (H5) is supported (coeffi-
cient = 0.497; t = 2.786; p < 0.05). The re-
sult indicates that positive emotions are ex-
cellent predictors for predicting consumers’
behavior in the context of the service indus-
try. This finding supports the view of Jang
and Namkung (2009) and Namkung and Jang
(2010) who argue that the role of positive
emotions should be obvious given the he-
donic nature of restaurants. Furthermore,
they stated that restaurant managers could
improve the probability of favorable behav-
ioral intentions by establishing fair and rea-
sonable prices, consistently good-quality
food, and improving the quality of the inter-
action between customers and service pro-
viders, which would elicit positive emotions.
Therefore, the 3 fairness variables (price
fairness, outcome fairness, and interactional
fairness) have positive and significant effects
on positive emotions. In terms of the ben-
efits received by the customer, two variables
247
Gadjah Mada International Journal of Business– May-August, Vol. 20, No. 2, 2018
of fairness have a positive and significant
effect on their positive emotions. In terms of
the sacrifices made by the customer, one fair-
ness variable has a positive and significant
effect on their positive emotions. Meanwhile,
procedural fairness, which belongs to the con-
text of customers’ sacrifice, does not have a
positive and significant effect on positive
emotions. It should be noted that emphasiz-
ing procedural fairness alone would not be
enough to create customers’ positive emo-
tions. Our results show that fast-food chain
restaurants’ customers expect efficiency and
timeliness in the service provided, without
any delays or errors. Thus, when fast-food
chain restaurants fail to meet these expecta-
tions, customers will consider this condition
to be unacceptable. This result is in line with
Aggarwal and Larrick (2012) and Hur et al.
(2014) who concluded that when service de-
lays occur, customers assess this condition
as a waste of their time and they rate the ser-
vice negatively.
From the perspective of the benefit re-
ceived by customers, the satisfactory result
(physical) they perceive has a positive and
significant effect on the customers’ positive
emotions (Dzansi 2016; Wang et al. 2016; Xu
et al. 2016). Furthermore, when this result
(physical) is capable of influencing and in-
creasing the positive emotions, it will, in turn,
impact on future purchase intentions. Thus,
successfully forming core products and a
quality service are substantial requirement
that must be met in the restaurant business.
Similarly with other fairness variables which
are also included in the context of the ben-
efits received by the customer, interactional
fairness has a positive and significant effect
on the customers’ positive emotions. These
results indicate that, in general, the custom-
ers’ opinions are influenced by the knowledge
and expertise possessed by the employees
associatedwith the services o ffer ed
(Aggarwal and Larrick 2012), hence, any ad-
verse interaction will raise the likelihood o
customers’ negative behavior.
Moreover, Kukar-Kinney et al. (2007)
show that excellent interactions between an
individual customer and the employees w
affect the assessment of the services pro
vided. Therefore, based on these results,
could be concluded that the customers’ per-
ception of the fairness of the service is in-
fluenced by factors such as a friendly
athmosphere, full attention being provided b
the service employees, and equal service de-
liveries, without errors, for every customer.
The role of positive emotions may be
generated and highlighted through excellent
first impressions of the restaurant, throug
the quality of the service provided during th
service contact. Thus, restaurant manager
can increase the positive behavioral intention
of their customers through the development
and provision of fair and reasonable price
for food and beverages, as well as improve-
ments in the quality of the interaction be
tween the customers and the restaurant’s
employees, which will result in positive emo-
tions.
Conclusion
The model used in this study consid-
ered two goals and theoretical questions si-
multaneously. The first question investigated
the impact of perceived fairness on custom-
ers’ perceptions and emotional reactions. Th
4 types of customers’ perceived fairness con
sidered are interactional, procedural, out-
come, and price, which are expected to influ
ence customers’ positive emotions. The more
customers perceive fairness from the service
they receive, the more positive emotions they
will experience toward the service organiza-
Paraphrase This Document
Need a fresh take? Get an instant paraphrase of this document with our AI Paraphraser
BudiyantiandPatiro
248
tion (Huang 2016; Roy et al. 2016; Kimand
Park 2017). This result supports those of pre-
vious studies such as by Namkung and Jang
(2010) and Wen and Geng-qing Chi (2013).
However, the findings from this study
show that procedural fairness does not affect
the customers’ emotions, while the effect of
the other types of fairness is not confirmed.
Procedural fairnesses’ dimension on positive
consumption’s emotion is, to some extent,
inconsistent. Therefore, the result of this study
is in contrast with Namkung and Jang (2010),
who state that only the procedural aspect
negatively affects negative consumption’s
emotions, while other aspects do not have
any effects. However, Wen and Geng-qing Chi
(2013) find evidence that interactional fair-
ness is not effective in predicting positive
emotions. Furthermore, a study by Smith and
Bolton (2002) claims that all three dimensions
of perceived fairness have the ability to af-
fect customers’ negative emotions.
The next theoretical question is the ef-
fect of positive emotional fairness on cus-
tomers’ intentions. The findings reveal that
positive consumption emotions have a posi-
tive effect on customers’ intentions. Thus, the
more positive emotions customers experience
from the service, the more likely it is that they
will repeat their purchases. Hence, they will
be more enthusiastic in sharing positive com-
ments and recommendations through word-
of-mouth advertising. This has already been
observed in other studies (i.e. Lee 2010; Wen
and Geng-qing Chi 2013; Hur et al. 2014;
Chen et al. 2015).
Limitations and Suggestions
Regardless of the contribution made
and the managerial implications, there are
some limitations to this study. The first limi-
tation is concerning the data collected in this
study, which is only from fast-food chain res-
taurants. Therefore, the possibility to gener-
alize the results of this study into the con-
text of other service industries or other in-
dustrial fields is very small. Thus, further re-
search needs to be conducted into different
contexts, especially in the restaurant indus-
try (other than fast-food chain restaurants)
and other industrial fields, to reveal their is-
sues of service fairness and its related dimen-
sions. From the methodological aspect, fur-
ther research should conduct a validation test
on fairnesses’ service dimensions along with
the indicators used in this study, and exam-
ine their application to assess the quality of
service in the restaurant business.
Further research is expected to involve
personal and situational characteristics, such
as sensitivity to fairness, loyalty, and various
contexts regarding service problems, which
may moderate the relationship between these
constructs. Aggarwal and Larrick (2012), Hur
et al. (2014), and Chen et al.(2015) state that,
based on the personal sensitivity of fairness,
each individual has a different level of im-
portance for the perceived fairness of service.
There are several questions in this regard,
namely: Whether considerations of the fair-
ness of different services are based on the
level of sensitivity to the fairness or on con-
tact based services? What level of loyalty to
a particular restaurant affects consumers
when they evaluate the perceived fairness of
the service? Is a loyal customer more toler-
ant of unfairness than customers who are not
loyal? Are customers who often come to visit
a particular restaurant antagonistic when they
feel the unfairness of service? Therefore, fur-
ther research is expected to uncover the mod-
erating role of loyalty and the frequency of
visits in the relationship between emotions
and behavioral intention, in order to gain
more knowledge regarding customers’ percep-
tions of service fairness that impact their emo-
tions and behavioral intentions.
249
Gadjah Mada International Journal of Business– May-August, Vol. 20, No. 2, 2018
References
Adams, J. S. 1966. Inequity In Social Exchange. Advances in Experimental Social Psycholo
https://doi.org/10.1016/S0065-2601(08)60108-2
Aggarwal, P., and R. P. Larrick. 2012. When consumers care about being treated fairly/ : T
of relationship norms and fairness norms &. Journal of Consumer Psychology, 22(1),
/doi.org/10.1016/j.jcps.2011.11.009
Azar, A. and Z. A. Darvishi. 2011. Development and validation of a measure of justice per
frame of Fairness theory – Fuzzy approach. Expert Systems with Applications, 38, 73
Bagozzi, R. P. 1975. Marketing as Exchange. Journal of Marketing, 39, 32–39. https://doi.o
1250593
Barclay, L. J., D. P. Skarlicki,and S. D. Pugh. 2005. Exploring the Role of Emotions in Inju
tions and Retaliation. Journal of Applied Psychology, 90(4), 629–643.
Barclay, L. J., and D. P. Skarlicki. 2009. Healing the Wounds of Organizational Injustice: E
Benefits of Expressive Writing. Journal of Applied Psychology, 94(2), 511–523.
Blader, S. L., B. M. Wiesenfeld, M. Fortin, and S. L. Wheeler-Smith. 2013. Fairness Lies in
The Beholder: How The Social Emotions of Third Parties Influence Reactions to Injus
nizational Behavior and Human Decision Processes, 121, 62–80.
Cassar, V., and S. C. Buttigieg. 2015. Psychological Contract Breach, Organizational Justic
Well-being. Personnel Review, 44(2), 217–235.
Chalmers, S. 2016. Ethical Fairness in Financial Services Complaint Handling. Internation
Marketing, 34(4), 570–586.
Chen, A., N. Peng, and K. Hung. 2015. The Effects of Luxury Restaurant Environments on
Emotions and Loyalty: Incorporating Diner Expectations into An Extended Mehrabian
Model. International Journal of Contemporary Hospitality Management, 27(2), 236–2
Chou, C., Y. Hsu, and Y. Goo. 2009. Service Failures and Recovery Strategies from the Ser
Perspective. Asia Pacific Management Review, 14(2), 237–249.
Chun, J. S., J. Brockner, and D. De Cremer. 2018. How Temporal and Social Comparisons i
mance Evaluation Affect Fairness Perceptions. Organizational Behavior and Human D
145, 1–15.
Cohen-Charash, Y., and P. E. Spector. 2001. The Role of Justice in Organizations: A Meta
Organizational Behavior and Human Decision Processes, 86(2), 278–321.
Colquitt, J. A. 2001. On The Dimensionality of Organizational Justice: A Construct Valida
Measure. Journal of Applied Psychology, 86(3), 386–400. https://doi.org/10.1037//002
Cropanzano, R., D. E. Bowen, and S. W. Gilliland. 2007. The Management of Organization
Academy of Management Perspectives, 21(4), 34–48.
Cropanzano, R. L. Paddock, D. E. Rupp, J. Bagger,and A. Baldwin. 2008. How Regulatory F
pacts The Process-by-Outcome Interaction for Perceived Fairness and Emotions. Orga
Behavior and Human Decision Processes, 105, 36–51.
Cropanzano, R., and J. H. Stein. 2009. Organizational Justice and Behavioral Ethics: Promi
pects. Business Ethics Quarterly, 19(2), 193–233.
BudiyantiandPatiro
250
Croonen, E. 2010. Trust and Fairness During Strategic Change Processes in Franchise Systems
Business Ethics, 95(2), 191–209.
Daskalopoulou, I. 2008. Fairness perceptions and observed consumer behavior: Results o
observability model. The Journal of Socio-Economics, 37, 31–44.
Deutsch, M. 1985. Distributive Justice. (Lexington Books, Ed.)
Dzansi, L. W. 2016. A South African Study Of Influence Of Fairness Of Human Resource Mana
Practices On Service Quality. The Journal of Applied Business Research, 32(2), 871–882.
Faullant, R., J. Fueller, and K. Hutter. 2017. Fair Play: Perceived Fairness in Crowdsourcing Co
and The Customer Relationship-Related Consequences. Management Decision, 55(9), 1924
Fishbein, M., and I. Ajzen. 2010. Predicting and Changing Behavior: The Reasoned Action Appr
Hove: Psychology Press Taylor and Francis Group.
Fishbein, M., and S. Middlestadt. 1995. Noncognitive Effects on Attitude Formation and Chang
Artifact? Journal of Consumer Psychology, 4(2), 181–202. https://doi.org/10.1207/
s15327663jcp0402_05
Fornell, C., and D. F. Larcker. 1981. Evaluation Structural Equation Models with Unobservable
and Measurement Error. Journal of Marketing Research, 18(1), 39–50.
Giovanis, A., P. Athanasopoulou, and E. Tsoukatos. 2015. The Role of Service Fairness in The S
Quality – Relationship Quality – Customer Loyalty Chain: An Empirical Study. Journal of S
Theory and Practice, 25(6), 744–766.
Goldenberg, I., M. Andres, and D. Resteigne. 2016. Is Military Employment Fair? Application of
Comparison Theory in a Cross-National Military Sample. Armed Forces & Society, 42(3), 5
Gronroos, C. 2007. Service Management and Marketing: Customer Management in Service Com
Wiley.
Hair, J. F., W. C. Black, B. J. Babin, and R. E. Anderson. 2010.Multivariate Data Analysis (7th ed.). Upper
Saddle River, NJ: Pearson Education. https://doi.org/10.1016/j.ijpharm.2011.02.019
Haws, K. L., and W. O. Bearden. (2006). Dynamic Pricing and Consumer Fairness Perceptions.
Consumer Research, 33(3), 304–311. https://doi.org/10.1086/508435
Heo, C. Y., and S. Lee. 2011. Influences of Consumer Characteristics on Fairness Perceptions o
Management Pricing in The Hotel Industry. International Journal of Hospitality Managem
251.
Homburg, C., D. Totzek, and M. Kramer. 2014. How Price Complexity Takes Its Toll: The Negle
Role of a Simplicity Bias and Fairness in Price Evaluations. Journal of Business Research,
1122.
Huang, W. 2016. Responsible Pay: Managing Compliance, Organizational Efficiency and Fairne
Choice of Pay Systems in China’s Automotive Companies. The International Journal of Hu
source Management, 27(18), 2161–2181.
Hur, W., S. I. L. Park,and T. Moon. 2014. The Moderating Roles of Organizational Just
Relationship between Emotional Exhaustion and Organizational Loyalty in Airline Services
of Services Marketing, 28(3), 195–206.
Jang, S.,and Y. Namkung. 2009. Perceived Quality, Emotions, and Behavioral Intentions: Applic
An Extended Mehrabian–Russell Model to Restaurants. Journal of Business Research, 62,
Secure Best Marks with AI Grader
Need help grading? Try our AI Grader for instant feedback on your assignments.
251
Gadjah Mada International Journal of Business– May-August, Vol. 20, No. 2, 2018
Kahneman, D., J. L. Knetsch, and R. Thaler. 1986. Fairness and The Assumptions of Econo
of Business, 59(4), S285–S300.
Kaura, V., C. S. D. Prasad, and S. Sharma. 2015. Service Quality, Service Convenience, Pr
Customer Loyalty, and The Mediating Role of Customer Satisfaction. International Jo
Marketing, 33(4), 404–422.
Kim, J.,and S. J. Lennon. 2013. Effects of Reputation and Website Quality on Online Consu
tion, Perceived Risk and Purchase Intention: Based on The Stimulus-Organism-Respo
Journal of Research in Interactive Marketing, 7(1), 33–56.
Kim, S.,and S. Park. 2017. Diversity Management and Fairness in Public Organizations. Pu
Review, 17, 179–193.
Kukar-Kinney, M., L. Xia, and K. B. Monroe. 2007. Consumers’ Perceptions of The Fairnes
Matching Refund Policies. Journal of Retailing, 83(3), 325–337.
Lee, S. H. 2010. Consumer Response to Technology Products. Dissertation, Consumer Scie
Purdue University
Lee, Y. L., B. Sparks, and K. Butcher. 2013. Service Encounters and Face Loss: Issues of F
ness, and Context. International Journal of Hospitality Management, 34, 384–393.
Liang, R.,and J. Zhang. 2011. The Effect Of Service Interaction Orientation On Customer S
And Behavioral Intention: The Moderating Effect Of Dining Frequency. Procedia Soc
ioral Sciences, 24, 1026–1035.
Liang, C., D. Gua, F. Tao, H. K. Jain, Y. Zhao, and B. Ding. 2017. Influence of Mechanism o
Accessible Hospital Information System Implementation on Doctor–Patient Relationsh
vice Fairness Perspective. Information & Management, 54, 57–72.
Lii, Y., and E. Sy. 2009. Internet Differential Pricing: Effects on Consumer Price Perception
and Behavioral Responses. Computers in Human Behavior, 25, 770–777.
Liu, W., X. Shen, and D. Xie. 2017. Decision Method for The Optimal Number of Logistics
Providers with Service Quality Guarantee and Revenue Fairness. Applied Mathematic
53–69.
Ltifi, M.,and J. Gharbi. 2012. E-Satisfaction and E-Loyalty of Consumers Shopping Online.
Internet Banking and Commerce, 17(1), 1–20.
Mehrabian, A., and J. A. Russell. 1974. An Approach to Environmental Psychology. MIT Pre
Namasivayam, K. 2004. Action Control, Proxy Control, and Consumers’ Evaluations of The
Exchange. Psychology and Marketing, 21(6), 463–480. https://doi.org/10.1002/mar.20
Namkung, Y., and S. C. Jang. 2010. Effects of Perceived Service Fairness on Emotions, an
Intentions in Restaurants. European Journal of Marketing, 44(9/10), 1233–1259
10.1108/03090561011062826
Naquin, C. E., T. R. Kurtzberg, and A. Krishnan. 2015. Fairness Judgments and Counterfac
Pricing Goods versus Services. International Journal of Organizational Analysis, 23(2
Nguyen, B., and P. Klaus. 2013. Retail Fairness: Exploring Consumer Perceptions of Fairn
Retailers’ Marketing Tactics. Journal of Retailing and Consumer Services, 20, 311–32
Nikbin, D., M. Marimuthu, and S. S. Hyun. 2016. Influence of Perceived Service Fairness
Quality and Switching Intention: An Empirical Study of Restaurant Experiences. Cur
Tourism, 19(10), 1005–1026.
BudiyantiandPatiro
252
Nunnally, J. C., and I. H. Bernstein. (1994). Psychometric Theory (3rd ed). McGraw-Hill.
Radke, S., I. C. Schäfer, B. W. Müller, and E. R. A. de Bruijn. 2013. Do Different Fairness Conte
Facial Emotions Motivate “Irrational” Social Decision-Making in Major Depression? An Ex
atory Patient Study. Psychiatry Research, 210, 438–443.
Reuben, E., and F. van Winden. 2010. Fairness Perceptions and Prosocial Emotions in The Pow
Take. Journal of Economic Psychology, 31, 908–922.
Roy, S. K., W. M. Lassar, and V. Shekhar. 2016. Convenience and Satisfaction: Mediation of Fa
Quality. The Service Industries Journal, 36(5–6), 239–260.
Schlett, C., and R. Ziegler. 2014. Job Emotions and Job Cognitions as Determinants of Job Satis
The Moderating Role of Individual Differences in Need for Affect. Journal of Vocational B
84, 74–89.
Seiders, K., and L. L. Berry. 1998. Service Fairness: What It Is and Why It Matters. Academy of
Executive, 12(2), 8–20.
Sekhon, H. S., S. L. Roy, and J. Devlin. 2016. Perceptions of Fairness in Financial Services: An
Distribution Channels. International Journal of Bank Marketing, 34(2), 171–190.
Silva, M. R., and A. Caetano. 2016. Organizational Justice Across Cultures: A Systematic Review
Decades of Research and Some Directions for the Future. Social Justice Research, 29, 257
Sjostrom, O., and D. Holst. 2002. Validity of A Questionnaire Survey: Response Patterns in Diff
Subgroups and The Effect of Social Desirability. Acta Odontologica Scandinavica, 60(3), 1
Skarlicki, D. P., D. D. van Jaarsveld, and D. D.Walker. 2008. Getting Even for Customer Mistrea
The Role of Moral Identity in the Relationship Between Customer Interpersonal Injustice a
Employee Sabotage. Journal of Applied Psychology, 93(6), 1335–1347.
Smith, A. K., and R. N. Bolton. 2002. The Effect of Customers’ Emotional Responses to Service
on Their Recovery Effort Evaluations and Satisfaction Judgments. Journal of the Academy
ing Science, 30(1), 5–23. https://doi.org/10.1177/03079450094298
Su, L., S. Huang, and X. Chen. 2015. Effects of Service Fairness and Service Quality on Tourist
ioral Intentions and Subjective Well-Being. Journal of Travel & Tourism Marketing, 32(3),
Su, L., S. R. Swanson, and X. Chen. 2016. The Impact of Perceived Service Fairness and Qualit
Behavioral Intentions of Chinese Hotel Guests: the Mediating Role of Consumption Emoti
Journal of Travel & Tourism Marketing, 33(1), 88–102.
Tangney, J. P., and K. W. Fischer. 1995. Self-conscious Emotions: The Psychology of Shame, Gu
and Pride. Guildford Press.
Tzafrir,S. S., and S. Hareli. 2009. Employees’ Emotional Reactions to Promotion Decisions: The
Causal Attributions and Perceptions of Justice. Career Development International, 14(4), 3
Uludag, O. 2014. Fair and Square: How does Perceptions of Fairness is Associated to
Procedia - Social and Behavioral Sciences, 143, 504–508.
Wang, N., Z. Fan, and X. Wang. 2016. Channel Coordination in Logistics Service Supply Chain
ing Fairness. Mathematical Problems in Engineering, 1–15.
Wang, X., K. F. Yuen, Y. D. Wong, and C. Teo. 2018. It is Green, but Is It Fair? Investigating Con
Fairness Perception of Green Service Offerings. Journal of Cleaner Production, 181, 235–
253
Gadjah Mada International Journal of Business– May-August, Vol. 20, No. 2, 2018
Wen, B., and C. Geng qing Chi. 2013. Examine The Cognitive and Affective Antecedents to
Recovery Satisfaction. International Journal of Contemporary Hospitality Manageme
https://doi.org/10.1108/09596111311310991
White, A., M. Breazeale, and J. E. Collier. 2012. The Effects of Perceived Fairness on Cust
sponses to Retailer SST Push Policies. Journal of Retailing, 88(2), 250–261.
Williamson, K., and K. J. Williams. 2011. Organisational Justice, Trust and Perceptions of
Implementation of Agenda for Change. Radiography, 17, 61–66.
Xia, L., K. B. Monroe, and J. L. Cox. 2004. The Price Is Unfair! A Conceptual Framework of
Fairness Perceptions. Journal of Marketing, 68(4), 1–15. https://doi.org/10.1509/jmkg
Xia, L., and K. B. Monroe. 2010. Is A Good Deal Always Fair? Examining The Concepts of
Value and Price Fairness. Journal of Economic Psychology, 31, 884–894.
Xia, L., M. Kukar-Kinney, and K. B. Monroe. 2010. Effects of Consumers’ Efforts on Price
tion Fairness Perceptions. Journal of Retailing, 86(1), 1–10.
Xu, X., S. C. Payne, M. T. Horner, and A. L. Alexander. 2016. Individual Difference
Perceived Organizational Change Fairness. Journal of Managerial Psychology, 31(2),
Zmerli, S., and J. C. Castillo. 2015. Income Inequality, Distributive Fairness and Political T
America. Social Science Research, 52, 179–192.
Paraphrase This Document
Need a fresh take? Get an instant paraphrase of this document with our AI Paraphraser

Copyright of Gadjah Mada International Journal of Business is the property of Gadjah Mada
University, Master of Management Program and its content may not be copied or emailed to
multiple sites or posted to a listserv without the copyright holder's express written permission.
However, users may print, download, or email articles for individual use.
University, Master of Management Program and its content may not be copied or emailed to
multiple sites or posted to a listserv without the copyright holder's express written permission.
However, users may print, download, or email articles for individual use.
1 out of 26


Your All-in-One AI-Powered Toolkit for Academic Success.
+13062052269
info@desklib.com
Available 24*7 on WhatsApp / Email
![[object Object]](/_next/static/media/star-bottom.7253800d.svg)
Unlock your academic potential
© 2024 | Zucol Services PVT LTD | All rights reserved.