Gantt Chart | Project Management
VerifiedAdded on 2022/09/22
|11
|1471
|18
AI Summary
Contribute Materials
Your contribution can guide someone’s learning journey. Share your
documents today.
Running head: PROJECT MANAGEMENT
Project management
Name of the Student
Name of the University
Author’s Note
Project management
Name of the Student
Name of the University
Author’s Note
Secure Best Marks with AI Grader
Need help grading? Try our AI Grader for instant feedback on your assignments.
1
PROJECT MANAGEMENT
Table of Contents
Part I.................................................................................................................................................2
Part II...............................................................................................................................................2
a) Explanation of the 1st option that is 4-week strike................................................................2
b) Explanation of the 2nd option that is cold and wet weather.....................................................3
Part III..............................................................................................................................................4
a) SPI calculation and its impact on the schedule........................................................................4
b) CPI calculation and its impact on schedule.............................................................................5
c) Executive summary by using statistics...................................................................................6
d) EAC calculation and remaining critical path..........................................................................7
Bibliography....................................................................................................................................9
2
PROJECT MANAGEMENT
Part I
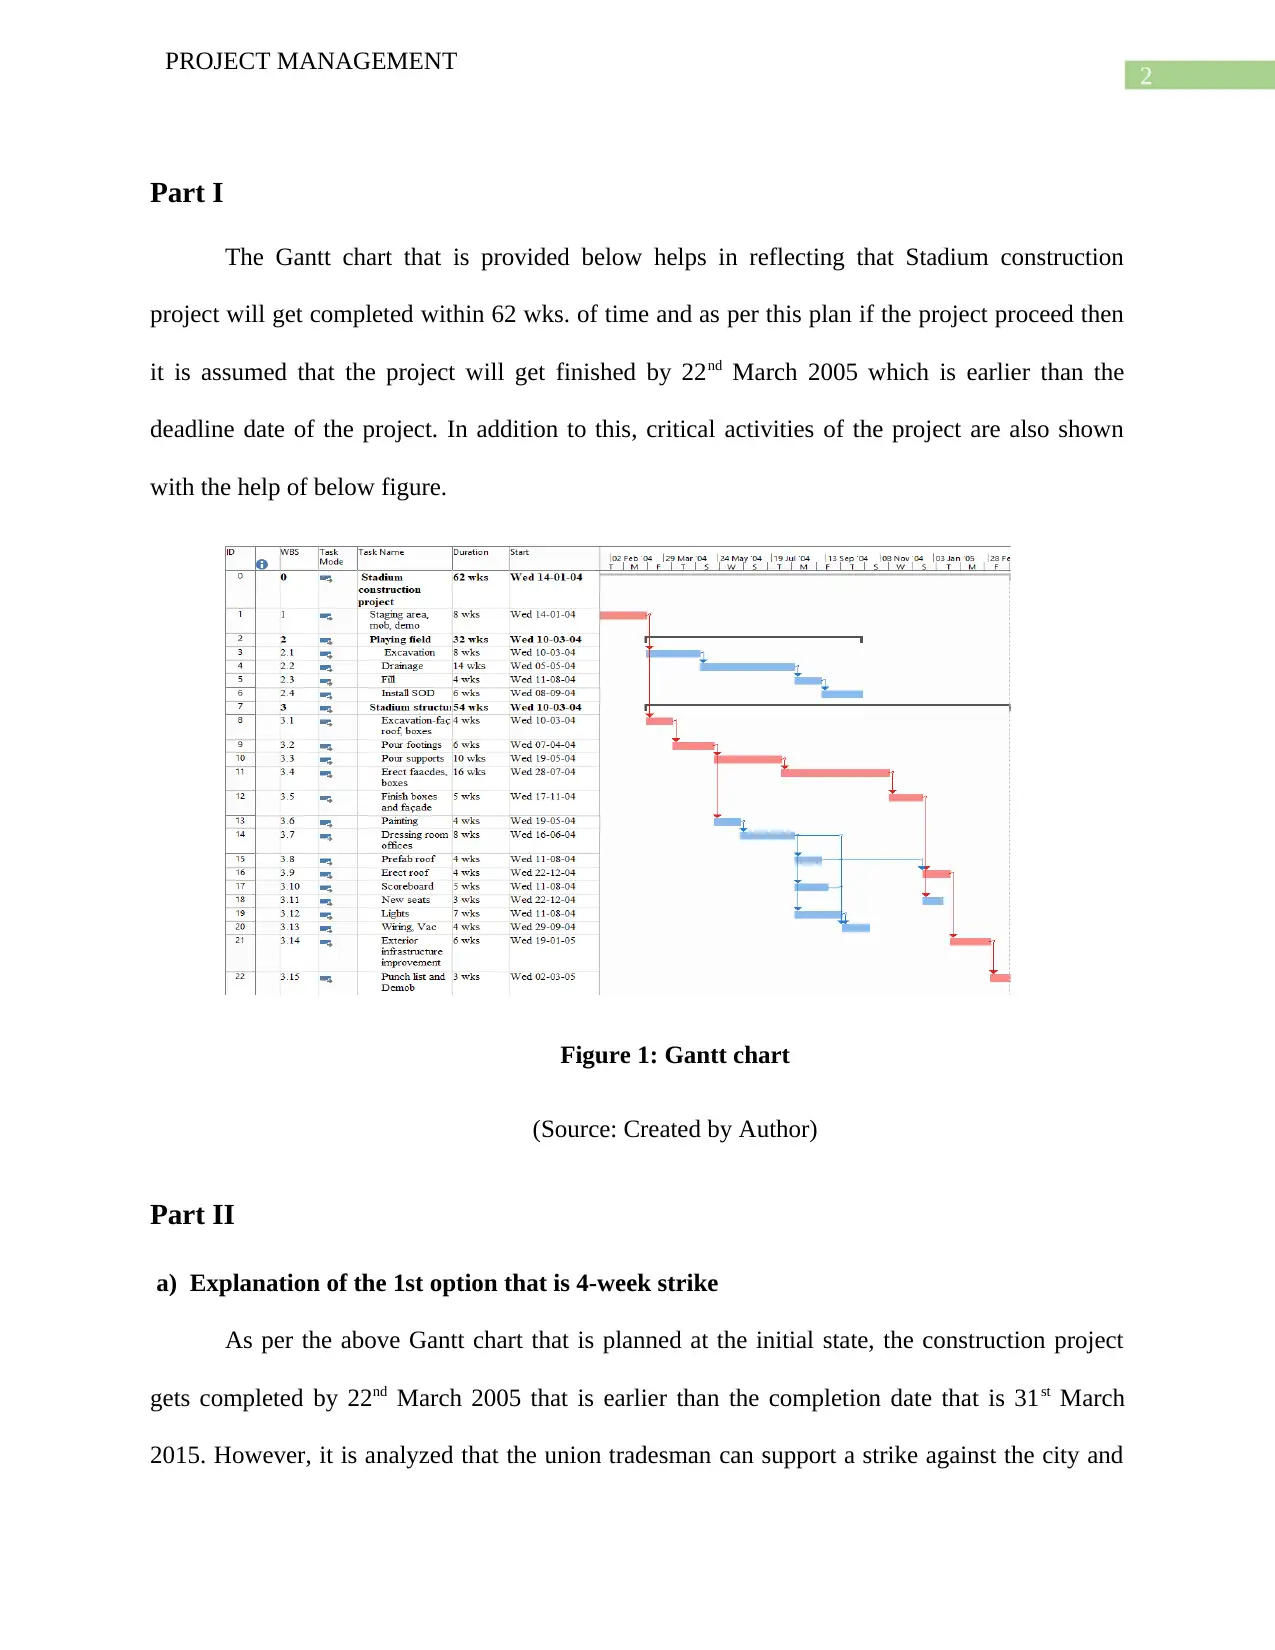
The Gantt chart that is provided below helps in reflecting that Stadium construction
project will get completed within 62 wks. of time and as per this plan if the project proceed then
it is assumed that the project will get finished by 22nd March 2005 which is earlier than the
deadline date of the project. In addition to this, critical activities of the project are also shown
with the help of below figure.
Figure 1: Gantt chart
(Source: Created by Author)
Part II
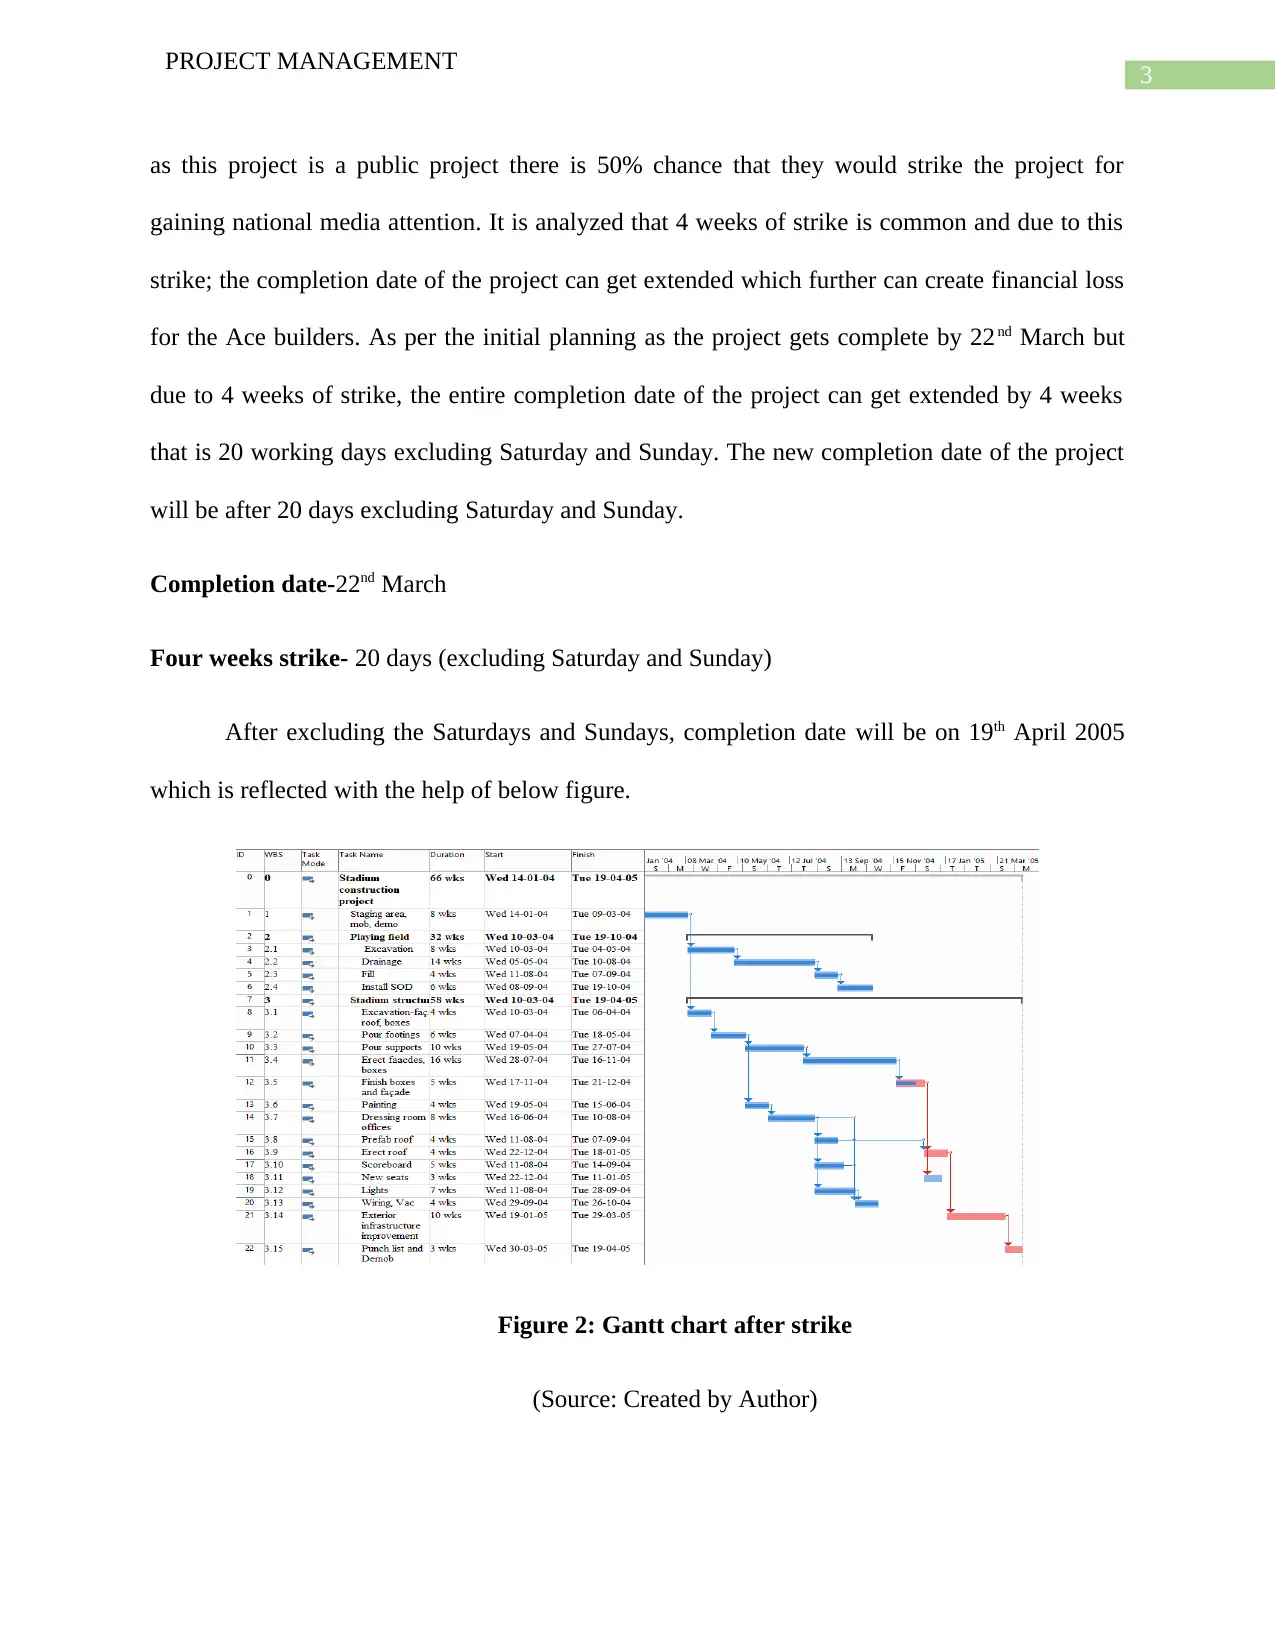
a) Explanation of the 1st option that is 4-week strike
As per the above Gantt chart that is planned at the initial state, the construction project
gets completed by 22nd March 2005 that is earlier than the completion date that is 31st March
2015. However, it is analyzed that the union tradesman can support a strike against the city and
PROJECT MANAGEMENT
Part I
The Gantt chart that is provided below helps in reflecting that Stadium construction
project will get completed within 62 wks. of time and as per this plan if the project proceed then
it is assumed that the project will get finished by 22nd March 2005 which is earlier than the
deadline date of the project. In addition to this, critical activities of the project are also shown
with the help of below figure.
Figure 1: Gantt chart
(Source: Created by Author)
Part II
a) Explanation of the 1st option that is 4-week strike
As per the above Gantt chart that is planned at the initial state, the construction project
gets completed by 22nd March 2005 that is earlier than the completion date that is 31st March
2015. However, it is analyzed that the union tradesman can support a strike against the city and
3
PROJECT MANAGEMENT
as this project is a public project there is 50% chance that they would strike the project for
gaining national media attention. It is analyzed that 4 weeks of strike is common and due to this
strike; the completion date of the project can get extended which further can create financial loss
for the Ace builders. As per the initial planning as the project gets complete by 22nd March but
due to 4 weeks of strike, the entire completion date of the project can get extended by 4 weeks
that is 20 working days excluding Saturday and Sunday. The new completion date of the project
will be after 20 days excluding Saturday and Sunday.
Completion date-22nd March
Four weeks strike- 20 days (excluding Saturday and Sunday)
After excluding the Saturdays and Sundays, completion date will be on 19th April 2005
which is reflected with the help of below figure.
Figure 2: Gantt chart after strike
(Source: Created by Author)
Secure Best Marks with AI Grader
Need help grading? Try our AI Grader for instant feedback on your assignments.
4
PROJECT MANAGEMENT
It is found that as the project gets delayed by 20 days and for each day of delay, the
organization need to pay an amount of $250,000.
As the project gets extended till 19th April therefore the amount that the company will
lose will be around (19*250,000) = 4,750,000
Therefore, it is found that within profit of $20,000,000, the organization will lose
$4,750,000
b) Explanation of the 2nd option that is cold and wet weather
It is found that after planning of the project, Vice President for operations also bring an
issue that is related with extreme cold and wet weather condition and this factor have not taken
into consideration during the planning phase. It is found that if the workers are unable to work in
cold and dry weather then the project can get delayed by 1 month which can be quite challenging
for the project team. This can be considered as one of the planning issues for construction and
due to this issue, the completion date can get extended and the organization will loss an amount
of around $5, 000,000 due to delay of 1 month (20working days) in the project. In order to avoid
such issues, it is the responsibility of the project manager to take important facts into
consideration before starting the project for avoiding challenges during the project progress.
Part III
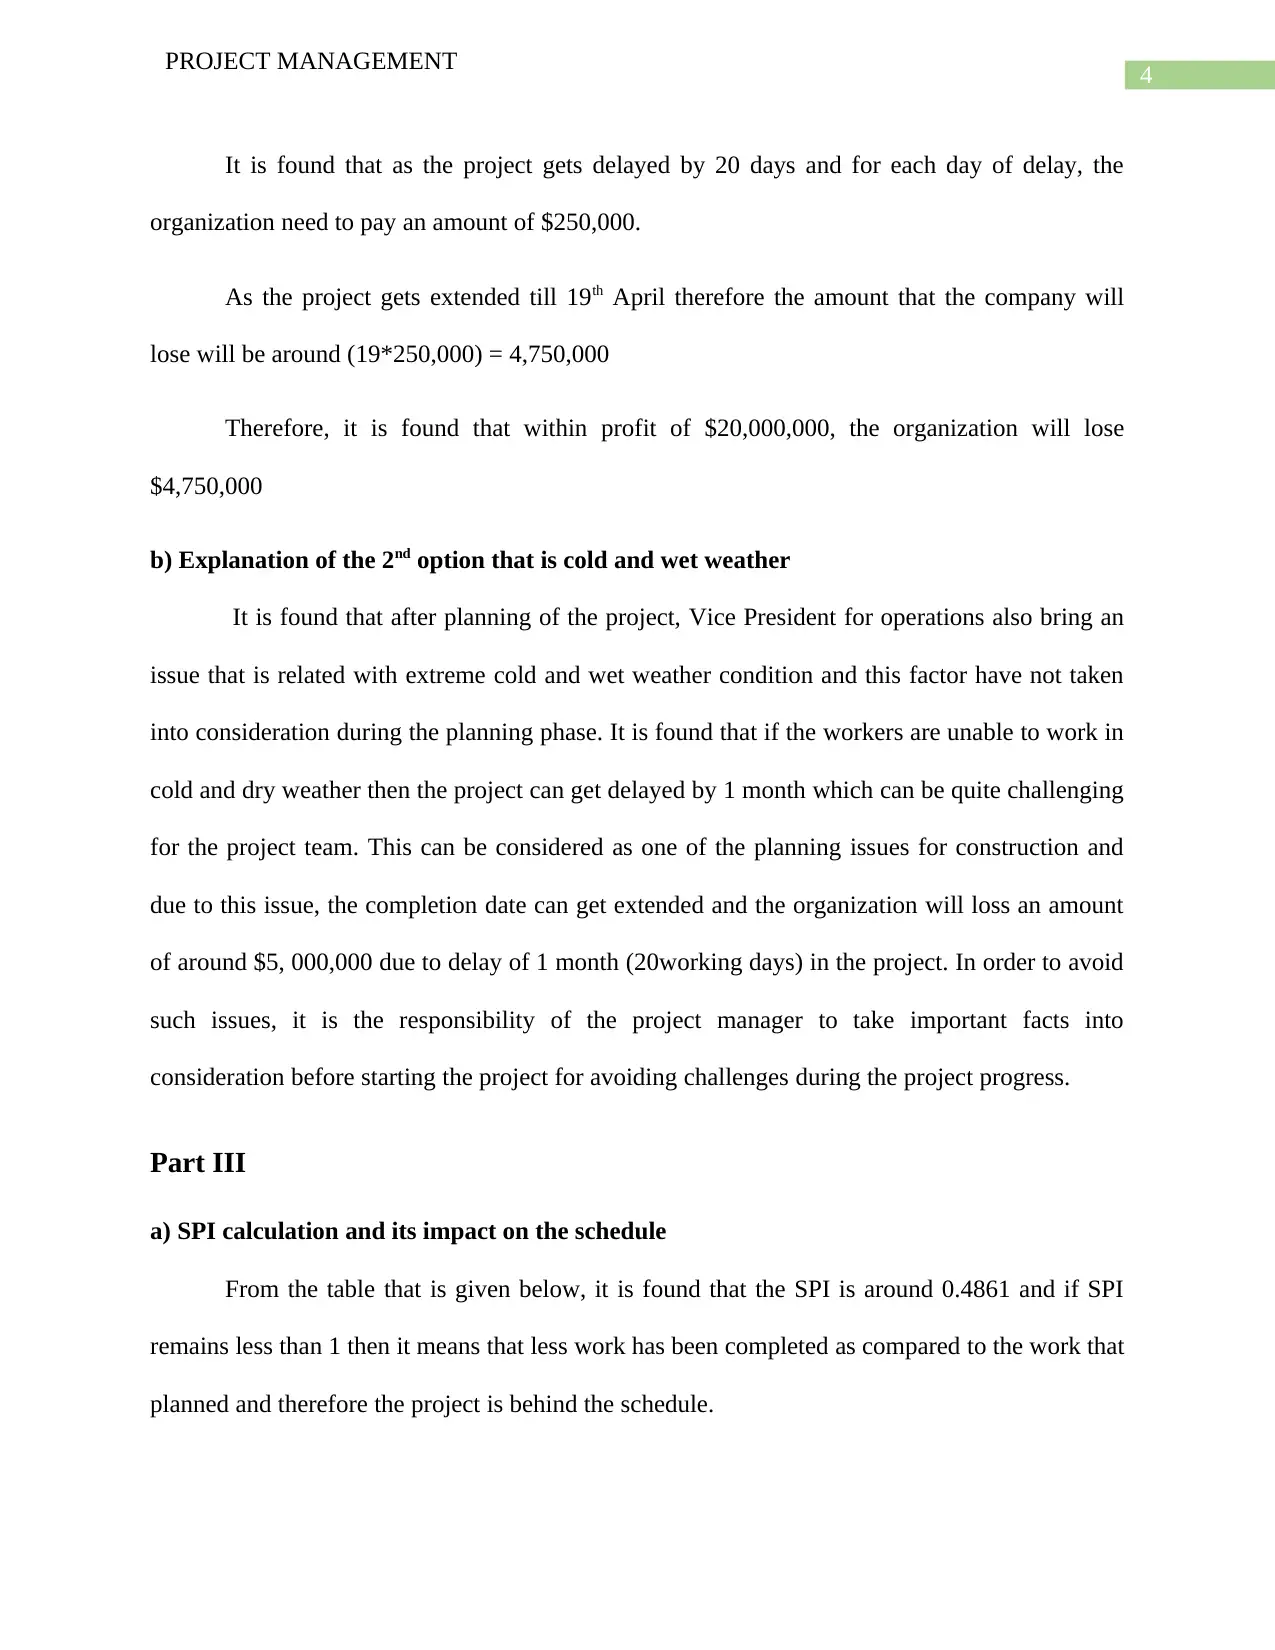
a) SPI calculation and its impact on the schedule
From the table that is given below, it is found that the SPI is around 0.4861 and if SPI
remains less than 1 then it means that less work has been completed as compared to the work that
planned and therefore the project is behind the schedule.
PROJECT MANAGEMENT
It is found that as the project gets delayed by 20 days and for each day of delay, the
organization need to pay an amount of $250,000.
As the project gets extended till 19th April therefore the amount that the company will
lose will be around (19*250,000) = 4,750,000
Therefore, it is found that within profit of $20,000,000, the organization will lose
$4,750,000
b) Explanation of the 2nd option that is cold and wet weather
It is found that after planning of the project, Vice President for operations also bring an
issue that is related with extreme cold and wet weather condition and this factor have not taken
into consideration during the planning phase. It is found that if the workers are unable to work in
cold and dry weather then the project can get delayed by 1 month which can be quite challenging
for the project team. This can be considered as one of the planning issues for construction and
due to this issue, the completion date can get extended and the organization will loss an amount
of around $5, 000,000 due to delay of 1 month (20working days) in the project. In order to avoid
such issues, it is the responsibility of the project manager to take important facts into
consideration before starting the project for avoiding challenges during the project progress.
Part III
a) SPI calculation and its impact on the schedule
From the table that is given below, it is found that the SPI is around 0.4861 and if SPI
remains less than 1 then it means that less work has been completed as compared to the work that
planned and therefore the project is behind the schedule.
5
PROJECT MANAGEMENT
Tasks %Complete Bid Price ($) Actual expense Earned value
Duration
(Weeks) Actual
Staging area, mobilization, demolition 100 65,00,000 75,00,000 65,00,000 8 8.5
Exacavation-field 100 75,000 75,000 75,000 8 8
Subsurface drainage 100 3,70,000 2,70,000 3,70,000 14 10
Fill material for field 100 50,000 50,000 50,000 4 2
Instalaltion of turf 0 1,00,000 0 0 6 0
Excavation-façade, roof supports, boxes 100 10,00,000 10,00,000 10,00,000 4 5
Pouring concrete footings 100 1,85,00,000 1,85,00,000 1,85,00,000 6 6
Pouring box, roof and fascade supports 100 5,95,00,000 5,35,00,000 5,95,00,000 10 11
Erecting pre-cast concrete façade and boxes 75 7,50,00,000 5,72,50,000 5,62,50,000 16 13
Finishing of boxes and new façade 0 3,00,00,000 0 0 5 0
Painting 10 50,00,000 5,00,000 5,00,000 4 0.5
Dressing rooms, offices and concession 10 1,20,00,000 12,00,000 12,00,000 8 1
Prefabricated the retractable roof 90 1,00,00,000 95,00,000 90,00,000 4 4
Erecting the roof 10 52,50,000 5,50,000 5,25,000 4 0.5
Scoreboard 75 1,00,00,000 72,50,000 75,00,000 5 3
New seats 10 3,20,00,000 32,00,000 32,00,000 3 0.5
Lights and other facilities 5 4,00,00,000 20,00,000 20,00,000 7 0.1
Wiring, HVAC 15 2,00,00,000 30,00,000 30,00,000 4 1
Exterior infrastructurre improvements 5 1,96,55,000 9,82,750 9,82,750 6 0.1
Punch list and demolization 0 50,00,000 0 0 3 0
TOTAL 350000000 16,63,27,750 17,01,52,750
Figure 2: SPI calculation
(Source: Created by Author)
b) CPI calculation and its impact on schedule
As per the table that is provided below, it is analyzed that CPI of the project will be
around 1.022 which reflects that the project is under budget and therefore it can be assumed that
the project can get completed within the budget that is assumed. The calculation is reflected in
the below table.
6
PROJECT MANAGEMENT
Tasks %Complete Bid Price ($) Actual expense Earned value
Duration
(Weeks) Actual
Staging area, mobilization, demolition 100 65,00,000 75,00,000 65,00,000 8 8.5
Exacavation-field 100 75,000 75,000 75,000 8 8
Subsurface drainage 100 3,70,000 2,70,000 3,70,000 14 10
Fill material for field 100 50,000 50,000 50,000 4 2
Instalaltion of turf 0 1,00,000 0 0 6 0
Excavation-façade, roof supports, boxes 100 10,00,000 10,00,000 10,00,000 4 5
Pouring concrete footings 100 1,85,00,000 1,85,00,000 1,85,00,000 6 6
Pouring box, roof and fascade supports 100 5,95,00,000 5,35,00,000 5,95,00,000 10 11
Erecting pre-cast concrete façade and boxes 75 7,50,00,000 5,72,50,000 5,62,50,000 16 13
Finishing of boxes and new façade 0 3,00,00,000 0 0 5 0
Painting 10 50,00,000 5,00,000 5,00,000 4 0.5
Dressing rooms, offices and concession 10 1,20,00,000 12,00,000 12,00,000 8 1
Prefabricated the retractable roof 90 1,00,00,000 95,00,000 90,00,000 4 4
Erecting the roof 10 52,50,000 5,50,000 5,25,000 4 0.5
Scoreboard 75 1,00,00,000 72,50,000 75,00,000 5 3
New seats 10 3,20,00,000 32,00,000 32,00,000 3 0.5
Lights and other facilities 5 4,00,00,000 20,00,000 20,00,000 7 0.1
Wiring, HVAC 15 2,00,00,000 30,00,000 30,00,000 4 1
Exterior infrastructurre improvements 5 1,96,55,000 9,82,750 9,82,750 6 0.1
Punch list and demolization 0 50,00,000 0 0 3 0
TOTAL 350000000 16,63,27,750 17,01,52,750
SPI 0.48615071
CPI 1.02299676
Figure 3: CPI calculation
(Source: Created by Author)
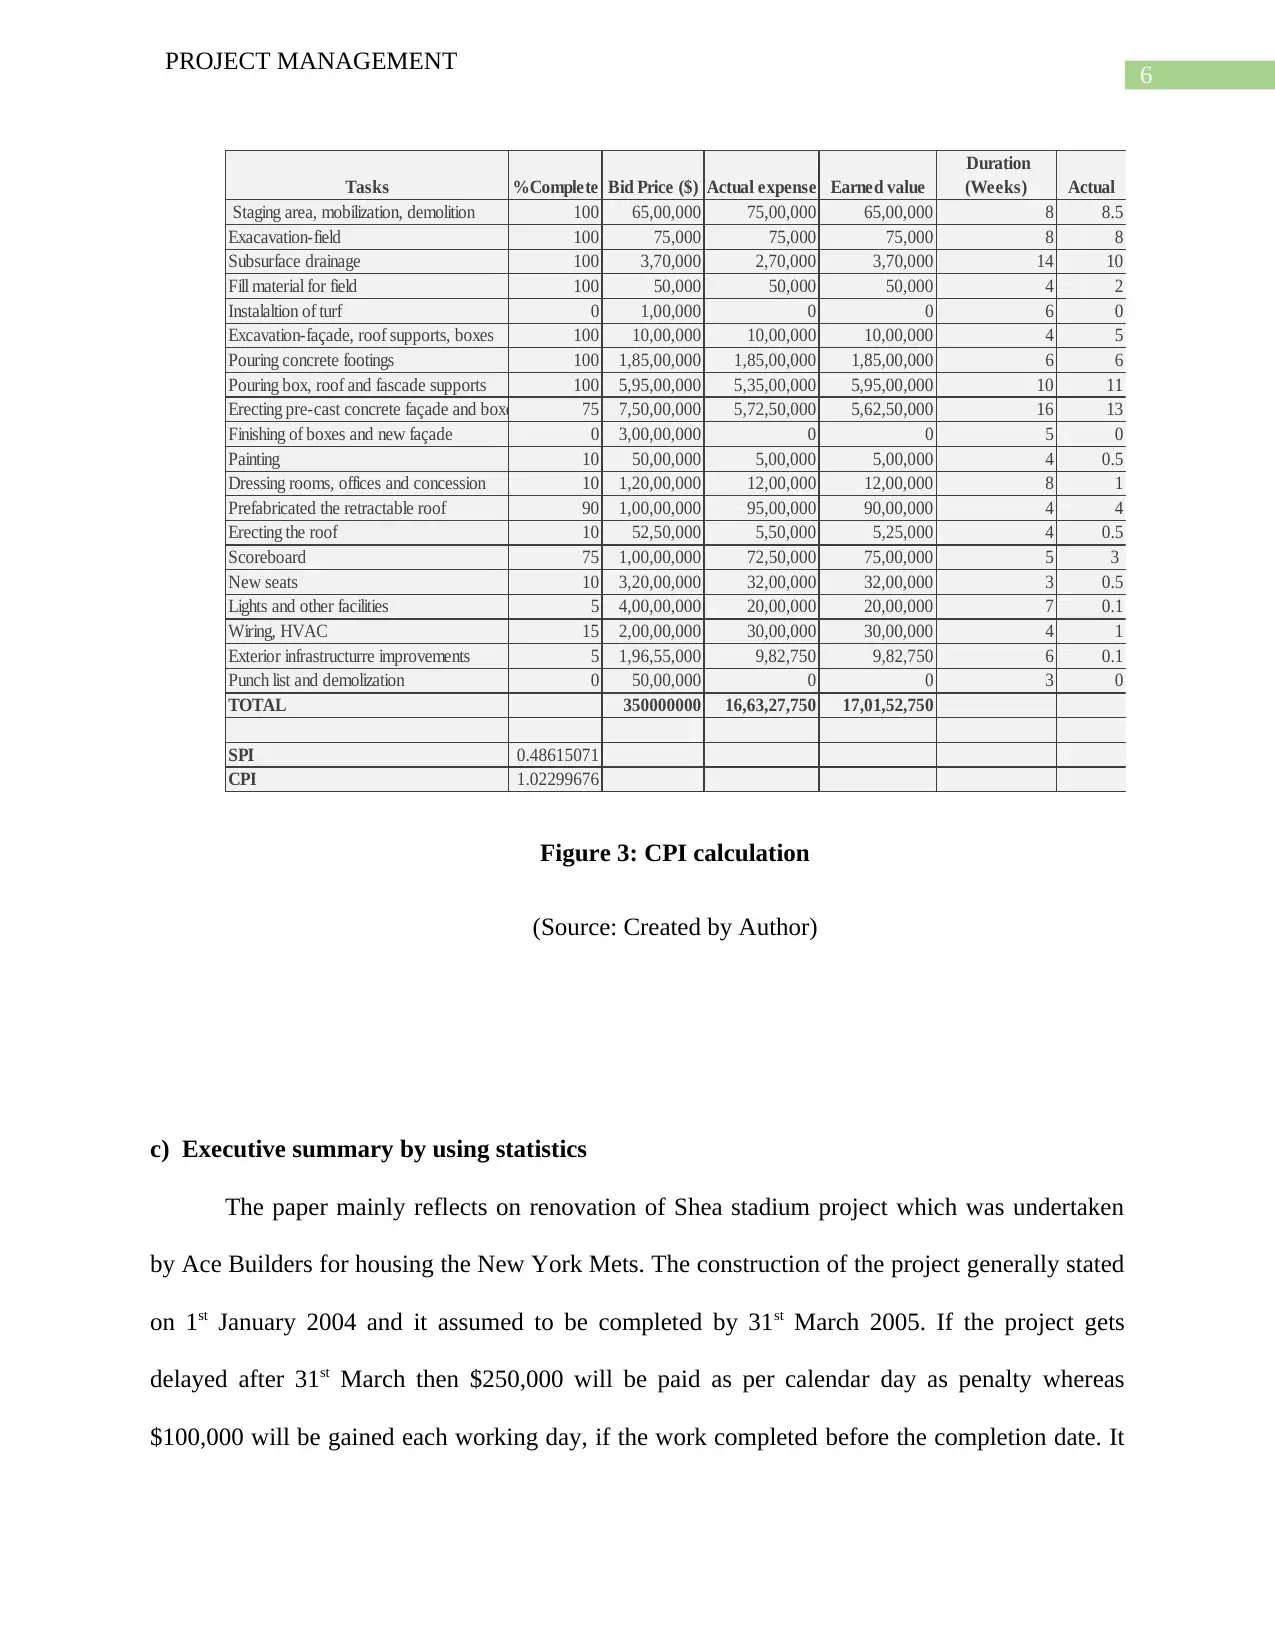
c) Executive summary by using statistics
The paper mainly reflects on renovation of Shea stadium project which was undertaken
by Ace Builders for housing the New York Mets. The construction of the project generally stated
on 1st January 2004 and it assumed to be completed by 31st March 2005. If the project gets
delayed after 31st March then $250,000 will be paid as per calendar day as penalty whereas
$100,000 will be gained each working day, if the work completed before the completion date. It
PROJECT MANAGEMENT
Tasks %Complete Bid Price ($) Actual expense Earned value
Duration
(Weeks) Actual
Staging area, mobilization, demolition 100 65,00,000 75,00,000 65,00,000 8 8.5
Exacavation-field 100 75,000 75,000 75,000 8 8
Subsurface drainage 100 3,70,000 2,70,000 3,70,000 14 10
Fill material for field 100 50,000 50,000 50,000 4 2
Instalaltion of turf 0 1,00,000 0 0 6 0
Excavation-façade, roof supports, boxes 100 10,00,000 10,00,000 10,00,000 4 5
Pouring concrete footings 100 1,85,00,000 1,85,00,000 1,85,00,000 6 6
Pouring box, roof and fascade supports 100 5,95,00,000 5,35,00,000 5,95,00,000 10 11
Erecting pre-cast concrete façade and boxes 75 7,50,00,000 5,72,50,000 5,62,50,000 16 13
Finishing of boxes and new façade 0 3,00,00,000 0 0 5 0
Painting 10 50,00,000 5,00,000 5,00,000 4 0.5
Dressing rooms, offices and concession 10 1,20,00,000 12,00,000 12,00,000 8 1
Prefabricated the retractable roof 90 1,00,00,000 95,00,000 90,00,000 4 4
Erecting the roof 10 52,50,000 5,50,000 5,25,000 4 0.5
Scoreboard 75 1,00,00,000 72,50,000 75,00,000 5 3
New seats 10 3,20,00,000 32,00,000 32,00,000 3 0.5
Lights and other facilities 5 4,00,00,000 20,00,000 20,00,000 7 0.1
Wiring, HVAC 15 2,00,00,000 30,00,000 30,00,000 4 1
Exterior infrastructurre improvements 5 1,96,55,000 9,82,750 9,82,750 6 0.1
Punch list and demolization 0 50,00,000 0 0 3 0
TOTAL 350000000 16,63,27,750 17,01,52,750
SPI 0.48615071
CPI 1.02299676
Figure 3: CPI calculation
(Source: Created by Author)
c) Executive summary by using statistics
The paper mainly reflects on renovation of Shea stadium project which was undertaken
by Ace Builders for housing the New York Mets. The construction of the project generally stated
on 1st January 2004 and it assumed to be completed by 31st March 2005. If the project gets
delayed after 31st March then $250,000 will be paid as per calendar day as penalty whereas
$100,000 will be gained each working day, if the work completed before the completion date. It
Paraphrase This Document
Need a fresh take? Get an instant paraphrase of this document with our AI Paraphraser
7
PROJECT MANAGEMENT
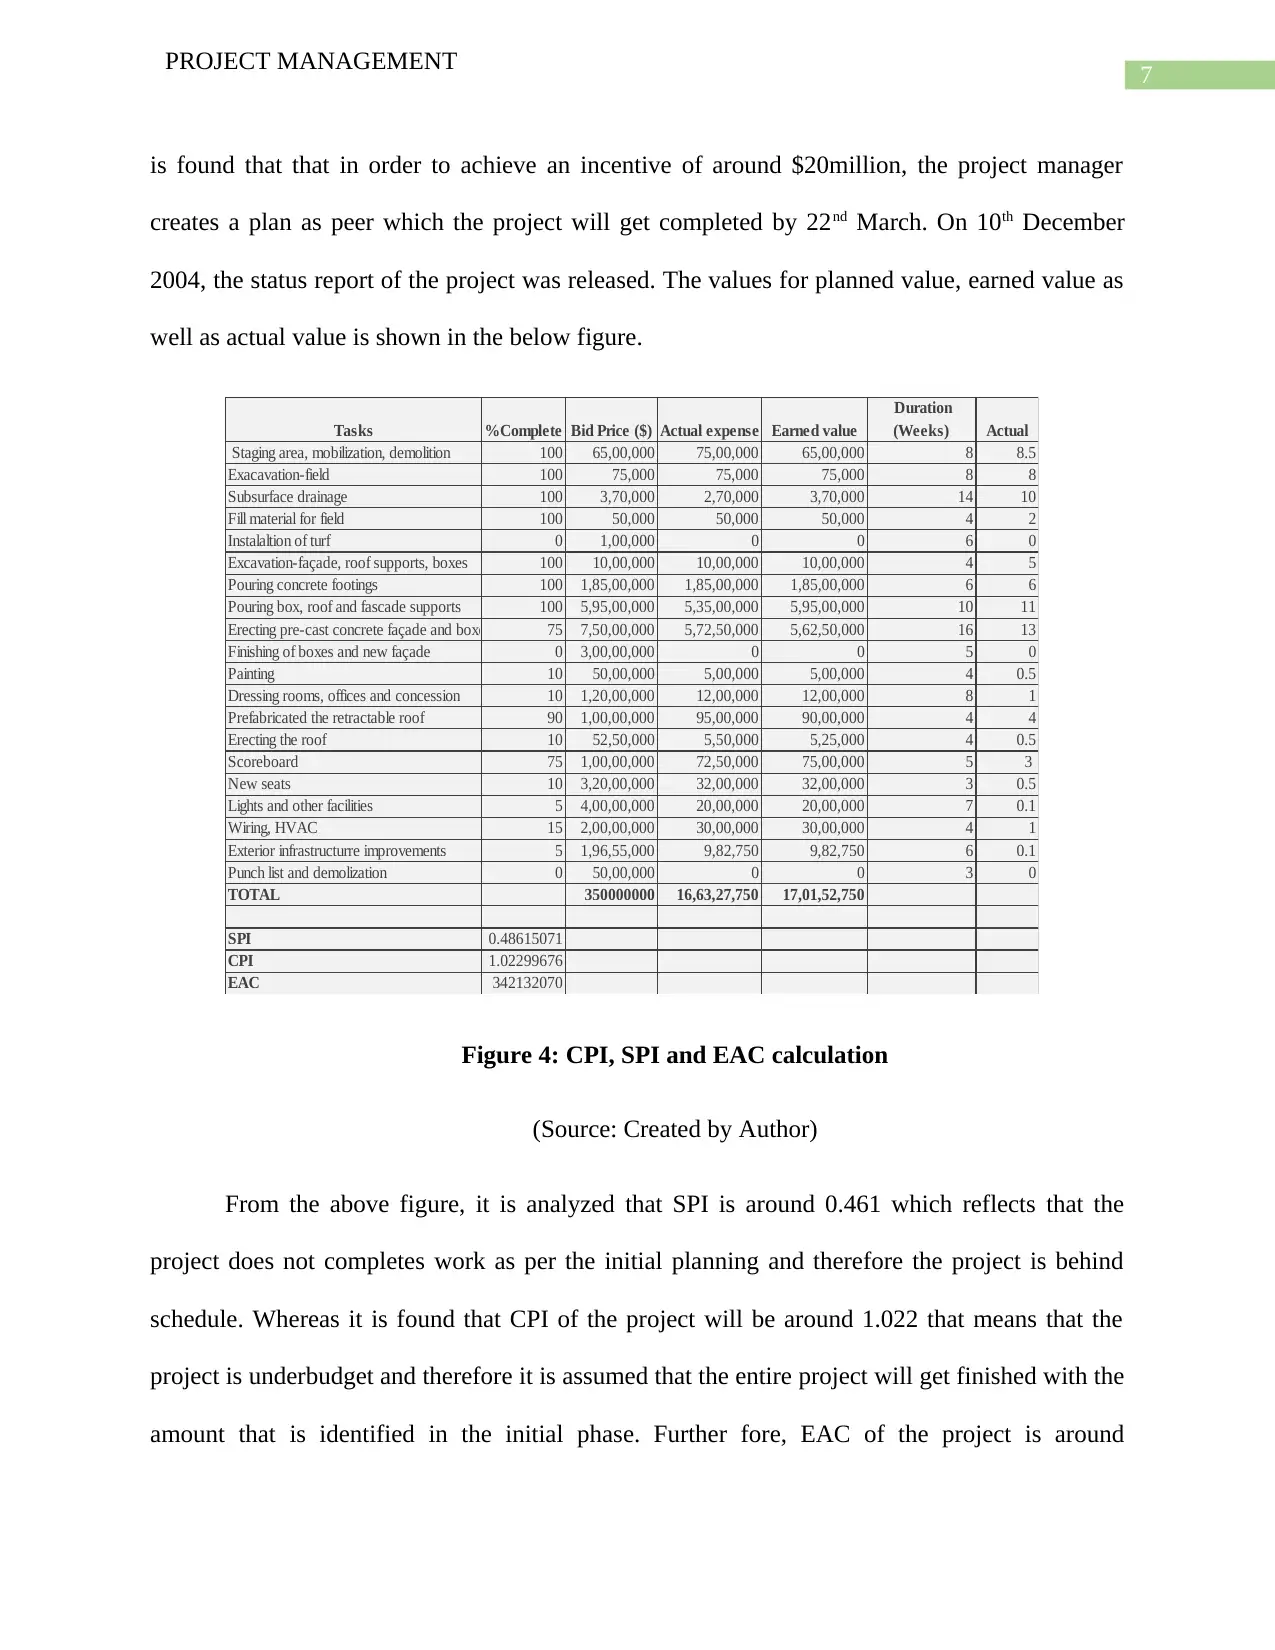
is found that that in order to achieve an incentive of around $20million, the project manager
creates a plan as peer which the project will get completed by 22nd March. On 10th December
2004, the status report of the project was released. The values for planned value, earned value as
well as actual value is shown in the below figure.
Tasks %Complete Bid Price ($) Actual expense Earned value
Duration
(Weeks) Actual
Staging area, mobilization, demolition 100 65,00,000 75,00,000 65,00,000 8 8.5
Exacavation-field 100 75,000 75,000 75,000 8 8
Subsurface drainage 100 3,70,000 2,70,000 3,70,000 14 10
Fill material for field 100 50,000 50,000 50,000 4 2
Instalaltion of turf 0 1,00,000 0 0 6 0
Excavation-façade, roof supports, boxes 100 10,00,000 10,00,000 10,00,000 4 5
Pouring concrete footings 100 1,85,00,000 1,85,00,000 1,85,00,000 6 6
Pouring box, roof and fascade supports 100 5,95,00,000 5,35,00,000 5,95,00,000 10 11
Erecting pre-cast concrete façade and boxes 75 7,50,00,000 5,72,50,000 5,62,50,000 16 13
Finishing of boxes and new façade 0 3,00,00,000 0 0 5 0
Painting 10 50,00,000 5,00,000 5,00,000 4 0.5
Dressing rooms, offices and concession 10 1,20,00,000 12,00,000 12,00,000 8 1
Prefabricated the retractable roof 90 1,00,00,000 95,00,000 90,00,000 4 4
Erecting the roof 10 52,50,000 5,50,000 5,25,000 4 0.5
Scoreboard 75 1,00,00,000 72,50,000 75,00,000 5 3
New seats 10 3,20,00,000 32,00,000 32,00,000 3 0.5
Lights and other facilities 5 4,00,00,000 20,00,000 20,00,000 7 0.1
Wiring, HVAC 15 2,00,00,000 30,00,000 30,00,000 4 1
Exterior infrastructurre improvements 5 1,96,55,000 9,82,750 9,82,750 6 0.1
Punch list and demolization 0 50,00,000 0 0 3 0
TOTAL 350000000 16,63,27,750 17,01,52,750
SPI 0.48615071
CPI 1.02299676
EAC 342132070
Figure 4: CPI, SPI and EAC calculation
(Source: Created by Author)
From the above figure, it is analyzed that SPI is around 0.461 which reflects that the
project does not completes work as per the initial planning and therefore the project is behind
schedule. Whereas it is found that CPI of the project will be around 1.022 that means that the
project is underbudget and therefore it is assumed that the entire project will get finished with the
amount that is identified in the initial phase. Further fore, EAC of the project is around
PROJECT MANAGEMENT
is found that that in order to achieve an incentive of around $20million, the project manager
creates a plan as peer which the project will get completed by 22nd March. On 10th December
2004, the status report of the project was released. The values for planned value, earned value as
well as actual value is shown in the below figure.
Tasks %Complete Bid Price ($) Actual expense Earned value
Duration
(Weeks) Actual
Staging area, mobilization, demolition 100 65,00,000 75,00,000 65,00,000 8 8.5
Exacavation-field 100 75,000 75,000 75,000 8 8
Subsurface drainage 100 3,70,000 2,70,000 3,70,000 14 10
Fill material for field 100 50,000 50,000 50,000 4 2
Instalaltion of turf 0 1,00,000 0 0 6 0
Excavation-façade, roof supports, boxes 100 10,00,000 10,00,000 10,00,000 4 5
Pouring concrete footings 100 1,85,00,000 1,85,00,000 1,85,00,000 6 6
Pouring box, roof and fascade supports 100 5,95,00,000 5,35,00,000 5,95,00,000 10 11
Erecting pre-cast concrete façade and boxes 75 7,50,00,000 5,72,50,000 5,62,50,000 16 13
Finishing of boxes and new façade 0 3,00,00,000 0 0 5 0
Painting 10 50,00,000 5,00,000 5,00,000 4 0.5
Dressing rooms, offices and concession 10 1,20,00,000 12,00,000 12,00,000 8 1
Prefabricated the retractable roof 90 1,00,00,000 95,00,000 90,00,000 4 4
Erecting the roof 10 52,50,000 5,50,000 5,25,000 4 0.5
Scoreboard 75 1,00,00,000 72,50,000 75,00,000 5 3
New seats 10 3,20,00,000 32,00,000 32,00,000 3 0.5
Lights and other facilities 5 4,00,00,000 20,00,000 20,00,000 7 0.1
Wiring, HVAC 15 2,00,00,000 30,00,000 30,00,000 4 1
Exterior infrastructurre improvements 5 1,96,55,000 9,82,750 9,82,750 6 0.1
Punch list and demolization 0 50,00,000 0 0 3 0
TOTAL 350000000 16,63,27,750 17,01,52,750
SPI 0.48615071
CPI 1.02299676
EAC 342132070
Figure 4: CPI, SPI and EAC calculation
(Source: Created by Author)
From the above figure, it is analyzed that SPI is around 0.461 which reflects that the
project does not completes work as per the initial planning and therefore the project is behind
schedule. Whereas it is found that CPI of the project will be around 1.022 that means that the
project is underbudget and therefore it is assumed that the entire project will get finished with the
amount that is identified in the initial phase. Further fore, EAC of the project is around
8
PROJECT MANAGEMENT
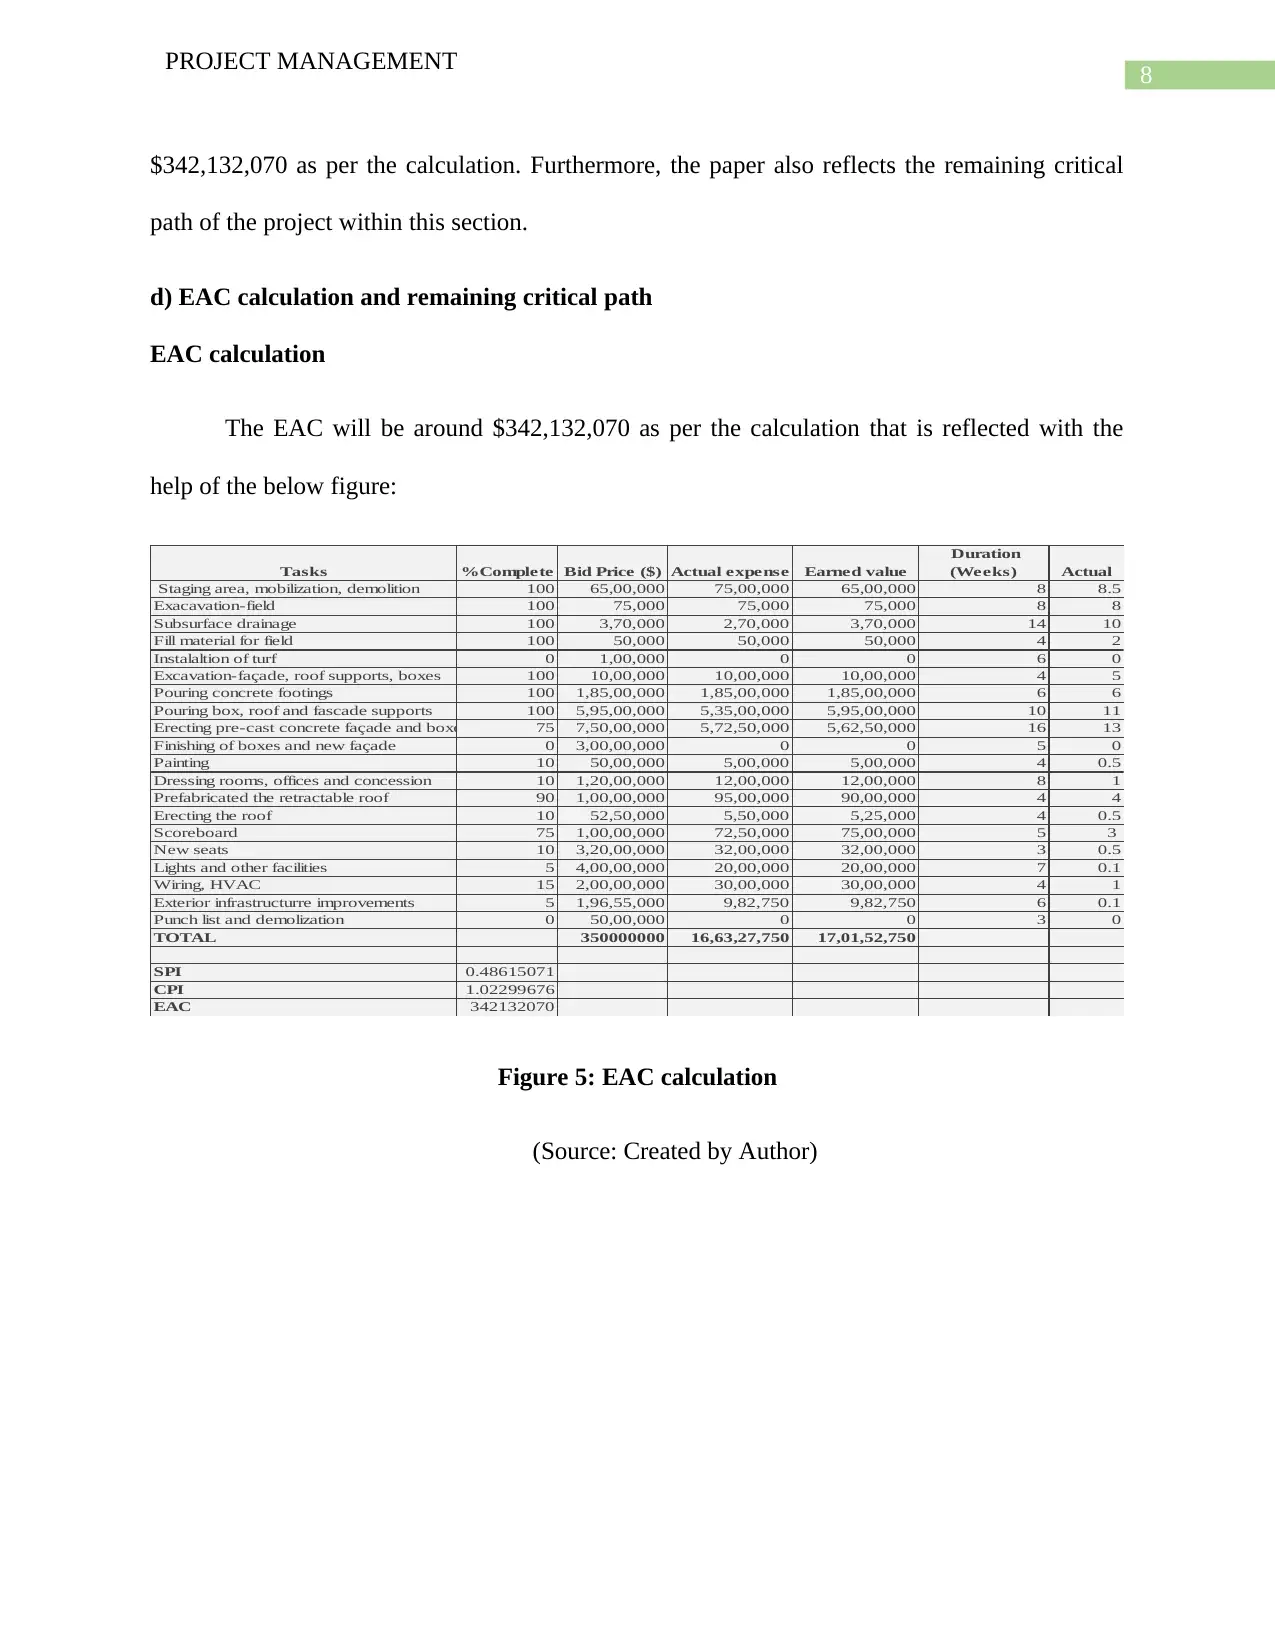
$342,132,070 as per the calculation. Furthermore, the paper also reflects the remaining critical
path of the project within this section.
d) EAC calculation and remaining critical path
EAC calculation
The EAC will be around $342,132,070 as per the calculation that is reflected with the
help of the below figure:
Tasks %Complete Bid Price ($) Actual expense Earned value
Duration
(Weeks) Actual
Staging area, mobilization, demolition 100 65,00,000 75,00,000 65,00,000 8 8.5
Exacavation-field 100 75,000 75,000 75,000 8 8
Subsurface drainage 100 3,70,000 2,70,000 3,70,000 14 10
Fill material for field 100 50,000 50,000 50,000 4 2
Instalaltion of turf 0 1,00,000 0 0 6 0
Excavation-façade, roof supports, boxes 100 10,00,000 10,00,000 10,00,000 4 5
Pouring concrete footings 100 1,85,00,000 1,85,00,000 1,85,00,000 6 6
Pouring box, roof and fascade supports 100 5,95,00,000 5,35,00,000 5,95,00,000 10 11
Erecting pre-cast concrete façade and boxes 75 7,50,00,000 5,72,50,000 5,62,50,000 16 13
Finishing of boxes and new façade 0 3,00,00,000 0 0 5 0
Painting 10 50,00,000 5,00,000 5,00,000 4 0.5
Dressing rooms, offices and concession 10 1,20,00,000 12,00,000 12,00,000 8 1
Prefabricated the retractable roof 90 1,00,00,000 95,00,000 90,00,000 4 4
Erecting the roof 10 52,50,000 5,50,000 5,25,000 4 0.5
Scoreboard 75 1,00,00,000 72,50,000 75,00,000 5 3
New seats 10 3,20,00,000 32,00,000 32,00,000 3 0.5
Lights and other facilities 5 4,00,00,000 20,00,000 20,00,000 7 0.1
Wiring, HVAC 15 2,00,00,000 30,00,000 30,00,000 4 1
Exterior infrastructurre improvements 5 1,96,55,000 9,82,750 9,82,750 6 0.1
Punch list and demolization 0 50,00,000 0 0 3 0
TOTAL 350000000 16,63,27,750 17,01,52,750
SPI 0.48615071
CPI 1.02299676
EAC 342132070
Figure 5: EAC calculation
(Source: Created by Author)
PROJECT MANAGEMENT
$342,132,070 as per the calculation. Furthermore, the paper also reflects the remaining critical
path of the project within this section.
d) EAC calculation and remaining critical path
EAC calculation
The EAC will be around $342,132,070 as per the calculation that is reflected with the
help of the below figure:
Tasks %Complete Bid Price ($) Actual expense Earned value
Duration
(Weeks) Actual
Staging area, mobilization, demolition 100 65,00,000 75,00,000 65,00,000 8 8.5
Exacavation-field 100 75,000 75,000 75,000 8 8
Subsurface drainage 100 3,70,000 2,70,000 3,70,000 14 10
Fill material for field 100 50,000 50,000 50,000 4 2
Instalaltion of turf 0 1,00,000 0 0 6 0
Excavation-façade, roof supports, boxes 100 10,00,000 10,00,000 10,00,000 4 5
Pouring concrete footings 100 1,85,00,000 1,85,00,000 1,85,00,000 6 6
Pouring box, roof and fascade supports 100 5,95,00,000 5,35,00,000 5,95,00,000 10 11
Erecting pre-cast concrete façade and boxes 75 7,50,00,000 5,72,50,000 5,62,50,000 16 13
Finishing of boxes and new façade 0 3,00,00,000 0 0 5 0
Painting 10 50,00,000 5,00,000 5,00,000 4 0.5
Dressing rooms, offices and concession 10 1,20,00,000 12,00,000 12,00,000 8 1
Prefabricated the retractable roof 90 1,00,00,000 95,00,000 90,00,000 4 4
Erecting the roof 10 52,50,000 5,50,000 5,25,000 4 0.5
Scoreboard 75 1,00,00,000 72,50,000 75,00,000 5 3
New seats 10 3,20,00,000 32,00,000 32,00,000 3 0.5
Lights and other facilities 5 4,00,00,000 20,00,000 20,00,000 7 0.1
Wiring, HVAC 15 2,00,00,000 30,00,000 30,00,000 4 1
Exterior infrastructurre improvements 5 1,96,55,000 9,82,750 9,82,750 6 0.1
Punch list and demolization 0 50,00,000 0 0 3 0
TOTAL 350000000 16,63,27,750 17,01,52,750
SPI 0.48615071
CPI 1.02299676
EAC 342132070
Figure 5: EAC calculation
(Source: Created by Author)
9
PROJECT MANAGEMENT
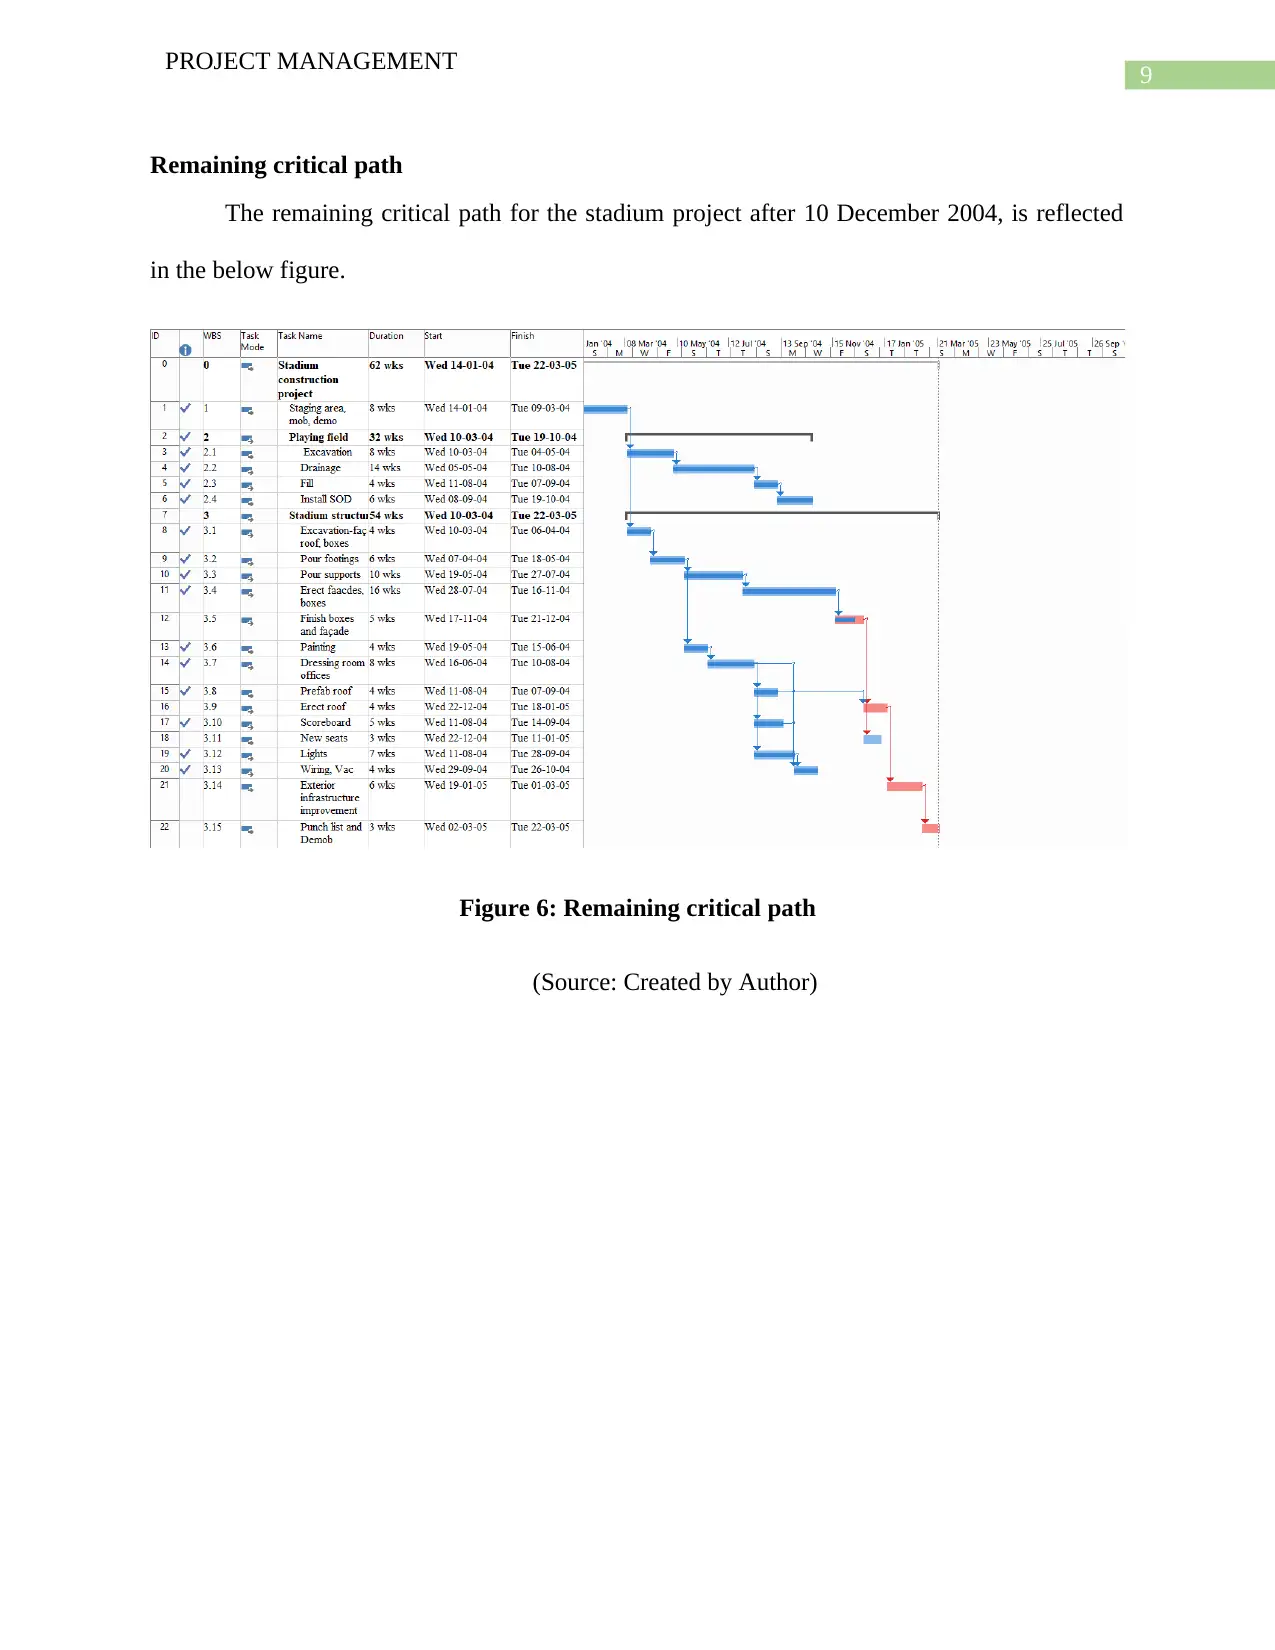
Remaining critical path
The remaining critical path for the stadium project after 10 December 2004, is reflected
in the below figure.
Figure 6: Remaining critical path
(Source: Created by Author)
PROJECT MANAGEMENT
Remaining critical path
The remaining critical path for the stadium project after 10 December 2004, is reflected
in the below figure.
Figure 6: Remaining critical path
(Source: Created by Author)
Secure Best Marks with AI Grader
Need help grading? Try our AI Grader for instant feedback on your assignments.
10
PROJECT MANAGEMENT
Bibliography
Anantatmula, V. S., & Rad, P. F. (2018). Role of organizational project management maturity
factors on project success. Engineering Management Journal, 30(3), 165-178.
Andersen, E. S. (2016). Do project managers have different perspectives on project
management?. International Journal of Project Management, 34(1), 58-65.
Bjorvatn, T., & Wald, A. (2018). Project complexity and team-level absorptive capacity as
drivers of project management performance. International Journal of Project
Management, 36(6), 876-888.
Keil, M., Culnan, M., Dinev, T., & Xu, H. (2019). Data governance, consumer privacy, and
project status reporting: Remembering H. Jeff smith. Information Systems
Frontiers, 21(6), 1207-1212.
Kerzner, H., 2017. Project management: a systems approach to planning, scheduling, and
controlling. John Wiley & Sons.
Kerzner, H. (2019). Using the project management maturity model: strategic planning for
project management. John Wiley & Sons.
Kerzner, H. (2017). Project management metrics, KPIs, and dashboards: a guide to measuring
and monitoring project performance. John Wiley & Sons.
Muriana, C., & Vizzini, G. (2017). Project risk management: A deterministic quantitative
technique for assessment and mitigation. International Journal of Project
Management, 35(3), 320-340.
1 out of 11
Related Documents

Your All-in-One AI-Powered Toolkit for Academic Success.
+13062052269
info@desklib.com
Available 24*7 on WhatsApp / Email
![[object Object]](/_next/static/media/star-bottom.7253800d.svg)
Unlock your academic potential
© 2024 | Zucol Services PVT LTD | All rights reserved.