CEIC4951/CEIC9951 Research Plan: Gantt Chart and Project Management

Verified

Added on  2022/08/22

|6
|1127
|29
Report
AI Summary
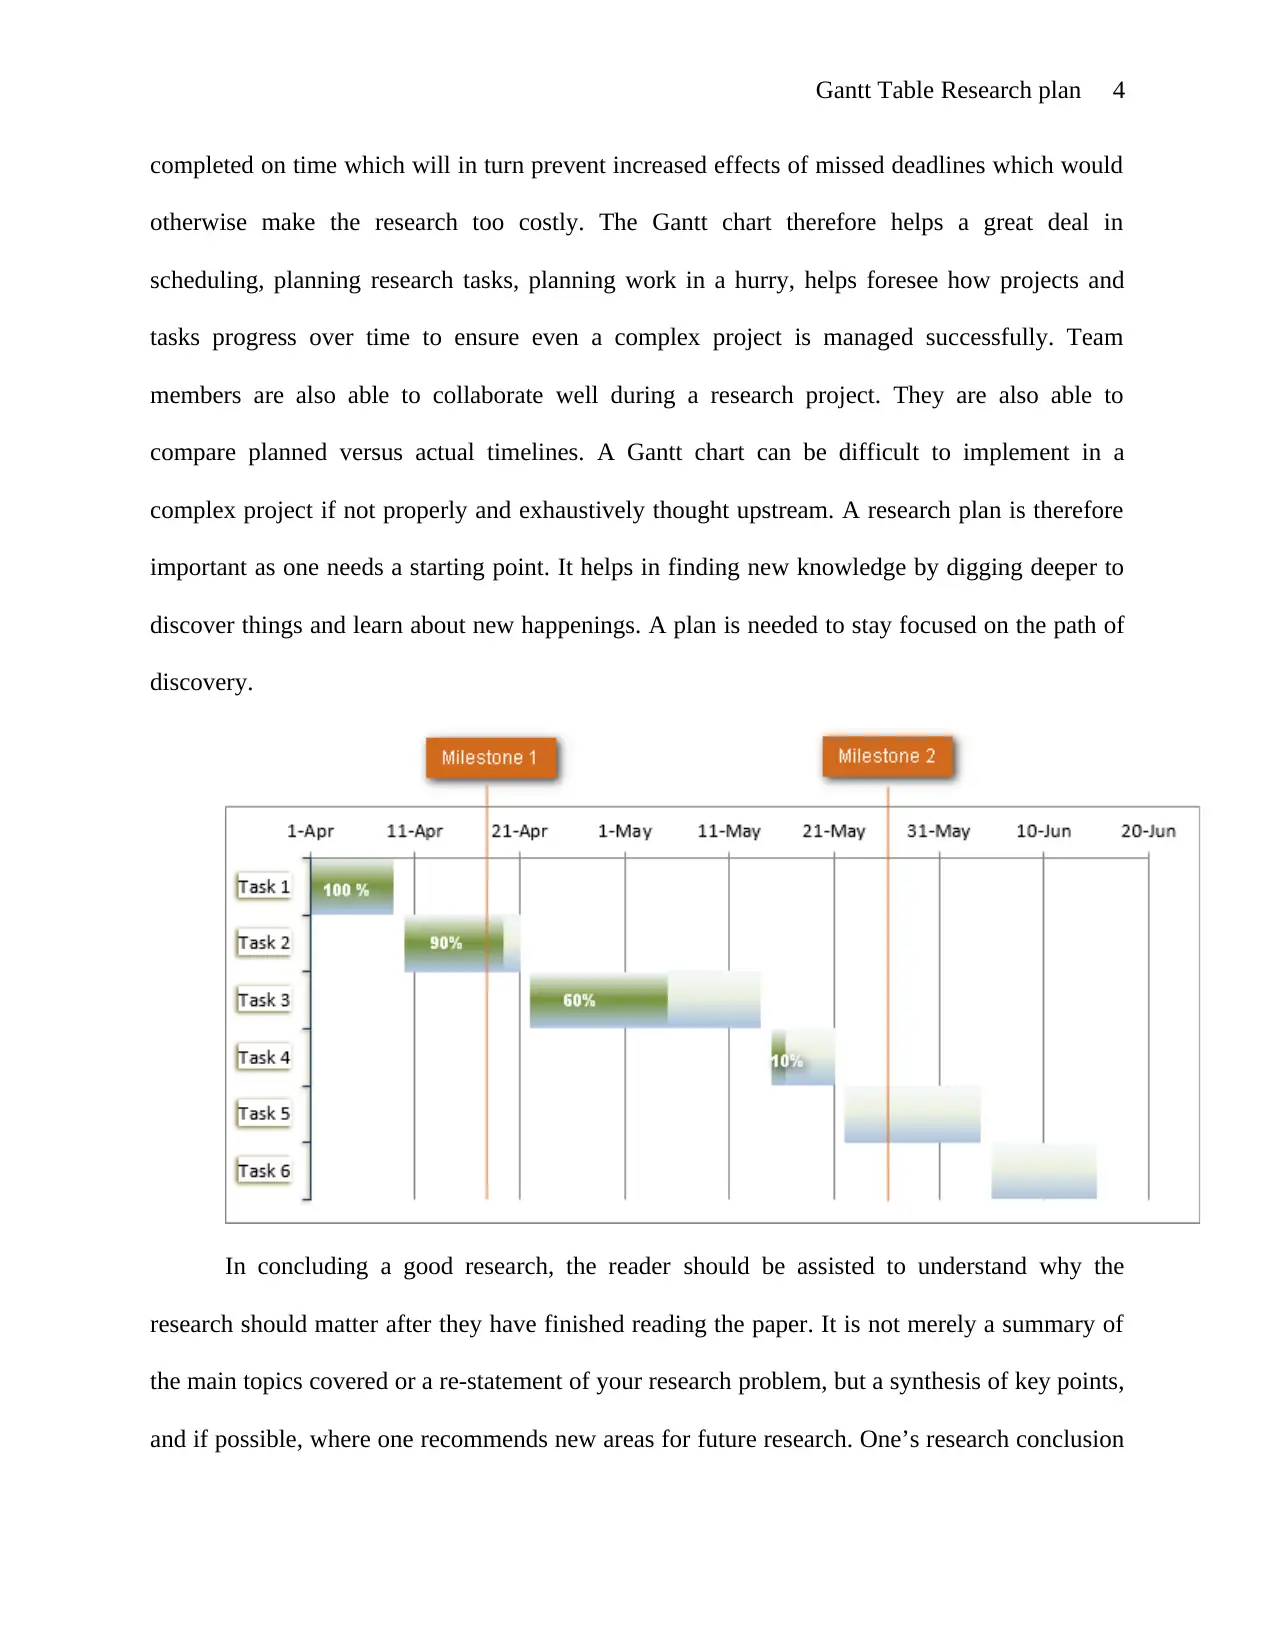
This report presents a comprehensive analysis of the Gantt chart research plan, explaining its significance and practical implementation. It begins by defining a research plan as a concise document that outlines initial research ideas in a logical manner. The report emphasizes the importance of a research plan in addressing key questions such as the research's objectives, significance, and methodology. The central focus is on the Gantt chart, a bar chart used to illustrate a project schedule. The report outlines the advantages of using Gantt charts, including their organizational capabilities, time-setting features, and visual clarity. It also addresses potential disadvantages, such as complexity and the need for updates. The report provides a step-by-step guide to drawing a Gantt chart, from template selection to branding. The report highlights the Gantt chart's role in research planning, scheduling, and time management. It also discusses how Gantt charts facilitate stakeholder alignment, activity adherence, and deadline management, ultimately enhancing project efficiency and success. The conclusion underscores the importance of a well-structured research plan and the value of Gantt charts in managing complex projects effectively, and it emphasizes the importance of this planning in the research process.
Document Page
Gantt Table Research plan 1
The Gantt Table Research Plan
By (Name)
Name of the Course
Name of Institution
Location of Institution
tabler-icon-diamond-filled.svg

Paraphrase This Document

Need a fresh take? Get an instant paraphrase of this document with our AI Paraphraser
Document Page
Gantt Table Research plan 2
Gantt Table Research plan
A research plan is a brief document which portrays initial thoughts on a research project
in a logical manner, brief and comprehensive. It is a foundation document from which a research
proposal may be developed. It gives the principle investigator the opportunity to discuss a
proposed research. This is by stating its importance and how it is going to be conducted. A
research plan is written to address the following questions; what it intends to do, why the work is
important, what concerning the research has already been done in the past and how the work is
going to be done in terms of methodology going to be used.
A good research plan must have basic information on name and affiliations as well as
title of the thesis statement. One also needs to answer the question of why the research is
important. Defining clear research questions to be answered, the methods to be used to answer
the questions and possible hypothesis guiding the research. A clear picture of the expected
results need to be stated, tools, frameworks, theories and resources to be used must come out
clearly.
In order to achieve a successful research project one needs to organizational skills in their
work for purposes of an effective research. Writing and planning a research project can be very
tasking but one needs to be very careful in scheduling a dissertation paper. By using a Gantt
chart one can effectively carry out a research project successfully. Gantt table is a type of bar
chart used to illustrate a project schedule showing relationships between research activities and
recent research status. There are various types of research Gantts depending on the tasks
intended. Some are for project management, project proposal as well as business plans. Gantt
charts have an advantage of organizing ones thought, demonstrates that one knows what they are
doing, helps in setting realistic time frames, it is highly visible as it reminds people of objectives
Document Page
Gantt Table Research plan 3
and when certain things needs to be done. Some disadvantages however include; can become
extraordinarily complex, the size of the bars might not indicate the amount of work. There is also
need to constantly update it, difficulty in seeing one sheet of paper when printed. using a Gantt
chart is however a true method of managing a project as it has been tried and found to be very
effective.
A Gantt chart can be drawn using five steps. The first step is to select an appropriate
template by considering; the industry, task to be performed, timeline of the project as well as
complexity of the task. The second step is to lay out the timeline from left to right by creating
divisions by day, week or month. Tasks are then added from top to bottom then adjusting each
bar accordingly then finally, branding and adding logo into place.
The diagram below shows a research plan Gantt chart illustrating the task to be done during
research project as well as timeline for which each task needs to have been accomplished.
The Gantt chart is used in a research plan to lists work to be done on the vertical axis, and
time intervals on the horizontal axis. The width of the horizontal bars in the graph shows the
duration of each activity. Gantt charts show the start and finish dates of the terminal essentials
and summary essentials of a research project. The terminal essentials and summary essentials
consists of the work breakdown of the project. Gantt charts therefore, can be used to show
current plan using percentage shading and vertical line showing dates.
Gantt charts are important because they make research planning, scheduling and
executing easier as well as management of time wisely. Research plans always involve key
stakeholders, activities to be conducted and deadlines to be met. Gantt charts help to ensure all
these factors are adhered to by making managers and their teams understand who needs to do
what and when the task needs to be accomplished. By using a Gantt chart, deliverables are
Document Page
Gantt Table Research plan 4
completed on time which will in turn prevent increased effects of missed deadlines which would
otherwise make the research too costly. The Gantt chart therefore helps a great deal in
scheduling, planning research tasks, planning work in a hurry, helps foresee how projects and
tasks progress over time to ensure even a complex project is managed successfully. Team
members are also able to collaborate well during a research project. They are also able to
compare planned versus actual timelines. A Gantt chart can be difficult to implement in a
complex project if not properly and exhaustively thought upstream. A research plan is therefore
important as one needs a starting point. It helps in finding new knowledge by digging deeper to
discover things and learn about new happenings. A plan is needed to stay focused on the path of
discovery.
In concluding a good research, the reader should be assisted to understand why the
research should matter after they have finished reading the paper. It is not merely a summary of
the main topics covered or a re-statement of your research problem, but a synthesis of key points,
and if possible, where one recommends new areas for future research. One’s research conclusion
tabler-icon-diamond-filled.svg

Paraphrase This Document

Need a fresh take? Get an instant paraphrase of this document with our AI Paraphraser
Document Page
Gantt Table Research plan 5
should have one or two well developed paragraphs. Gantt charts show the start and finish dates
of the terminal essentials and summary essentials of a research project. The terminal essentials
and summary essentials consists of the work breakdown of the project. Gantt charts therefore,
can be used to show current plan using percentage shading and vertical line showing dates.
Work cited
CALDER, P. (1995). A collaborative Gantt chart editor system. [Pooraka, S. Aust.],
Advanced Computing Research Centre, School of Computer and Information Science.
HARVEY, G. (2009). SharePoint 2007 Collaboration For Dummies.
PORTER, A. L. (1991). Forecasting and management of technology. New York, Wiley.
MURPHY, I. E. (2005). No stress tech guide to Crystal Reports XI: for beginners.
Document Page
Gantt Table Research plan 6
chevron_up_icon
1 out of 6
circle_padding
hide_on_mobile
zoom_out_icon
[object Object]