Financial Ratio Analysis Report: Gatsby Grange Hotel Industry
VerifiedAdded on 2023/01/06
|12
|3238
|67
Report
AI Summary
This report provides a comprehensive analysis of financial management within the hotel industry, specifically using the case of Gatsby Grange, a small boutique hotel chain. The report begins with an introduction to financial management principles and their application in the hospitality sector, emphasizing the importance of budgeting, financial monitoring, and reporting. The core of the report involves a detailed ratio analysis for the years 2018 and 2019, including profitability, liquidity, and gearing ratios. Each ratio is calculated and interpreted, highlighting fluctuations and trends in the company's financial performance. The analysis includes gross profit ratio, net profit ratio, return on assets, return on capital employed, current ratio, quick ratio, debt to equity ratio, and debt ratio. Furthermore, the report discusses the understanding of ratio fluctuations, emphasizing the importance of interpreting financial statements and the use of ratios in identifying areas for improvement and strategic planning. Finally, the report outlines the benefits and limitations of ratio analysis in decision-making, providing insights into how financial ratios can be used to assess a company's strengths and weaknesses, identify market vulnerabilities, and compare performance with industry benchmarks, while also acknowledging the limitations related to market conditions, accounting practices and changing prices.

Financial Management for
the Hotel Industry
the Hotel Industry
Paraphrase This Document
Need a fresh take? Get an instant paraphrase of this document with our AI Paraphraser
Contents
INTRODUCTION...........................................................................................................................................3
TASK............................................................................................................................................................3
Calculation of ratio to analysis financial information..............................................................................3
(b) Understanding of ratio and their fluctuations.....................................................................................7
(c) Benefits and limitation of ration analysis for decision making...........................................................8
TASK 2........................................................................................................................................................10
Covered in PPT.....................................................................................................................................10
CONCLUSION.............................................................................................................................................10
REFERENCES..............................................................................................................................................11
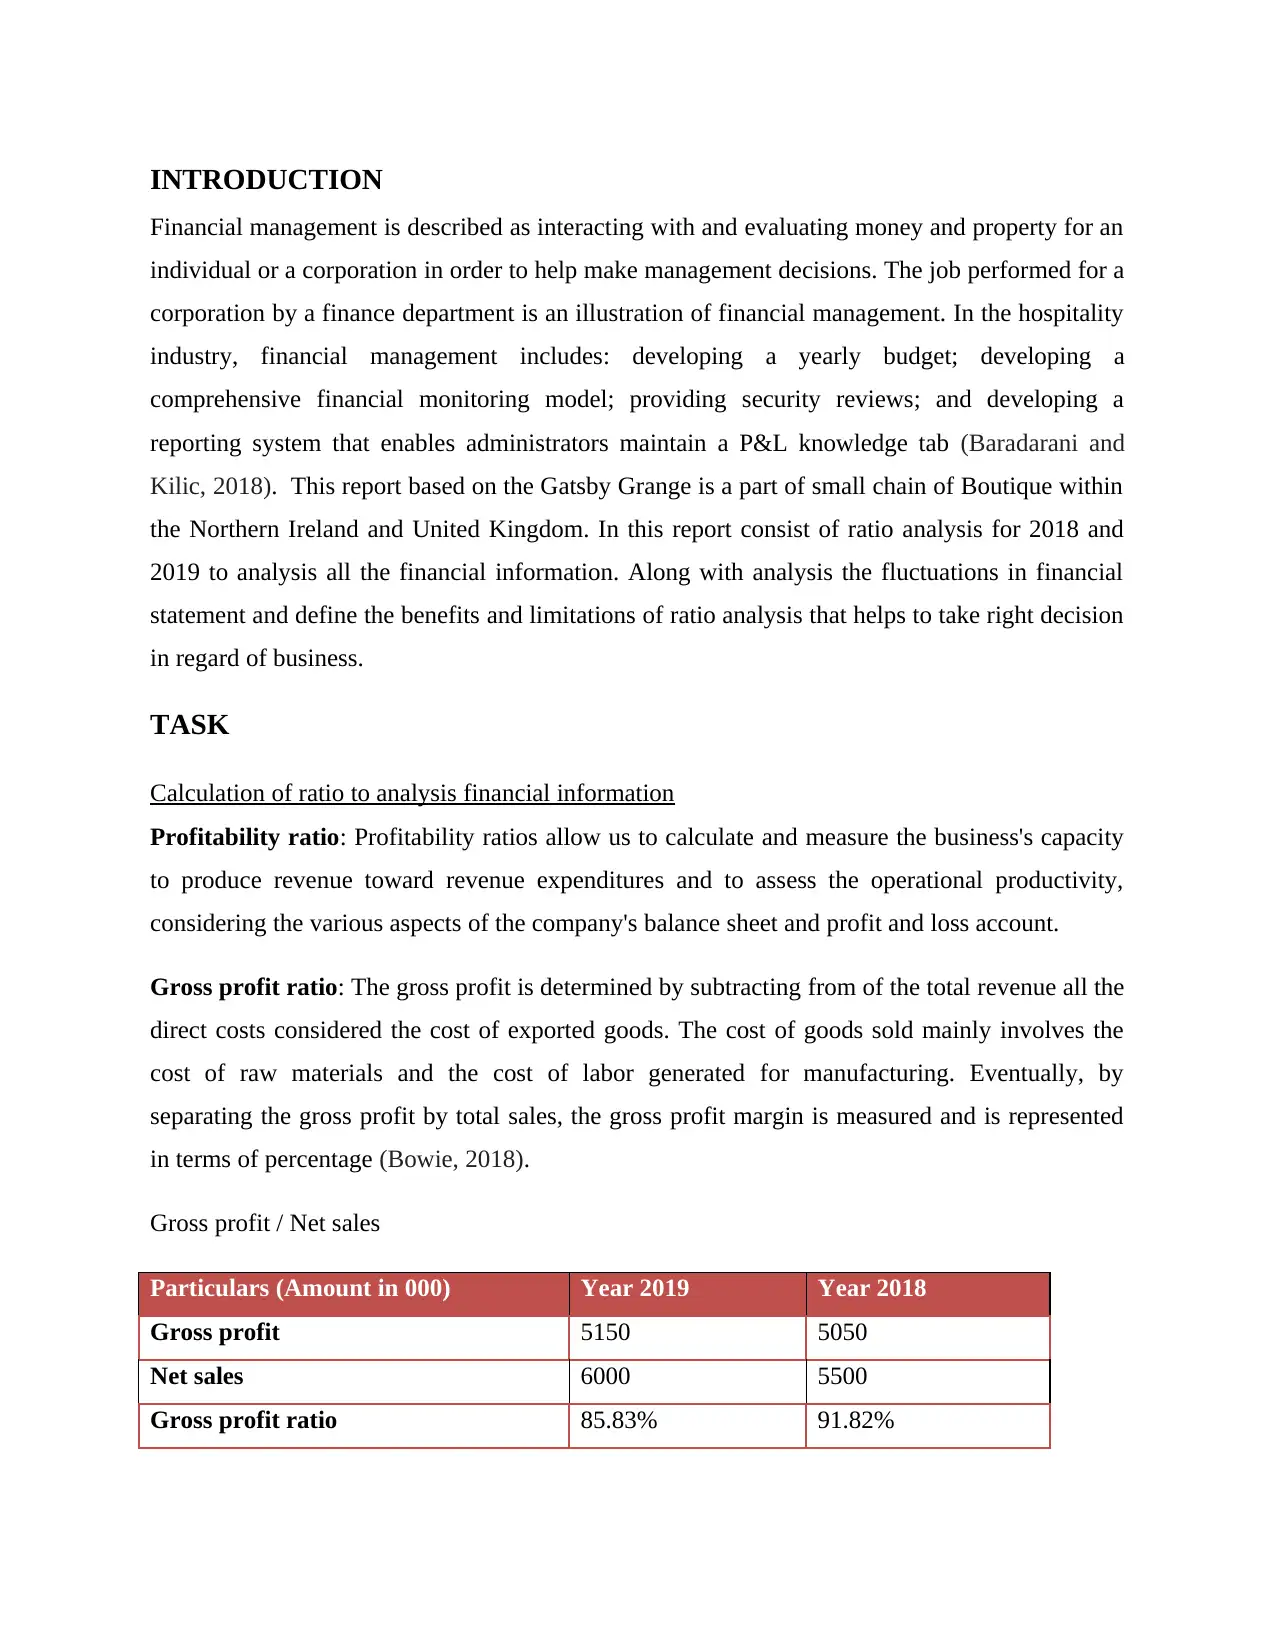
INTRODUCTION
Financial management is described as interacting with and evaluating money and property for an
individual or a corporation in order to help make management decisions. The job performed for a
corporation by a finance department is an illustration of financial management. In the hospitality
industry, financial management includes: developing a yearly budget; developing a
comprehensive financial monitoring model; providing security reviews; and developing a
reporting system that enables administrators maintain a P&L knowledge tab (Baradarani and
Kilic, 2018). This report based on the Gatsby Grange is a part of small chain of Boutique within
the Northern Ireland and United Kingdom. In this report consist of ratio analysis for 2018 and
2019 to analysis all the financial information. Along with analysis the fluctuations in financial
statement and define the benefits and limitations of ratio analysis that helps to take right decision
in regard of business.
TASK
Calculation of ratio to analysis financial information
Profitability ratio: Profitability ratios allow us to calculate and measure the business's capacity
to produce revenue toward revenue expenditures and to assess the operational productivity,
considering the various aspects of the company's balance sheet and profit and loss account.
Gross profit ratio: The gross profit is determined by subtracting from of the total revenue all the
direct costs considered the cost of exported goods. The cost of goods sold mainly involves the
cost of raw materials and the cost of labor generated for manufacturing. Eventually, by
separating the gross profit by total sales, the gross profit margin is measured and is represented
in terms of percentage (Bowie, 2018).
Gross profit / Net sales
Particulars (Amount in 000) Year 2019 Year 2018
Gross profit 5150 5050
Net sales 6000 5500
Gross profit ratio 85.83% 91.82%
⊘ This is a preview!⊘
Do you want full access?
Subscribe today to unlock all pages.
Trusted by 1+ million students worldwide
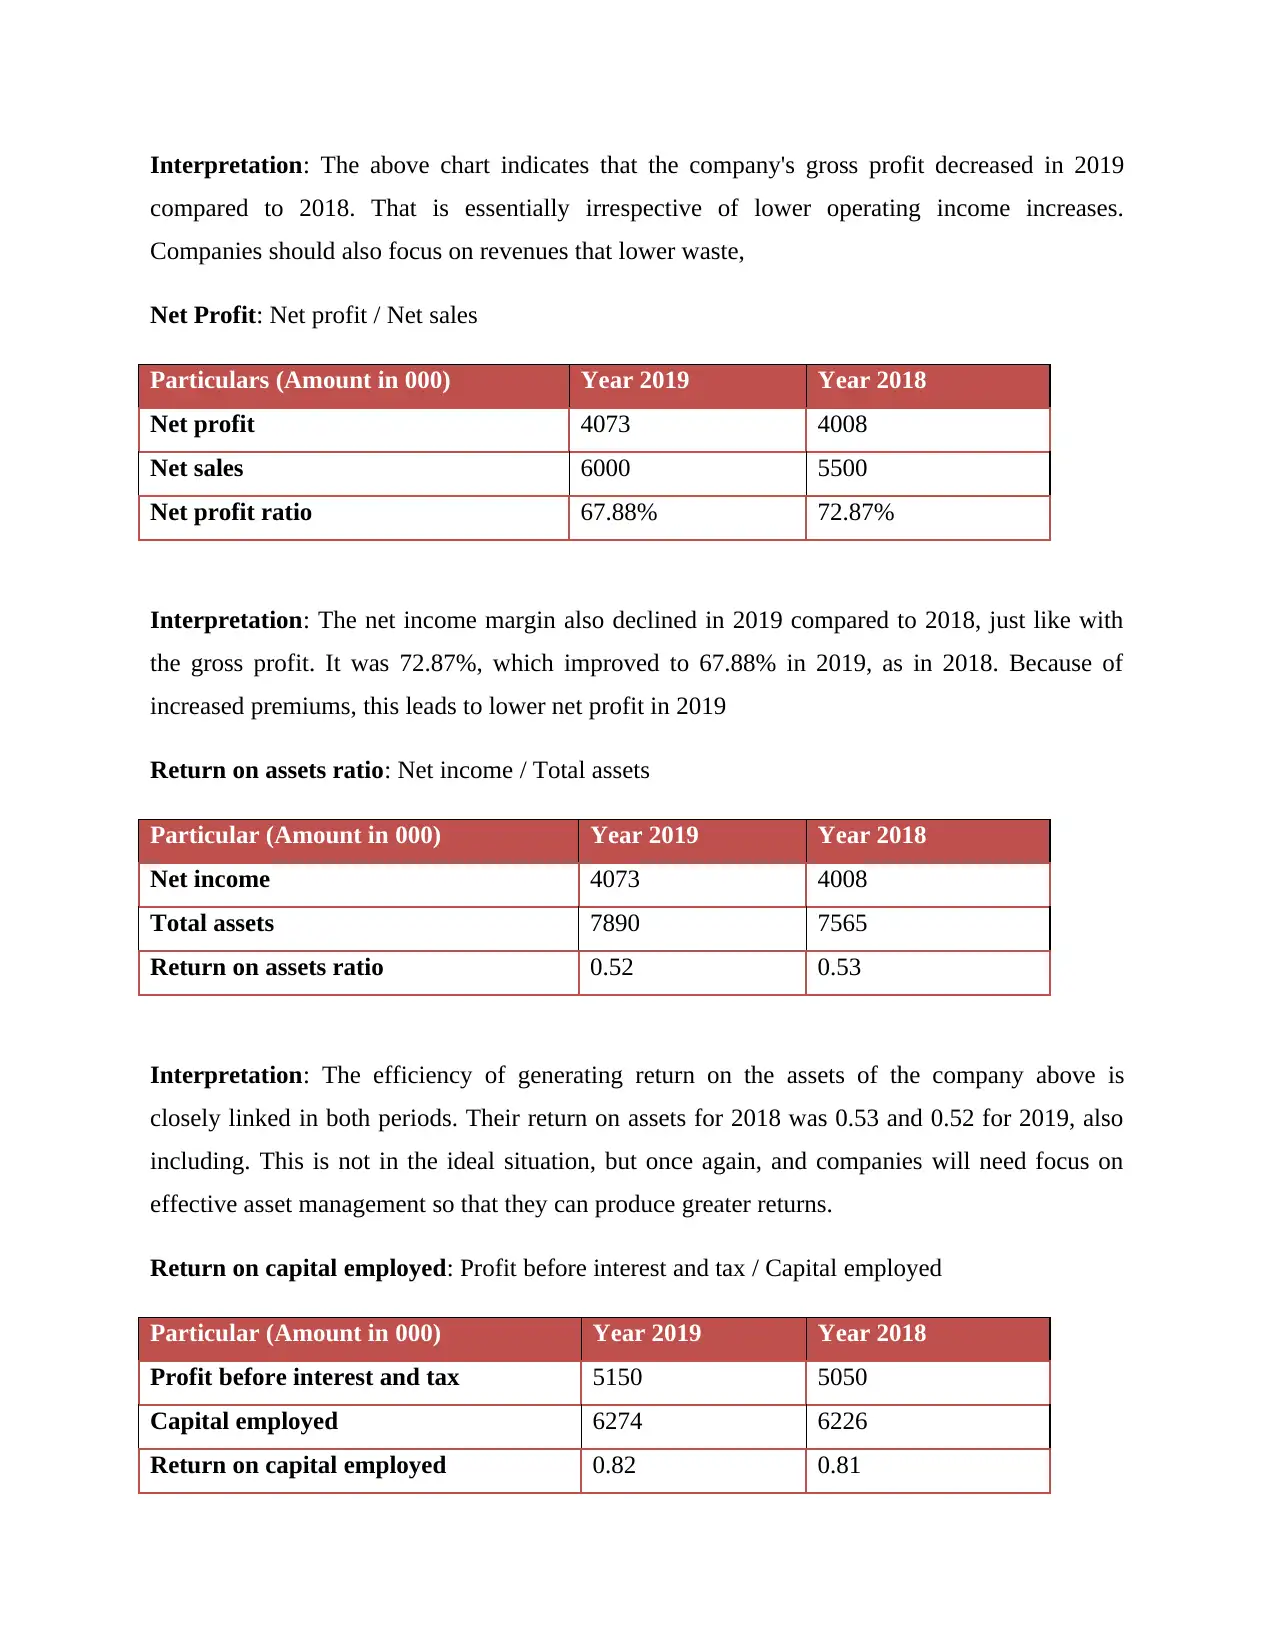
Interpretation: The above chart indicates that the company's gross profit decreased in 2019
compared to 2018. That is essentially irrespective of lower operating income increases.
Companies should also focus on revenues that lower waste,
Net Profit: Net profit / Net sales
Particulars (Amount in 000) Year 2019 Year 2018
Net profit 4073 4008
Net sales 6000 5500
Net profit ratio 67.88% 72.87%
Interpretation: The net income margin also declined in 2019 compared to 2018, just like with
the gross profit. It was 72.87%, which improved to 67.88% in 2019, as in 2018. Because of
increased premiums, this leads to lower net profit in 2019
Return on assets ratio: Net income / Total assets
Particular (Amount in 000) Year 2019 Year 2018
Net income 4073 4008
Total assets 7890 7565
Return on assets ratio 0.52 0.53
Interpretation: The efficiency of generating return on the assets of the company above is
closely linked in both periods. Their return on assets for 2018 was 0.53 and 0.52 for 2019, also
including. This is not in the ideal situation, but once again, and companies will need focus on
effective asset management so that they can produce greater returns.
Return on capital employed: Profit before interest and tax / Capital employed
Particular (Amount in 000) Year 2019 Year 2018
Profit before interest and tax 5150 5050
Capital employed 6274 6226
Return on capital employed 0.82 0.81
Paraphrase This Document
Need a fresh take? Get an instant paraphrase of this document with our AI Paraphraser
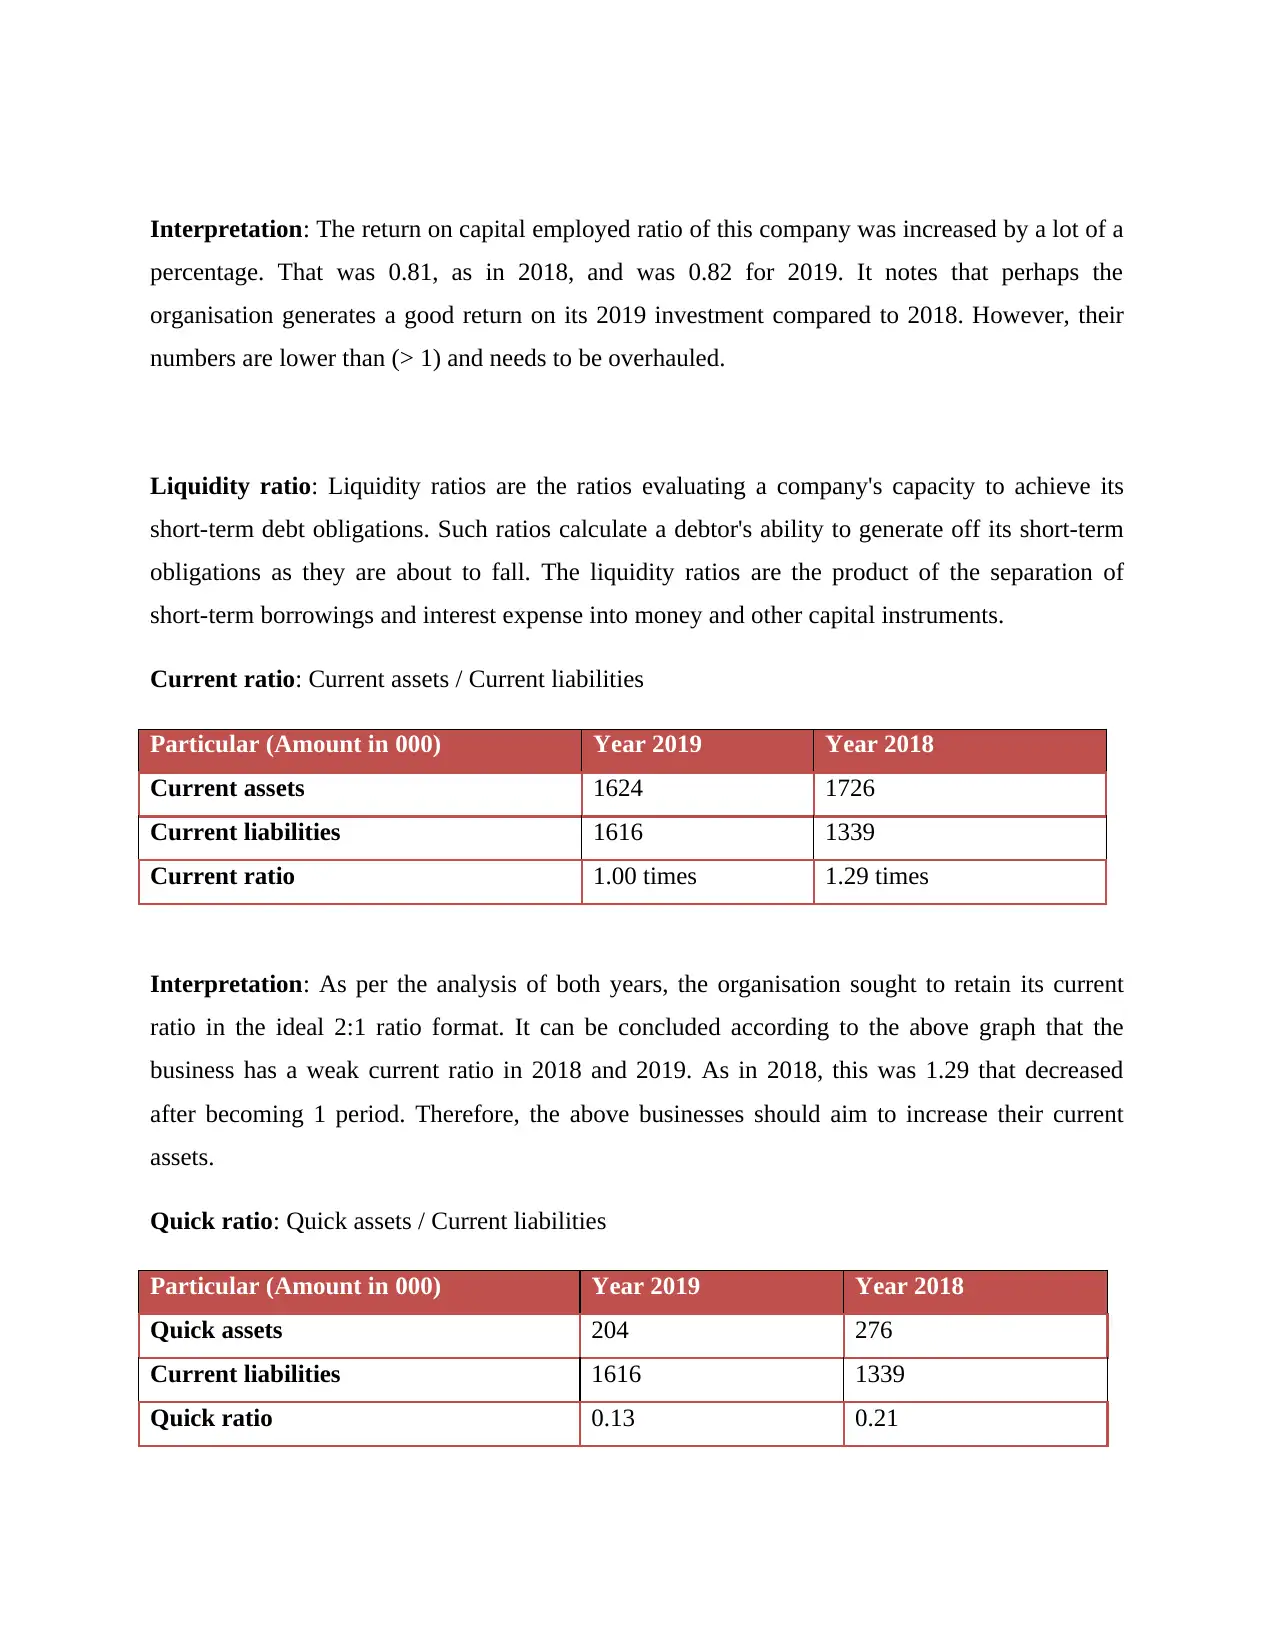
Interpretation: The return on capital employed ratio of this company was increased by a lot of a
percentage. That was 0.81, as in 2018, and was 0.82 for 2019. It notes that perhaps the
organisation generates a good return on its 2019 investment compared to 2018. However, their
numbers are lower than (> 1) and needs to be overhauled.
Liquidity ratio: Liquidity ratios are the ratios evaluating a company's capacity to achieve its
short-term debt obligations. Such ratios calculate a debtor's ability to generate off its short-term
obligations as they are about to fall. The liquidity ratios are the product of the separation of
short-term borrowings and interest expense into money and other capital instruments.
Current ratio: Current assets / Current liabilities
Particular (Amount in 000) Year 2019 Year 2018
Current assets 1624 1726
Current liabilities 1616 1339
Current ratio 1.00 times 1.29 times
Interpretation: As per the analysis of both years, the organisation sought to retain its current
ratio in the ideal 2:1 ratio format. It can be concluded according to the above graph that the
business has a weak current ratio in 2018 and 2019. As in 2018, this was 1.29 that decreased
after becoming 1 period. Therefore, the above businesses should aim to increase their current
assets.
Quick ratio: Quick assets / Current liabilities
Particular (Amount in 000) Year 2019 Year 2018
Quick assets 204 276
Current liabilities 1616 1339
Quick ratio 0.13 0.21
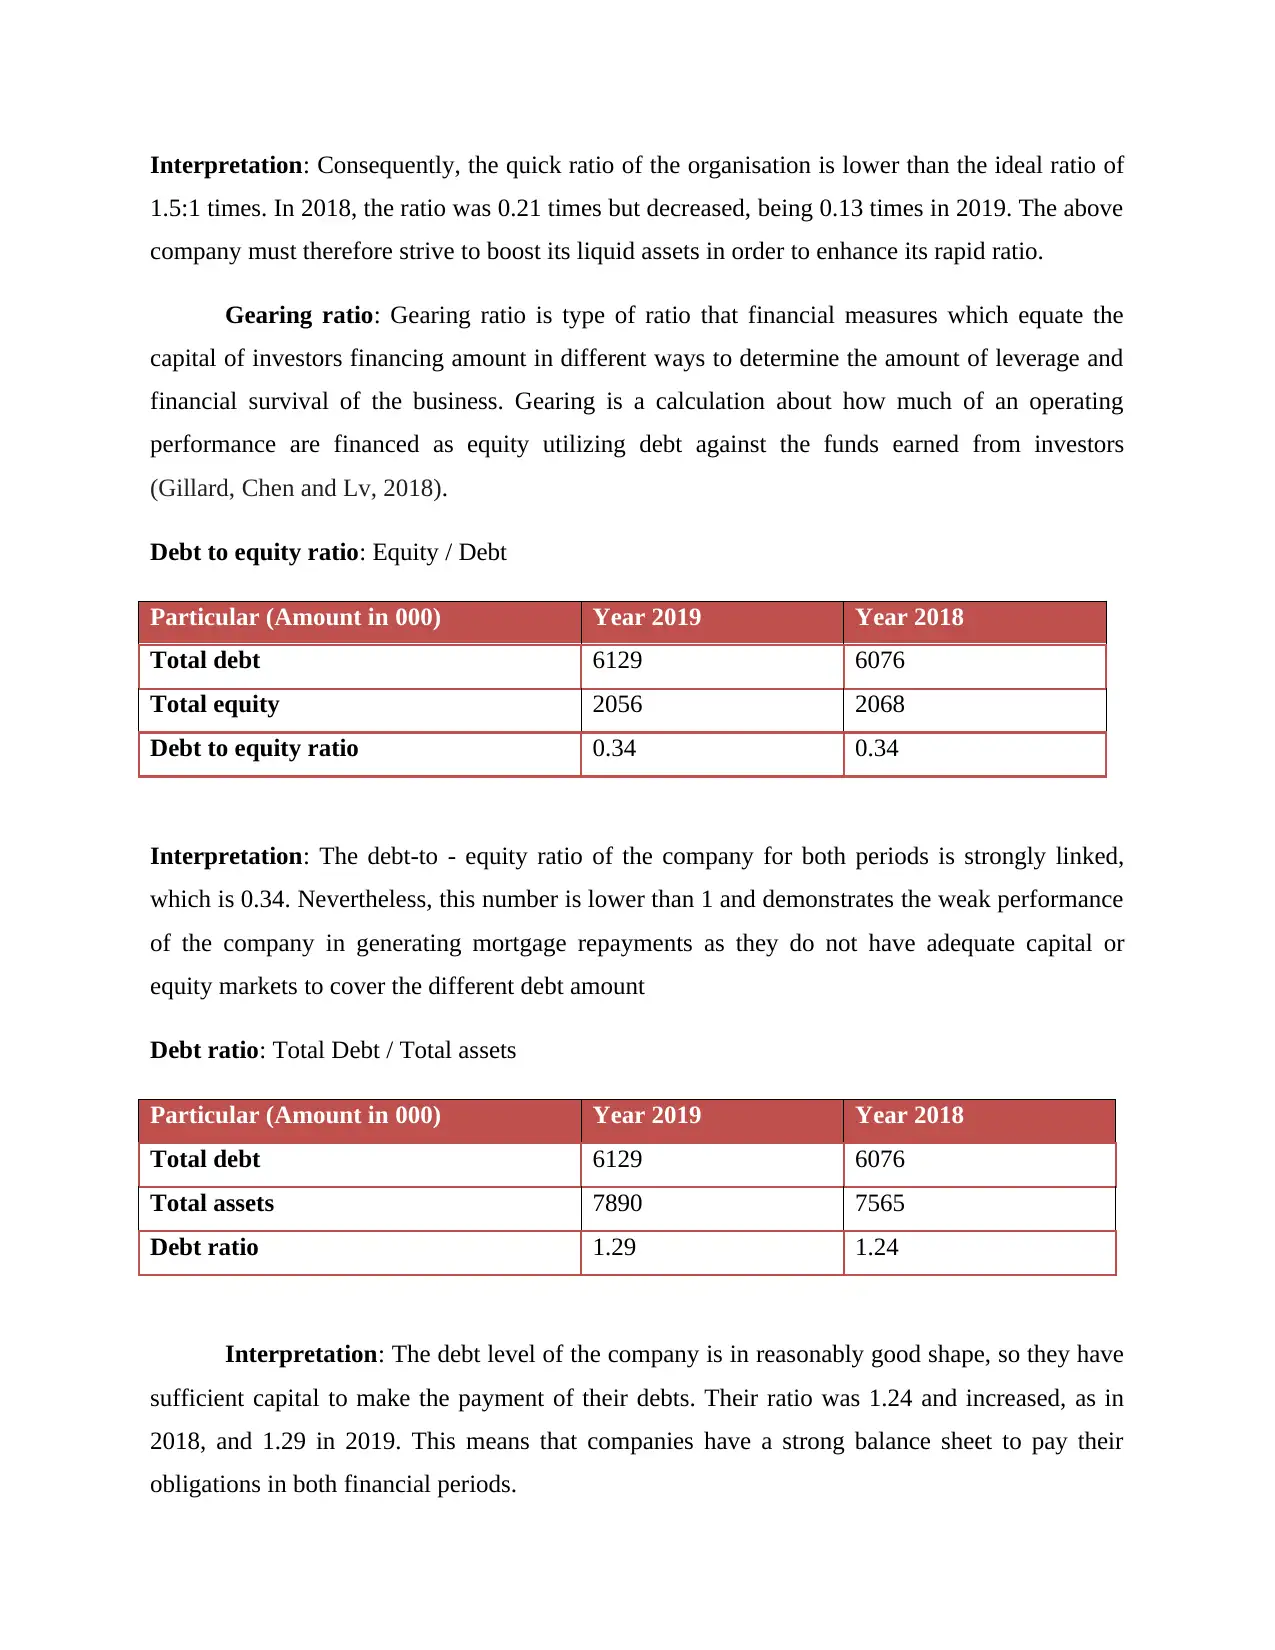
Interpretation: Consequently, the quick ratio of the organisation is lower than the ideal ratio of
1.5:1 times. In 2018, the ratio was 0.21 times but decreased, being 0.13 times in 2019. The above
company must therefore strive to boost its liquid assets in order to enhance its rapid ratio.
Gearing ratio: Gearing ratio is type of ratio that financial measures which equate the
capital of investors financing amount in different ways to determine the amount of leverage and
financial survival of the business. Gearing is a calculation about how much of an operating
performance are financed as equity utilizing debt against the funds earned from investors
(Gillard, Chen and Lv, 2018).
Debt to equity ratio: Equity / Debt
Particular (Amount in 000) Year 2019 Year 2018
Total debt 6129 6076
Total equity 2056 2068
Debt to equity ratio 0.34 0.34
Interpretation: The debt-to - equity ratio of the company for both periods is strongly linked,
which is 0.34. Nevertheless, this number is lower than 1 and demonstrates the weak performance
of the company in generating mortgage repayments as they do not have adequate capital or
equity markets to cover the different debt amount
Debt ratio: Total Debt / Total assets
Particular (Amount in 000) Year 2019 Year 2018
Total debt 6129 6076
Total assets 7890 7565
Debt ratio 1.29 1.24
Interpretation: The debt level of the company is in reasonably good shape, so they have
sufficient capital to make the payment of their debts. Their ratio was 1.24 and increased, as in
2018, and 1.29 in 2019. This means that companies have a strong balance sheet to pay their
obligations in both financial periods.
⊘ This is a preview!⊘
Do you want full access?
Subscribe today to unlock all pages.
Trusted by 1+ million students worldwide
(b) Understanding of ratio and their fluctuations
In financial ratio, various types of ratios would be included, but all plays an important
role in translating information into the company's financial position. According to the above
segment of the analysis, three types of ratios, namely efficiency, liquidity and gearing ratios,
were identified and measured. Thus, in reference from the above-described most are, the critical
limit of these ratios is mentioned:
1. In contrast, the measurement of the ratio also plays an significant part for businesses in
evaluating financial output, which is correctly measured in far less period. It's crucial that
understanding and interpreting their separate financial statements would be difficult for
companies. Ratio analysis provides a straightforward overview of every aspect, namely
efficiency, efficiency of gearing, etc. They have measured different types of ratios, as in
the previous section-mentioned Gatsby Grange Company, and each gives a detailed
explanation of all sorts of things. While the organisation can face different types of
difficulties in the absence of a ratio report, the use of this time can also be used to
determine financial performance during the research of ratio analysis (Koo and et.al,
2020) .
2. The estimation and variation of the ratios plays an important role in the segments of the
management consulting business. Such that, from over course of two years, a
organisation can identify improvements in financial performance and then properly
enforce acceptable techniques. Like in the Gatsby Grange Company above, utilizing
planned estimated budget, different types of variables are calculated. They will determine
certain places where their efficiency is poor and use these equations. In order to
overcome problem areas, they should also draw up creative strategies and approaches
until next year.
3. A key feature of the ratio analysis is that financial effects are calculated using this
approach across two different types over decades. With that, it's easier for managers to
find out the variance in outcomes. With respect to a number of things, they measured
different types of ratios, as in the business described above. As a consequence, it was
useful for them to consider patterns in the financial reports of 2018 and 2019.
Paraphrase This Document
Need a fresh take? Get an instant paraphrase of this document with our AI Paraphraser
(c) Benefits and limitation of ration analysis for decision making
Review of ratios is a way of evaluating two numbers with regard to one another. It is a
statistical or statistical representation of two numerical quantities, meaning that the ratio is
correctly correlated with one another. Likewise, in finance, ratios are a link between two figures
in different accounts; to have a greater comprehension in them, we should do an interpretative
review of details in a company's balance sheet.
Advantage: Ratio data is frequently used it as a significant weapon for the analysis of the
financial statements. To determine the strengths and weaknesses of a company and its financial
position and past performance, it maintains the quantitative connections between two statistics of
a financial statement. It allows different stakeholders to determine certain aspects of the success
of a business (Lado-Sestayo and et.al, 2016).
In addition to making that further clear and lucid, accounting ratios clarify, illustrate and
systematize the accounting information. They demonstrate the interrelationships, as
represented by accounting statements, between different divisions of the organisation.
The statistics placed alone are also unable to help them express any significance and
proportions help them connect to other numbers.
Ratio analysis plays a significant role in the rapid identification of market vulnerabilities.
This methodology of reviewing financial statements assesses every element of
organization and helps executives with knowledge that helps them to identify weak points
and take proactive action appropriately.
Review of ratios by computing different accounting ratios streamlines the entire details
found in the company's balance sheet. It makes it very easy for management and
shareholders to comprehend total economic details.
It makes it very convenient to equate companies about the whole sector but with another
company. It is possible to use ratios determined from financial statements to compare the
knowledge about the different companies and to find a successful or ineffective company.
As they are formulated utilizing information from published statements, estimated ratios
can provide wrong output. There are various limitations to the data found in financial
statements and they do not contain accurate or reasonable statistics that influence the
accuracy of the findings of ratios.
Accounting ratios tend us get an understanding of how a problem works. If analysis is
conducted on accounting ratios, the productivity of the business appears obvious. By
determining liquidity, solvency, profitability, etc., they assess economic health. It enables
the customer to decide cash obligations and the capacities of different business segments
(Nicoli and Papadopoulou, 2017).
When accounting ratios are evaluated for an amount of decades, then a pattern is formed.
In drawing up specific aspirations and predictions, these important places. Expenditures
as a proportion of revenue, for example, can accurately be estimated on the analysis of
previous years' revenue and expenses.
Limitations:
In various markets, various businesses operate, each with different environmental factors,
such as legislation, financial market, etc. Such variables have become so important that it
may be deceptive to equate two businesses from multiple companies.
Financial accounting information is influenced by projections and assessments. Financial
accounts allow for various financial accounting that hinder consistency and, thus, in such
cases, ratio analysis is less valuable.
The credibility of correlations of ratios measured over multiple intervals periods can be
seriously affected by a change in its price, especially in the case of ratios which integrand
and standard deviation are represented in various types of rupees.
Finding an acceptable level is often a difficult task. The results taken from the ratios can
be no different than the criteria they are compared to.
It avoids the shifts in price levels adjusted for inflation. Most ratios are measured using
discretionary accruals, and the current price shifts between the times are ignored. The
right financial condition is not reflected in this (Polemis, Stengos and Tzeremes, 2020).
No associated with the proposed of ratios are available. So companies can use diverse
conditions for the proportions. This one instance is the Current Ratio, in which some
company takes all current liabilities into account, but the others neglect bank overdraft
charges from current liabilities when measuring the current ratio.
⊘ This is a preview!⊘
Do you want full access?
Subscribe today to unlock all pages.
Trusted by 1+ million students worldwide
For financial issues, ratios will not provide a definitive response. The difficulty of
decision still remains as to what importance the statistics should be provided. Therefore,
in choosing and determining the ratios, one must depend on one's own common sense.
TASK 2
Covered in PPT
CONCLUSION
As per the above report it has been concluded that financial management essential part of
any organisation and apply in every type of industry. In order to analysis the actual financial
condition of business and which type of changes is occurring in the business identify by the ratio
analysis.
Paraphrase This Document
Need a fresh take? Get an instant paraphrase of this document with our AI Paraphraser
REFERENCES
Books and journal
Baradarani, S. and Kilic, H., 2018. Service innovation in the hotel industry: culture, behavior,
performance. The Service Industries Journal. 38(13-14). pp.897-924.
Bowie, D., 2018. Innovation and 19th century hotel industry evolution. Tourism
Management. 64. pp.314-323.
Gillard, E., Chen, M. H. and Lv, W. Q., 2018. Procedural corruption in the North American hotel
industry. International Journal of Hospitality Management. 72. pp.154-167.
Ionescu, G.H., Firoiu, D., Pîrvu, R., Bădîrcea, R. and Drăgan, C., 2018. Implementation of
integrated management systems and corporate social responsibility initiatives—a
Romanian hospitality industry perspective. Sustainability. 10(10). p.3684.
Koo, B. and et.al, 2020. Relationships among emotional and material rewards, job satisfaction,
burnout, affective commitment, job performance, and turnover intention in the hotel
industry. Journal of Quality Assurance in Hospitality & Tourism. 21(4). pp.371-401.
Lado-Sestayo, R. and et.al, 2016. Impact of location on profitability in the Spanish hotel
sector. Tourism Management. 52. pp.405-415.
Nicoli, N. and Papadopoulou, E., 2017. TripAdvisor and reputation: a case study of the hotel
industry in Cyprus. EuroMed Journal of Business.
Polemis, M. L., Stengos, T. and Tzeremes, N. G., 2020. Advertising expenses and operational
performance: Evidence from the global hotel industry. Economics Letters, p.109220.
Qoura, O. and Khalifa, G. S., 2016. The Impact of Reputation Management on Hotel Image
among Internal Customers: The Case of Egyptian Hotels. International Journal of
Heritage, Tourism, and Hospitality. 7(2).
Radojevic, T., Stanisic, N. and Stanic, N., 2017. Inside the rating scores: a multilevel analysis of
the factors influencing customer satisfaction in the hotel industry. Cornell Hospitality
Quarterly. 58(2). pp.134-164.
Köseoglu, M.A., Putra, E.D., Yi, X., Okumus, F. and Zhao, X., 2019. Strategic Decision Tools and
Organizational Performance in the Hotel Industry. Journal of China Tourism Research, 15(1),
pp.15-32.
Attila, A.T., 2016. The impact of the hotel industry on the competitiveness of tourism
destinations in Hungary. Journal of Competitiveness, 8(4), pp.85-104.
Úbeda-García, M., Claver-Cortés, E., Marco-Lajara, B. and Zaragoza-Sáez, P., 2016. Toward
organizational ambidexterity in the hotel industry: The role of human resources. Cornell
Hospitality Quarterly, 57(4), pp.367-378.
Hodari, D., Turner, M.J. and Sturman, M.C., 2017. How hotel owner-operator goal congruence
and GM autonomy influence hotel performance. International journal of hospitality
management, 61, pp.119-128.
Lappas, T., Sabnis, G. and Valkanas, G., 2016. The impact of fake reviews on online visibility:
A vulnerability assessment of the hotel industry. Information Systems Research, 27(4),
pp.940-961.
Bora, P., 2017. Scope Of Stress Management In Hotel Industry. International Journal of
Management, IT and Engineering, 7(7), pp.475-480.
Sajjad, A., Jillani, A. and Raziq, M.M., 2018. Sustainability in the Pakistani hotel industry: an
empirical study. Corporate Governance: The International Journal of Business in
Society.
Josephi, S.H., Stierand, M.B. and Van Mourik, A., 2016. Hotel revenue management: Then, now
and tomorrow. Journal of revenue and pricing management, 15(3-4), pp.252-257.
Ivanov, S. and Stavrinoudis, T.A., 2018. Impacts of the refugee crisis on the hotel industry:
Evidence from four Greek islands. Tourism Management, 67, pp.214-223.
Nieves, J. and Diaz-Meneses, G., 2018. Knowledge sources and innovation in the hotel
industry. International Journal of Contemporary Hospitality Management.
⊘ This is a preview!⊘
Do you want full access?
Subscribe today to unlock all pages.
Trusted by 1+ million students worldwide
1 out of 12
Related Documents


Your All-in-One AI-Powered Toolkit for Academic Success.
+13062052269
info@desklib.com
Available 24*7 on WhatsApp / Email
![[object Object]](/_next/static/media/star-bottom.7253800d.svg)
Unlock your academic potential
Copyright © 2020–2025 A2Z Services. All Rights Reserved. Developed and managed by ZUCOL.