SIT718 Real World Analytics: GBM Modeling of ANZ Stock (ANZ.AX)
VerifiedAdded on 2023/05/28
|10
|2119
|442
Report
AI Summary
This report delves into the application of the Geometric Brownian Motion (GBM) model for analyzing the stock prices of the Australian and New Zealand Banking Group (ANZ.AX) over a three-month period from August to October 2018. The study assesses the suitability of GBM by testing key assumptions such as normality and independence of stock returns. The parameters μ (drift) and σ (volatility) are calculated from the sample means of log-returns, and the results are compared with financial news reports. The report also forecasts future stock prices using the GBM model and evaluates the accuracy of these predictions against actual market data, highlighting the model's limitations when assumptions are not fully met. The analysis provides insights into the potential of GBM for stock price simulation in the Australian Exchange market, while acknowledging the importance of longer timeframes and adherence to model assumptions for more reliable results. Desklib offers a platform for students to access similar solved assignments and past papers.

GBM Modelling for ANZ 1
GBM Modelling for ANZ
by [Name]
Course
Professor’s Name
Institution
Location of Institution
Date
GBM Modelling for ANZ
by [Name]
Course
Professor’s Name
Institution
Location of Institution
Date
Paraphrase This Document
Need a fresh take? Get an instant paraphrase of this document with our AI Paraphraser
GBM Modelling for ANZ 2
GBM Modelling for ANZ
Question 1
The quantity μt – in the percentage drift and σ t – is the percentage volatility. These
parameters are considered constant when solving the differential equation to obtain the
Geometric Brownian Motion which is the solution for the differential. The parameters in time
series analysis of stock returns represents the continuous compounded expected return on the
stock ( μt ) and stock volatility (σ t) (Yang and Aldous 2015).
The assumptions of Geometric Brownian Motion (GBM) model include stock return
data is assumed to follow a normal distribution with constant mean and variance. Second the
observation at time t is independent of the observations at time t-1 or t + 1 (Yang and Aldous
2015). Also, the data is assumed to be continuous which is not the case with stock data.
Question 2
The company chosen for this study is the Australian and New Zealand Banking Group
(ANZ.AX). Using the r-code presented in the appendix the closing share price for ANZ.AX
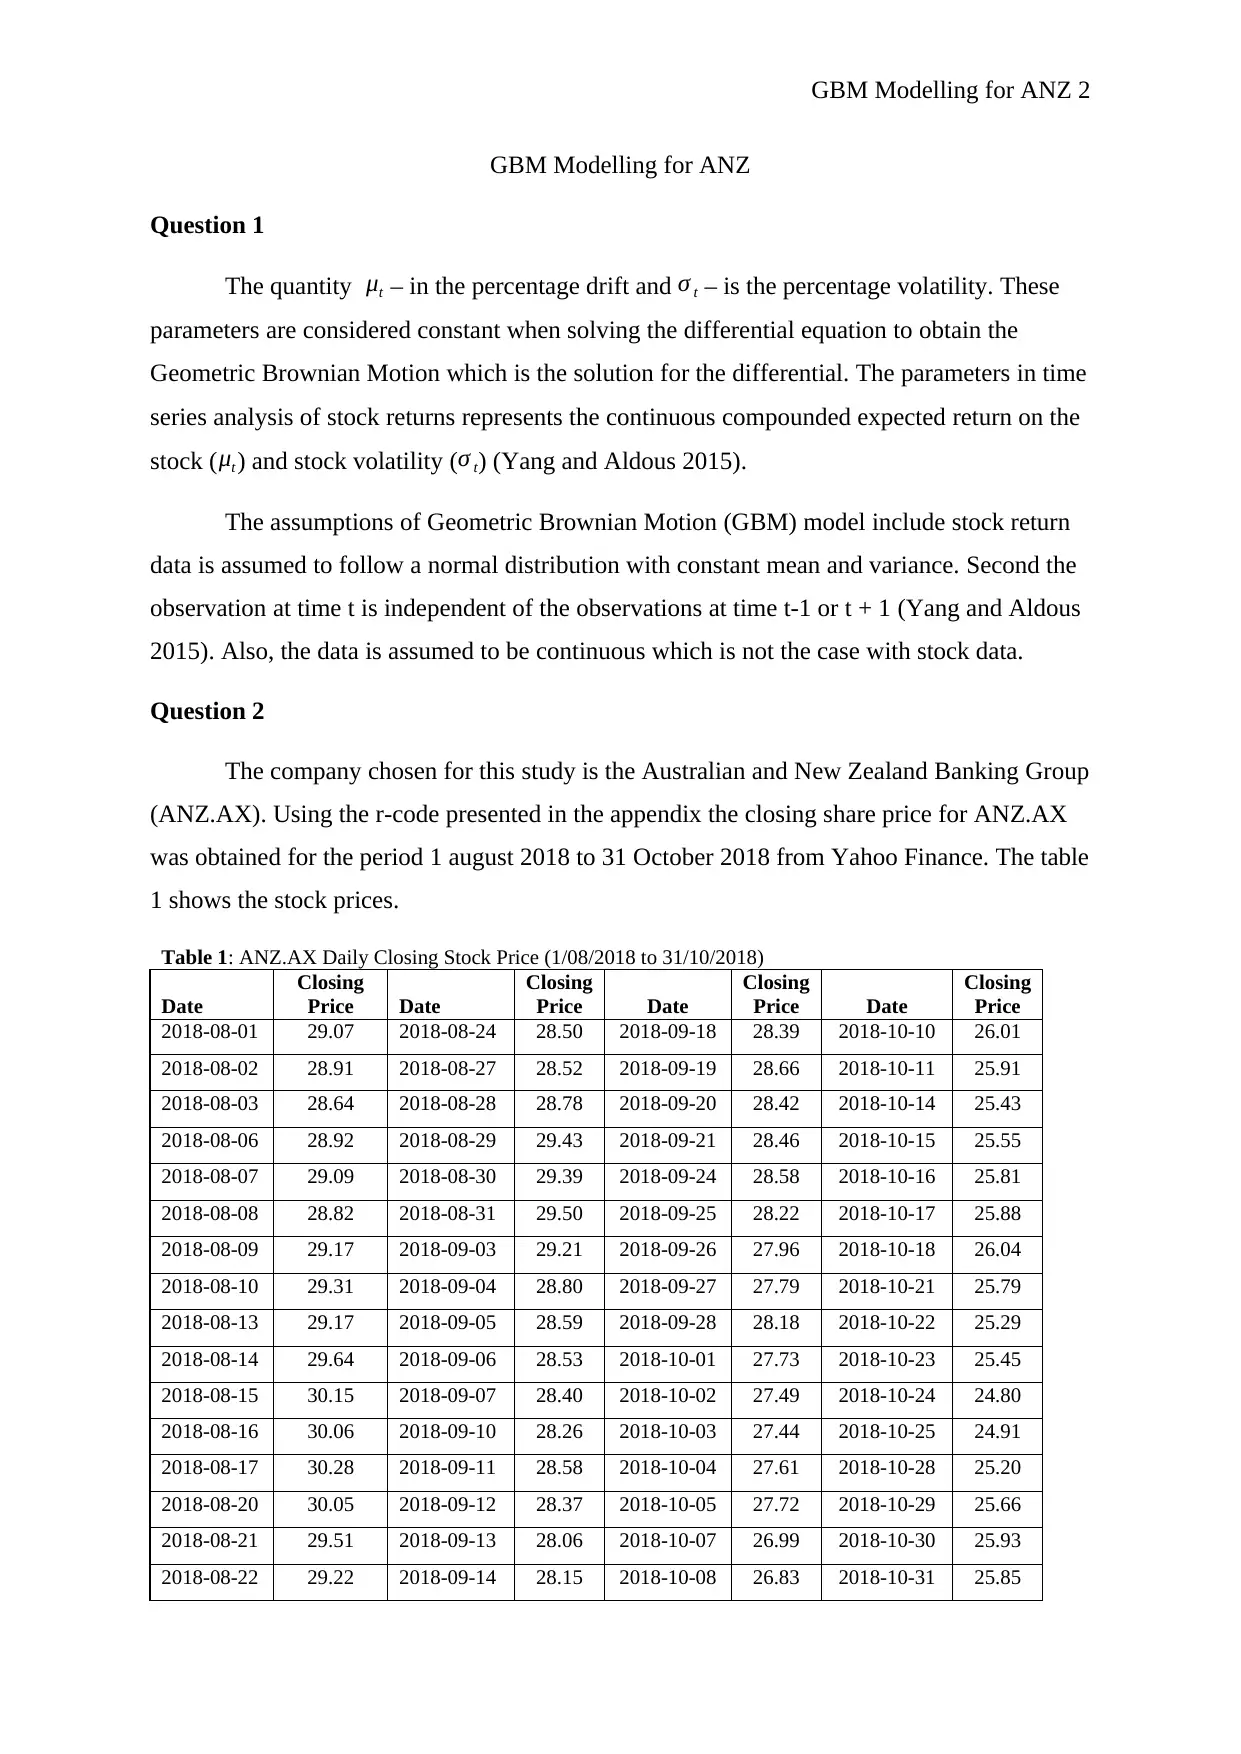
was obtained for the period 1 august 2018 to 31 October 2018 from Yahoo Finance. The table
1 shows the stock prices.
Table 1: ANZ.AX Daily Closing Stock Price (1/08/2018 to 31/10/2018)
Date
Closing
Price Date
Closing
Price Date
Closing
Price Date
Closing
Price
2018-08-01 29.07 2018-08-24 28.50 2018-09-18 28.39 2018-10-10 26.01
2018-08-02 28.91 2018-08-27 28.52 2018-09-19 28.66 2018-10-11 25.91
2018-08-03 28.64 2018-08-28 28.78 2018-09-20 28.42 2018-10-14 25.43
2018-08-06 28.92 2018-08-29 29.43 2018-09-21 28.46 2018-10-15 25.55
2018-08-07 29.09 2018-08-30 29.39 2018-09-24 28.58 2018-10-16 25.81
2018-08-08 28.82 2018-08-31 29.50 2018-09-25 28.22 2018-10-17 25.88
2018-08-09 29.17 2018-09-03 29.21 2018-09-26 27.96 2018-10-18 26.04
2018-08-10 29.31 2018-09-04 28.80 2018-09-27 27.79 2018-10-21 25.79
2018-08-13 29.17 2018-09-05 28.59 2018-09-28 28.18 2018-10-22 25.29
2018-08-14 29.64 2018-09-06 28.53 2018-10-01 27.73 2018-10-23 25.45
2018-08-15 30.15 2018-09-07 28.40 2018-10-02 27.49 2018-10-24 24.80
2018-08-16 30.06 2018-09-10 28.26 2018-10-03 27.44 2018-10-25 24.91
2018-08-17 30.28 2018-09-11 28.58 2018-10-04 27.61 2018-10-28 25.20
2018-08-20 30.05 2018-09-12 28.37 2018-10-05 27.72 2018-10-29 25.66
2018-08-21 29.51 2018-09-13 28.06 2018-10-07 26.99 2018-10-30 25.93
2018-08-22 29.22 2018-09-14 28.15 2018-10-08 26.83 2018-10-31 25.85
GBM Modelling for ANZ
Question 1
The quantity μt – in the percentage drift and σ t – is the percentage volatility. These
parameters are considered constant when solving the differential equation to obtain the
Geometric Brownian Motion which is the solution for the differential. The parameters in time
series analysis of stock returns represents the continuous compounded expected return on the
stock ( μt ) and stock volatility (σ t) (Yang and Aldous 2015).
The assumptions of Geometric Brownian Motion (GBM) model include stock return
data is assumed to follow a normal distribution with constant mean and variance. Second the
observation at time t is independent of the observations at time t-1 or t + 1 (Yang and Aldous
2015). Also, the data is assumed to be continuous which is not the case with stock data.
Question 2
The company chosen for this study is the Australian and New Zealand Banking Group
(ANZ.AX). Using the r-code presented in the appendix the closing share price for ANZ.AX
was obtained for the period 1 august 2018 to 31 October 2018 from Yahoo Finance. The table
1 shows the stock prices.
Table 1: ANZ.AX Daily Closing Stock Price (1/08/2018 to 31/10/2018)
Date
Closing
Price Date
Closing
Price Date
Closing
Price Date
Closing
Price
2018-08-01 29.07 2018-08-24 28.50 2018-09-18 28.39 2018-10-10 26.01
2018-08-02 28.91 2018-08-27 28.52 2018-09-19 28.66 2018-10-11 25.91
2018-08-03 28.64 2018-08-28 28.78 2018-09-20 28.42 2018-10-14 25.43
2018-08-06 28.92 2018-08-29 29.43 2018-09-21 28.46 2018-10-15 25.55
2018-08-07 29.09 2018-08-30 29.39 2018-09-24 28.58 2018-10-16 25.81
2018-08-08 28.82 2018-08-31 29.50 2018-09-25 28.22 2018-10-17 25.88
2018-08-09 29.17 2018-09-03 29.21 2018-09-26 27.96 2018-10-18 26.04
2018-08-10 29.31 2018-09-04 28.80 2018-09-27 27.79 2018-10-21 25.79
2018-08-13 29.17 2018-09-05 28.59 2018-09-28 28.18 2018-10-22 25.29
2018-08-14 29.64 2018-09-06 28.53 2018-10-01 27.73 2018-10-23 25.45
2018-08-15 30.15 2018-09-07 28.40 2018-10-02 27.49 2018-10-24 24.80
2018-08-16 30.06 2018-09-10 28.26 2018-10-03 27.44 2018-10-25 24.91
2018-08-17 30.28 2018-09-11 28.58 2018-10-04 27.61 2018-10-28 25.20
2018-08-20 30.05 2018-09-12 28.37 2018-10-05 27.72 2018-10-29 25.66
2018-08-21 29.51 2018-09-13 28.06 2018-10-07 26.99 2018-10-30 25.93
2018-08-22 29.22 2018-09-14 28.15 2018-10-08 26.83 2018-10-31 25.85
GBM Modelling for ANZ 3
2018-08-23 28.72 2018-09-17 28.40 2018-10-09 26.88
Source: Yahoo Finance (2018)
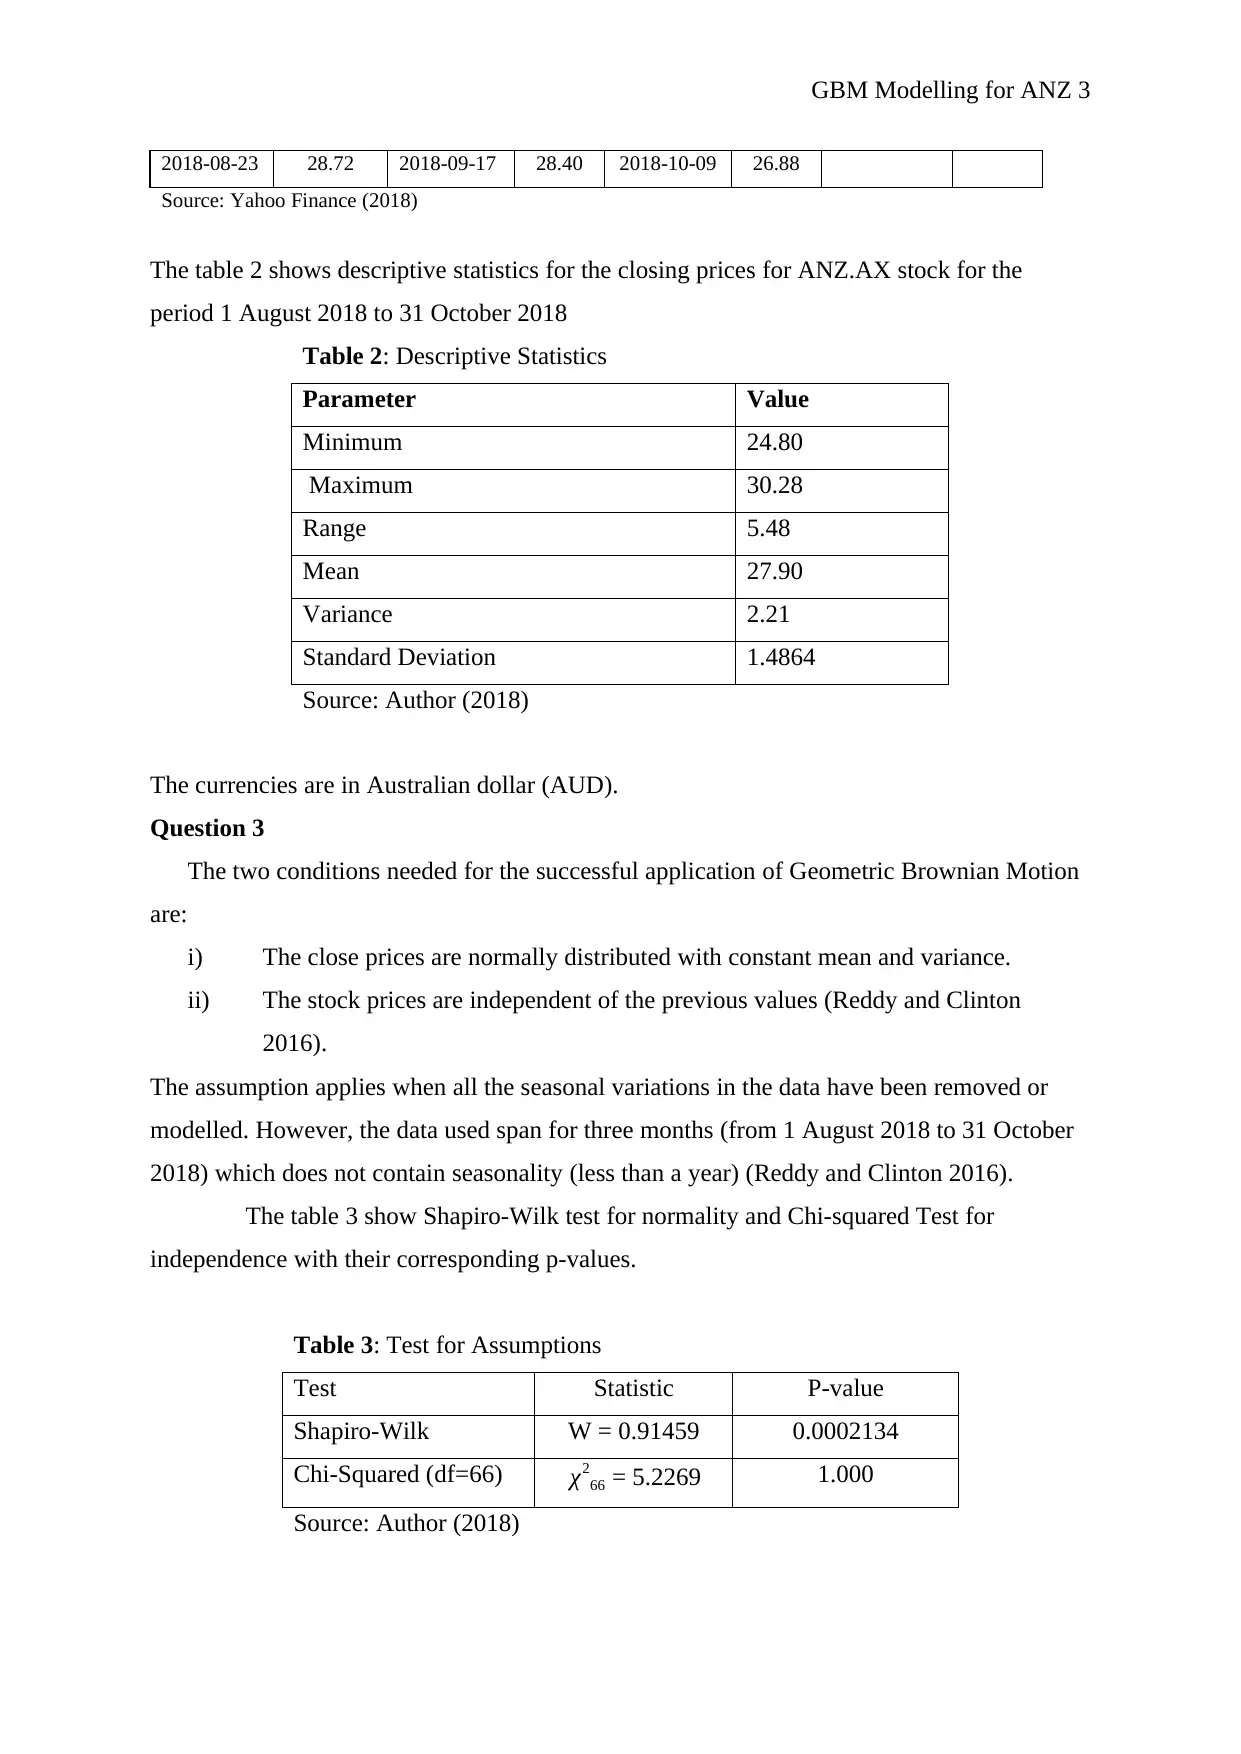
The table 2 shows descriptive statistics for the closing prices for ANZ.AX stock for the
period 1 August 2018 to 31 October 2018
Table 2: Descriptive Statistics
Parameter Value
Minimum 24.80
Maximum 30.28
Range 5.48
Mean 27.90
Variance 2.21
Standard Deviation 1.4864
Source: Author (2018)
The currencies are in Australian dollar (AUD).
Question 3
The two conditions needed for the successful application of Geometric Brownian Motion
are:
i) The close prices are normally distributed with constant mean and variance.
ii) The stock prices are independent of the previous values (Reddy and Clinton
2016).
The assumption applies when all the seasonal variations in the data have been removed or
modelled. However, the data used span for three months (from 1 August 2018 to 31 October
2018) which does not contain seasonality (less than a year) (Reddy and Clinton 2016).
The table 3 show Shapiro-Wilk test for normality and Chi-squared Test for
independence with their corresponding p-values.
Table 3: Test for Assumptions
Test Statistic P-value
Shapiro-Wilk W = 0.91459 0.0002134
Chi-Squared (df=66) χ2
66 = 5.2269 1.000
Source: Author (2018)
2018-08-23 28.72 2018-09-17 28.40 2018-10-09 26.88
Source: Yahoo Finance (2018)
The table 2 shows descriptive statistics for the closing prices for ANZ.AX stock for the
period 1 August 2018 to 31 October 2018
Table 2: Descriptive Statistics
Parameter Value
Minimum 24.80
Maximum 30.28
Range 5.48
Mean 27.90
Variance 2.21
Standard Deviation 1.4864
Source: Author (2018)
The currencies are in Australian dollar (AUD).
Question 3
The two conditions needed for the successful application of Geometric Brownian Motion
are:
i) The close prices are normally distributed with constant mean and variance.
ii) The stock prices are independent of the previous values (Reddy and Clinton
2016).
The assumption applies when all the seasonal variations in the data have been removed or
modelled. However, the data used span for three months (from 1 August 2018 to 31 October
2018) which does not contain seasonality (less than a year) (Reddy and Clinton 2016).
The table 3 show Shapiro-Wilk test for normality and Chi-squared Test for
independence with their corresponding p-values.
Table 3: Test for Assumptions
Test Statistic P-value
Shapiro-Wilk W = 0.91459 0.0002134
Chi-Squared (df=66) χ2
66 = 5.2269 1.000
Source: Author (2018)
⊘ This is a preview!⊘
Do you want full access?
Subscribe today to unlock all pages.
Trusted by 1+ million students worldwide
GBM Modelling for ANZ 4
The df- are the degrees of freedom for the chi-squared test.
Since the sample size is less than 2000 Shapiro-Wilk Test for normality is appropriate for
the data. The set of hypotheses under Shapiro-Wilk test is:
H0: The data was obtained from a normally distributed population,
Ha: The data was obtained from non-normally distributed population.
The P-value of 0.0002134 is less than both α=0.05∨0.01. Therefore, the null hypothesis
is rejected with conclusion that our data does not obey the assumption (i).
Also, For the second assumption the following hypotheses are tested based on Chi-
squared test:
H0: The stock prices are independent of the previous values
Ha: Some association does exist between the stock prices and previous values
The p-value = 1.000 is greater than α=0.05 indicating that the data obeys the assumption
of independence.
Question 4
With the assumptions in the previous section the data can be modelled mathematically by a
stochastic differential equation
S ( t )=μS d t+σS d W ( t ) , S ( 0 ) =S0
Whose solution gives the Geometric Brownian Motion represented as
S ( t )=S0 exp ( (μ−( 1
2 )σ2
)t +σW ( t)
)
The parameters μ∧σare calculated from the sample means of the log-returns of the stock data
used such that:
μ=sample mean ( X ) x 252
σ =sample standard deviation ( S ) x √252
Where, 252 represent the trading period in a year.
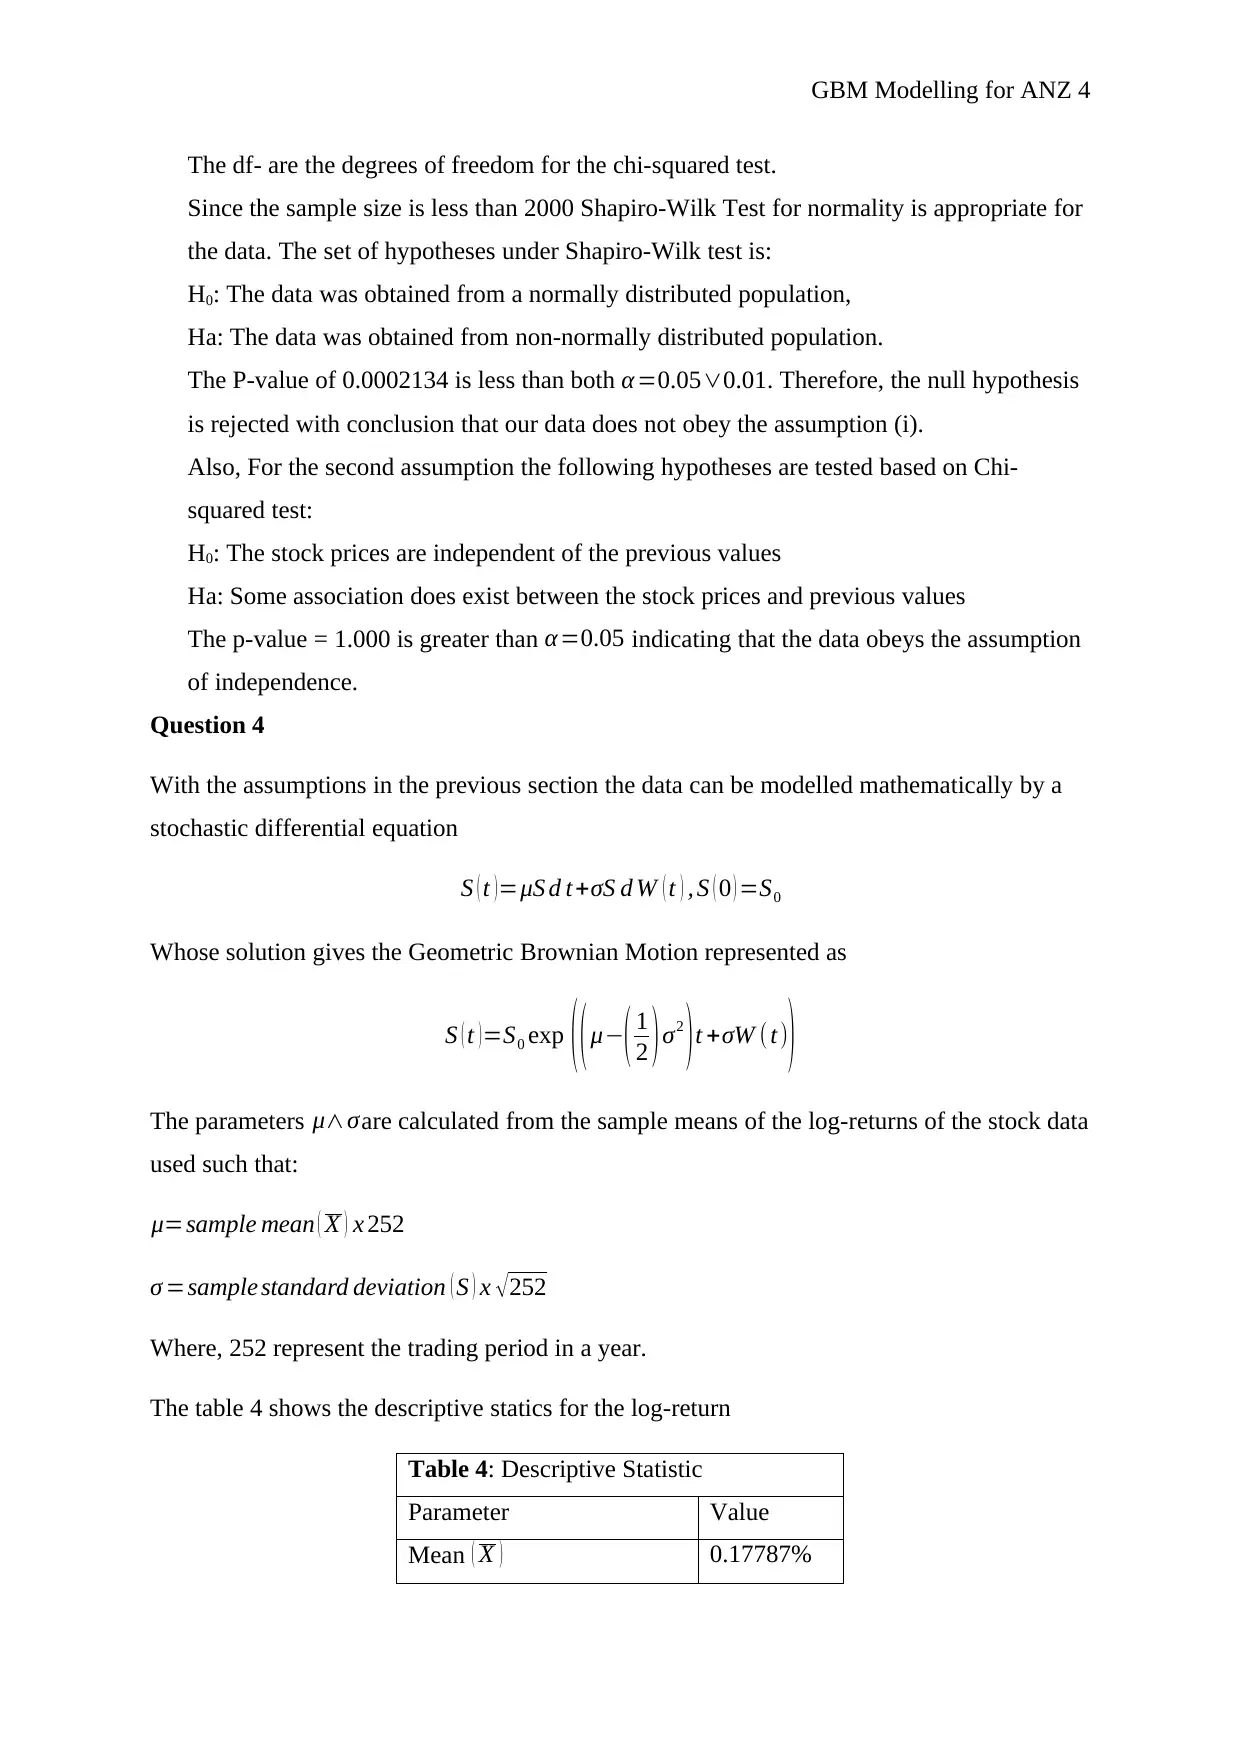
The table 4 shows the descriptive statics for the log-return
Table 4: Descriptive Statistic
Parameter Value
Mean ( X ) 0.17787%
The df- are the degrees of freedom for the chi-squared test.
Since the sample size is less than 2000 Shapiro-Wilk Test for normality is appropriate for
the data. The set of hypotheses under Shapiro-Wilk test is:
H0: The data was obtained from a normally distributed population,
Ha: The data was obtained from non-normally distributed population.
The P-value of 0.0002134 is less than both α=0.05∨0.01. Therefore, the null hypothesis
is rejected with conclusion that our data does not obey the assumption (i).
Also, For the second assumption the following hypotheses are tested based on Chi-
squared test:
H0: The stock prices are independent of the previous values
Ha: Some association does exist between the stock prices and previous values
The p-value = 1.000 is greater than α=0.05 indicating that the data obeys the assumption
of independence.
Question 4
With the assumptions in the previous section the data can be modelled mathematically by a
stochastic differential equation
S ( t )=μS d t+σS d W ( t ) , S ( 0 ) =S0
Whose solution gives the Geometric Brownian Motion represented as
S ( t )=S0 exp ( (μ−( 1
2 )σ2
)t +σW ( t)
)
The parameters μ∧σare calculated from the sample means of the log-returns of the stock data
used such that:
μ=sample mean ( X ) x 252
σ =sample standard deviation ( S ) x √252
Where, 252 represent the trading period in a year.
The table 4 shows the descriptive statics for the log-return
Table 4: Descriptive Statistic
Parameter Value
Mean ( X ) 0.17787%
Paraphrase This Document
Need a fresh take? Get an instant paraphrase of this document with our AI Paraphraser
GBM Modelling for ANZ 5
Standard deviation (S) 1.13403%
Sample size (N) 66
Source: Author (2018)
Therefore, μ=0.17787 % x 252=0.44823 % and σ =1.13403 % x √ 252=0.1800 %
The X values are the percentage of log return of the daily closing stock price of ANZ.AX
company.
Question 5
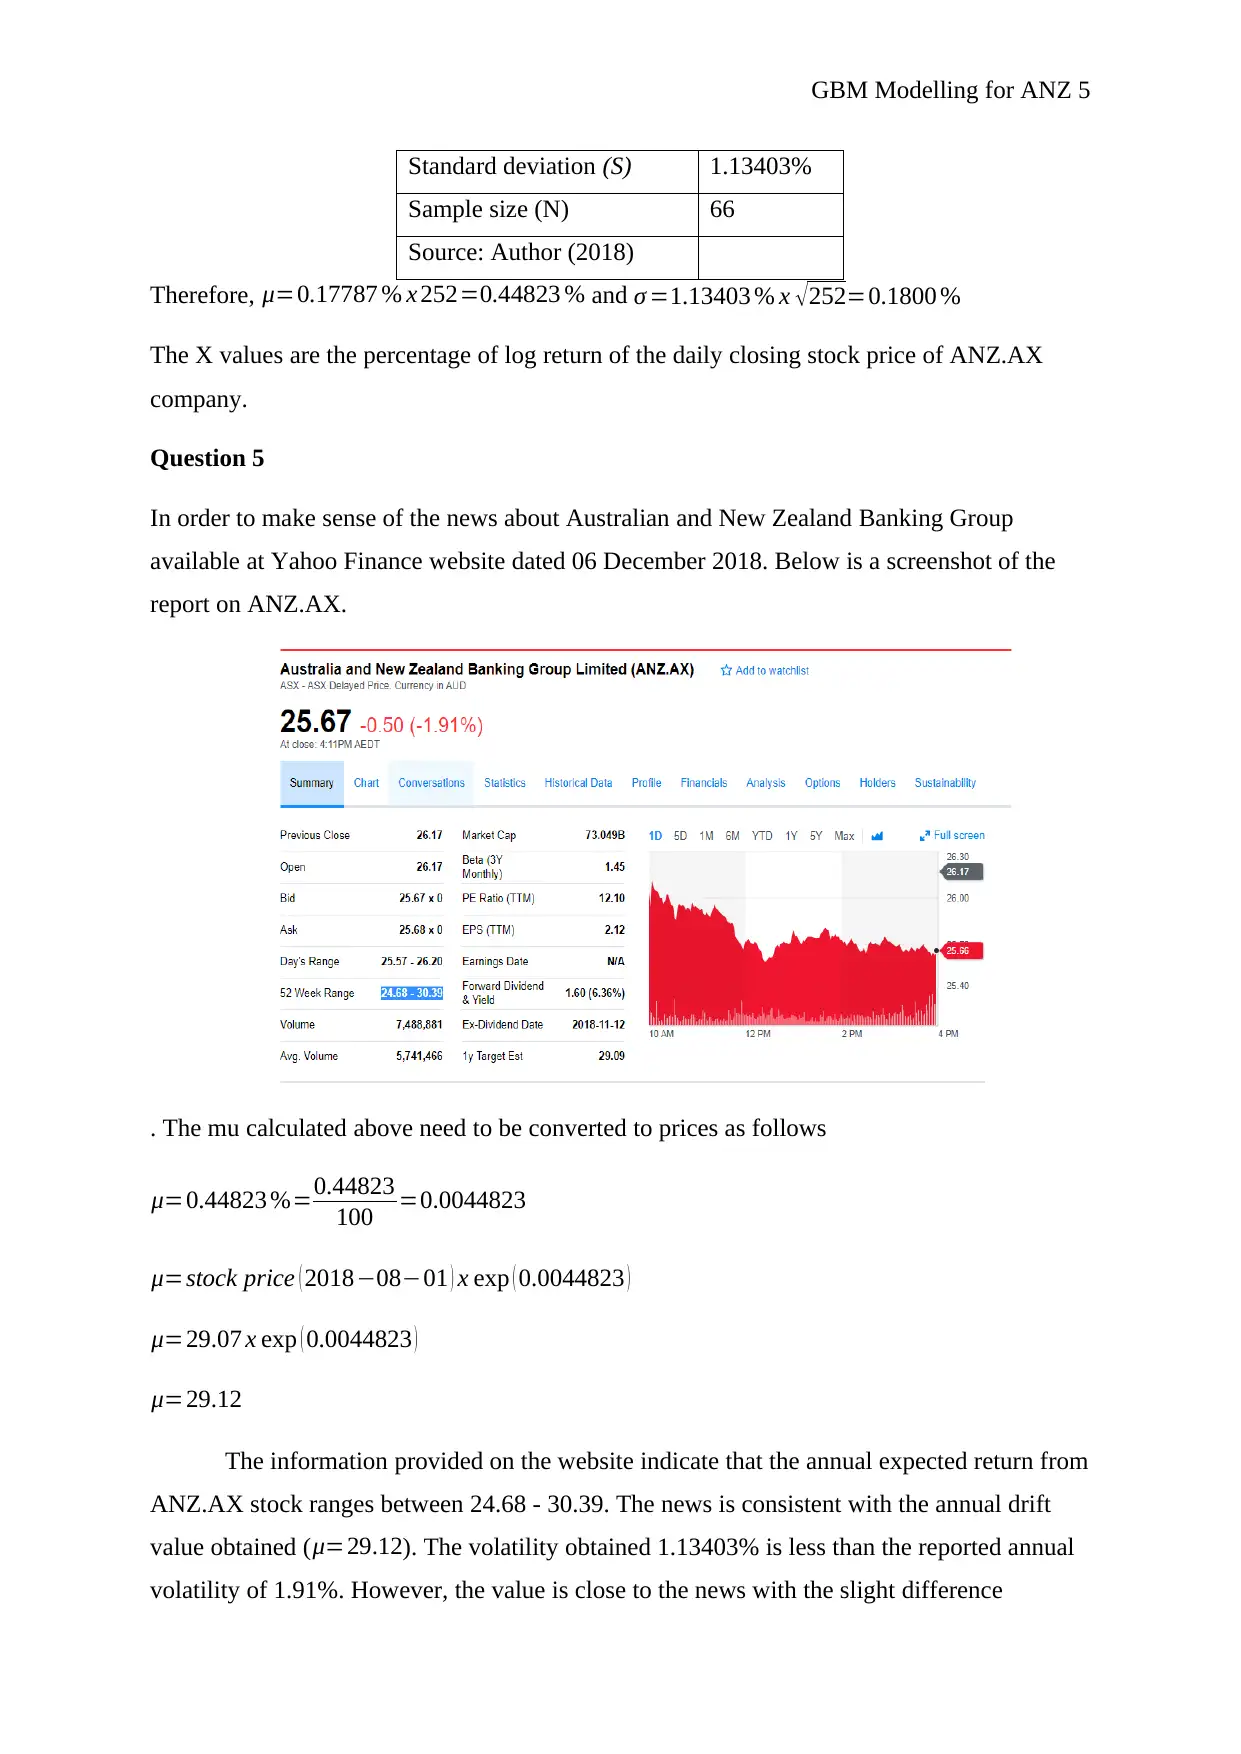
In order to make sense of the news about Australian and New Zealand Banking Group
available at Yahoo Finance website dated 06 December 2018. Below is a screenshot of the
report on ANZ.AX.
. The mu calculated above need to be converted to prices as follows
μ=0.44823 %=0.44823
100 =0.0044823
μ=stock price ( 2018−08−01 ) x exp ( 0.0044823 )
μ=29.07 x exp ( 0.0044823 )
μ=29.12
The information provided on the website indicate that the annual expected return from
ANZ.AX stock ranges between 24.68 - 30.39. The news is consistent with the annual drift
value obtained ( μ=29.12). The volatility obtained 1.13403% is less than the reported annual
volatility of 1.91%. However, the value is close to the news with the slight difference
Standard deviation (S) 1.13403%
Sample size (N) 66
Source: Author (2018)
Therefore, μ=0.17787 % x 252=0.44823 % and σ =1.13403 % x √ 252=0.1800 %
The X values are the percentage of log return of the daily closing stock price of ANZ.AX
company.
Question 5
In order to make sense of the news about Australian and New Zealand Banking Group
available at Yahoo Finance website dated 06 December 2018. Below is a screenshot of the
report on ANZ.AX.
. The mu calculated above need to be converted to prices as follows
μ=0.44823 %=0.44823
100 =0.0044823
μ=stock price ( 2018−08−01 ) x exp ( 0.0044823 )
μ=29.07 x exp ( 0.0044823 )
μ=29.12
The information provided on the website indicate that the annual expected return from
ANZ.AX stock ranges between 24.68 - 30.39. The news is consistent with the annual drift
value obtained ( μ=29.12). The volatility obtained 1.13403% is less than the reported annual
volatility of 1.91%. However, the value is close to the news with the slight difference
GBM Modelling for ANZ 6
originating from the use of small sample size (3 months). The analysis of stock prices gives a
more accurate data if the data used span a period of at least 5 years. Given that assumption (i)
was not met the variations might be attributed to the violation of the normality assumption.
Question 6
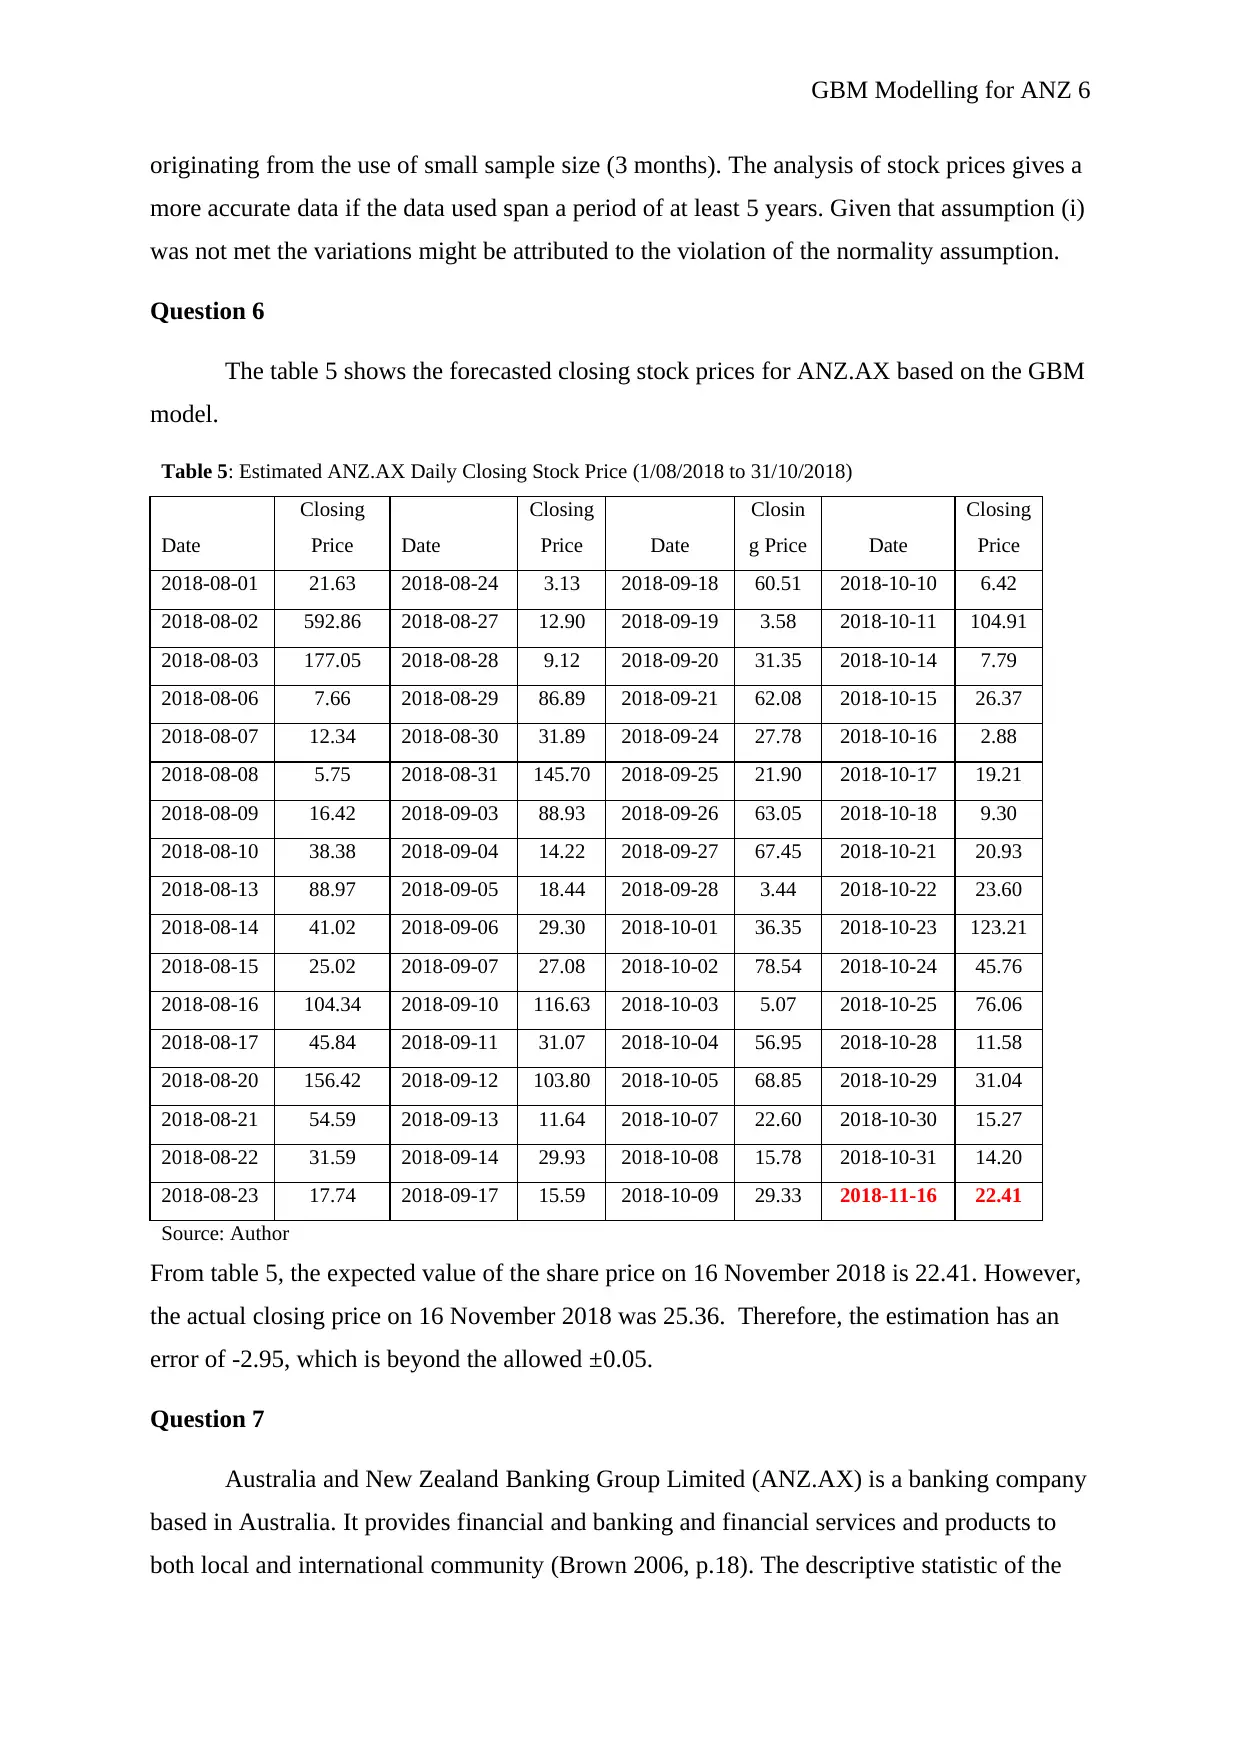
The table 5 shows the forecasted closing stock prices for ANZ.AX based on the GBM
model.
Table 5: Estimated ANZ.AX Daily Closing Stock Price (1/08/2018 to 31/10/2018)
Date
Closing
Price Date
Closing
Price Date
Closin
g Price Date
Closing
Price
2018-08-01 21.63 2018-08-24 3.13 2018-09-18 60.51 2018-10-10 6.42
2018-08-02 592.86 2018-08-27 12.90 2018-09-19 3.58 2018-10-11 104.91
2018-08-03 177.05 2018-08-28 9.12 2018-09-20 31.35 2018-10-14 7.79
2018-08-06 7.66 2018-08-29 86.89 2018-09-21 62.08 2018-10-15 26.37
2018-08-07 12.34 2018-08-30 31.89 2018-09-24 27.78 2018-10-16 2.88
2018-08-08 5.75 2018-08-31 145.70 2018-09-25 21.90 2018-10-17 19.21
2018-08-09 16.42 2018-09-03 88.93 2018-09-26 63.05 2018-10-18 9.30
2018-08-10 38.38 2018-09-04 14.22 2018-09-27 67.45 2018-10-21 20.93
2018-08-13 88.97 2018-09-05 18.44 2018-09-28 3.44 2018-10-22 23.60
2018-08-14 41.02 2018-09-06 29.30 2018-10-01 36.35 2018-10-23 123.21
2018-08-15 25.02 2018-09-07 27.08 2018-10-02 78.54 2018-10-24 45.76
2018-08-16 104.34 2018-09-10 116.63 2018-10-03 5.07 2018-10-25 76.06
2018-08-17 45.84 2018-09-11 31.07 2018-10-04 56.95 2018-10-28 11.58
2018-08-20 156.42 2018-09-12 103.80 2018-10-05 68.85 2018-10-29 31.04
2018-08-21 54.59 2018-09-13 11.64 2018-10-07 22.60 2018-10-30 15.27
2018-08-22 31.59 2018-09-14 29.93 2018-10-08 15.78 2018-10-31 14.20
2018-08-23 17.74 2018-09-17 15.59 2018-10-09 29.33 2018-11-16 22.41
Source: Author
From table 5, the expected value of the share price on 16 November 2018 is 22.41. However,
the actual closing price on 16 November 2018 was 25.36. Therefore, the estimation has an
error of -2.95, which is beyond the allowed ±0.05.
Question 7
Australia and New Zealand Banking Group Limited (ANZ.AX) is a banking company
based in Australia. It provides financial and banking and financial services and products to
both local and international community (Brown 2006, p.18). The descriptive statistic of the
originating from the use of small sample size (3 months). The analysis of stock prices gives a
more accurate data if the data used span a period of at least 5 years. Given that assumption (i)
was not met the variations might be attributed to the violation of the normality assumption.
Question 6
The table 5 shows the forecasted closing stock prices for ANZ.AX based on the GBM
model.
Table 5: Estimated ANZ.AX Daily Closing Stock Price (1/08/2018 to 31/10/2018)
Date
Closing
Price Date
Closing
Price Date
Closin
g Price Date
Closing
Price
2018-08-01 21.63 2018-08-24 3.13 2018-09-18 60.51 2018-10-10 6.42
2018-08-02 592.86 2018-08-27 12.90 2018-09-19 3.58 2018-10-11 104.91
2018-08-03 177.05 2018-08-28 9.12 2018-09-20 31.35 2018-10-14 7.79
2018-08-06 7.66 2018-08-29 86.89 2018-09-21 62.08 2018-10-15 26.37
2018-08-07 12.34 2018-08-30 31.89 2018-09-24 27.78 2018-10-16 2.88
2018-08-08 5.75 2018-08-31 145.70 2018-09-25 21.90 2018-10-17 19.21
2018-08-09 16.42 2018-09-03 88.93 2018-09-26 63.05 2018-10-18 9.30
2018-08-10 38.38 2018-09-04 14.22 2018-09-27 67.45 2018-10-21 20.93
2018-08-13 88.97 2018-09-05 18.44 2018-09-28 3.44 2018-10-22 23.60
2018-08-14 41.02 2018-09-06 29.30 2018-10-01 36.35 2018-10-23 123.21
2018-08-15 25.02 2018-09-07 27.08 2018-10-02 78.54 2018-10-24 45.76
2018-08-16 104.34 2018-09-10 116.63 2018-10-03 5.07 2018-10-25 76.06
2018-08-17 45.84 2018-09-11 31.07 2018-10-04 56.95 2018-10-28 11.58
2018-08-20 156.42 2018-09-12 103.80 2018-10-05 68.85 2018-10-29 31.04
2018-08-21 54.59 2018-09-13 11.64 2018-10-07 22.60 2018-10-30 15.27
2018-08-22 31.59 2018-09-14 29.93 2018-10-08 15.78 2018-10-31 14.20
2018-08-23 17.74 2018-09-17 15.59 2018-10-09 29.33 2018-11-16 22.41
Source: Author
From table 5, the expected value of the share price on 16 November 2018 is 22.41. However,
the actual closing price on 16 November 2018 was 25.36. Therefore, the estimation has an
error of -2.95, which is beyond the allowed ±0.05.
Question 7
Australia and New Zealand Banking Group Limited (ANZ.AX) is a banking company
based in Australia. It provides financial and banking and financial services and products to
both local and international community (Brown 2006, p.18). The descriptive statistic of the
⊘ This is a preview!⊘
Do you want full access?
Subscribe today to unlock all pages.
Trusted by 1+ million students worldwide
GBM Modelling for ANZ 7
raw data for the period of three months indicate that the company has an average daily
closing stock price of 27.90 AUD with the average ranging at plus or minus 1.49 AUD. The
minimum price that the asset had registered in the period was 24.80AUD while the maximum
was 30.28AUD. The company estimated target is at 29.09AUD which is within the range of
the average close price.
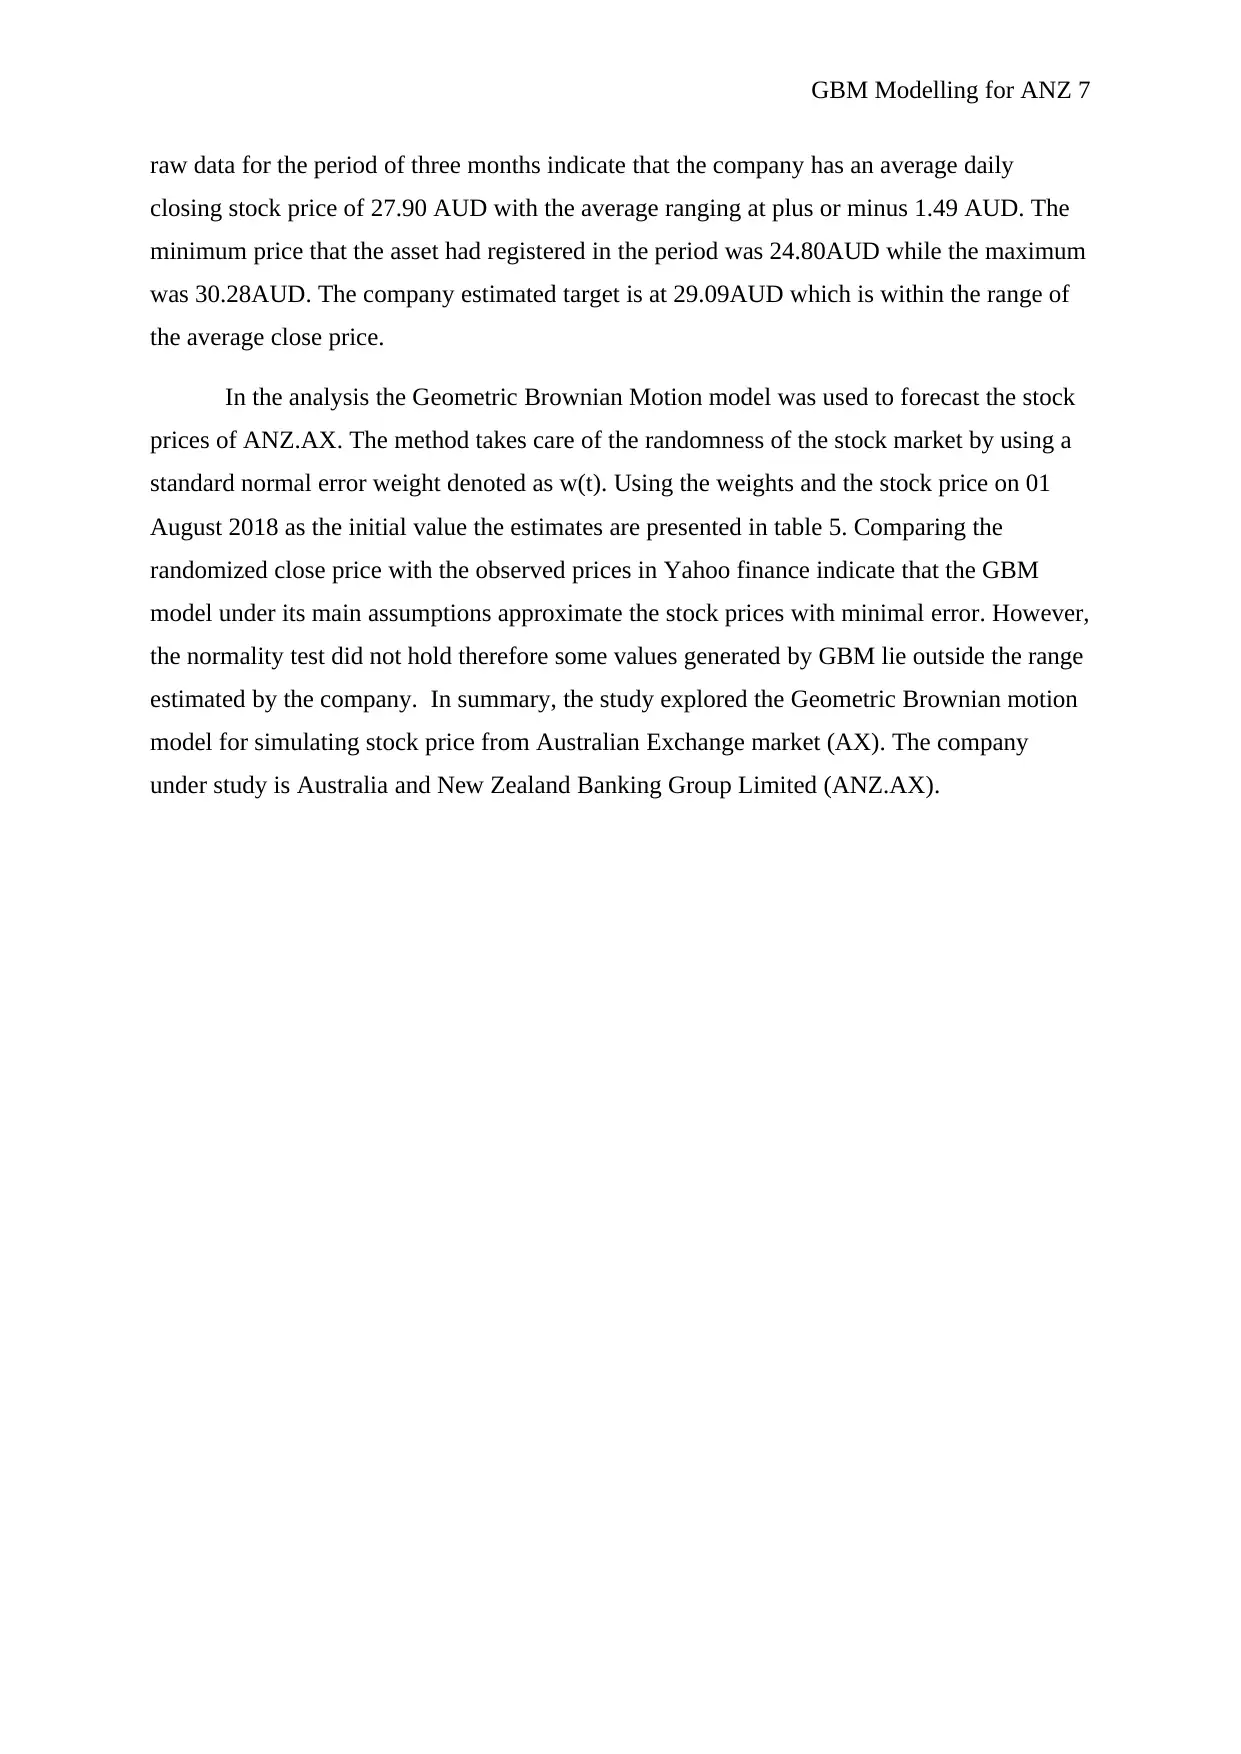
In the analysis the Geometric Brownian Motion model was used to forecast the stock
prices of ANZ.AX. The method takes care of the randomness of the stock market by using a
standard normal error weight denoted as w(t). Using the weights and the stock price on 01
August 2018 as the initial value the estimates are presented in table 5. Comparing the
randomized close price with the observed prices in Yahoo finance indicate that the GBM
model under its main assumptions approximate the stock prices with minimal error. However,
the normality test did not hold therefore some values generated by GBM lie outside the range
estimated by the company. In summary, the study explored the Geometric Brownian motion
model for simulating stock price from Australian Exchange market (AX). The company
under study is Australia and New Zealand Banking Group Limited (ANZ.AX).
raw data for the period of three months indicate that the company has an average daily
closing stock price of 27.90 AUD with the average ranging at plus or minus 1.49 AUD. The
minimum price that the asset had registered in the period was 24.80AUD while the maximum
was 30.28AUD. The company estimated target is at 29.09AUD which is within the range of
the average close price.
In the analysis the Geometric Brownian Motion model was used to forecast the stock
prices of ANZ.AX. The method takes care of the randomness of the stock market by using a
standard normal error weight denoted as w(t). Using the weights and the stock price on 01
August 2018 as the initial value the estimates are presented in table 5. Comparing the
randomized close price with the observed prices in Yahoo finance indicate that the GBM
model under its main assumptions approximate the stock prices with minimal error. However,
the normality test did not hold therefore some values generated by GBM lie outside the range
estimated by the company. In summary, the study explored the Geometric Brownian motion
model for simulating stock price from Australian Exchange market (AX). The company
under study is Australia and New Zealand Banking Group Limited (ANZ.AX).
Paraphrase This Document
Need a fresh take? Get an instant paraphrase of this document with our AI Paraphraser
GBM Modelling for ANZ 8
References
Australia and New Zealand Banking Group Limited (ANZ), 2018. Profile, business
summary, historical data. Yahoo! Finance. Retrieved from
https://au.finance.yahoo.com/?
utm_source=Marketing&utm_medium=SEM&utm_term=SEM_News&utm_content=
non_branded_%2Byahoo%20%2Bfinance&ncid=googlesem_semnews_cc33emalx9k.
Brown, G., 2006. Australia and New Zealand Banking Group (ANZ): Aligning community
strategy with business strategy. The Journal of Corporate Citizenship, (22), p.18.
Reddy, K. and Clinton, V., 2016. Simulating Stock Prices Using Geometric Brownian
Motion: Evidence from Australian Companies. Australasian Accounting, Business
and Finance Journal, 10(3), pp.23-47.
Yang, Z. and Aldous, D., 2015. Geometric Brownian motion model in financial
market. University of California, Berkeley.
GBM Modelling for ANZ 9
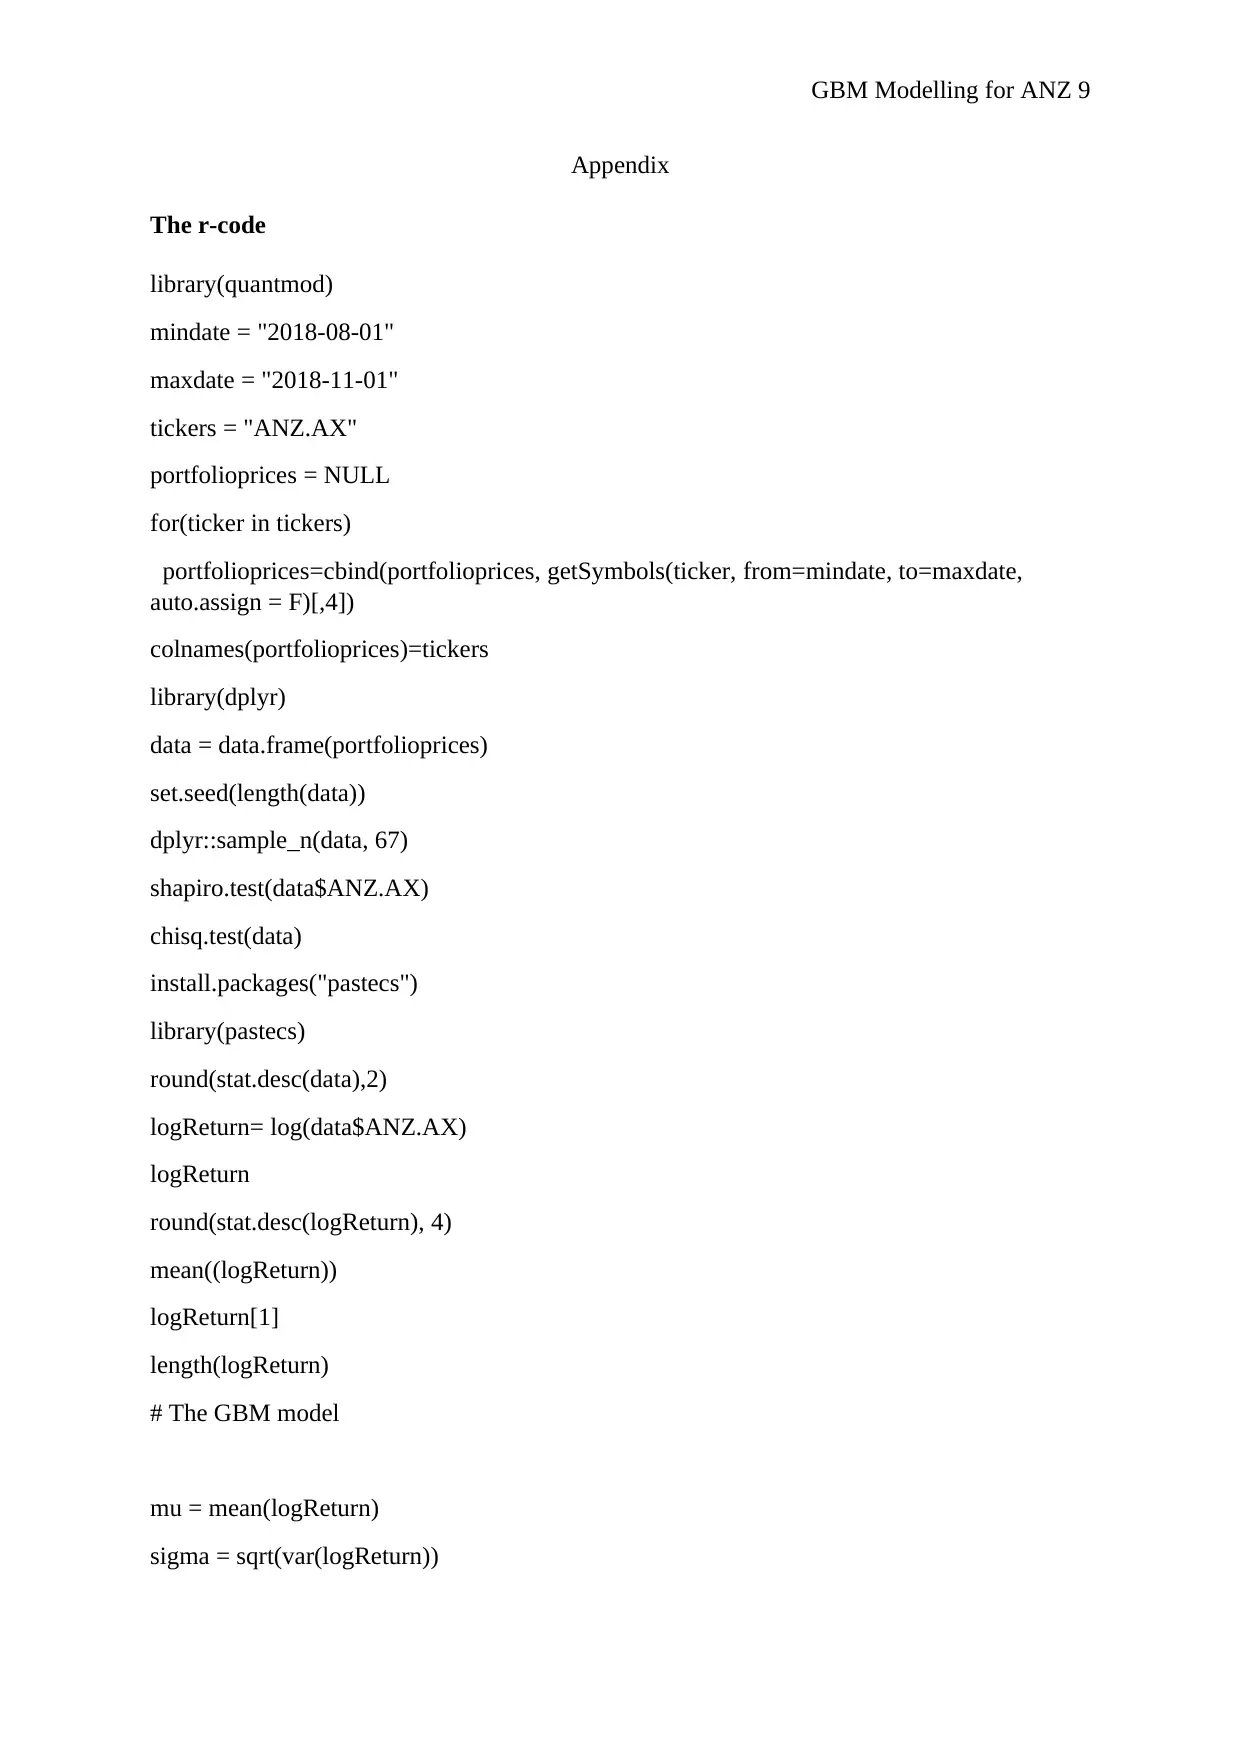
Appendix
The r-code
library(quantmod)
mindate = "2018-08-01"
maxdate = "2018-11-01"
tickers = "ANZ.AX"
portfolioprices = NULL
for(ticker in tickers)
portfolioprices=cbind(portfolioprices, getSymbols(ticker, from=mindate, to=maxdate,
auto.assign = F)[,4])
colnames(portfolioprices)=tickers
library(dplyr)
data = data.frame(portfolioprices)
set.seed(length(data))
dplyr::sample_n(data, 67)
shapiro.test(data$ANZ.AX)
chisq.test(data)
install.packages("pastecs")
library(pastecs)
round(stat.desc(data),2)
logReturn= log(data$ANZ.AX)
logReturn
round(stat.desc(logReturn), 4)
mean((logReturn))
logReturn[1]
length(logReturn)
# The GBM model
mu = mean(logReturn)
sigma = sqrt(var(logReturn))
⊘ This is a preview!⊘
Do you want full access?
Subscribe today to unlock all pages.
Trusted by 1+ million students worldwide
GBM Modelling for ANZ 10
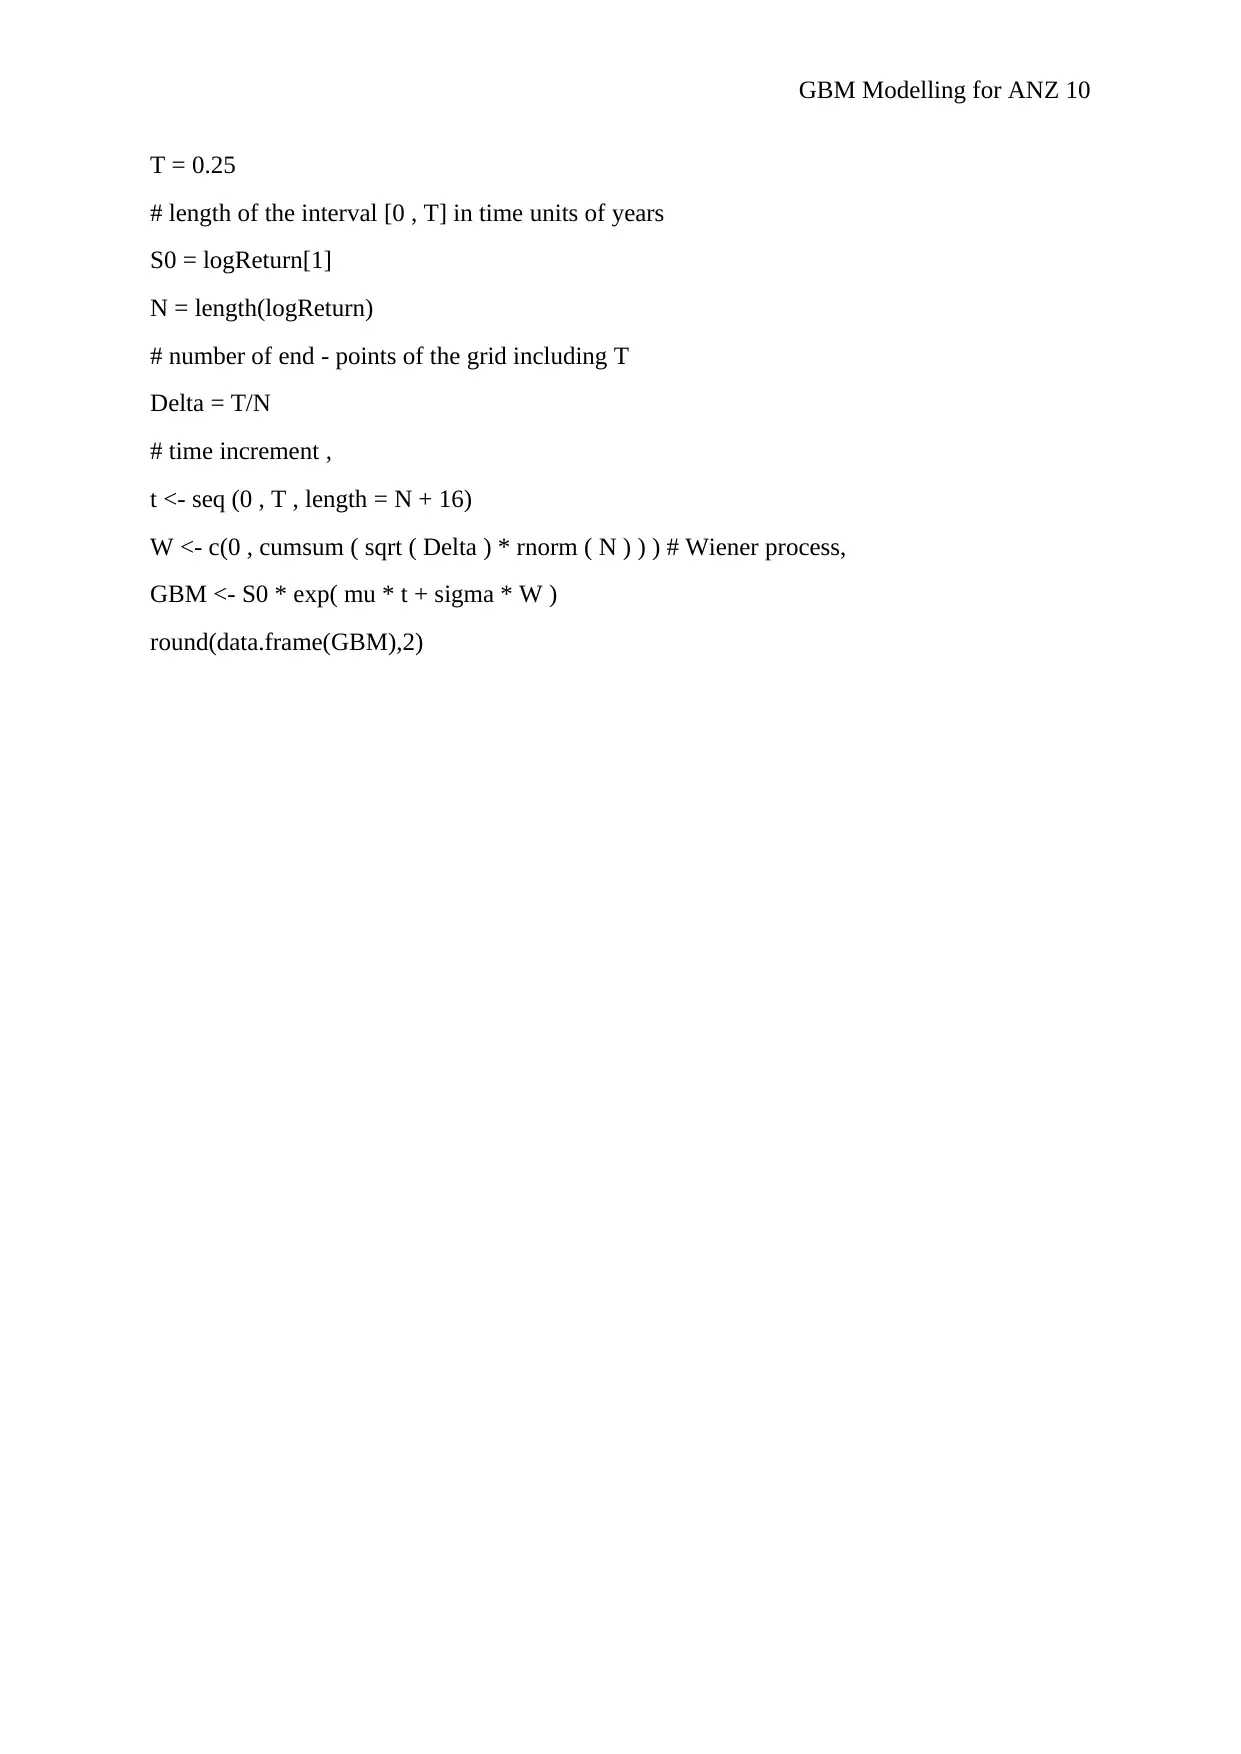
T = 0.25
# length of the interval [0 , T] in time units of years
S0 = logReturn[1]
N = length(logReturn)
# number of end - points of the grid including T
Delta = T/N
# time increment ,
t <- seq (0 , T , length = N + 16)
W <- c(0 , cumsum ( sqrt ( Delta ) * rnorm ( N ) ) ) # Wiener process,
GBM <- S0 * exp( mu * t + sigma * W )
round(data.frame(GBM),2)
1 out of 10

Your All-in-One AI-Powered Toolkit for Academic Success.
+13062052269
info@desklib.com
Available 24*7 on WhatsApp / Email
![[object Object]](/_next/static/media/star-bottom.7253800d.svg)
Unlock your academic potential
Copyright © 2020–2026 A2Z Services. All Rights Reserved. Developed and managed by ZUCOL.