Genetics 13 Assignment: University Genetics Experiment Analysis Report
VerifiedAdded on  2021/05/31
|14
|490
|205
Homework Assignment
AI Summary
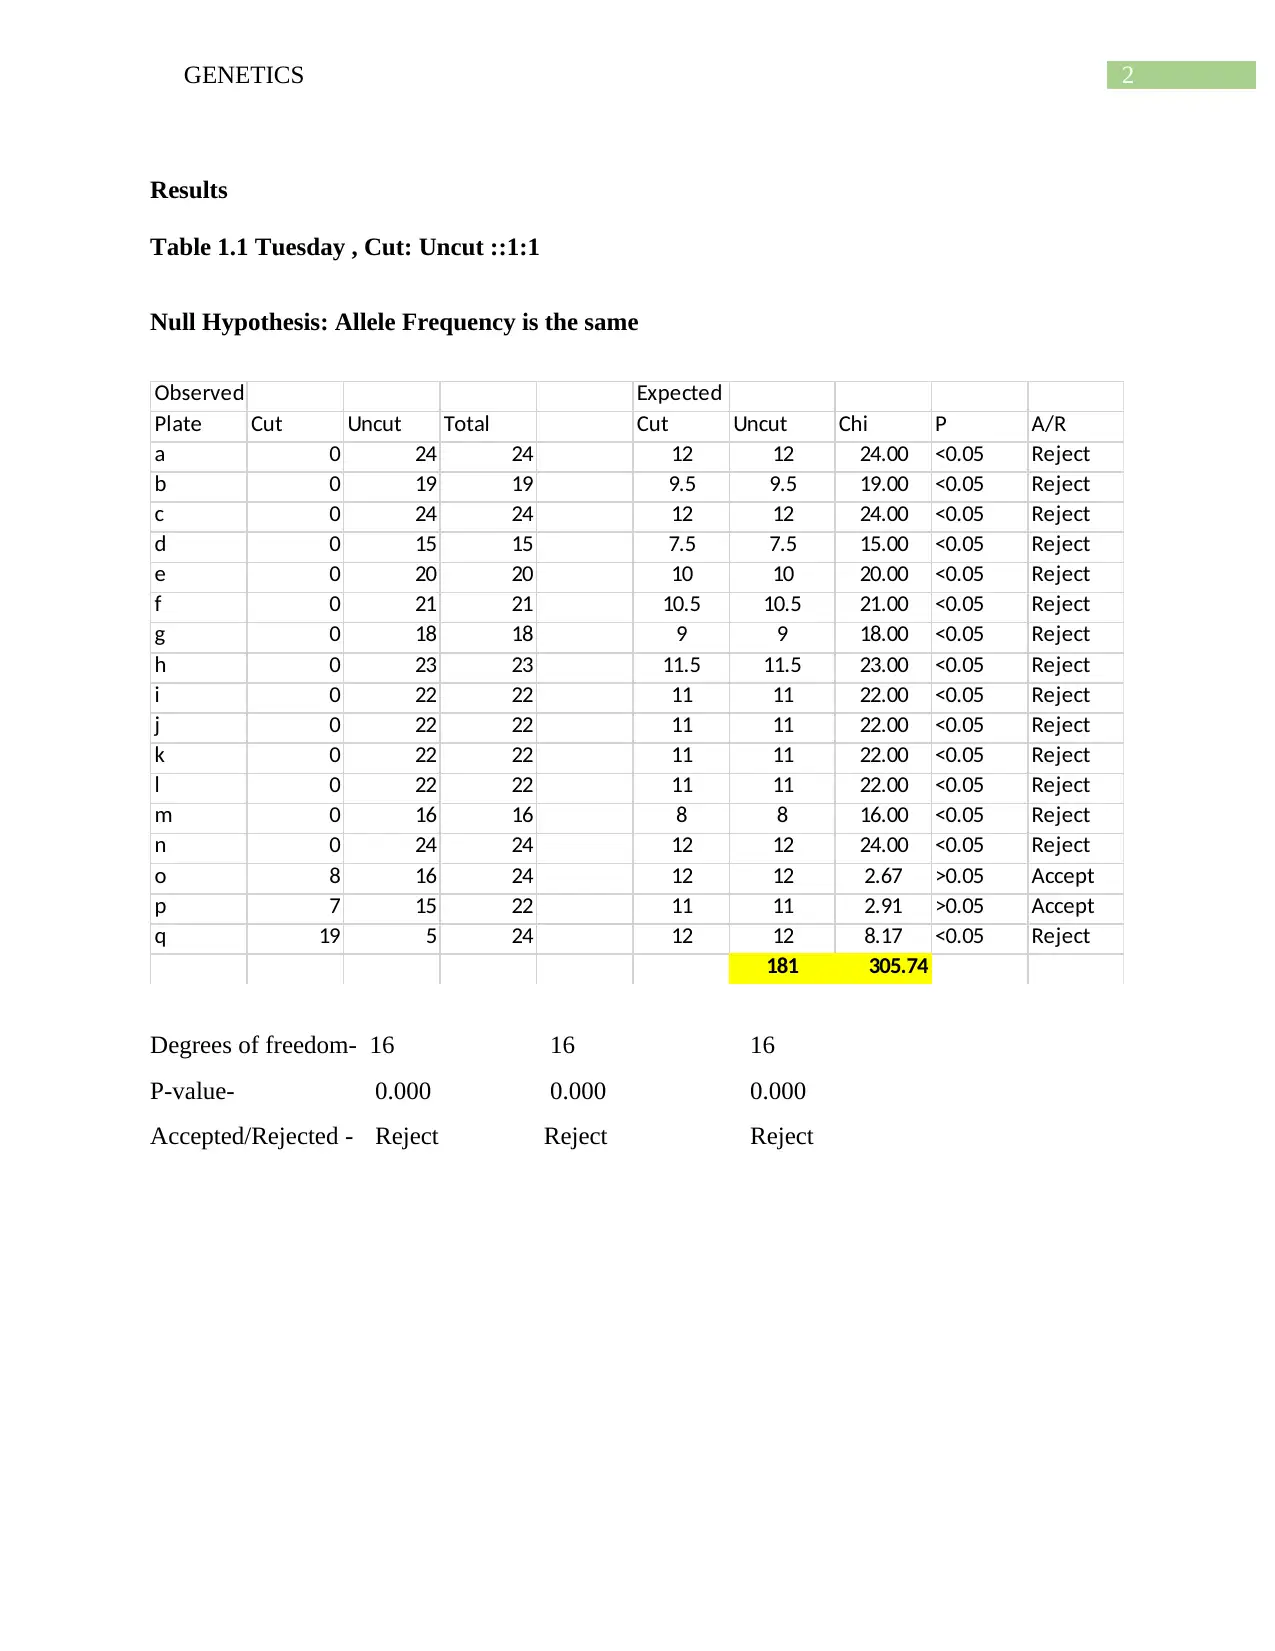
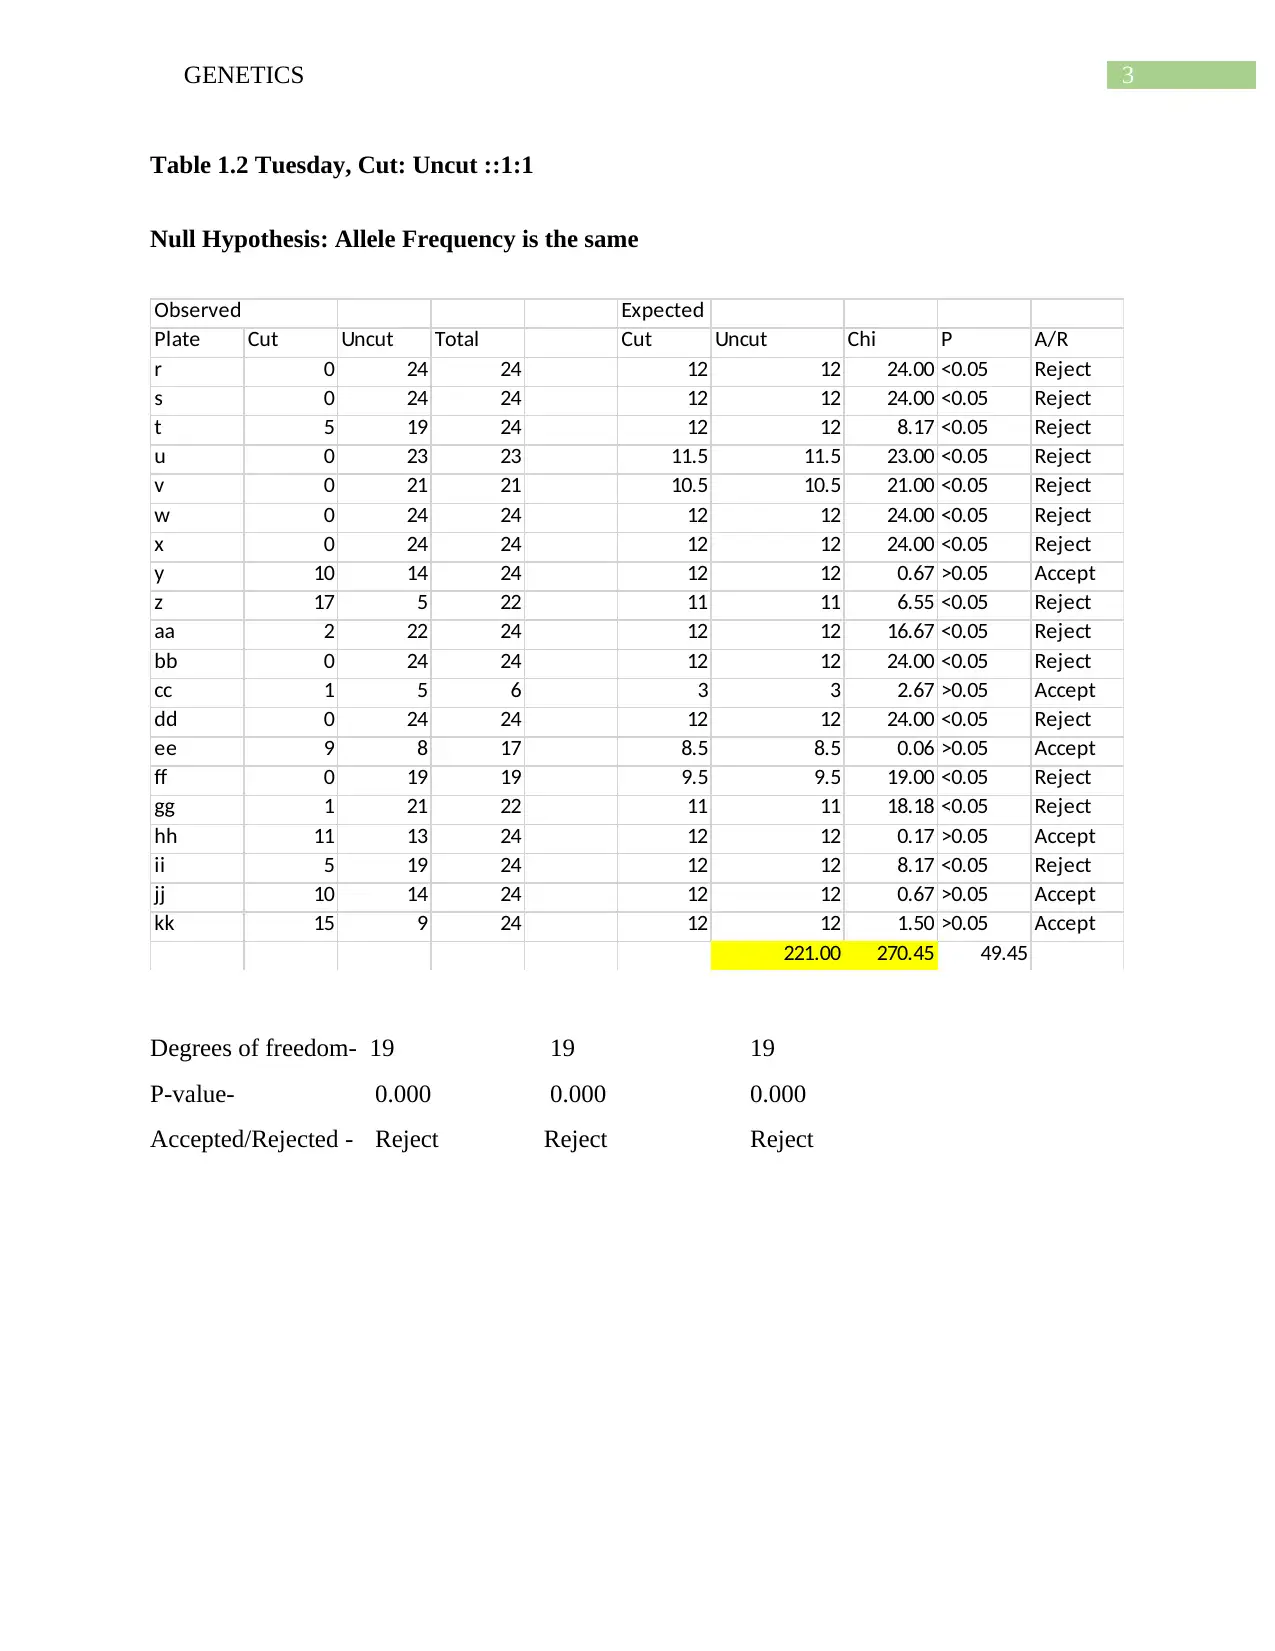
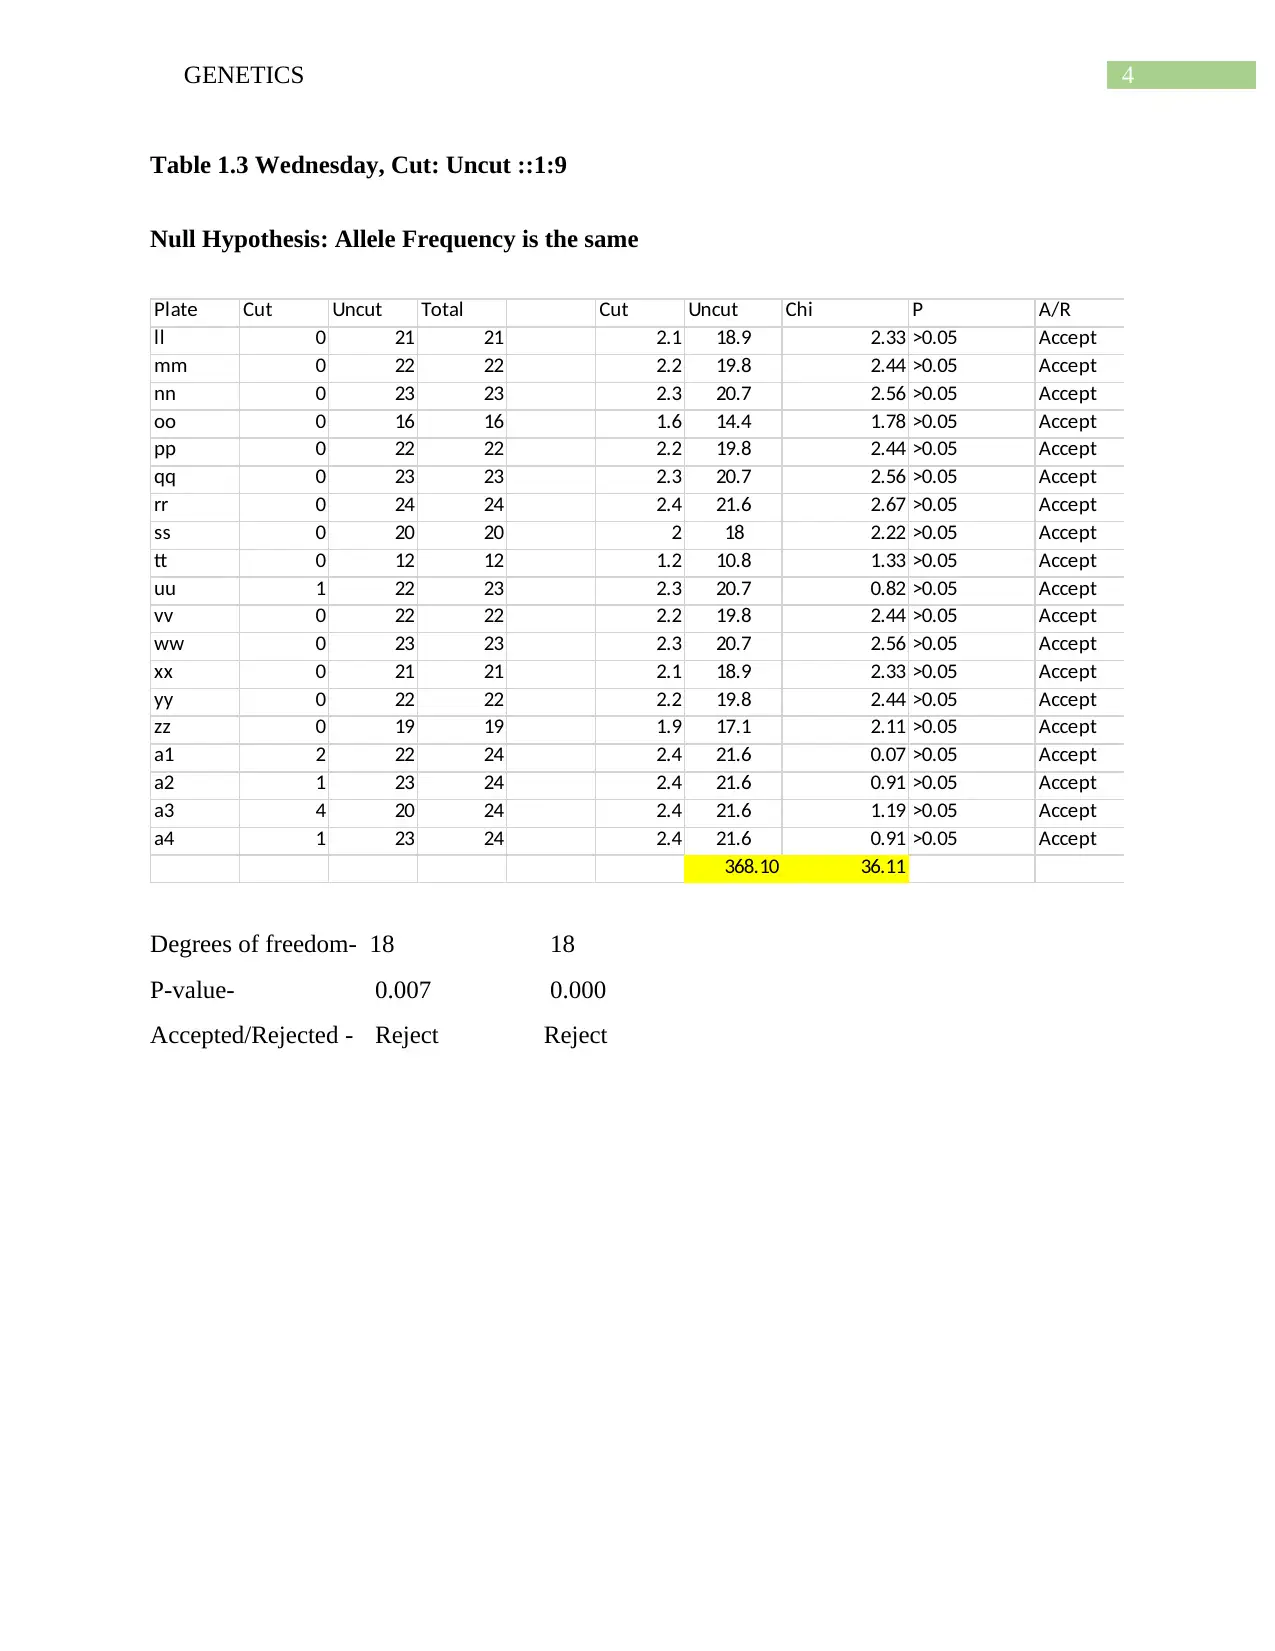
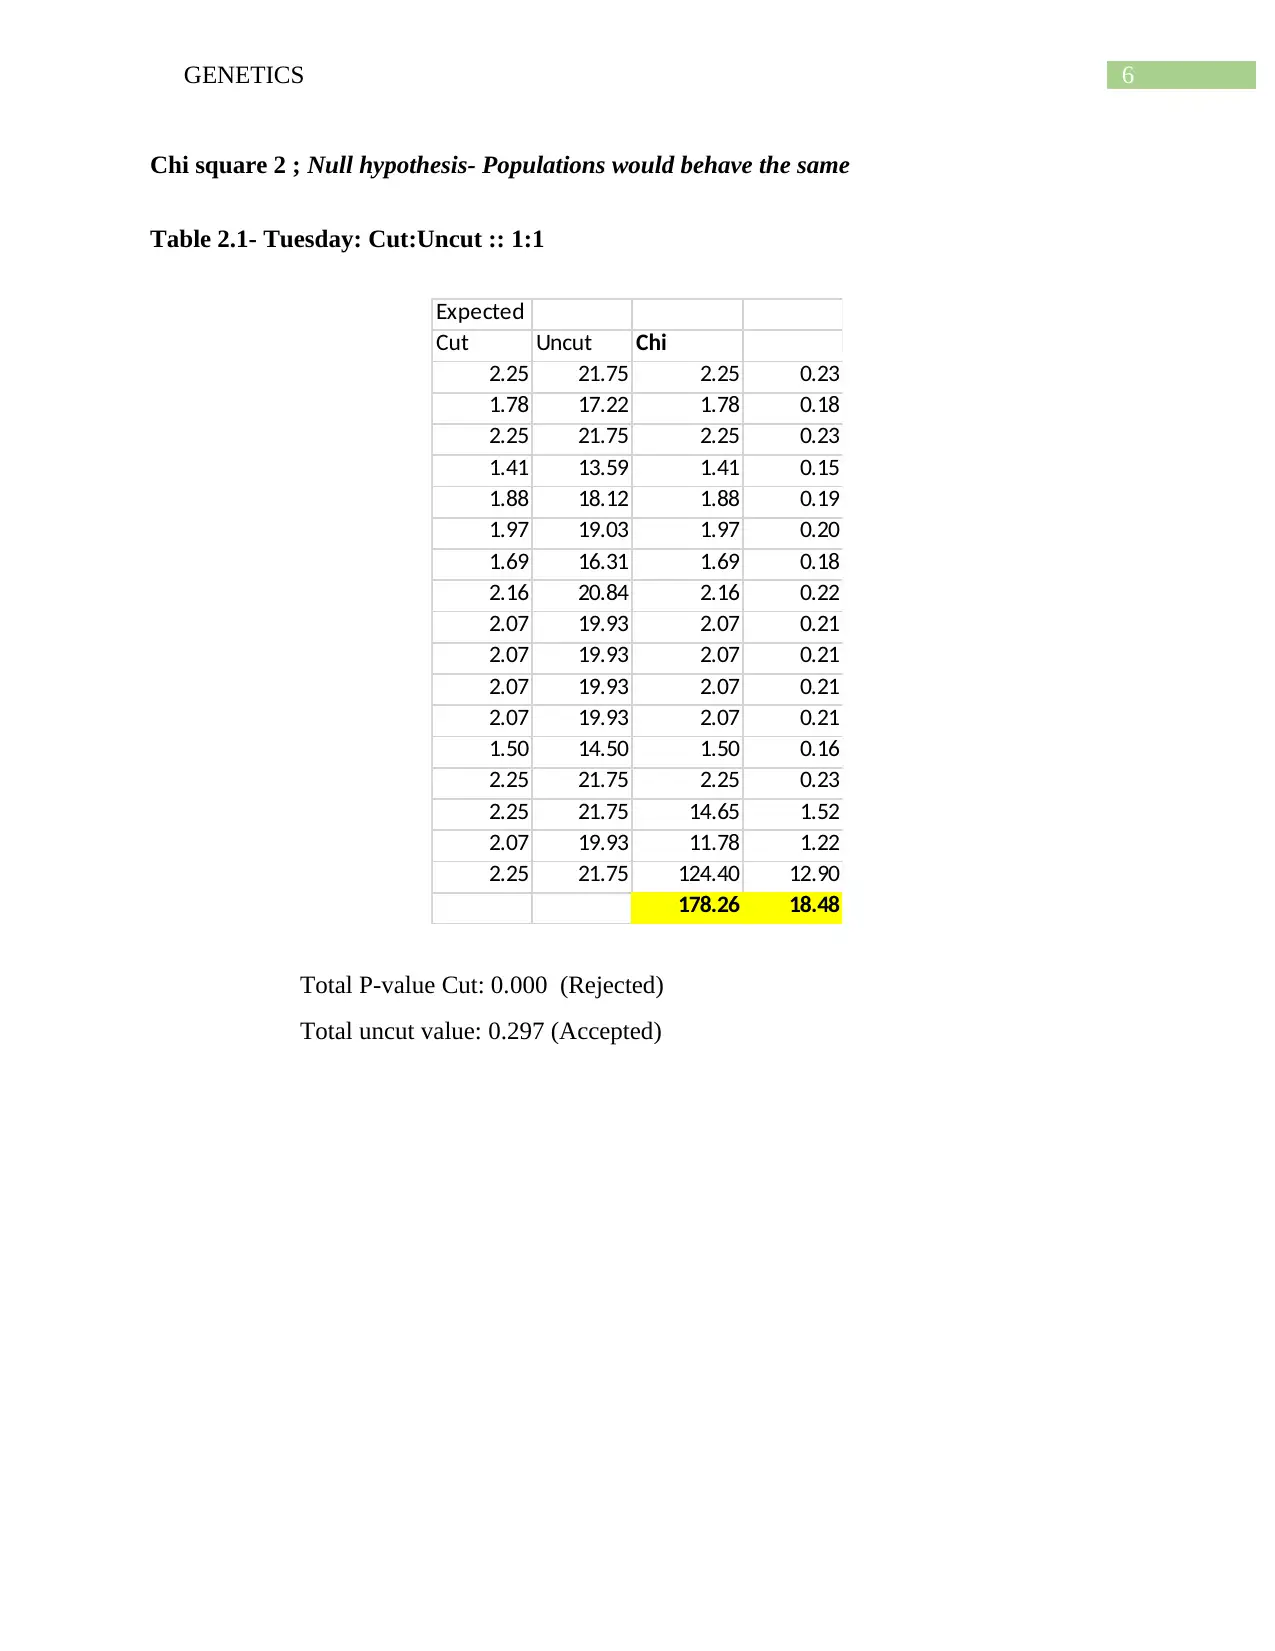
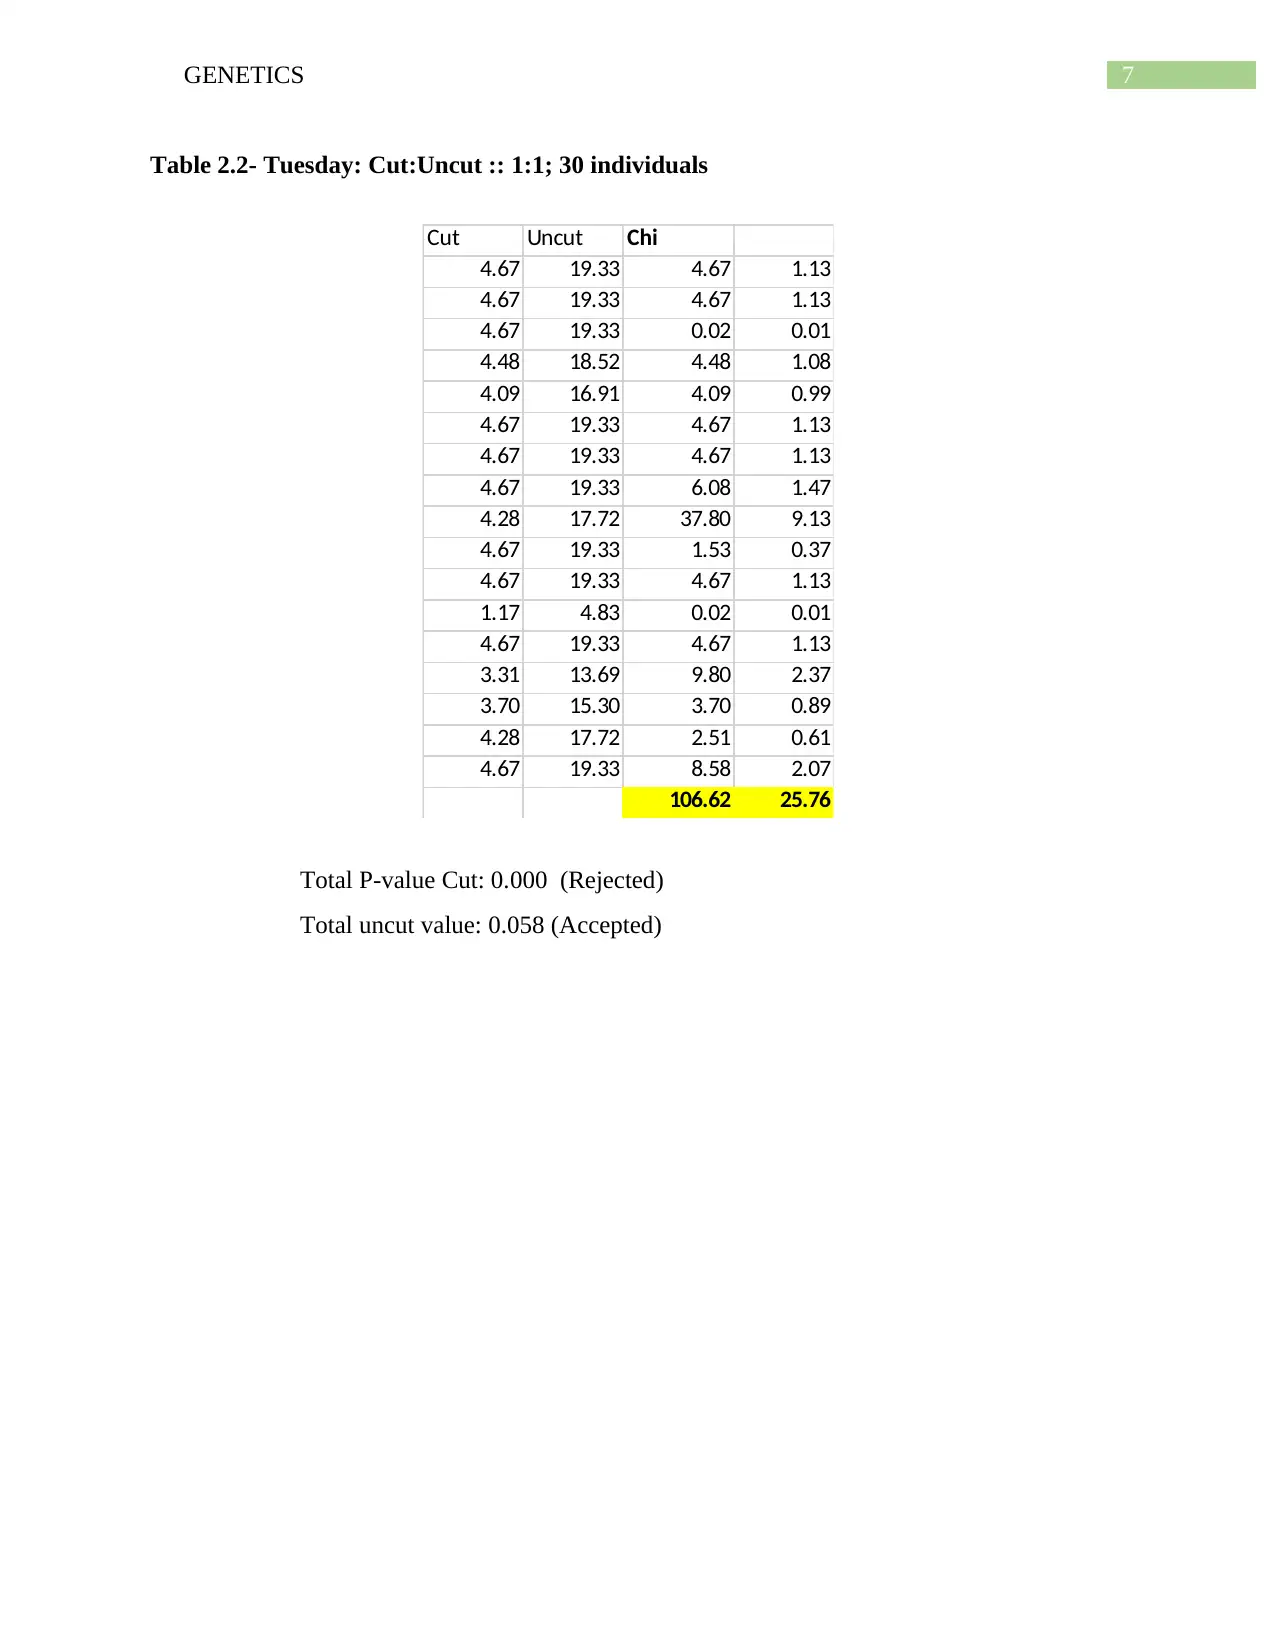
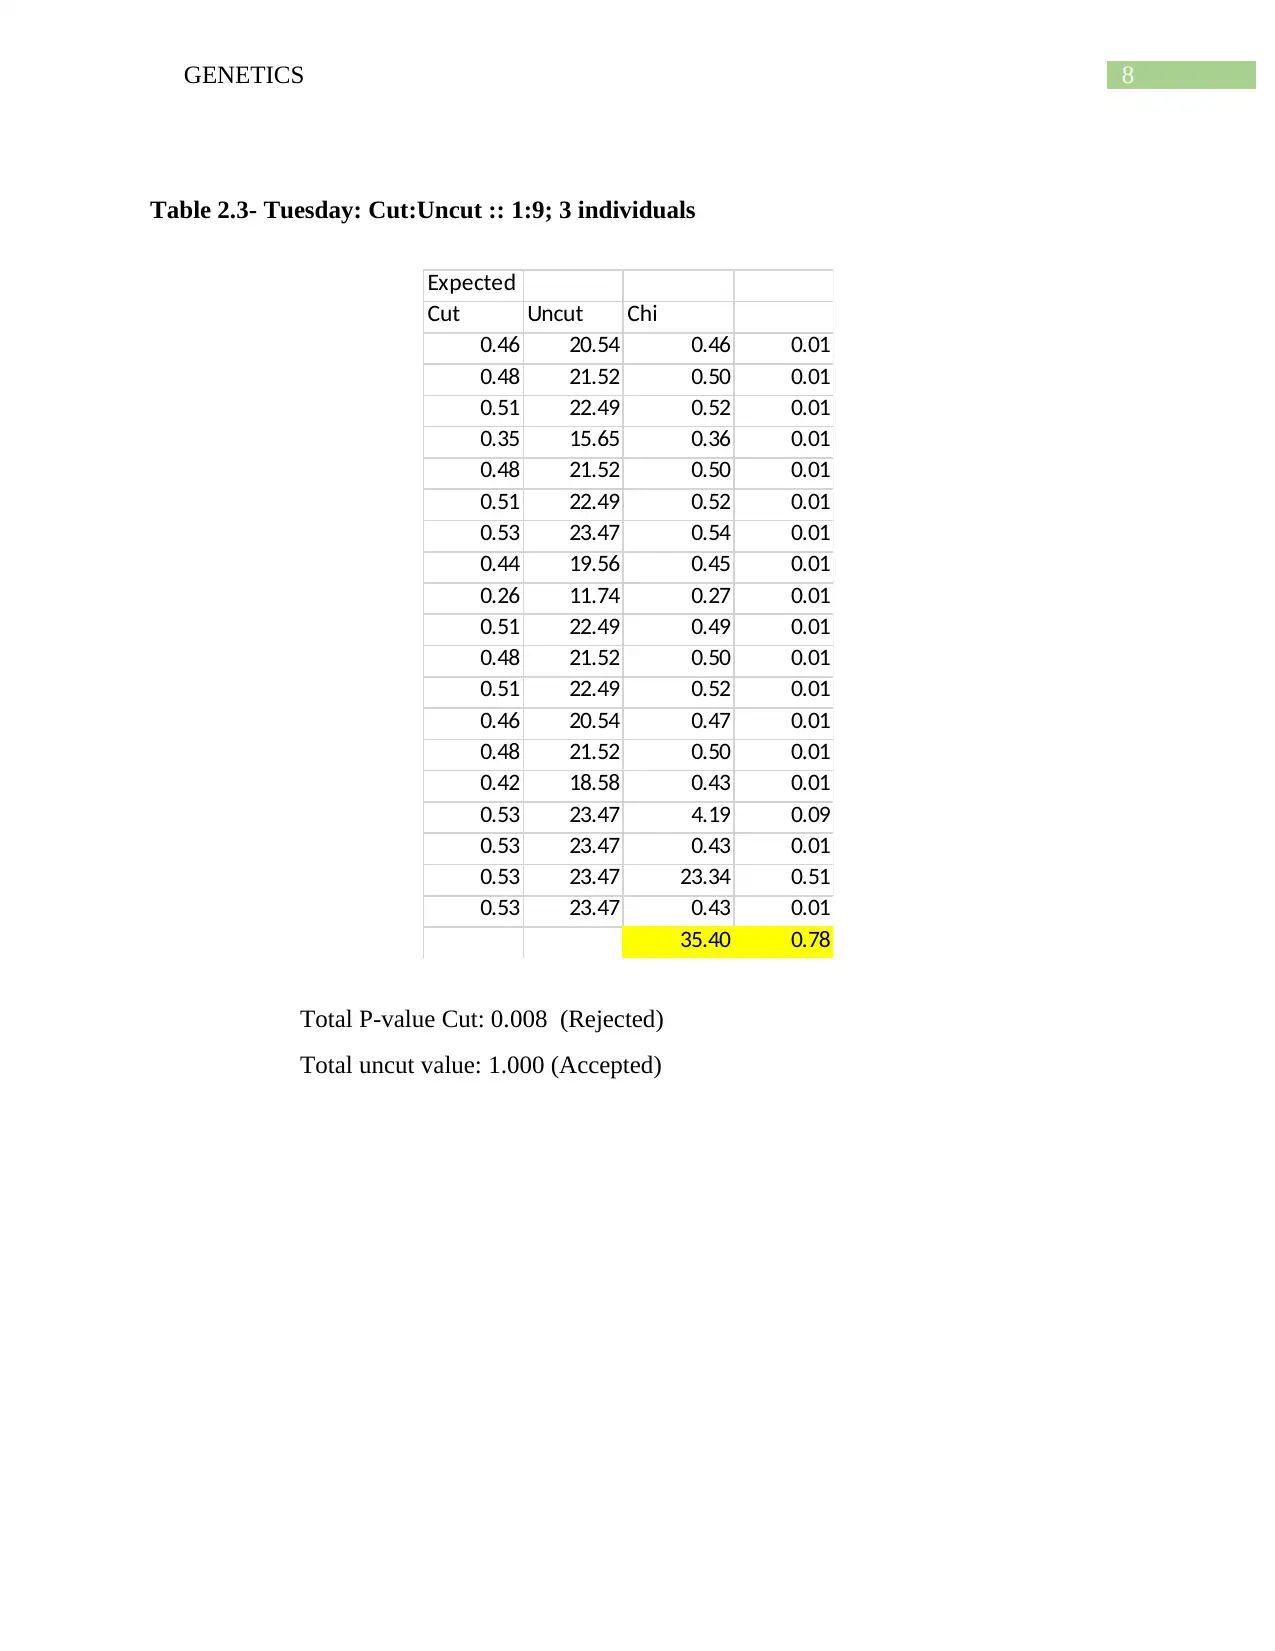
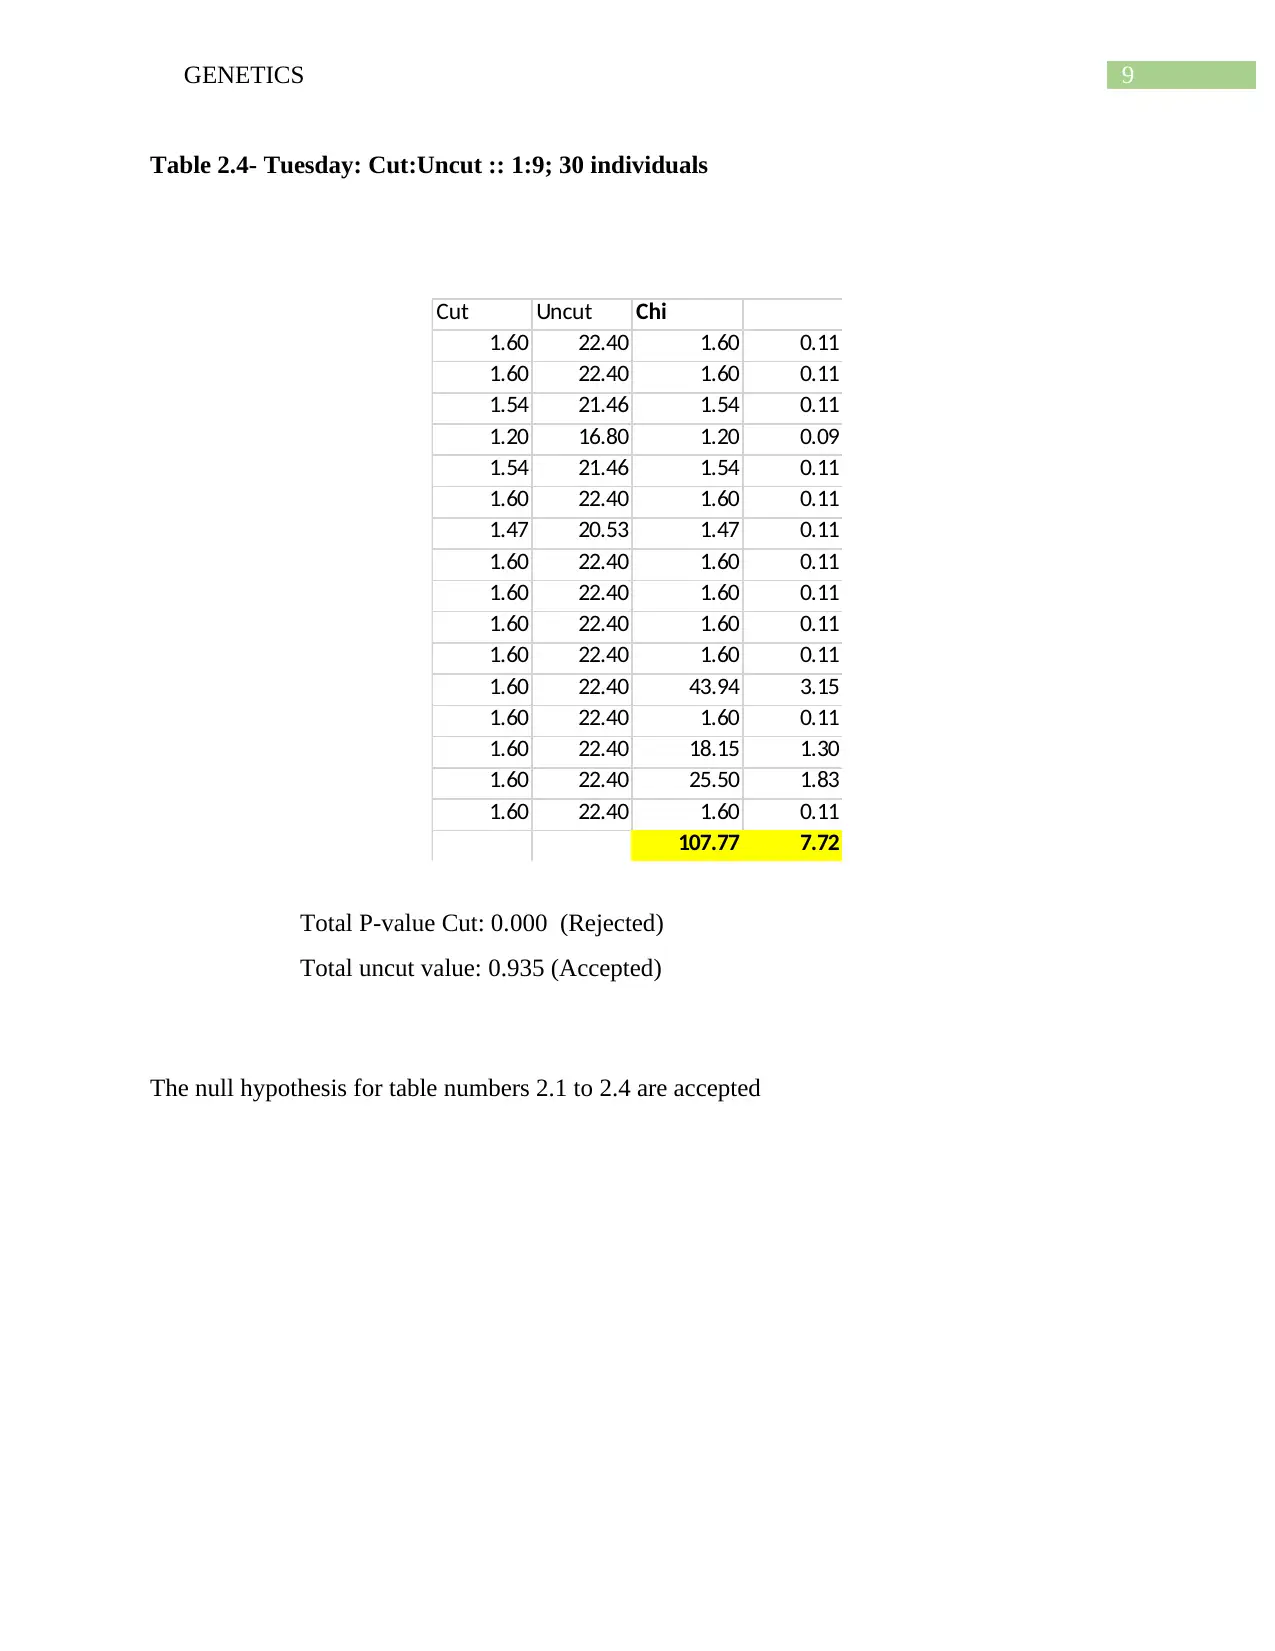
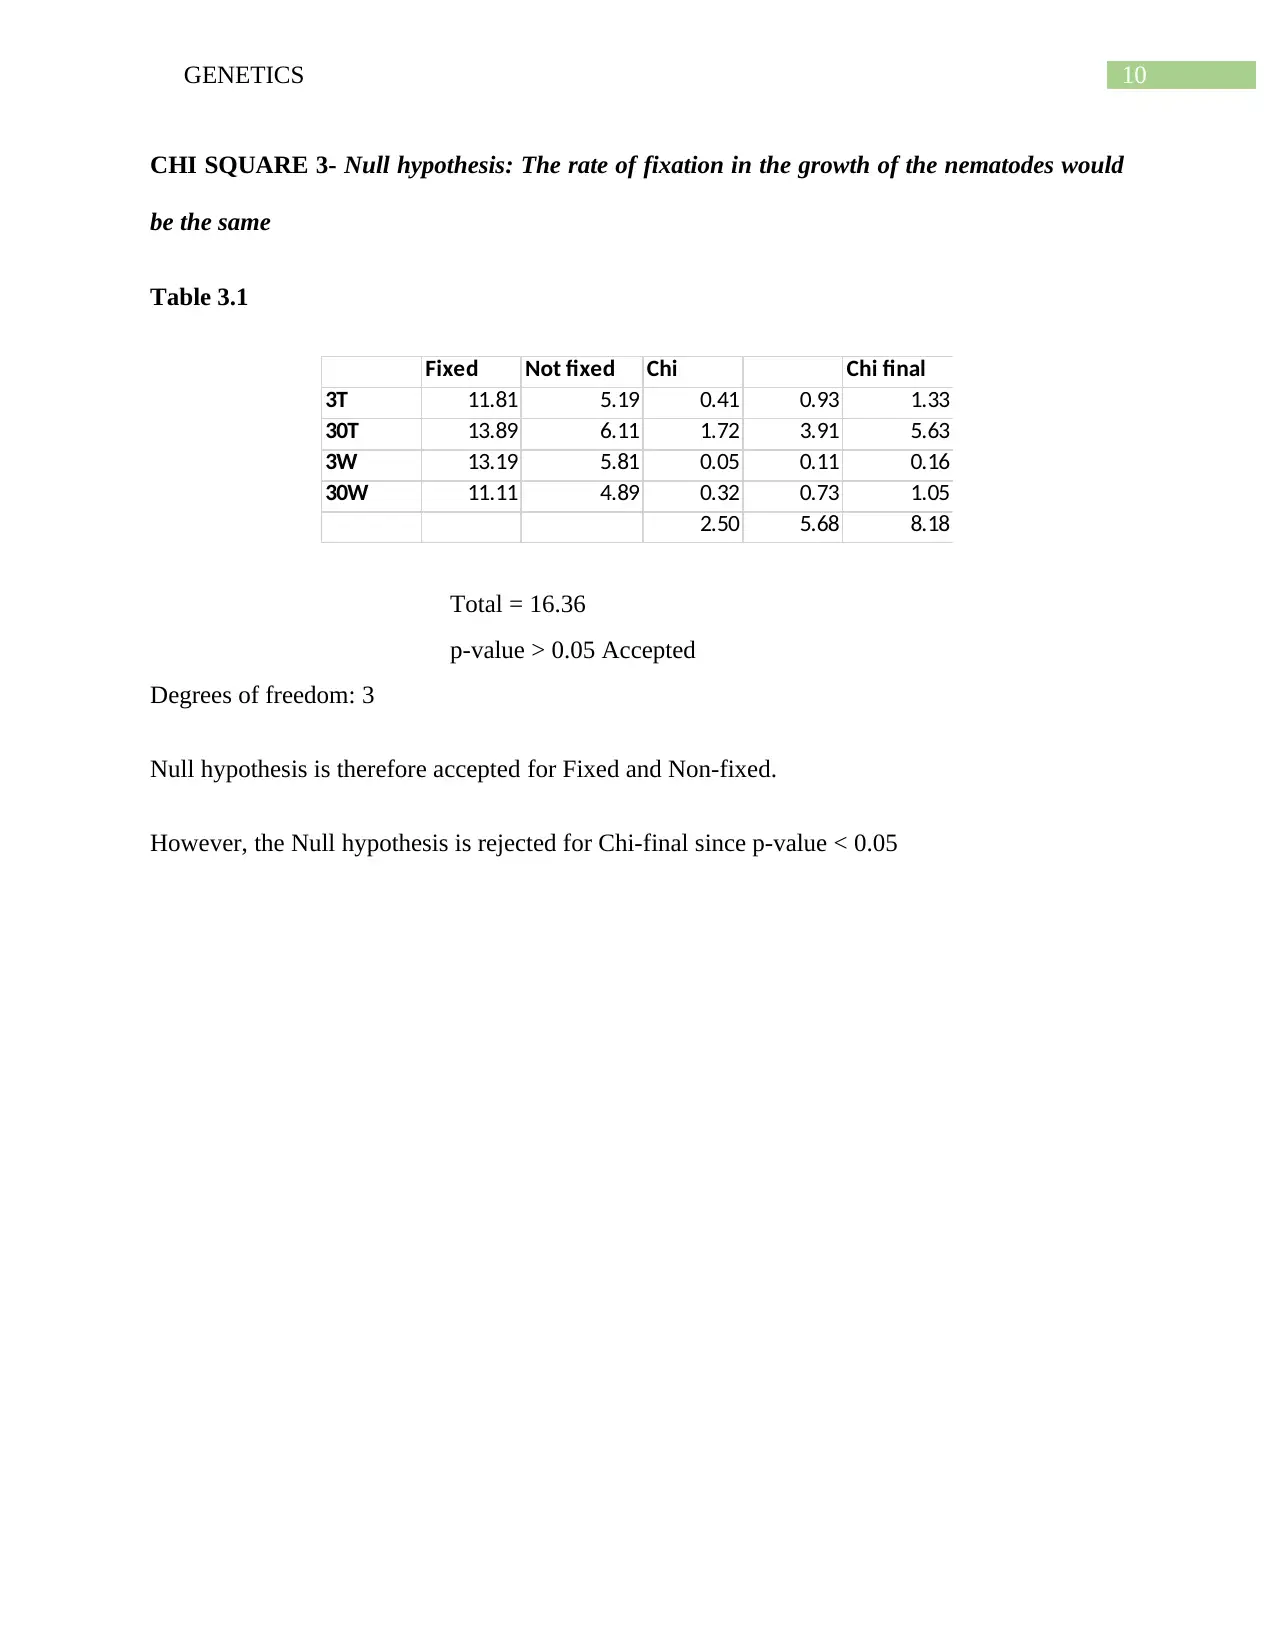
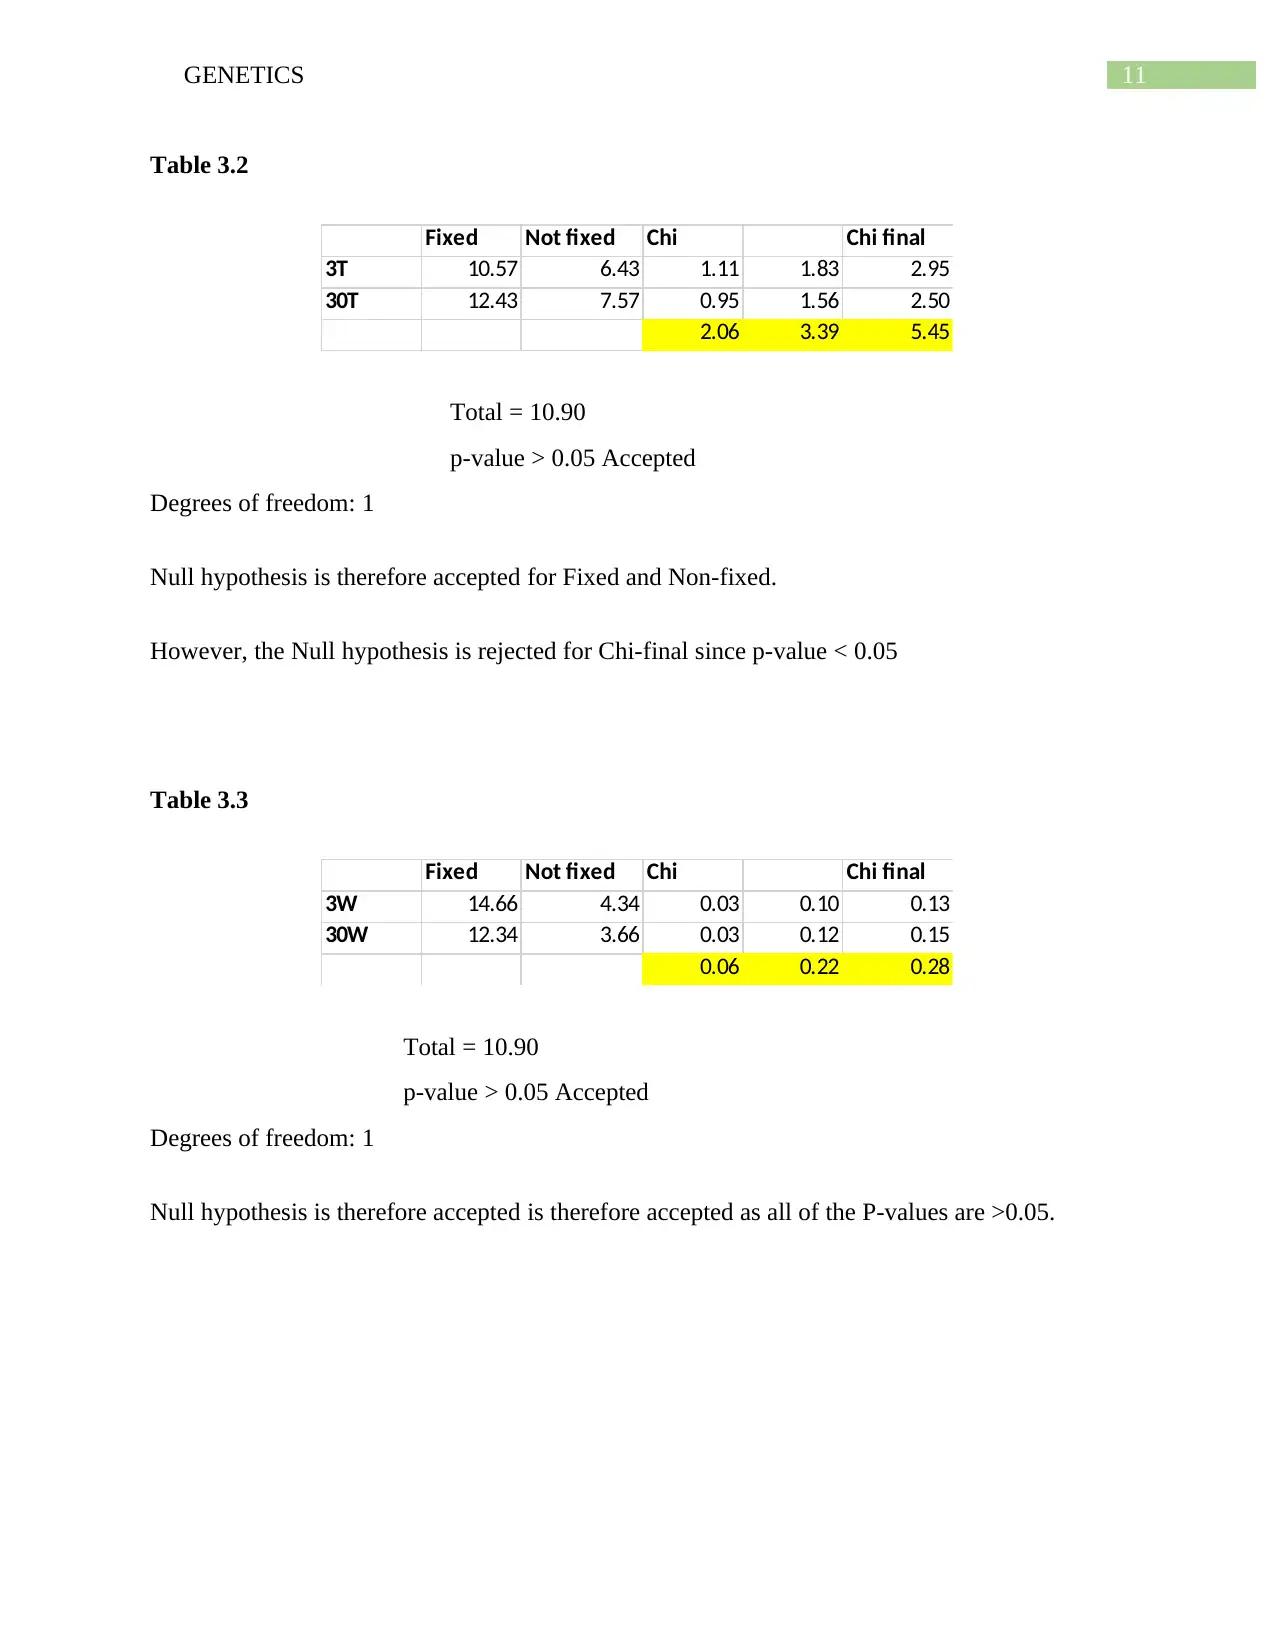
This genetics assignment presents the results and discussion of several experiments. The results section includes multiple tables (1.1-1.3, 2.1-2.4, and 3.1-3.5) analyzing allele frequencies, Chi-square values, and p-values to test various null hypotheses. The experiments investigate the impact of cutting on allele frequency, and the rate of fixation in the growth of nematodes. The analysis involves statistical methods, including Chi-square tests, to determine the acceptance or rejection of null hypotheses. The discussion section interprets the findings, highlighting the statistical significance of the results and drawing conclusions about the genetic experiments.

Running Head: GENETICS
Genetics
Name of the Student
Name of the University
Author Note
Genetics
Name of the Student
Name of the University
Author Note
Paraphrase This Document
Need a fresh take? Get an instant paraphrase of this document with our AI Paraphraser

1GENETICS
Table of Contents
Results..............................................................................................................................................2
Discussion......................................................................................................................................13

2GENETICS
Results
Table 1.1 Tuesday , Cut: Uncut ::1:1
Null Hypothesis: Allele Frequency is the same
Observed Expected
Plate Cut Uncut Total Cut Uncut Chi P A/R
a 0 24 24 12 12 24.00 <0.05 Reject
b 0 19 19 9.5 9.5 19.00 <0.05 Reject
c 0 24 24 12 12 24.00 <0.05 Reject
d 0 15 15 7.5 7.5 15.00 <0.05 Reject
e 0 20 20 10 10 20.00 <0.05 Reject
f 0 21 21 10.5 10.5 21.00 <0.05 Reject
g 0 18 18 9 9 18.00 <0.05 Reject
h 0 23 23 11.5 11.5 23.00 <0.05 Reject
i 0 22 22 11 11 22.00 <0.05 Reject
j 0 22 22 11 11 22.00 <0.05 Reject
k 0 22 22 11 11 22.00 <0.05 Reject
l 0 22 22 11 11 22.00 <0.05 Reject
m 0 16 16 8 8 16.00 <0.05 Reject
n 0 24 24 12 12 24.00 <0.05 Reject
o 8 16 24 12 12 2.67 >0.05 Accept
p 7 15 22 11 11 2.91 >0.05 Accept
q 19 5 24 12 12 8.17 <0.05 Reject
181 305.74
Degrees of freedom- 16 16 16
P-value- 0.000 0.000 0.000
Accepted/Rejected - Reject Reject Reject
⊘ This is a preview!⊘
Do you want full access?
Subscribe today to unlock all pages.

Trusted by 1+ million students worldwide

3GENETICS
Table 1.2 Tuesday, Cut: Uncut ::1:1
Null Hypothesis: Allele Frequency is the same
Observed Expected
Plate Cut Uncut Total Cut Uncut Chi P A/R
r 0 24 24 12 12 24.00 <0.05 Reject
s 0 24 24 12 12 24.00 <0.05 Reject
t 5 19 24 12 12 8.17 <0.05 Reject
u 0 23 23 11.5 11.5 23.00 <0.05 Reject
v 0 21 21 10.5 10.5 21.00 <0.05 Reject
w 0 24 24 12 12 24.00 <0.05 Reject
x 0 24 24 12 12 24.00 <0.05 Reject
y 10 14 24 12 12 0.67 >0.05 Accept
z 17 5 22 11 11 6.55 <0.05 Reject
aa 2 22 24 12 12 16.67 <0.05 Reject
bb 0 24 24 12 12 24.00 <0.05 Reject
cc 1 5 6 3 3 2.67 >0.05 Accept
dd 0 24 24 12 12 24.00 <0.05 Reject
ee 9 8 17 8.5 8.5 0.06 >0.05 Accept
ff 0 19 19 9.5 9.5 19.00 <0.05 Reject
gg 1 21 22 11 11 18.18 <0.05 Reject
hh 11 13 24 12 12 0.17 >0.05 Accept
ii 5 19 24 12 12 8.17 <0.05 Reject
jj 10 14 24 12 12 0.67 >0.05 Accept
kk 15 9 24 12 12 1.50 >0.05 Accept
221.00 270.45 49.45
Degrees of freedom- 19 19 19
P-value- 0.000 0.000 0.000
Accepted/Rejected - Reject Reject Reject
Paraphrase This Document
Need a fresh take? Get an instant paraphrase of this document with our AI Paraphraser

4GENETICS
Table 1.3 Wednesday, Cut: Uncut ::1:9
Null Hypothesis: Allele Frequency is the same
Plate Cut Uncut Total Cut Uncut Chi P A/R
ll 0 21 21 2.1 18.9 2.33 >0.05 Accept
mm 0 22 22 2.2 19.8 2.44 >0.05 Accept
nn 0 23 23 2.3 20.7 2.56 >0.05 Accept
oo 0 16 16 1.6 14.4 1.78 >0.05 Accept
pp 0 22 22 2.2 19.8 2.44 >0.05 Accept
qq 0 23 23 2.3 20.7 2.56 >0.05 Accept
rr 0 24 24 2.4 21.6 2.67 >0.05 Accept
ss 0 20 20 2 18 2.22 >0.05 Accept
tt 0 12 12 1.2 10.8 1.33 >0.05 Accept
uu 1 22 23 2.3 20.7 0.82 >0.05 Accept
vv 0 22 22 2.2 19.8 2.44 >0.05 Accept
ww 0 23 23 2.3 20.7 2.56 >0.05 Accept
xx 0 21 21 2.1 18.9 2.33 >0.05 Accept
yy 0 22 22 2.2 19.8 2.44 >0.05 Accept
zz 0 19 19 1.9 17.1 2.11 >0.05 Accept
a1 2 22 24 2.4 21.6 0.07 >0.05 Accept
a2 1 23 24 2.4 21.6 0.91 >0.05 Accept
a3 4 20 24 2.4 21.6 1.19 >0.05 Accept
a4 1 23 24 2.4 21.6 0.91 >0.05 Accept
368.10 36.11
Degrees of freedom- 18 18
P-value- 0.007 0.000
Accepted/Rejected - Reject Reject

5GENETICS
Table 1.3 Wednesday, Cut: Uncut ::1:9
Null Hypothesis: Allele Frequency is the same
Plate Cut Uncut Total Cut Uncut Chi P A/R
a5 0 24 24 2.4 21.60 2.67 >0.05 Accepte
a6 0 24 24 2.4 21.60 2.67 >0.05 Accepte
a7 0 23 23 2.3 20.70 2.56 >0.05 Accepte
a8 0 18 18 1.8 16.20 2.00 >0.05 Accepte
a9 0 23 23 2.3 20.70 2.56 >0.05 Accepte
a10 0 24 24 2.4 21.60 2.67 >0.05 Accepte
a11 0 22 22 2.2 19.80 2.44 >0.05 Accepte
a12 0 24 24 2.4 21.60 2.67 >0.05 Accepte
a13 0 24 24 2.4 21.60 2.67 >0.05 Accepte
a14 0 24 24 2.4 21.60 2.67 >0.05 Accepte
a15 0 24 24 2.4 21.60 2.67 >0.05 Accepte
a16 10 14 24 2.4 21.60 26.74 <0.05 Reject
a17 0 24 24 2.4 21.60 2.67 >0.05 Accepte
a18 7 17 24 2.4 21.60 9.80 <0.05 Reject
a19 8 16 24 2.4 21.60 14.52 <0.05 Reject
a20 0 24 24 2.4 21.60 2.67 >0.05 Accepte
Total 84.61
Degrees of freedom- 15
P-value- 0.000
Accepted/Rejected - Reject
Thus from the above 4 tables it can be inferred that the Null Hypothesis is rejected.
⊘ This is a preview!⊘
Do you want full access?
Subscribe today to unlock all pages.

Trusted by 1+ million students worldwide

6GENETICS
Chi square 2 ; Null hypothesis- Populations would behave the same
Table 2.1- Tuesday: Cut:Uncut :: 1:1
Expected
Cut Uncut Chi
2.25 21.75 2.25 0.23
1.78 17.22 1.78 0.18
2.25 21.75 2.25 0.23
1.41 13.59 1.41 0.15
1.88 18.12 1.88 0.19
1.97 19.03 1.97 0.20
1.69 16.31 1.69 0.18
2.16 20.84 2.16 0.22
2.07 19.93 2.07 0.21
2.07 19.93 2.07 0.21
2.07 19.93 2.07 0.21
2.07 19.93 2.07 0.21
1.50 14.50 1.50 0.16
2.25 21.75 2.25 0.23
2.25 21.75 14.65 1.52
2.07 19.93 11.78 1.22
2.25 21.75 124.40 12.90
178.26 18.48
Total P-value Cut: 0.000 (Rejected)
Total uncut value: 0.297 (Accepted)
Paraphrase This Document
Need a fresh take? Get an instant paraphrase of this document with our AI Paraphraser

7GENETICS
Table 2.2- Tuesday: Cut:Uncut :: 1:1; 30 individuals
Cut Uncut Chi
4.67 19.33 4.67 1.13
4.67 19.33 4.67 1.13
4.67 19.33 0.02 0.01
4.48 18.52 4.48 1.08
4.09 16.91 4.09 0.99
4.67 19.33 4.67 1.13
4.67 19.33 4.67 1.13
4.67 19.33 6.08 1.47
4.28 17.72 37.80 9.13
4.67 19.33 1.53 0.37
4.67 19.33 4.67 1.13
1.17 4.83 0.02 0.01
4.67 19.33 4.67 1.13
3.31 13.69 9.80 2.37
3.70 15.30 3.70 0.89
4.28 17.72 2.51 0.61
4.67 19.33 8.58 2.07
106.62 25.76
Total P-value Cut: 0.000 (Rejected)
Total uncut value: 0.058 (Accepted)

8GENETICS
Table 2.3- Tuesday: Cut:Uncut :: 1:9; 3 individuals
Expected
Cut Uncut Chi
0.46 20.54 0.46 0.01
0.48 21.52 0.50 0.01
0.51 22.49 0.52 0.01
0.35 15.65 0.36 0.01
0.48 21.52 0.50 0.01
0.51 22.49 0.52 0.01
0.53 23.47 0.54 0.01
0.44 19.56 0.45 0.01
0.26 11.74 0.27 0.01
0.51 22.49 0.49 0.01
0.48 21.52 0.50 0.01
0.51 22.49 0.52 0.01
0.46 20.54 0.47 0.01
0.48 21.52 0.50 0.01
0.42 18.58 0.43 0.01
0.53 23.47 4.19 0.09
0.53 23.47 0.43 0.01
0.53 23.47 23.34 0.51
0.53 23.47 0.43 0.01
35.40 0.78
Total P-value Cut: 0.008 (Rejected)
Total uncut value: 1.000 (Accepted)
⊘ This is a preview!⊘
Do you want full access?
Subscribe today to unlock all pages.

Trusted by 1+ million students worldwide

9GENETICS
Table 2.4- Tuesday: Cut:Uncut :: 1:9; 30 individuals
Cut Uncut Chi
1.60 22.40 1.60 0.11
1.60 22.40 1.60 0.11
1.54 21.46 1.54 0.11
1.20 16.80 1.20 0.09
1.54 21.46 1.54 0.11
1.60 22.40 1.60 0.11
1.47 20.53 1.47 0.11
1.60 22.40 1.60 0.11
1.60 22.40 1.60 0.11
1.60 22.40 1.60 0.11
1.60 22.40 1.60 0.11
1.60 22.40 43.94 3.15
1.60 22.40 1.60 0.11
1.60 22.40 18.15 1.30
1.60 22.40 25.50 1.83
1.60 22.40 1.60 0.11
107.77 7.72
Total P-value Cut: 0.000 (Rejected)
Total uncut value: 0.935 (Accepted)
The null hypothesis for table numbers 2.1 to 2.4 are accepted
Paraphrase This Document
Need a fresh take? Get an instant paraphrase of this document with our AI Paraphraser

10GENETICS
CHI SQUARE 3- Null hypothesis: The rate of fixation in the growth of the nematodes would
be the same
Table 3.1
Fixed Not fixed Chi Chi final
3T 11.81 5.19 0.41 0.93 1.33
30T 13.89 6.11 1.72 3.91 5.63
3W 13.19 5.81 0.05 0.11 0.16
30W 11.11 4.89 0.32 0.73 1.05
2.50 5.68 8.18
Total = 16.36
p-value > 0.05 Accepted
Degrees of freedom: 3
Null hypothesis is therefore accepted for Fixed and Non-fixed.
However, the Null hypothesis is rejected for Chi-final since p-value < 0.05

11GENETICS
Table 3.2
Fixed Not fixed Chi Chi final
3T 10.57 6.43 1.11 1.83 2.95
30T 12.43 7.57 0.95 1.56 2.50
2.06 3.39 5.45
Total = 10.90
p-value > 0.05 Accepted
Degrees of freedom: 1
Null hypothesis is therefore accepted for Fixed and Non-fixed.
However, the Null hypothesis is rejected for Chi-final since p-value < 0.05
Table 3.3
Fixed Not fixed Chi Chi final
3W 14.66 4.34 0.03 0.10 0.13
30W 12.34 3.66 0.03 0.12 0.15
0.06 0.22 0.28
Total = 10.90
p-value > 0.05 Accepted
Degrees of freedom: 1
Null hypothesis is therefore accepted is therefore accepted as all of the P-values are >0.05.
⊘ This is a preview!⊘
Do you want full access?
Subscribe today to unlock all pages.

Trusted by 1+ million students worldwide
1 out of 14
Related Documents

Your All-in-One AI-Powered Toolkit for Academic Success.
 +13062052269
info@desklib.com
Available 24*7 on WhatsApp / Email
Unlock your academic potential
Copyright © 2020–2025 A2Z Services. All Rights Reserved. Developed and managed by ZUCOL.