Ask a question from expert
GEO 561 Multivariate Analytical Techniques Assignment
5 Pages1129 Words576 Views
Multivariate Analytical Techniques (GEO 561)
Added on 2019-09-19
GEO 561 Multivariate Analytical Techniques Assignment
Multivariate Analytical Techniques (GEO 561)
Added on 2019-09-19
BookmarkShareRelated Documents
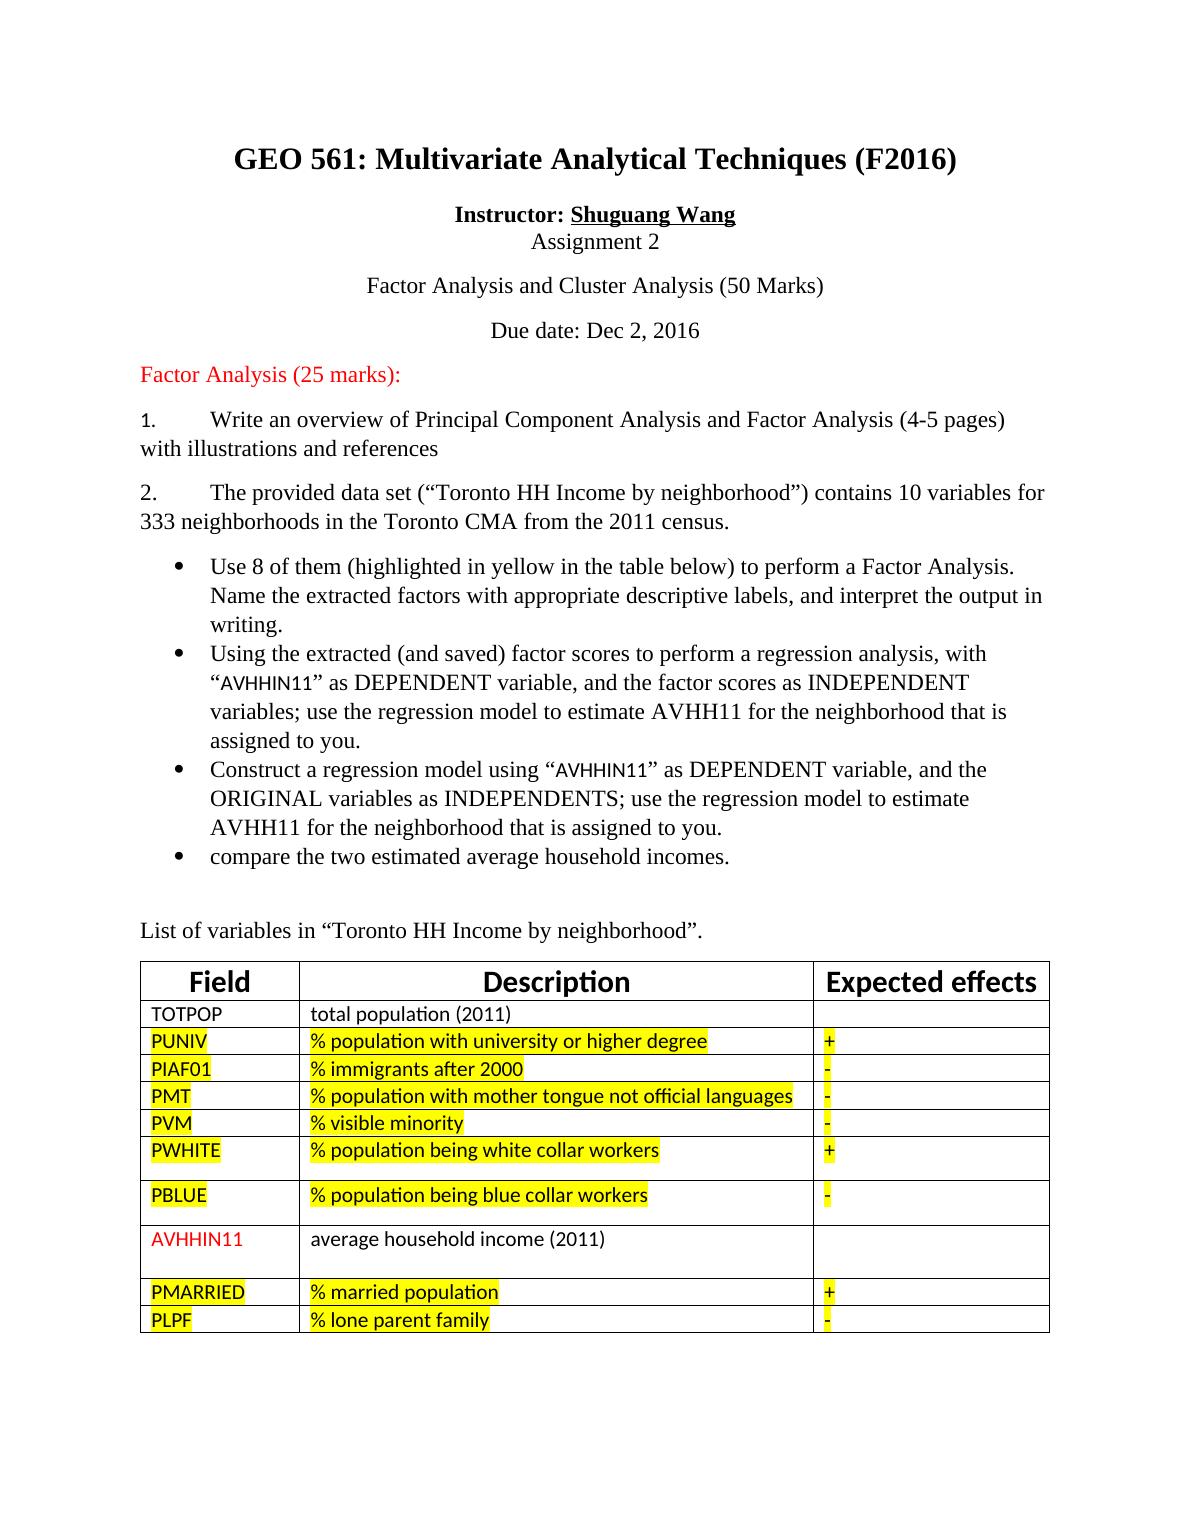
GEO 561: Multivariate Analytical Techniques(F2016)Instructor: Shuguang WangAssignment 2 Factor Analysis and Cluster Analysis (50 Marks)Due date: Dec 2, 2016 Factor Analysis (25 marks):1.Write an overview of Principal Component Analysis and Factor Analysis (4-5 pages) with illustrations and references2.The provided data set (“Toronto HH Income by neighborhood”) contains 10 variables for333 neighborhoods in the Toronto CMA from the 2011 census. Use 8 of them (highlighted in yellow in the table below) to perform a Factor Analysis. Name the extracted factors with appropriate descriptive labels, and interpret the output in writing. Using the extracted (and saved) factor scores to perform a regression analysis, with “AVHHIN11” as DEPENDENT variable, and the factor scores as INDEPENDENT variables; use the regression model to estimate AVHH11 for the neighborhood that is assigned to you. Construct a regression model using “AVHHIN11” as DEPENDENT variable, and the ORIGINAL variables as INDEPENDENTS; use the regression model to estimate AVHH11 for the neighborhood that is assigned to you. compare the two estimated average household incomes.List of variables in “Toronto HH Income by neighborhood”.FieldDescriptionExpected effectsTOTPOPtotal population (2011)PUNIV% population with university or higher degree+PIAF01% immigrants after 2000-PMT% population with mother tongue not official languages-PVM% visible minority-PWHITE% population being white collar workers+PBLUE% population being blue collar workers-AVHHIN11average household income (2011)PMARRIED% married population+PLPF% lone parent family-
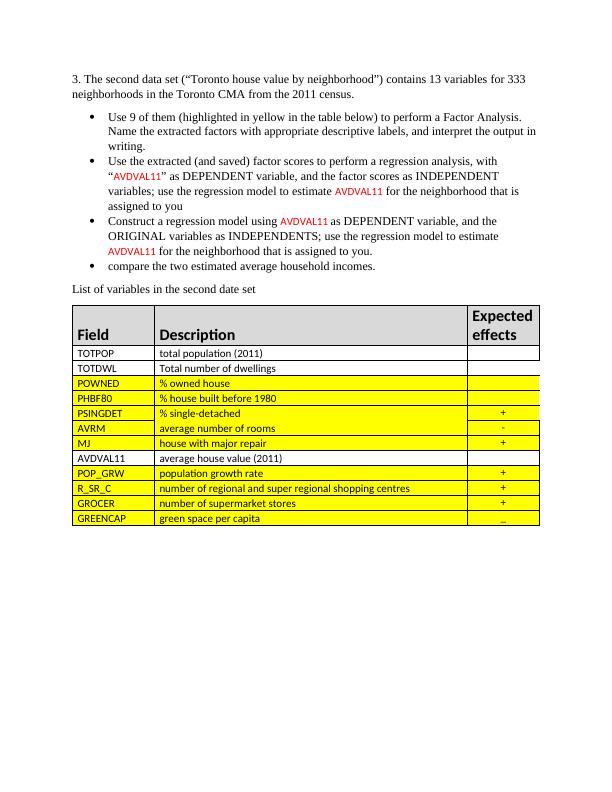
3. The second data set (“Toronto house value by neighborhood”) contains 13 variables for 333 neighborhoods in the Toronto CMA from the 2011 census. Use 9 of them (highlighted in yellow in the table below) to perform a Factor Analysis. Name the extracted factors with appropriate descriptive labels, and interpret the output in writing. Use the extracted (and saved) factor scores to perform a regression analysis, with “AVDVAL11” as DEPENDENT variable, and the factor scores as INDEPENDENT variables; use the regression model to estimate AVDVAL11 for the neighborhood that is assigned to youConstruct a regression model using AVDVAL11 as DEPENDENT variable, and the ORIGINAL variables as INDEPENDENTS; use the regression model to estimate AVDVAL11 for the neighborhood that is assigned to you. compare the two estimated average household incomes.List of variables in the second date set FieldDescriptionExpectedeffectsTOTPOPtotal population (2011)TOTDWLTotal number of dwellingsPOWNED% owned housePHBF80% house built before 1980PSINGDET% single-detached +AVRMaverage number of rooms-MJhouse with major repair+AVDVAL11average house value (2011)POP_GRWpopulation growth rate+R_SR_Cnumber of regional and super regional shopping centres+GROCERnumber of supermarket stores+GREENCAPgreen space per capita_
End of preview
Want to access all the pages? Upload your documents or become a member.