Glucose Assay Laboratory Report - Biology, Semester 1
VerifiedAdded on 2022/08/24
|13
|1639
|28
Report
AI Summary
This laboratory report details a glucose assay experiment, focusing on the detection and analysis of glucose levels. The experiment utilizes both DNS (dinitrosalicylic acid) and GOD (Glucose Oxygen Demand) assays to determine glucose concentration in a honey sample. The report outlines the materials, methods, and results, including the preparation of standard solutions and the use of spectrophotometry for data collection. Results are presented through tables and graphs, including standard and experimental curves. The discussion section analyzes the findings, compares the results obtained from both assays, and relates them to existing literature on glucose analysis and its clinical relevance, particularly in the context of diabetes diagnosis. The report concludes by summarizing the study's findings and their implications.
Running head: GLUCOSE ASSAY
LABORATORY REPORT ON GLUCOSE ASSAY
Name of the Student
Name of the University
Author Note
LABORATORY REPORT ON GLUCOSE ASSAY
Name of the Student
Name of the University
Author Note
Paraphrase This Document
Need a fresh take? Get an instant paraphrase of this document with our AI Paraphraser
1GLUCOSE ASSAY
Table of Contents
Introduction........................................................................................................................2
Materials Required.............................................................................................................2
Method...............................................................................................................................3
Analysis of data.................................................................................................................6
Results...............................................................................................................................6
GOD Test.......................................................................................................................6
DNS Test........................................................................................................................8
Graphical analysis.........................................................................................................9
Discussion........................................................................................................................10
References.......................................................................................................................11
2GLUCOSE ASSAY
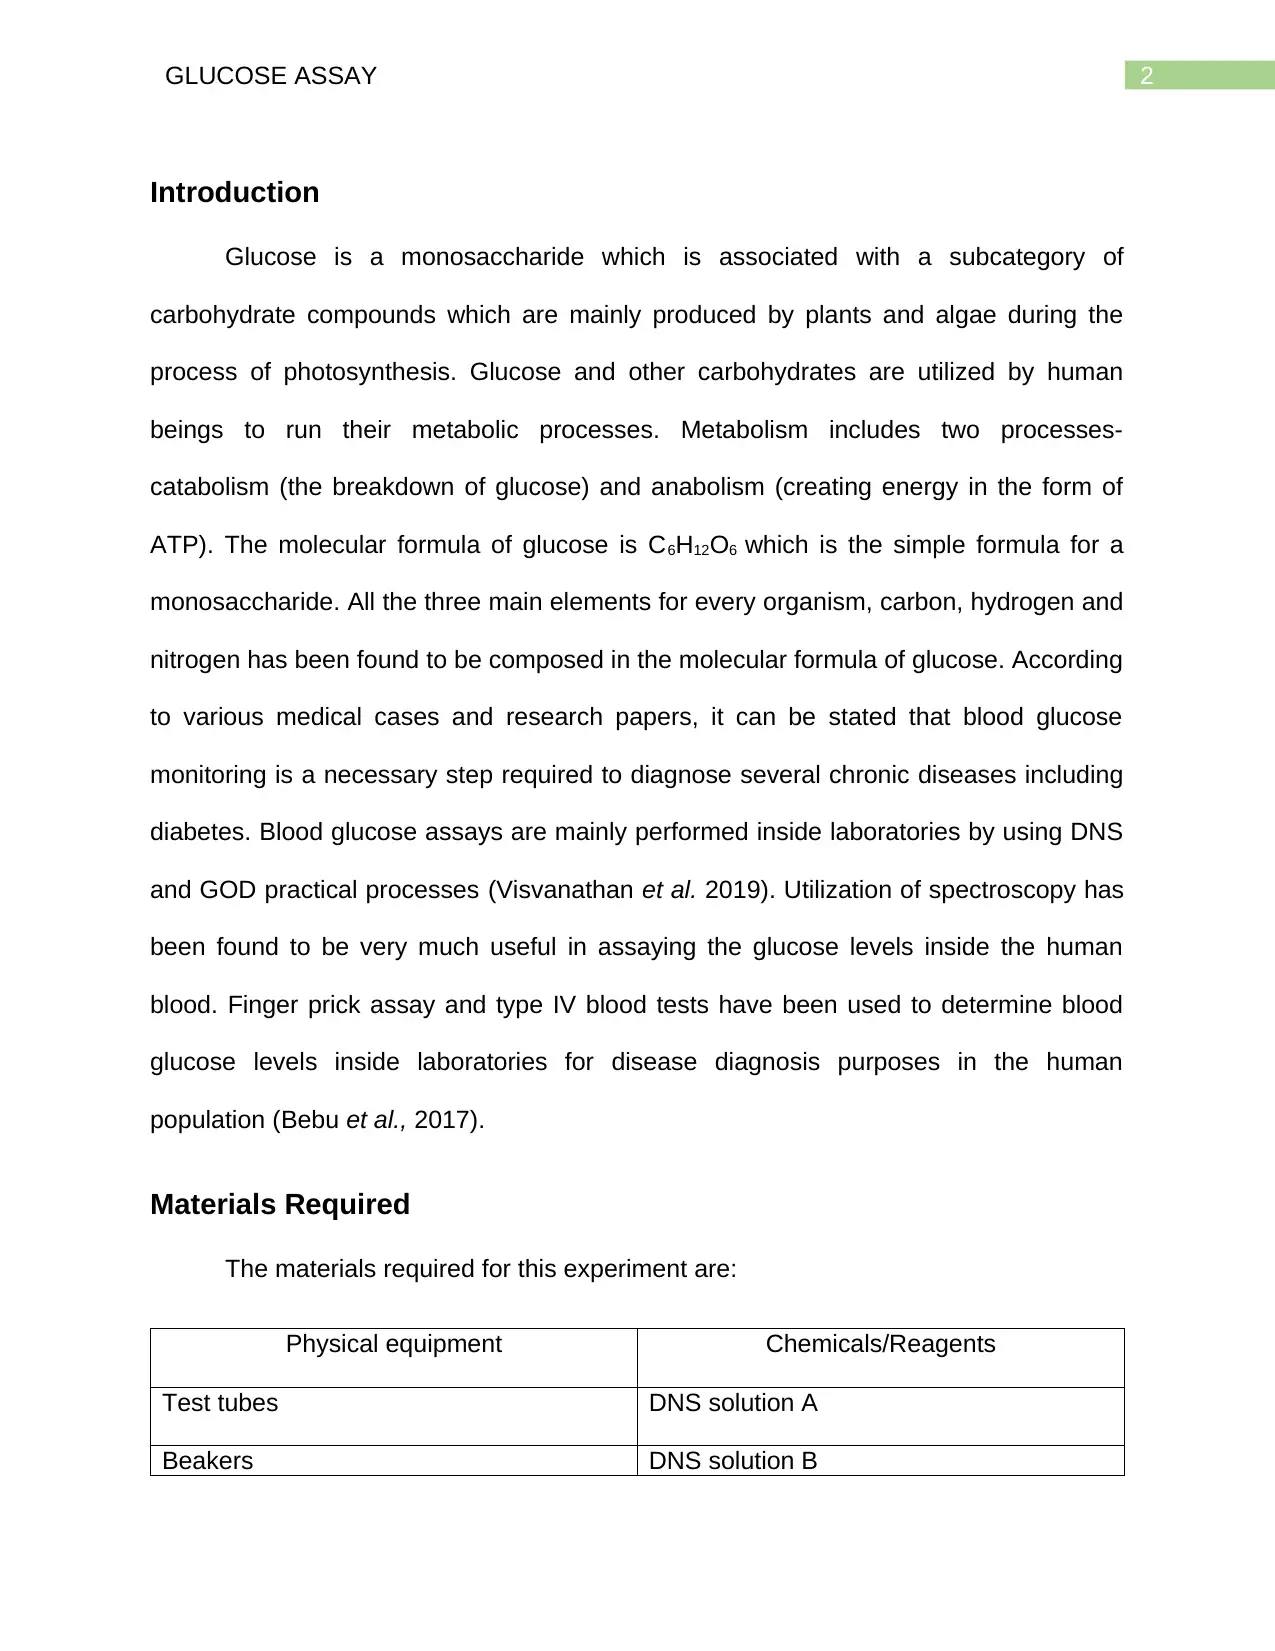
Introduction
Glucose is a monosaccharide which is associated with a subcategory of
carbohydrate compounds which are mainly produced by plants and algae during the
process of photosynthesis. Glucose and other carbohydrates are utilized by human
beings to run their metabolic processes. Metabolism includes two processes-
catabolism (the breakdown of glucose) and anabolism (creating energy in the form of
ATP). The molecular formula of glucose is C6H12O6 which is the simple formula for a
monosaccharide. All the three main elements for every organism, carbon, hydrogen and
nitrogen has been found to be composed in the molecular formula of glucose. According
to various medical cases and research papers, it can be stated that blood glucose
monitoring is a necessary step required to diagnose several chronic diseases including
diabetes. Blood glucose assays are mainly performed inside laboratories by using DNS
and GOD practical processes (Visvanathan et al. 2019). Utilization of spectroscopy has
been found to be very much useful in assaying the glucose levels inside the human
blood. Finger prick assay and type IV blood tests have been used to determine blood
glucose levels inside laboratories for disease diagnosis purposes in the human
population (Bebu et al., 2017).
Materials Required
The materials required for this experiment are:
Physical equipment Chemicals/Reagents
Test tubes DNS solution A
Beakers DNS solution B
⊘ This is a preview!⊘
Do you want full access?
Subscribe today to unlock all pages.
Trusted by 1+ million students worldwide
3GLUCOSE ASSAY
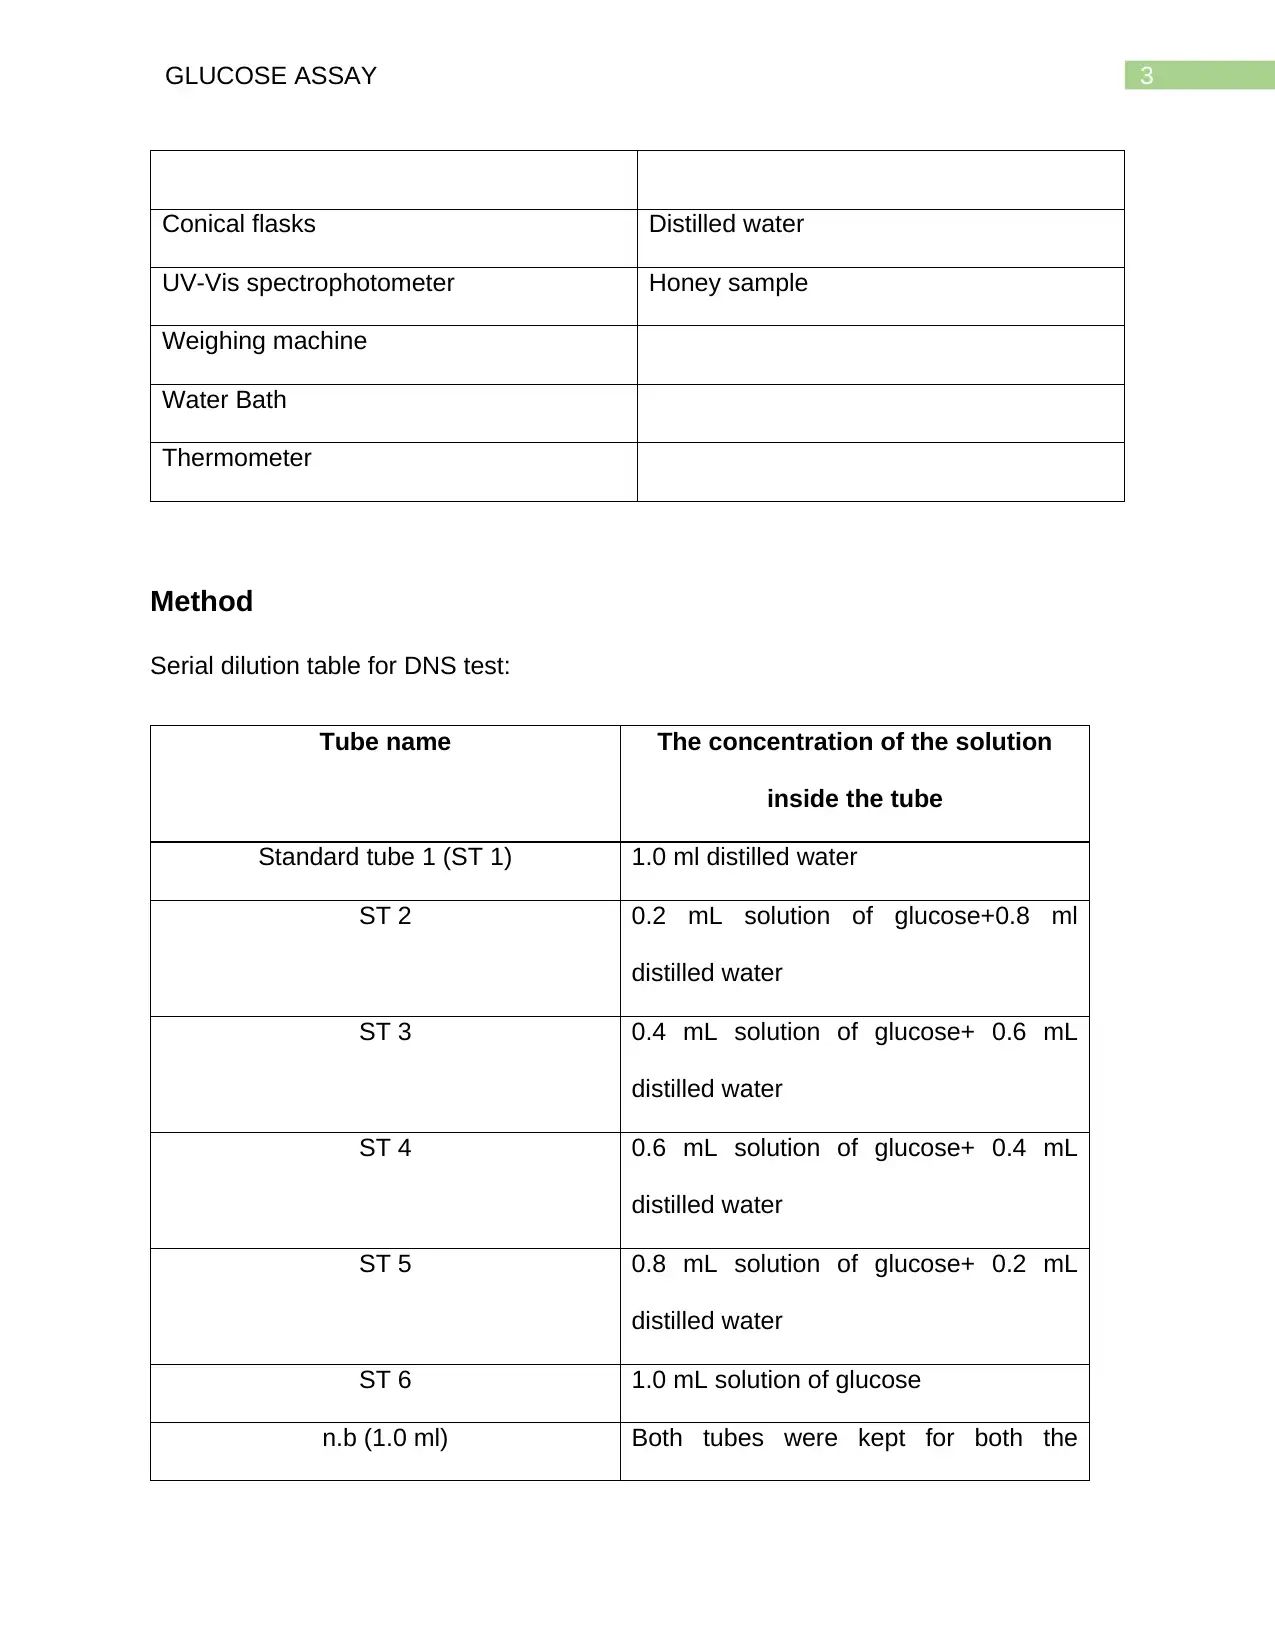
Conical flasks Distilled water
UV-Vis spectrophotometer Honey sample
Weighing machine
Water Bath
Thermometer
Method
Serial dilution table for DNS test:
Tube name The concentration of the solution
inside the tube
Standard tube 1 (ST 1) 1.0 ml distilled water
ST 2 0.2 mL solution of glucose+0.8 ml
distilled water
ST 3 0.4 mL solution of glucose+ 0.6 mL
distilled water
ST 4 0.6 mL solution of glucose+ 0.4 mL
distilled water
ST 5 0.8 mL solution of glucose+ 0.2 mL
distilled water
ST 6 1.0 mL solution of glucose
n.b (1.0 ml) Both tubes were kept for both the
Paraphrase This Document
Need a fresh take? Get an instant paraphrase of this document with our AI Paraphraser
4GLUCOSE ASSAY
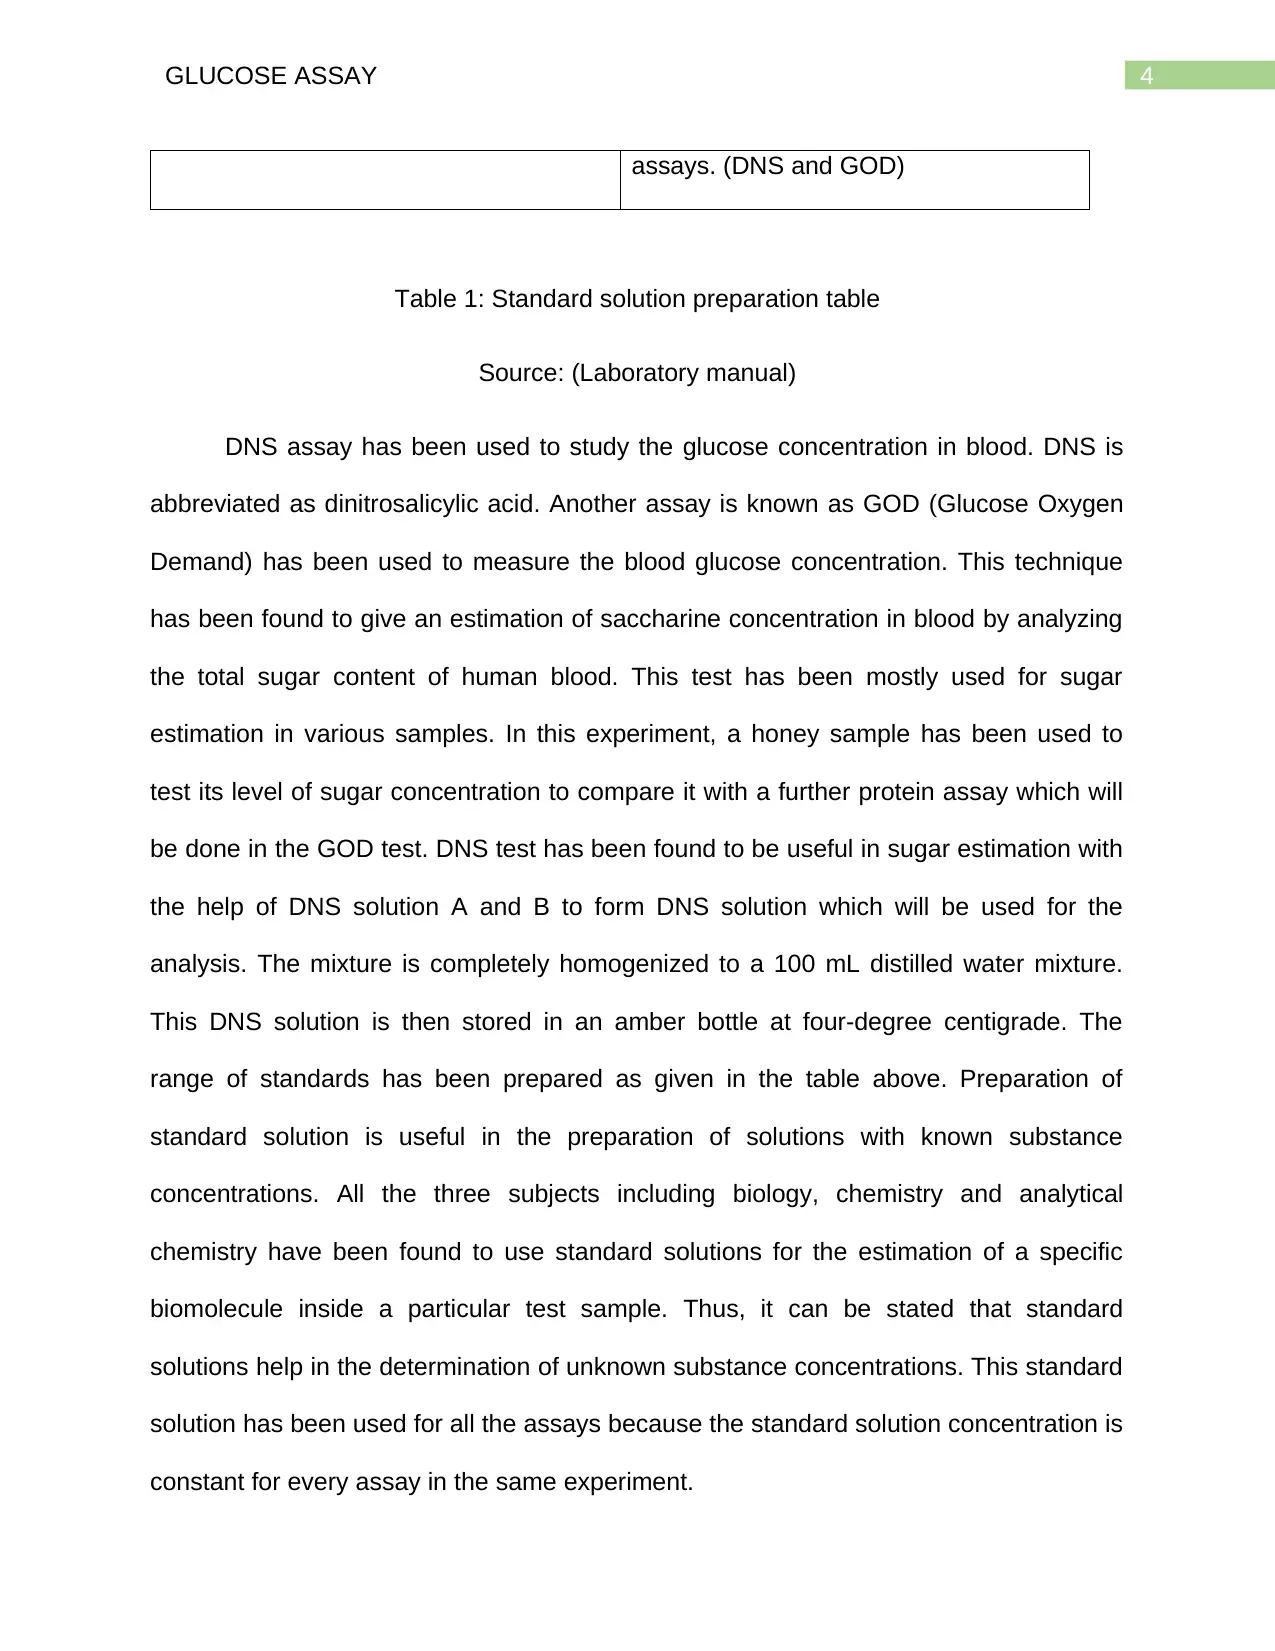
assays. (DNS and GOD)
Table 1: Standard solution preparation table
Source: (Laboratory manual)
DNS assay has been used to study the glucose concentration in blood. DNS is
abbreviated as dinitrosalicylic acid. Another assay is known as GOD (Glucose Oxygen
Demand) has been used to measure the blood glucose concentration. This technique
has been found to give an estimation of saccharine concentration in blood by analyzing
the total sugar content of human blood. This test has been mostly used for sugar
estimation in various samples. In this experiment, a honey sample has been used to
test its level of sugar concentration to compare it with a further protein assay which will
be done in the GOD test. DNS test has been found to be useful in sugar estimation with
the help of DNS solution A and B to form DNS solution which will be used for the
analysis. The mixture is completely homogenized to a 100 mL distilled water mixture.
This DNS solution is then stored in an amber bottle at four-degree centigrade. The
range of standards has been prepared as given in the table above. Preparation of
standard solution is useful in the preparation of solutions with known substance
concentrations. All the three subjects including biology, chemistry and analytical
chemistry have been found to use standard solutions for the estimation of a specific
biomolecule inside a particular test sample. Thus, it can be stated that standard
solutions help in the determination of unknown substance concentrations. This standard
solution has been used for all the assays because the standard solution concentration is
constant for every assay in the same experiment.
5GLUCOSE ASSAY
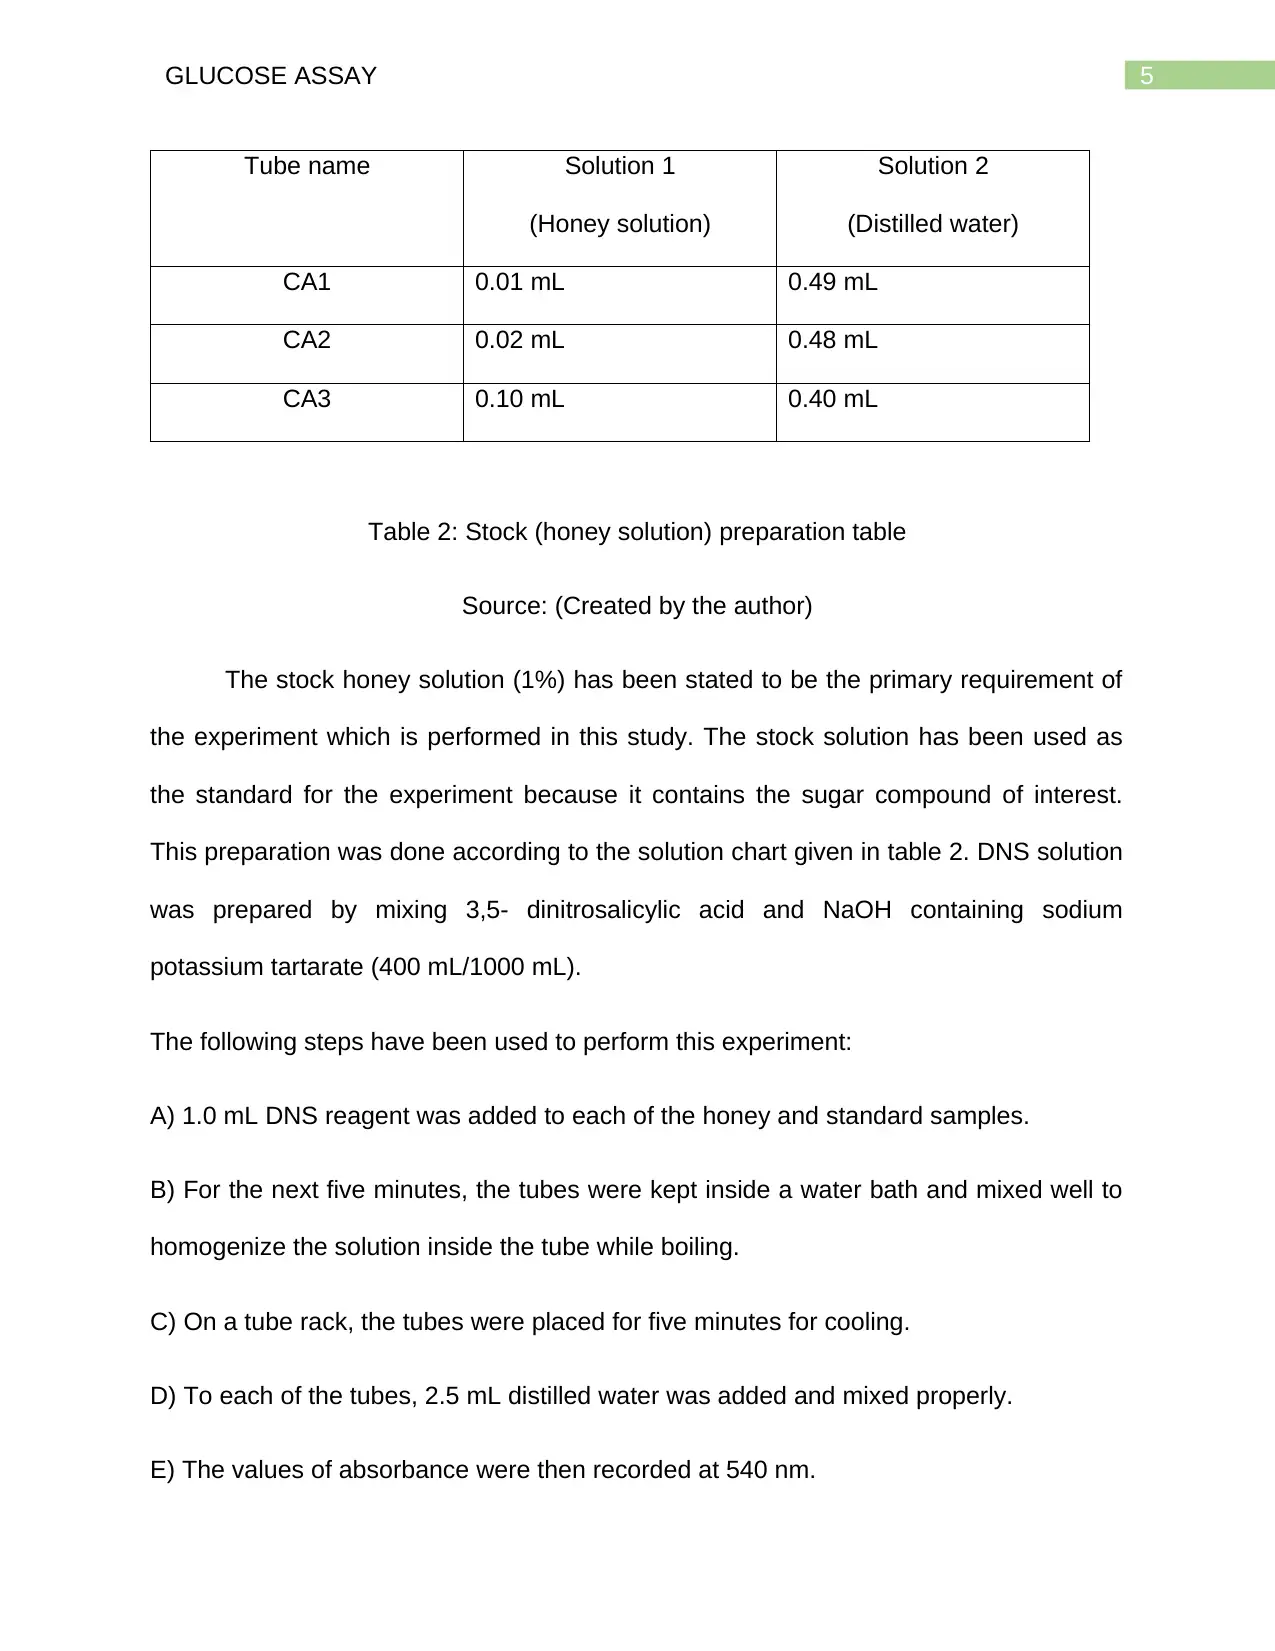
Tube name Solution 1
(Honey solution)
Solution 2
(Distilled water)
CA1 0.01 mL 0.49 mL
CA2 0.02 mL 0.48 mL
CA3 0.10 mL 0.40 mL
Table 2: Stock (honey solution) preparation table
Source: (Created by the author)
The stock honey solution (1%) has been stated to be the primary requirement of
the experiment which is performed in this study. The stock solution has been used as
the standard for the experiment because it contains the sugar compound of interest.
This preparation was done according to the solution chart given in table 2. DNS solution
was prepared by mixing 3,5- dinitrosalicylic acid and NaOH containing sodium
potassium tartarate (400 mL/1000 mL).
The following steps have been used to perform this experiment:
A) 1.0 mL DNS reagent was added to each of the honey and standard samples.
B) For the next five minutes, the tubes were kept inside a water bath and mixed well to
homogenize the solution inside the tube while boiling.
C) On a tube rack, the tubes were placed for five minutes for cooling.
D) To each of the tubes, 2.5 mL distilled water was added and mixed properly.
E) The values of absorbance were then recorded at 540 nm.
⊘ This is a preview!⊘
Do you want full access?
Subscribe today to unlock all pages.
Trusted by 1+ million students worldwide
6GLUCOSE ASSAY
The next test of the GOD test was also performed according to the general
procedure which is used to estimate the amount of enzyme activity to estimate the
blood glucose concentration.
Analysis of data
To analyse the data, a calibration curve is plotted and the readings from all the
standards are used for the calculation of glucose content present inside the original
honey sample.
Results
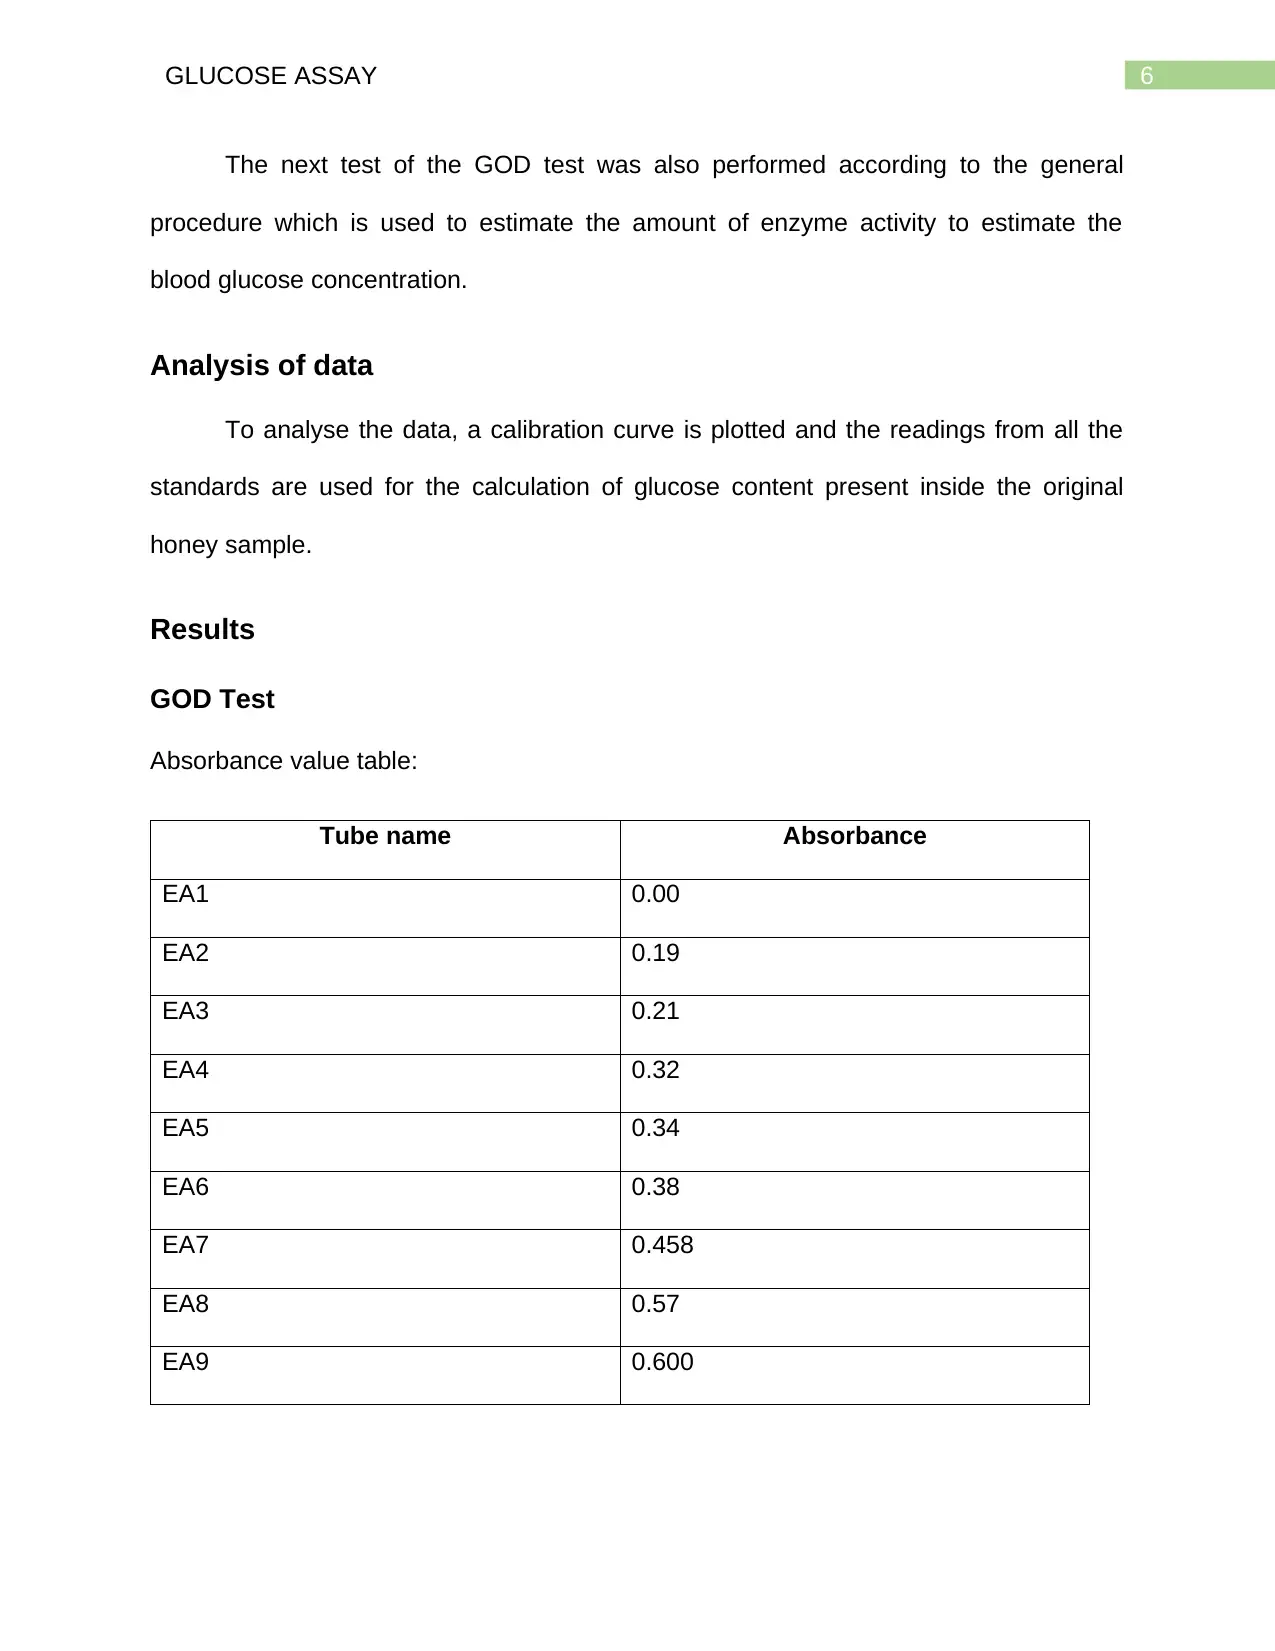
GOD Test
Absorbance value table:
Tube name Absorbance
EA1 0.00
EA2 0.19
EA3 0.21
EA4 0.32
EA5 0.34
EA6 0.38
EA7 0.458
EA8 0.57
EA9 0.600
The next test of the GOD test was also performed according to the general
procedure which is used to estimate the amount of enzyme activity to estimate the
blood glucose concentration.
Analysis of data
To analyse the data, a calibration curve is plotted and the readings from all the
standards are used for the calculation of glucose content present inside the original
honey sample.
Results
GOD Test
Absorbance value table:
Tube name Absorbance
EA1 0.00
EA2 0.19
EA3 0.21
EA4 0.32
EA5 0.34
EA6 0.38
EA7 0.458
EA8 0.57
EA9 0.600
Paraphrase This Document
Need a fresh take? Get an instant paraphrase of this document with our AI Paraphraser
7GLUCOSE ASSAY
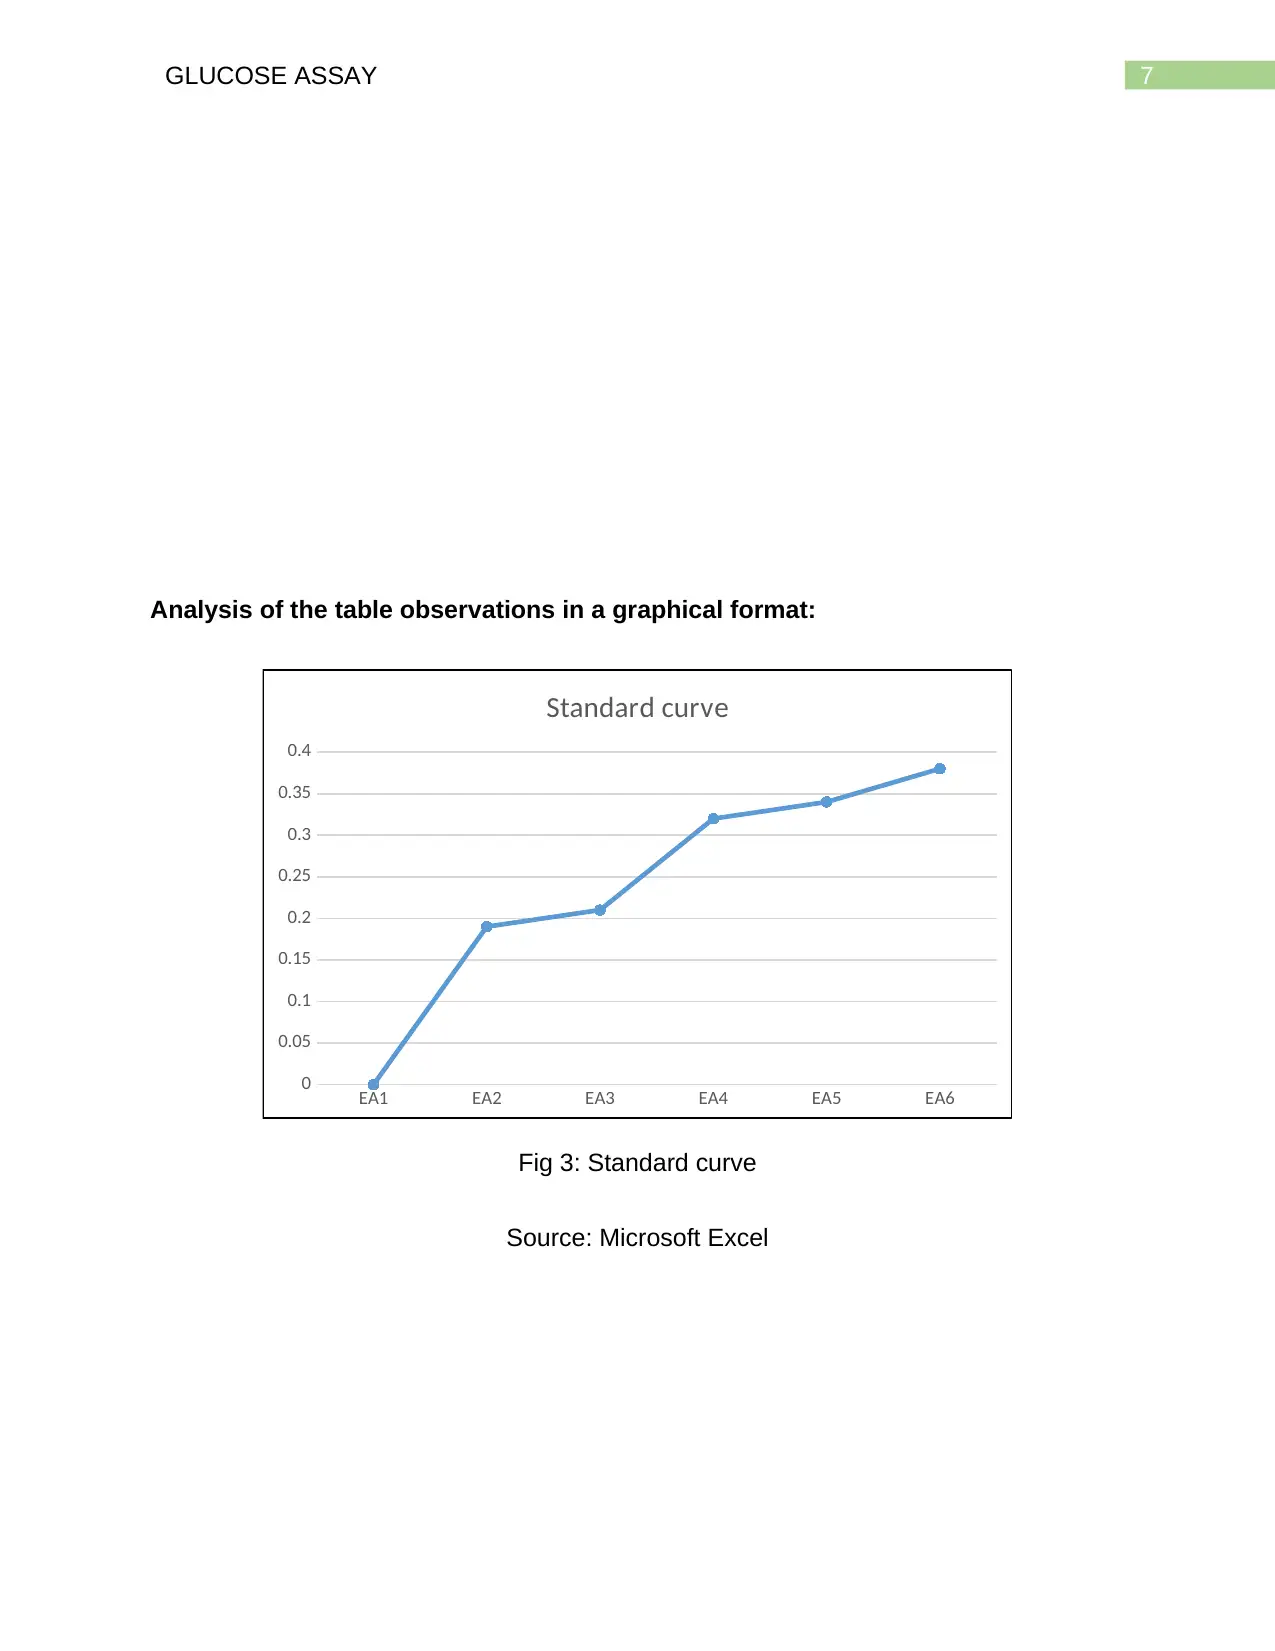
Analysis of the table observations in a graphical format:
EA1 EA2 EA3 EA4 EA5 EA6
0
0.05
0.1
0.15
0.2
0.25
0.3
0.35
0.4
Standard curve
Fig 3: Standard curve
Source: Microsoft Excel
Analysis of the table observations in a graphical format:
EA1 EA2 EA3 EA4 EA5 EA6
0
0.05
0.1
0.15
0.2
0.25
0.3
0.35
0.4
Standard curve
Fig 3: Standard curve
Source: Microsoft Excel
8GLUCOSE ASSAY
EA1 EA2 EA3 EA4 EA5 EA6 EA7 EA8 EA9
0
0.1
0.2
0.3
0.4
0.5
0.6
0.7
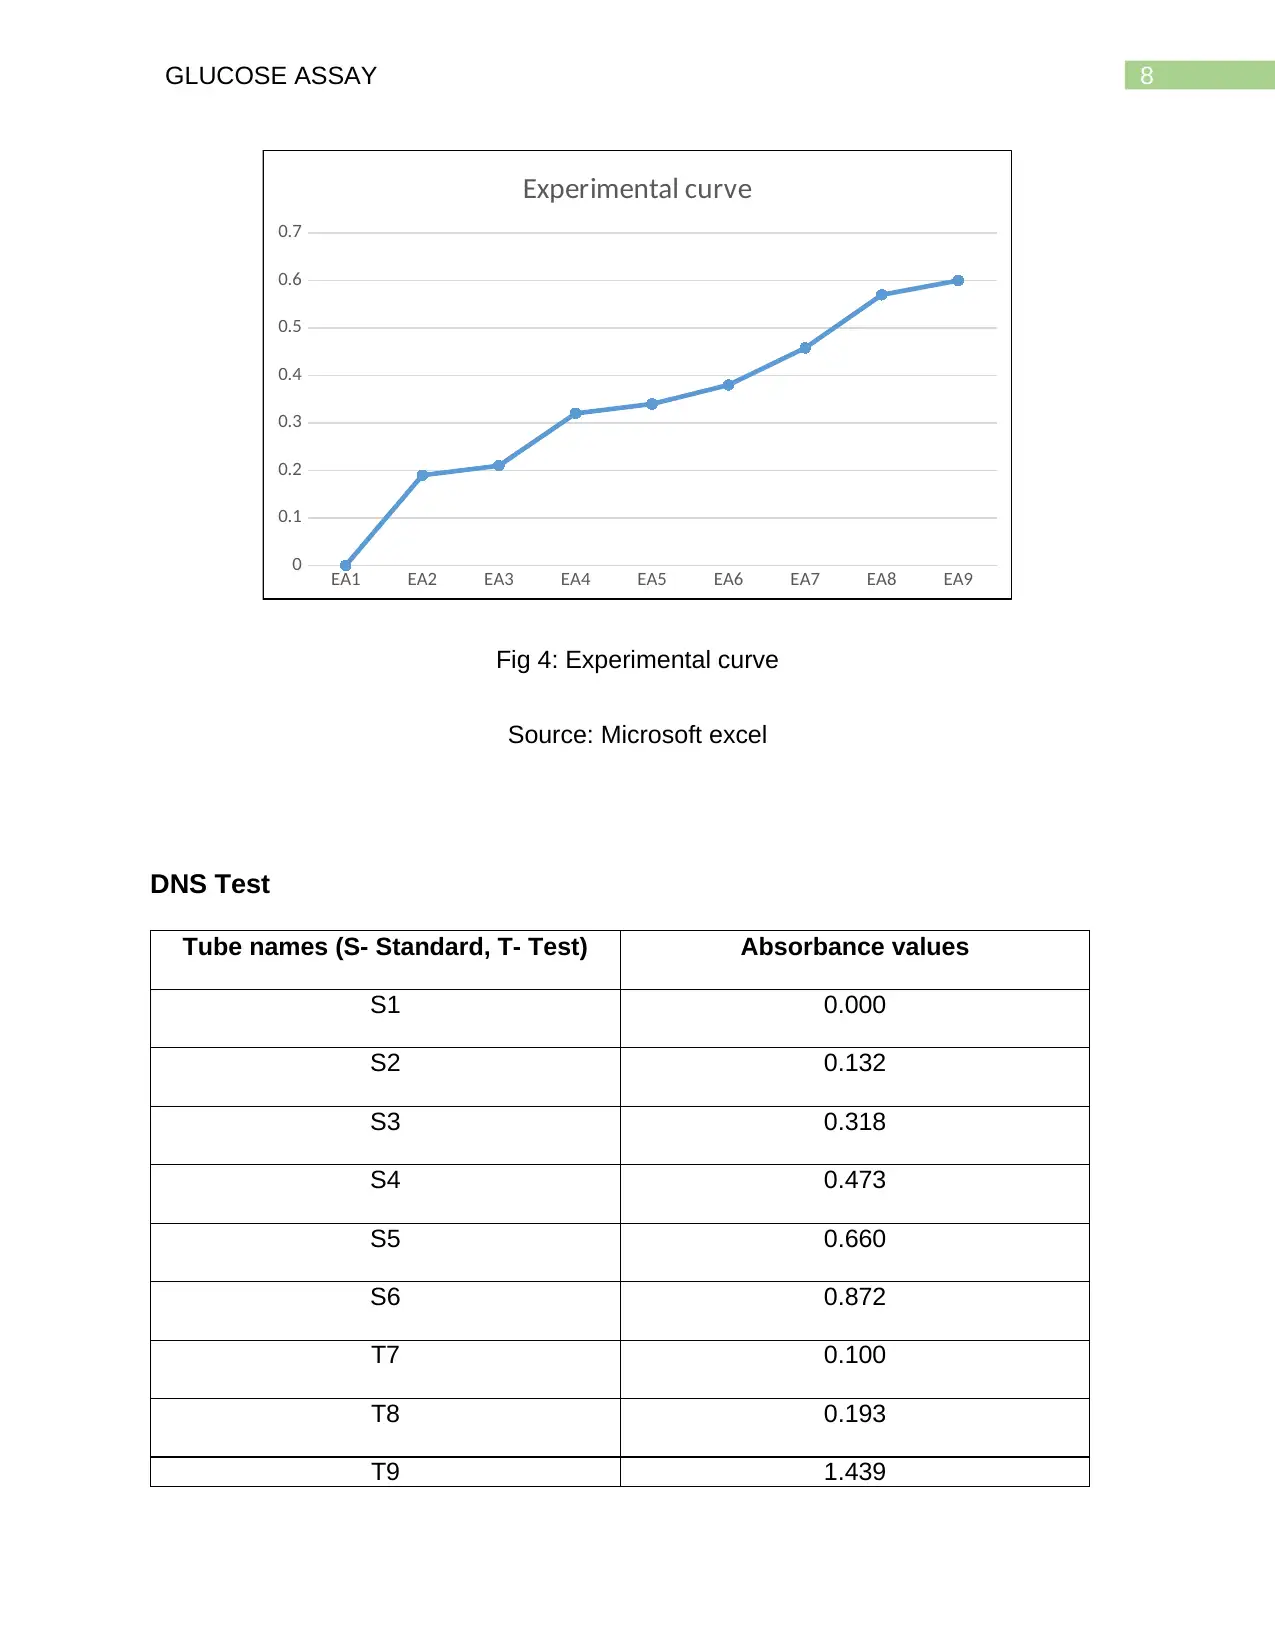
Experimental curve
Fig 4: Experimental curve
Source: Microsoft excel
DNS Test
Tube names (S- Standard, T- Test) Absorbance values
S1 0.000
S2 0.132
S3 0.318
S4 0.473
S5 0.660
S6 0.872
T7 0.100
T8 0.193
T9 1.439
EA1 EA2 EA3 EA4 EA5 EA6 EA7 EA8 EA9
0
0.1
0.2
0.3
0.4
0.5
0.6
0.7
Experimental curve
Fig 4: Experimental curve
Source: Microsoft excel
DNS Test
Tube names (S- Standard, T- Test) Absorbance values
S1 0.000
S2 0.132
S3 0.318
S4 0.473
S5 0.660
S6 0.872
T7 0.100
T8 0.193
T9 1.439
⊘ This is a preview!⊘
Do you want full access?
Subscribe today to unlock all pages.
Trusted by 1+ million students worldwide
9GLUCOSE ASSAY
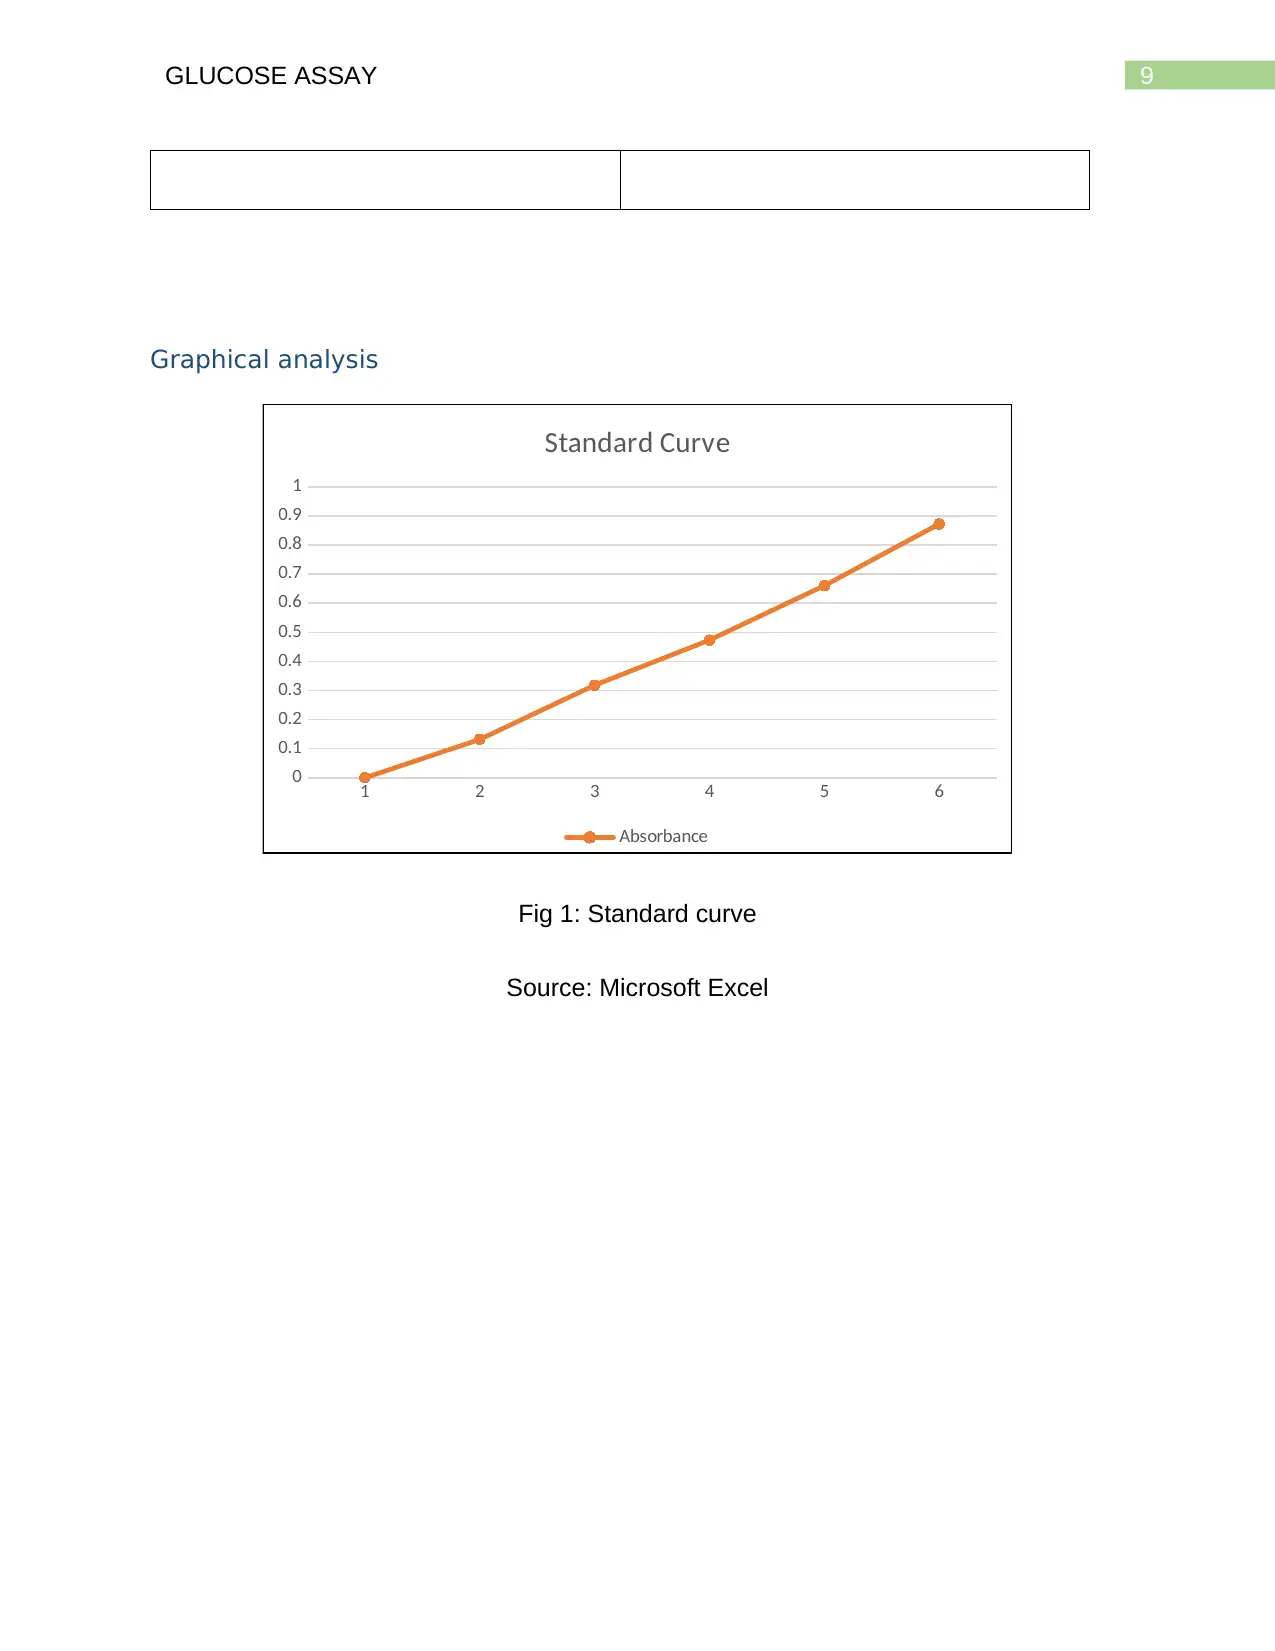
Graphical analysis
1 2 3 4 5 6
0
0.1
0.2
0.3
0.4
0.5
0.6
0.7
0.8
0.9
1
Standard Curve
Absorbance
Fig 1: Standard curve
Source: Microsoft Excel
Graphical analysis
1 2 3 4 5 6
0
0.1
0.2
0.3
0.4
0.5
0.6
0.7
0.8
0.9
1
Standard Curve
Absorbance
Fig 1: Standard curve
Source: Microsoft Excel
Paraphrase This Document
Need a fresh take? Get an instant paraphrase of this document with our AI Paraphraser
10GLUCOSE ASSAY
1 2 3 4 5 6
0
0.1
0.2
0.3
0.4
0.5
0.6
0.7
0.8
0.9
1
0
0.132
0.318
0.473
0.66
0.872
Experimental graph
Absorbance
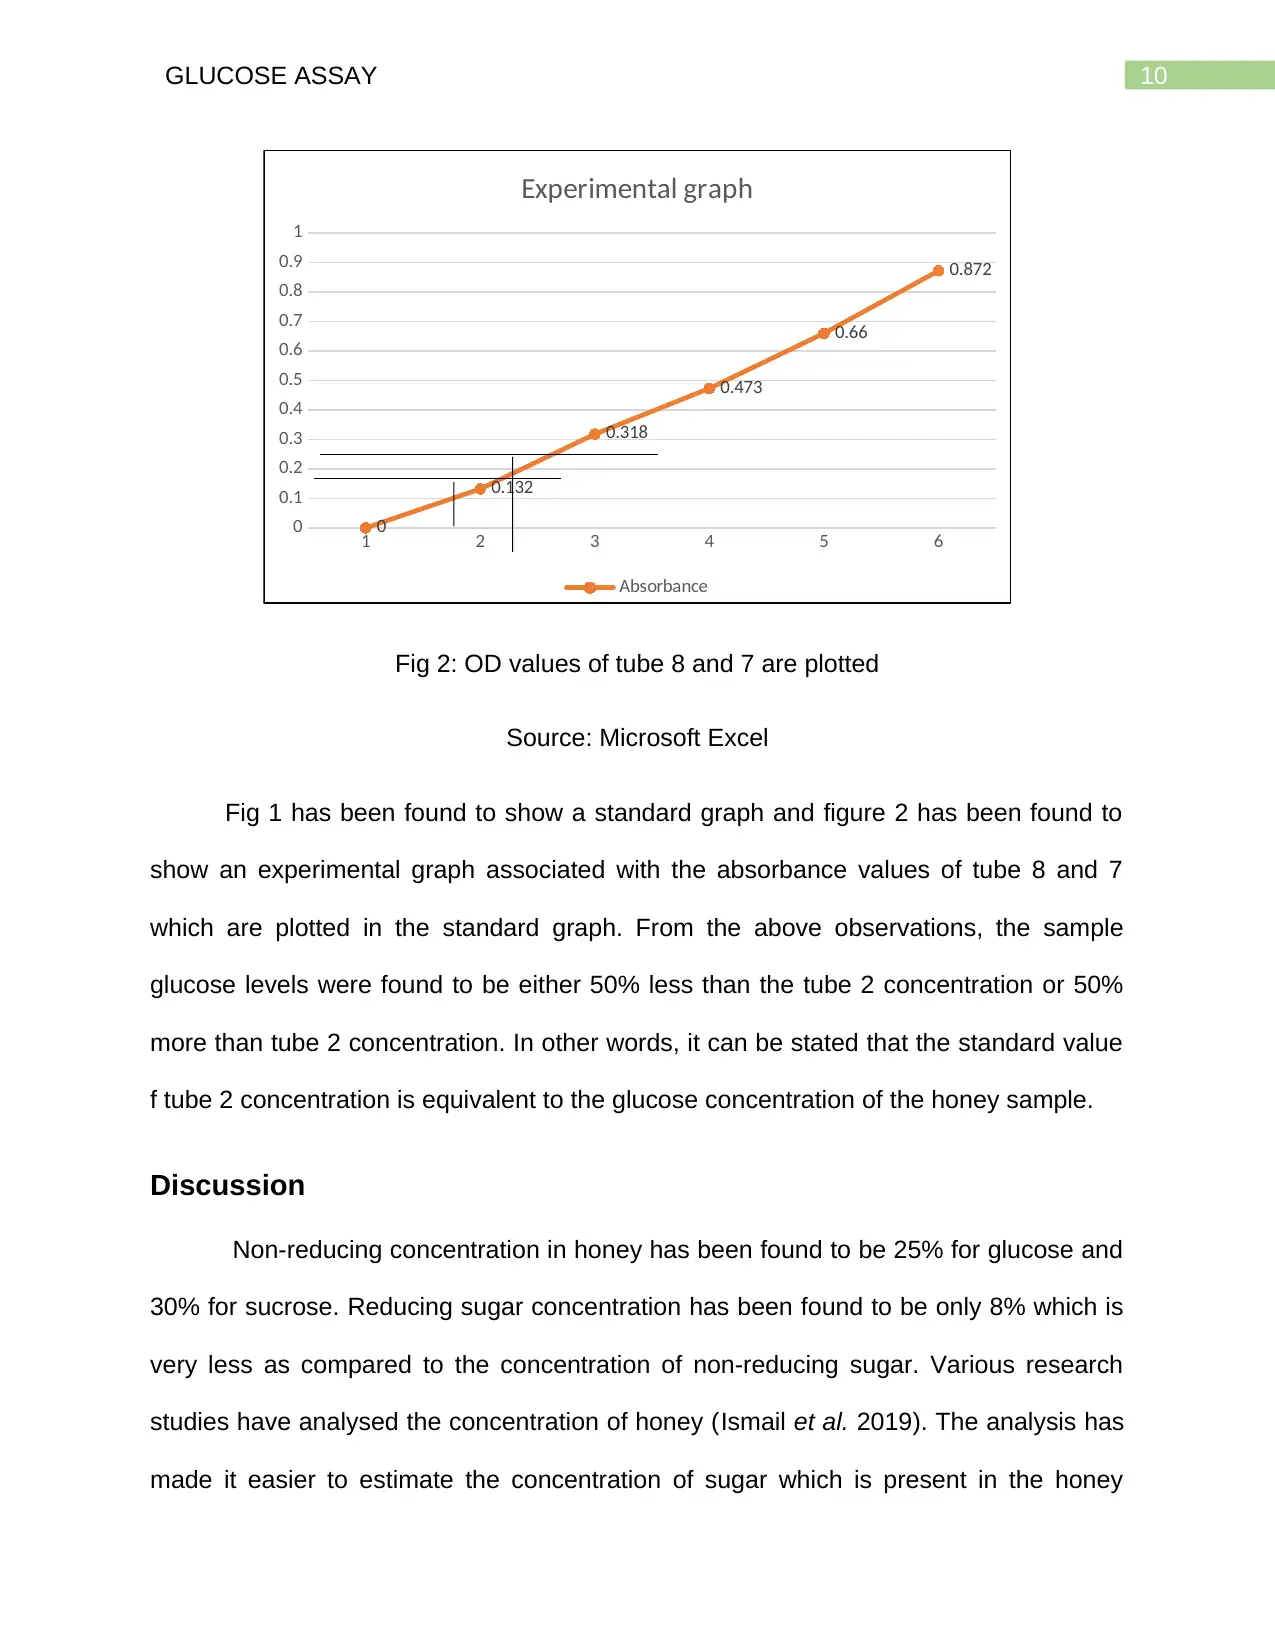
Fig 2: OD values of tube 8 and 7 are plotted
Source: Microsoft Excel
Fig 1 has been found to show a standard graph and figure 2 has been found to
show an experimental graph associated with the absorbance values of tube 8 and 7
which are plotted in the standard graph. From the above observations, the sample
glucose levels were found to be either 50% less than the tube 2 concentration or 50%
more than tube 2 concentration. In other words, it can be stated that the standard value
f tube 2 concentration is equivalent to the glucose concentration of the honey sample.
Discussion
Non-reducing concentration in honey has been found to be 25% for glucose and
30% for sucrose. Reducing sugar concentration has been found to be only 8% which is
very less as compared to the concentration of non-reducing sugar. Various research
studies have analysed the concentration of honey (Ismail et al. 2019). The analysis has
made it easier to estimate the concentration of sugar which is present in the honey
1 2 3 4 5 6
0
0.1
0.2
0.3
0.4
0.5
0.6
0.7
0.8
0.9
1
0
0.132
0.318
0.473
0.66
0.872
Experimental graph
Absorbance
Fig 2: OD values of tube 8 and 7 are plotted
Source: Microsoft Excel
Fig 1 has been found to show a standard graph and figure 2 has been found to
show an experimental graph associated with the absorbance values of tube 8 and 7
which are plotted in the standard graph. From the above observations, the sample
glucose levels were found to be either 50% less than the tube 2 concentration or 50%
more than tube 2 concentration. In other words, it can be stated that the standard value
f tube 2 concentration is equivalent to the glucose concentration of the honey sample.
Discussion
Non-reducing concentration in honey has been found to be 25% for glucose and
30% for sucrose. Reducing sugar concentration has been found to be only 8% which is
very less as compared to the concentration of non-reducing sugar. Various research
studies have analysed the concentration of honey (Ismail et al. 2019). The analysis has
made it easier to estimate the concentration of sugar which is present in the honey
11GLUCOSE ASSAY
which is consumed by the human population. GOD assay has been used for the same
purpose which the DNS assay is used for (Cui et al. 2017). Both the assays gave nearly
similar results, however, the first result can be stated to be accurate because enzyme
activities can vary which can alter the results also. Measurement of blood glucose
concentrations has been used by various research studies to diagnose the presence of
a particular disease (Zohourtalab and Razmi 2018).
⊘ This is a preview!⊘
Do you want full access?
Subscribe today to unlock all pages.
Trusted by 1+ million students worldwide
12GLUCOSE ASSAY
References
Bebu, I., Braffett, B. H., Pop-Busui, R., Orchard, T. J., Nathan, D. M., Lachin, J. M., &
DCCT/EDIC Research Group. (2017). The relationship of blood glucose with
cardiovascular disease is mediated over time by traditional risk factors in type 1
diabetes: the DCCT/EDIC study. Diabetologia, 60(10), 2084-2091.
Cui, W., Qin, H., Zhou, Y. and Du, J., 2017. Determination of the activity of hydrogen
peroxide scavenging by using blue-emitting glucose oxidase–stabilized gold
nanoclusters as fluorescent nanoprobes and a Fenton reaction that induces
fluorescence quenching. Microchimica Acta, 184(4), pp.1103-1108.
Ismail, M.M., Ammar, E.T.M., Khalil, A.E.W.E. and Eid, M.Z., 2019. Effect of Honey &
Olive Oil Supplemented Bio-Yoghurt Feeding on Lipid Profile, Blood Glucose and
Hematological Parameters in Rats. Current Nutrition & Food Science, 15(2), pp.140-
147.
Visvanathan, R., Jayathilake, C., Liyanage, R. and Sivakanesan, R., 2019. Applicability
and reliability of the glucose oxidase method in assessing α-amylase activity. Food
chemistry, 275, pp.265-272.
Zohourtalab, A. and Razmi, H., 2018. Selective Determination of Glucose in Blood
Plasma by Using an Amperometric Glucose Biosensor Based on Glucose Oxidase and
a Chitosan/Nafion/IL/Ferrocene Composite Film. Biquarterly Iranian Journal of
Analytical Chemistry, 5(1), pp.9-16.
1 out of 13

Your All-in-One AI-Powered Toolkit for Academic Success.
+13062052269
info@desklib.com
Available 24*7 on WhatsApp / Email
![[object Object]](/_next/static/media/star-bottom.7253800d.svg)
Unlock your academic potential
© 2024 | Zucol Services PVT LTD | All rights reserved.