Statistical Analysis and Interpretation of Employee Data Assignment
VerifiedAdded on 2020/10/23
|9
|1045
|36
Homework Assignment
AI Summary
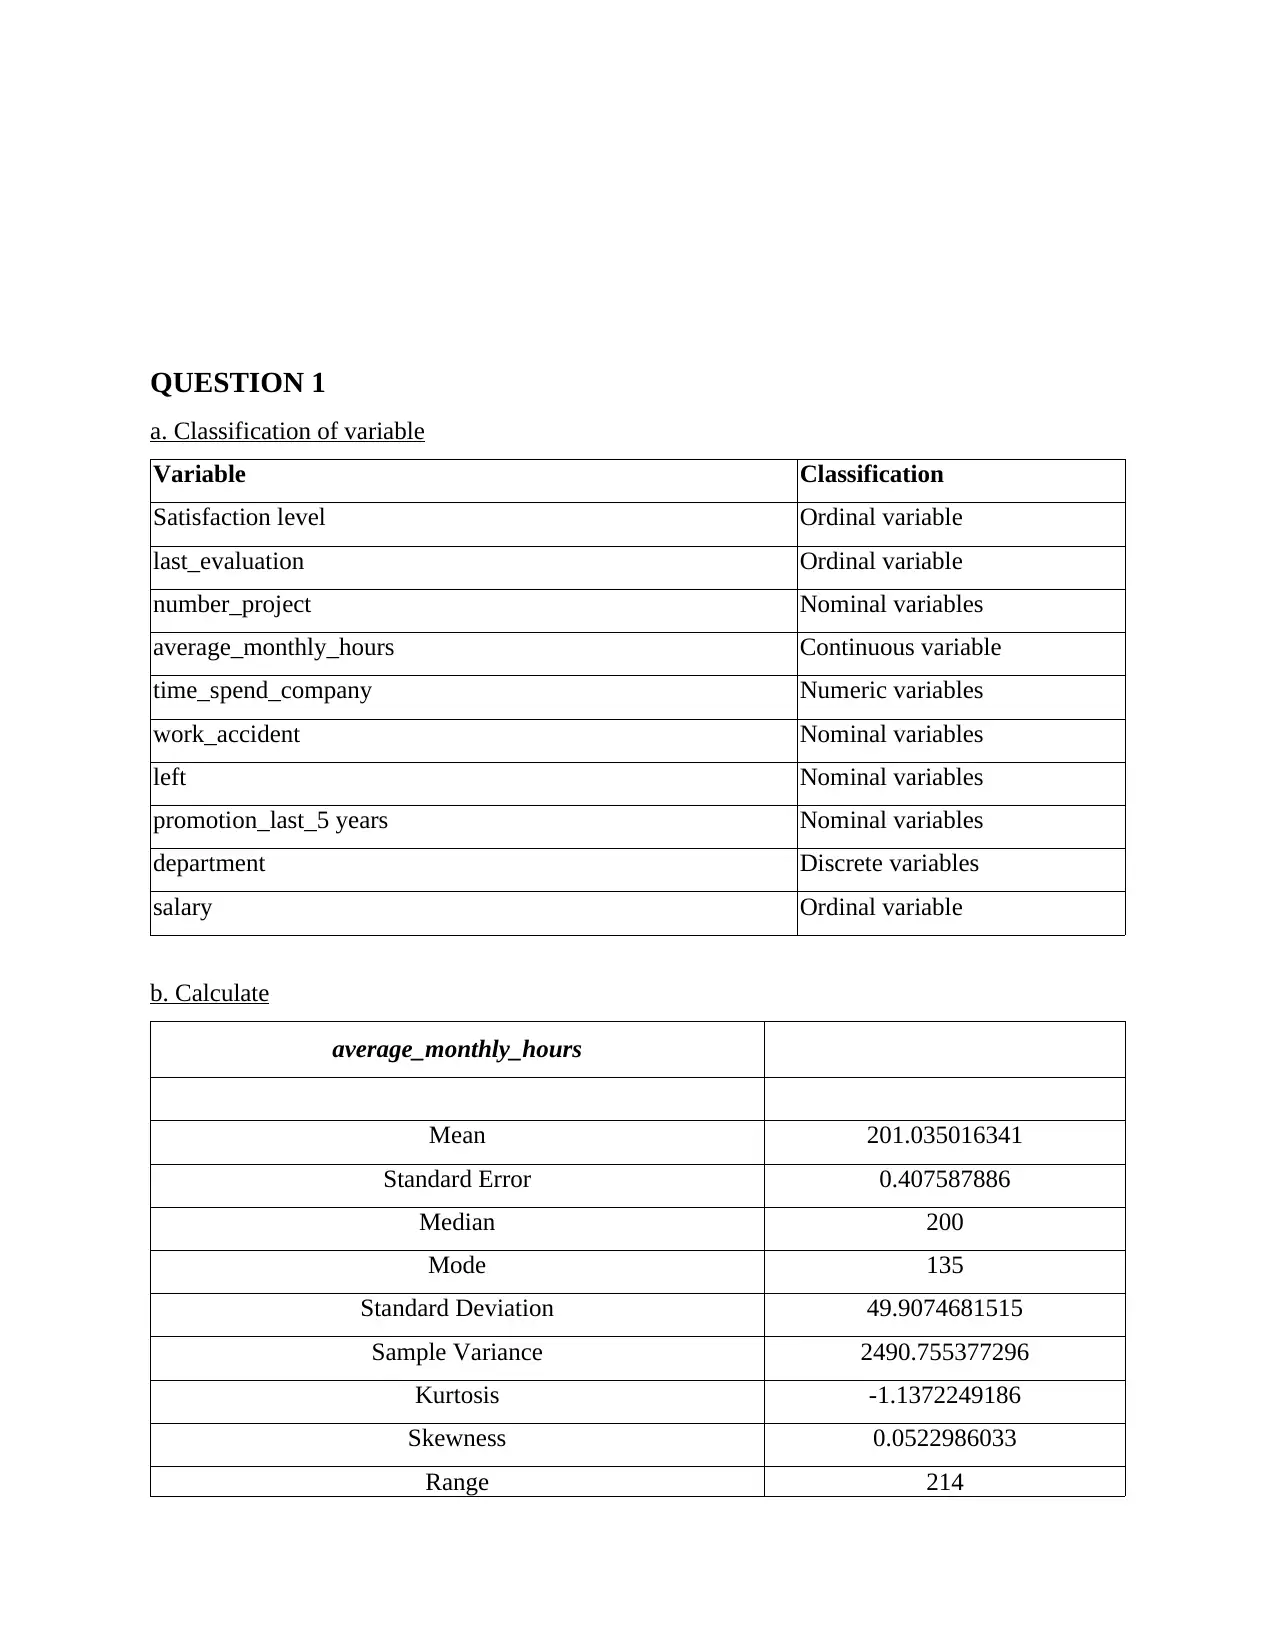
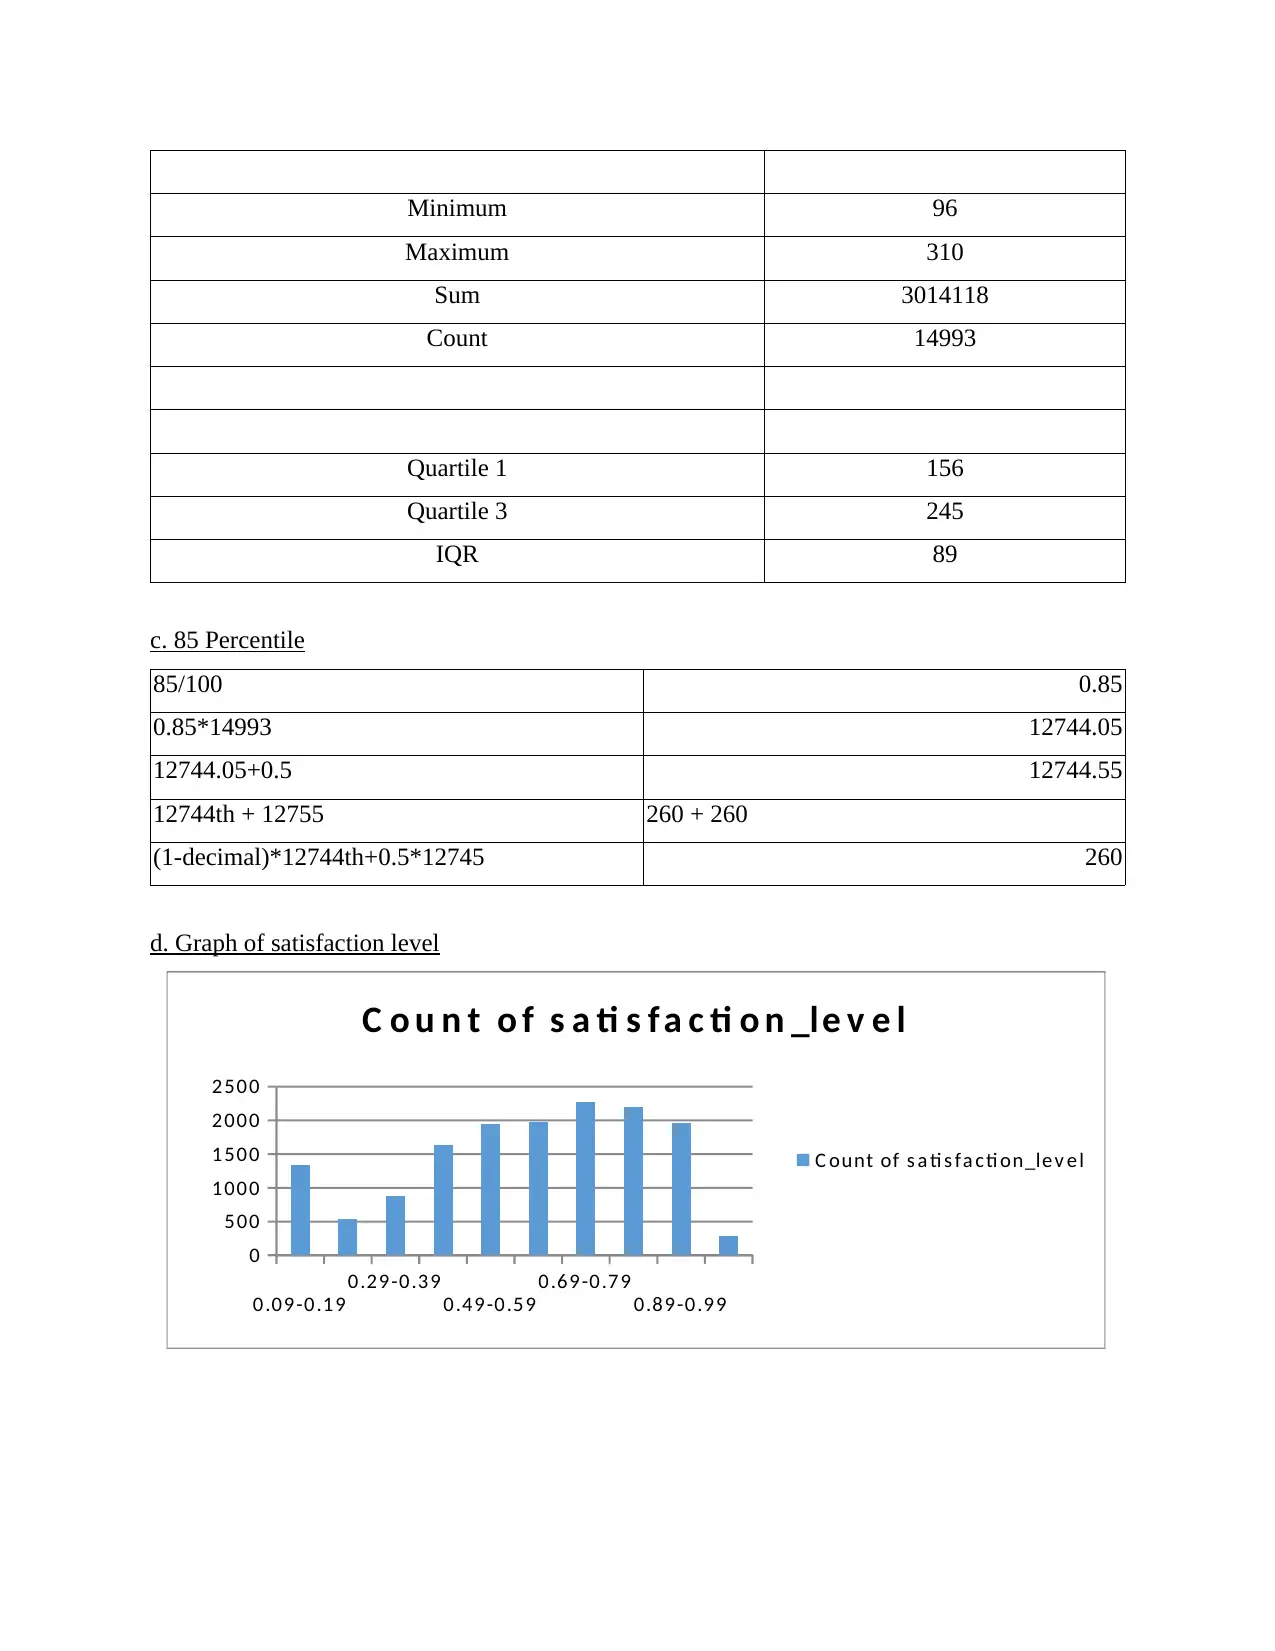
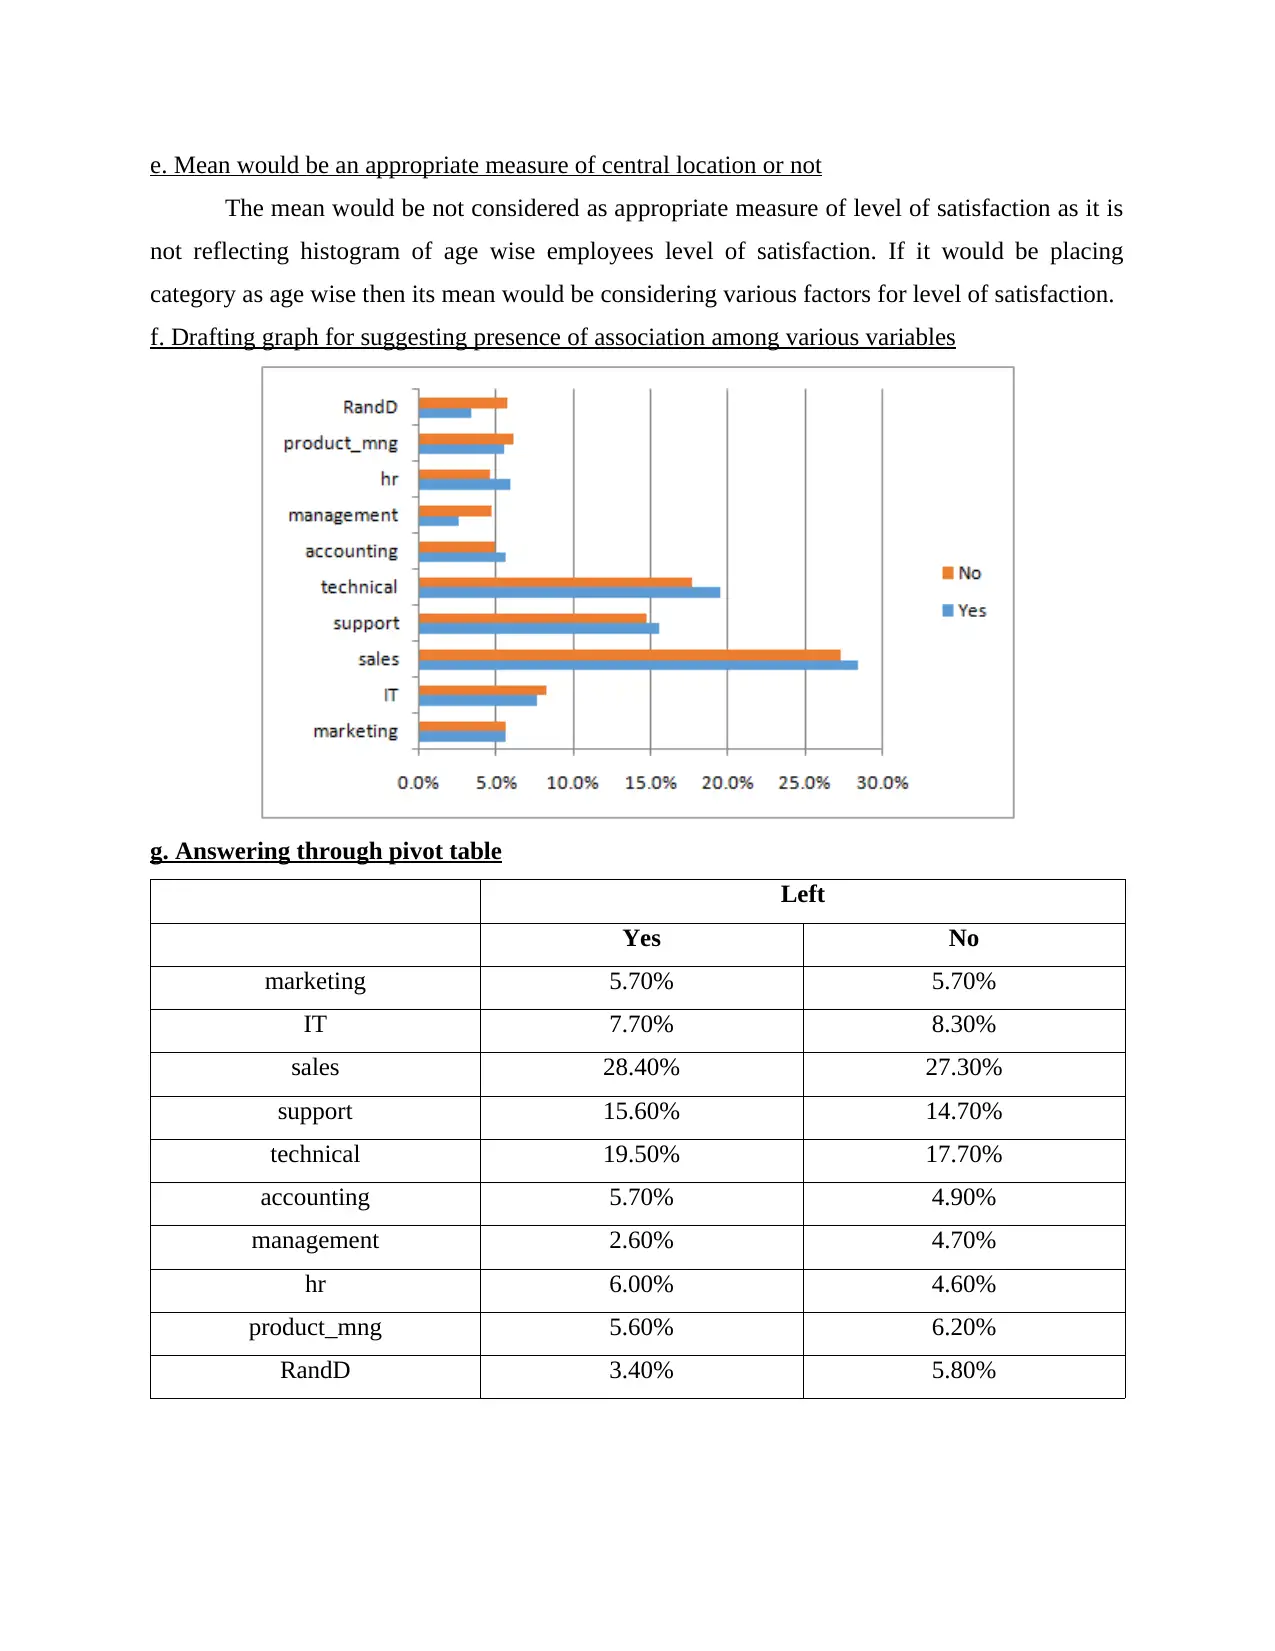
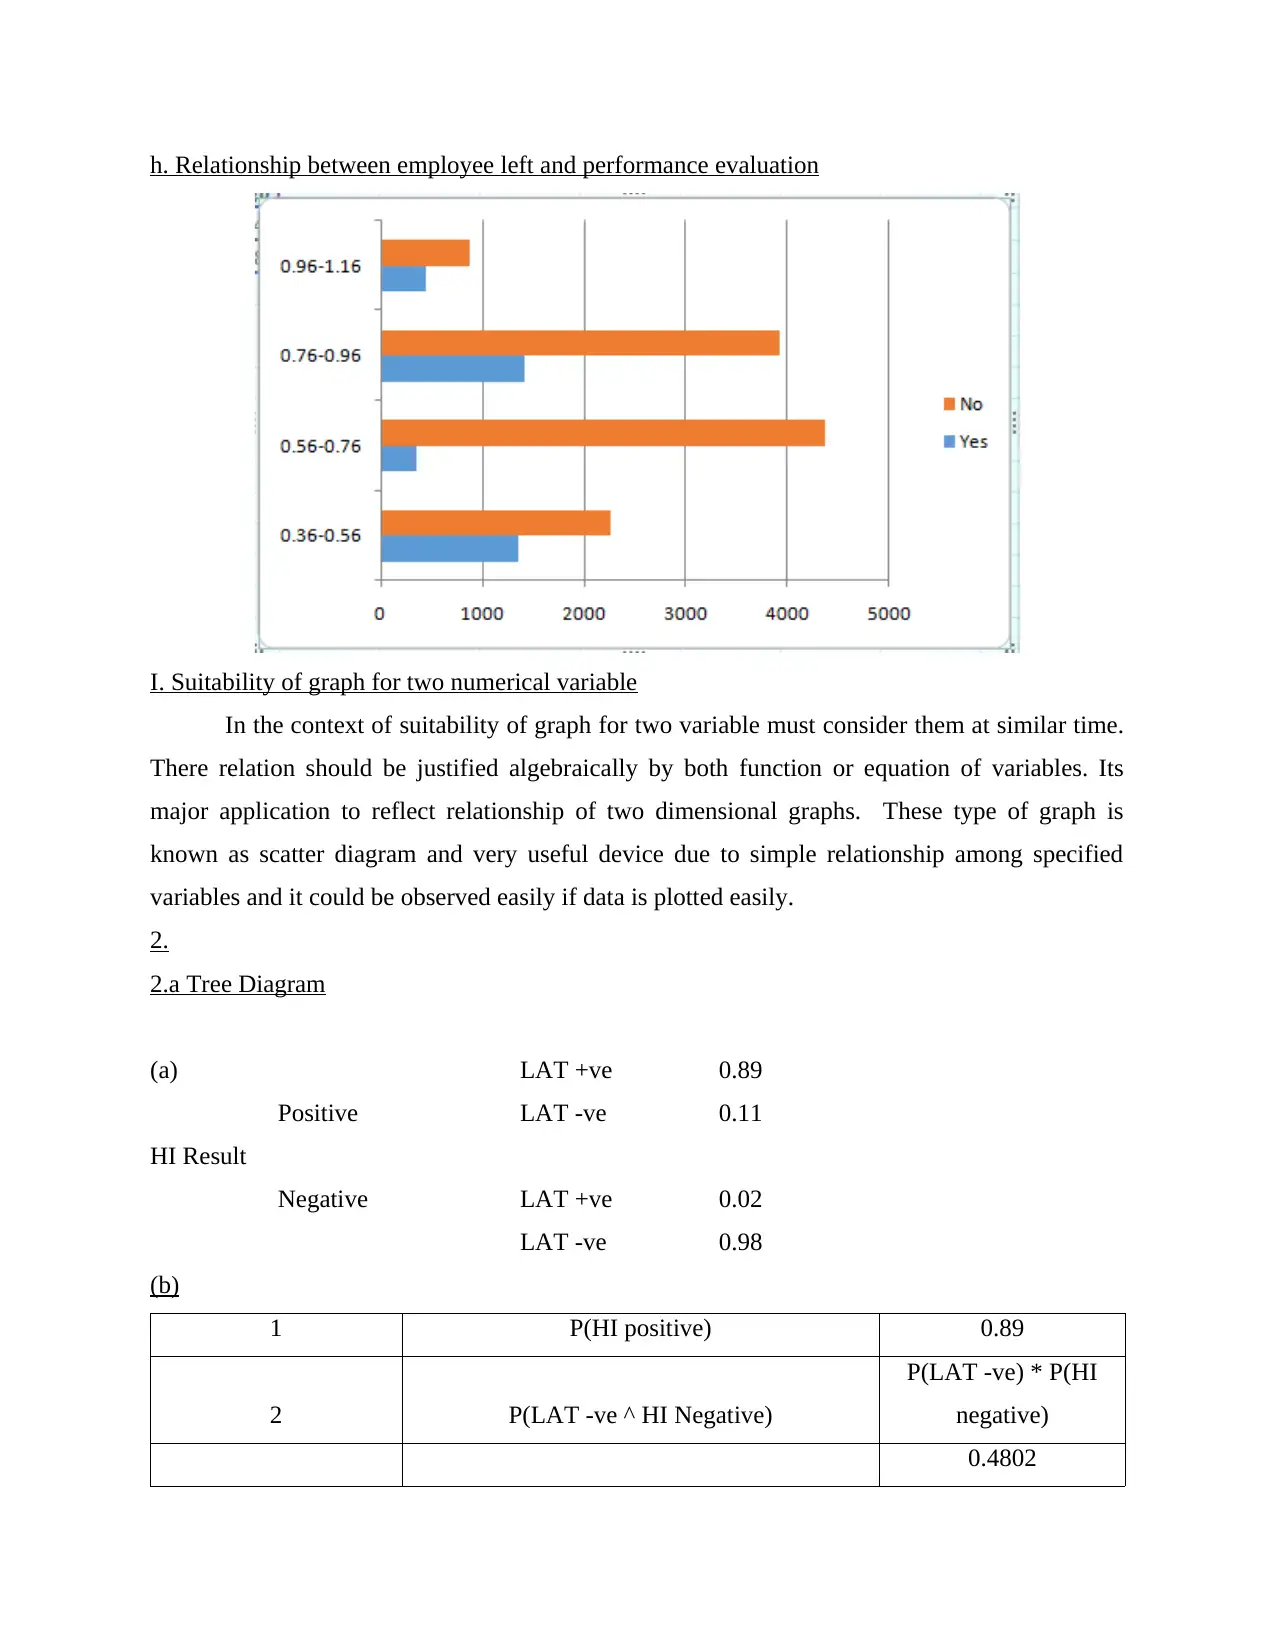
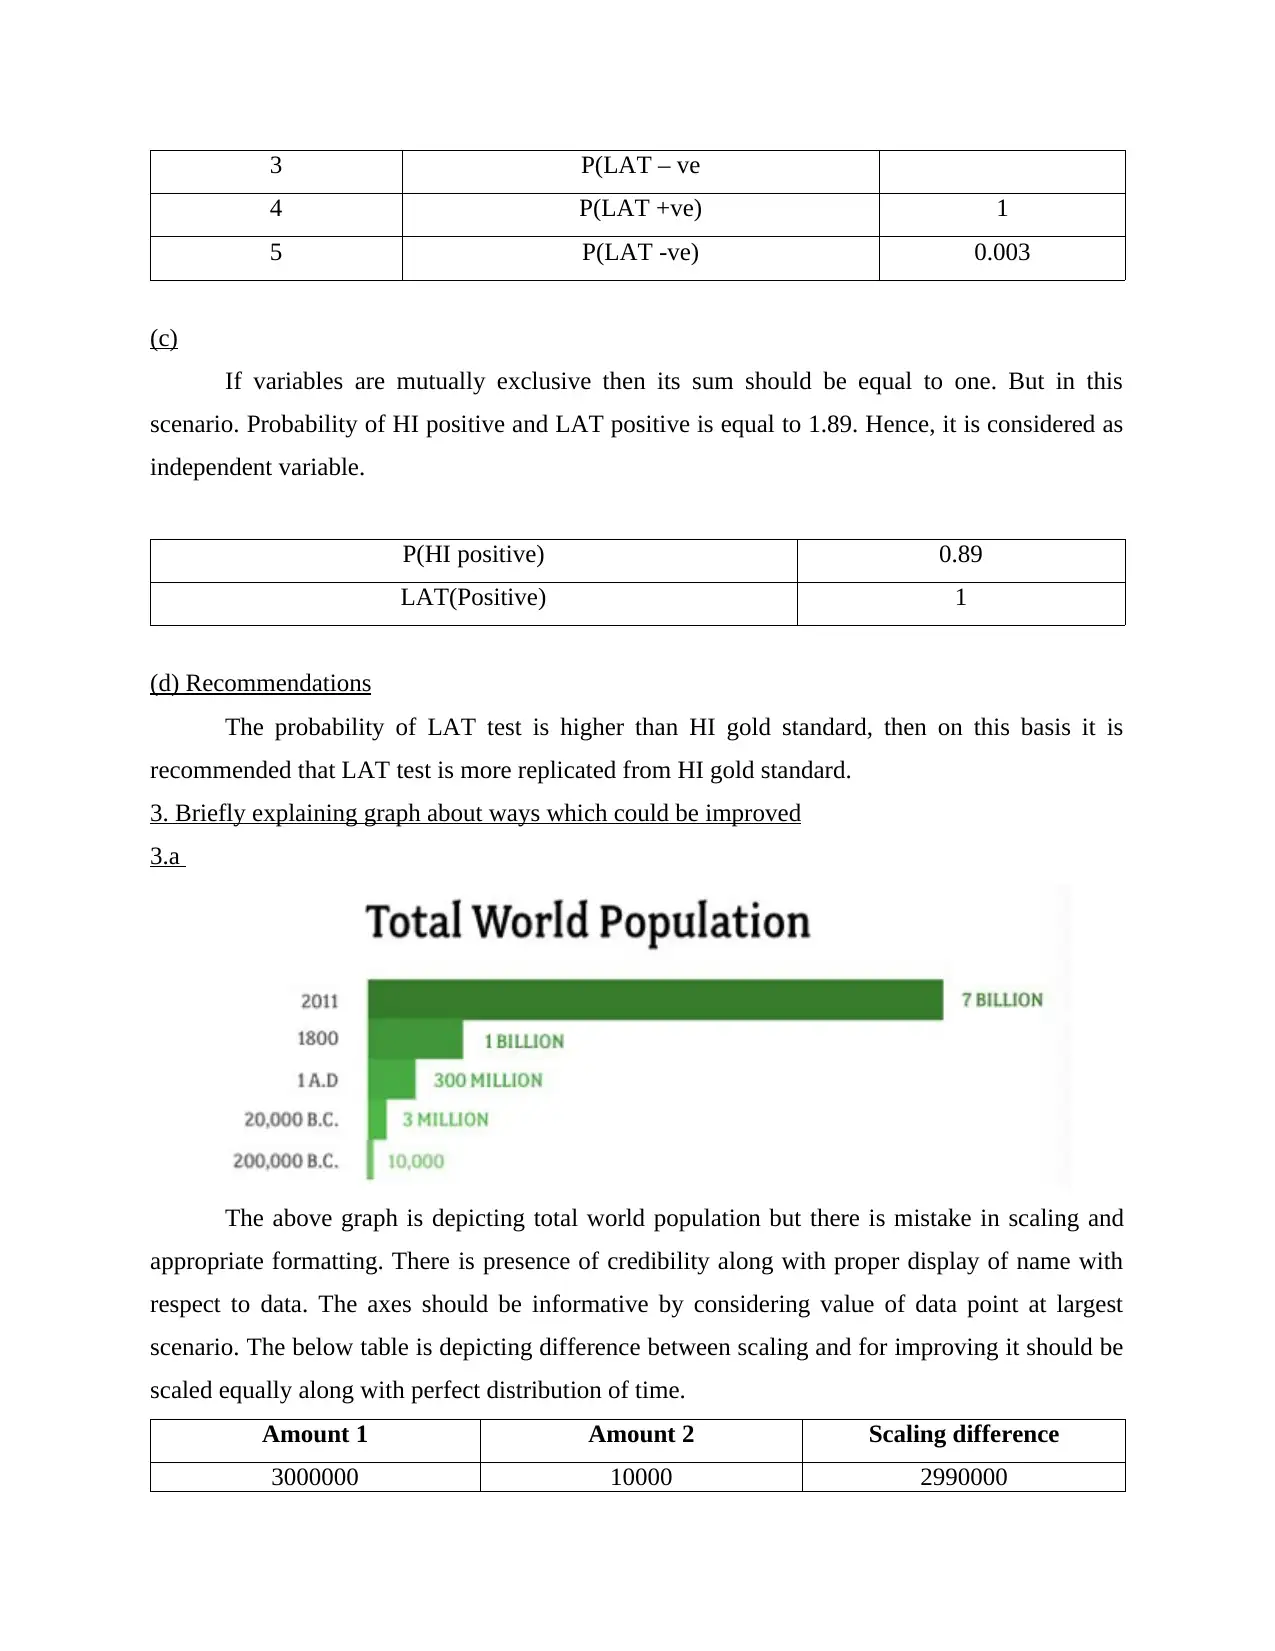
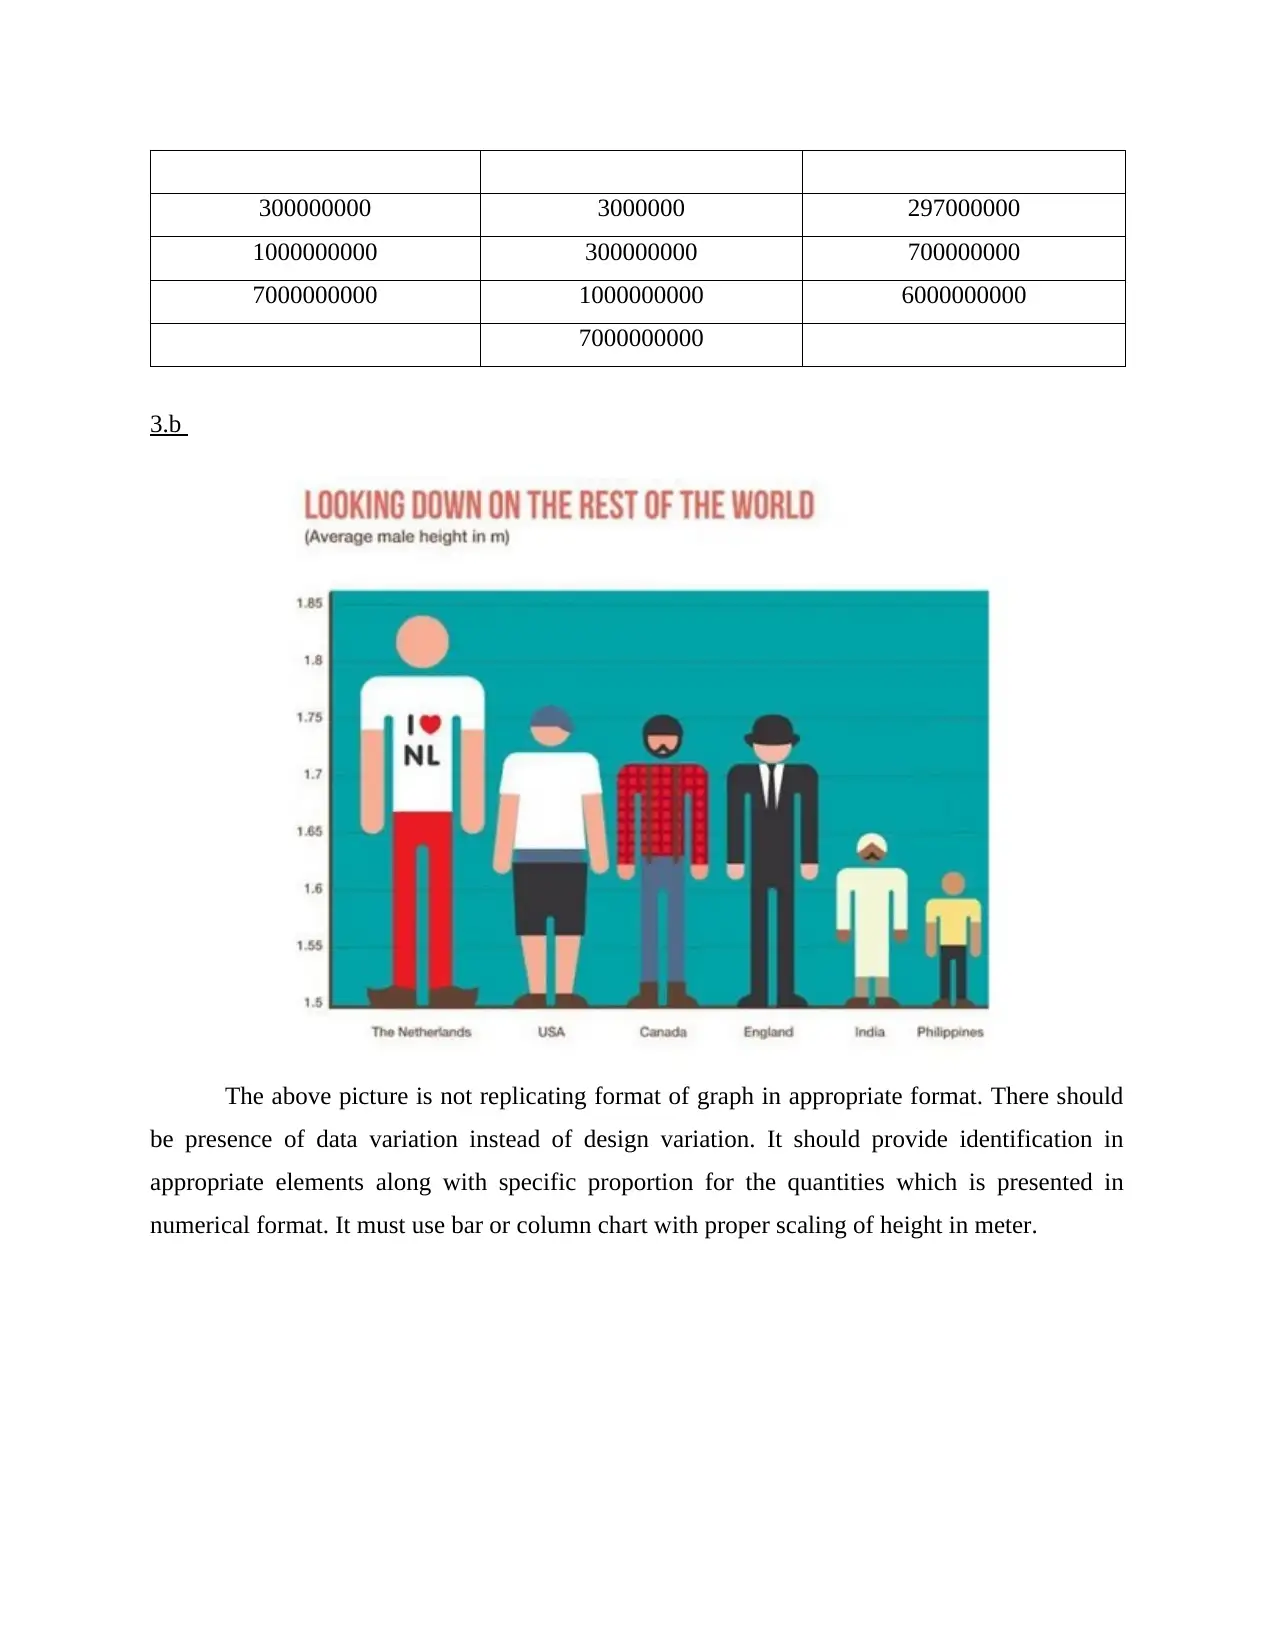
This statistics assignment solution covers a range of statistical concepts and techniques. It begins with the classification of variables, followed by calculations of central tendency and dispersion, including mean, median, mode, standard deviation, and percentiles. The assignment then delves into data visualization, including creating and interpreting graphs such as histograms, scatter plots, and pivot tables to analyze relationships between variables like employee satisfaction, performance, and department. It also explores tree diagrams to understand conditional probabilities and provides recommendations based on the analysis. The document critiques and suggests improvements for poorly designed graphs and addresses the potential for bias in survey outcomes. The solution provides a comprehensive analysis of data and its interpretation.
1 out of 9

Your All-in-One AI-Powered Toolkit for Academic Success.
+13062052269
info@desklib.com
Available 24*7 on WhatsApp / Email
![[object Object]](/_next/static/media/star-bottom.7253800d.svg)
Copyright © 2020–2026 A2Z Services. All Rights Reserved. Developed and managed by ZUCOL.