Exploring the Relationship Between Stress and Health Problems
VerifiedAdded on 2020/05/01
|12
|2775
|65
AI Summary
The study investigates the connection between stress and health problems, highlighting how stress can either cause or exacerbate illnesses. It explores various coping mechanisms employed by individuals to mitigate stress's harmful effects. The research underscores the importance of understanding different coping strategies as they vary among individuals facing similar stressful situations. Ultimately, it emphasizes the necessity for effective stress management to prevent illness and promote a healthier lifestyle.

Running head: FOUNDATION
FOUNDATION
[Author Name(s), First M. Last, Omit Titles and Degrees]
[Institutional Affiliation(s)]
FOUNDATION
[Author Name(s), First M. Last, Omit Titles and Degrees]
[Institutional Affiliation(s)]
Paraphrase This Document
Need a fresh take? Get an instant paraphrase of this document with our AI Paraphraser
FOUNDATION
Abstract
The research was carried out to ascertain whether it is consistent with earlier reports that
high-stress levels are a major cause of illness and that coping with stress reduces the level of
stress.
Questionnaires were prepared and given out to a sample of students who answered them.
Some tests were also given to the same sample of students. The teacher then summarised the
test results and raw data then made it available to the students. The results were presented in a
table showing LCU stress score, health problems score and coping score. A graphical
representation of LCU stresses score and health problems score, it shows an increase in one
variable increases the other variable. A graphical representation of LCU stress score and the
coping score is also shown. It shows an increase in one variable decreases the other.
The results showed that increased level of stress increases health problems. It also showed
that coping with stress reduces the level of stress. This confirms earlier research that state the
same.
FOUNDATION
Introduction
Stress refers to a state of feeling incapacitation and inability to meet the expectations levied
on you. Sometimes stress can energize and motivate while sometimes being under stress can
be so long lasting that it leads to depression and even physical symptoms like headaches and
sleeplessness (Green, 2000). This research, however, concentrated on the negative impacts of
stress and how people cope with stress. Coping with stress often involve trying to increase
internal attributions and decrease external ones, increasing the sense of personal control over
life events.
Even though stress does not directly cause illness a strong relationship has always been
realized between high levels of stress and illness (Billings, 1981). This may be because of
how stress affects the immune system of human beings, especially during prolonged stress.
Illnesses that are associated with high-stress level include; heart diseases, asthma,
constipation, diarrhea, eczema, functional dyspepsia, insomnia, high blood pressure,
insomnia, backaches, muscle soreness, premenstrual tension, indigestion, hives, fatigue,
migraines, and colitis.
Hans Selye was among the first few psychologist’s to realize the strong correlation between
stress and illness (Gazzaniga, 2012). His wholesome conclusion syndrome comprising of an
alarm reaction stage, resistance stage and exhaustion stage demonstrates the relationship
further. During the resistance stage, when the body adjusts itself to the stress and the level of
coping increases, ability to fight disease is lowered with time and the initial signs of
psychosomatic diseases begin to appear. In the exhaustion stage body resources are depleted
and resistance drops below the required level. At this stage, unless stress management is
sought, there may be the occurrence of illnesses or even eventual collapse.
⊘ This is a preview!⊘
Do you want full access?
Subscribe today to unlock all pages.
Trusted by 1+ million students worldwide
FOUNDATION
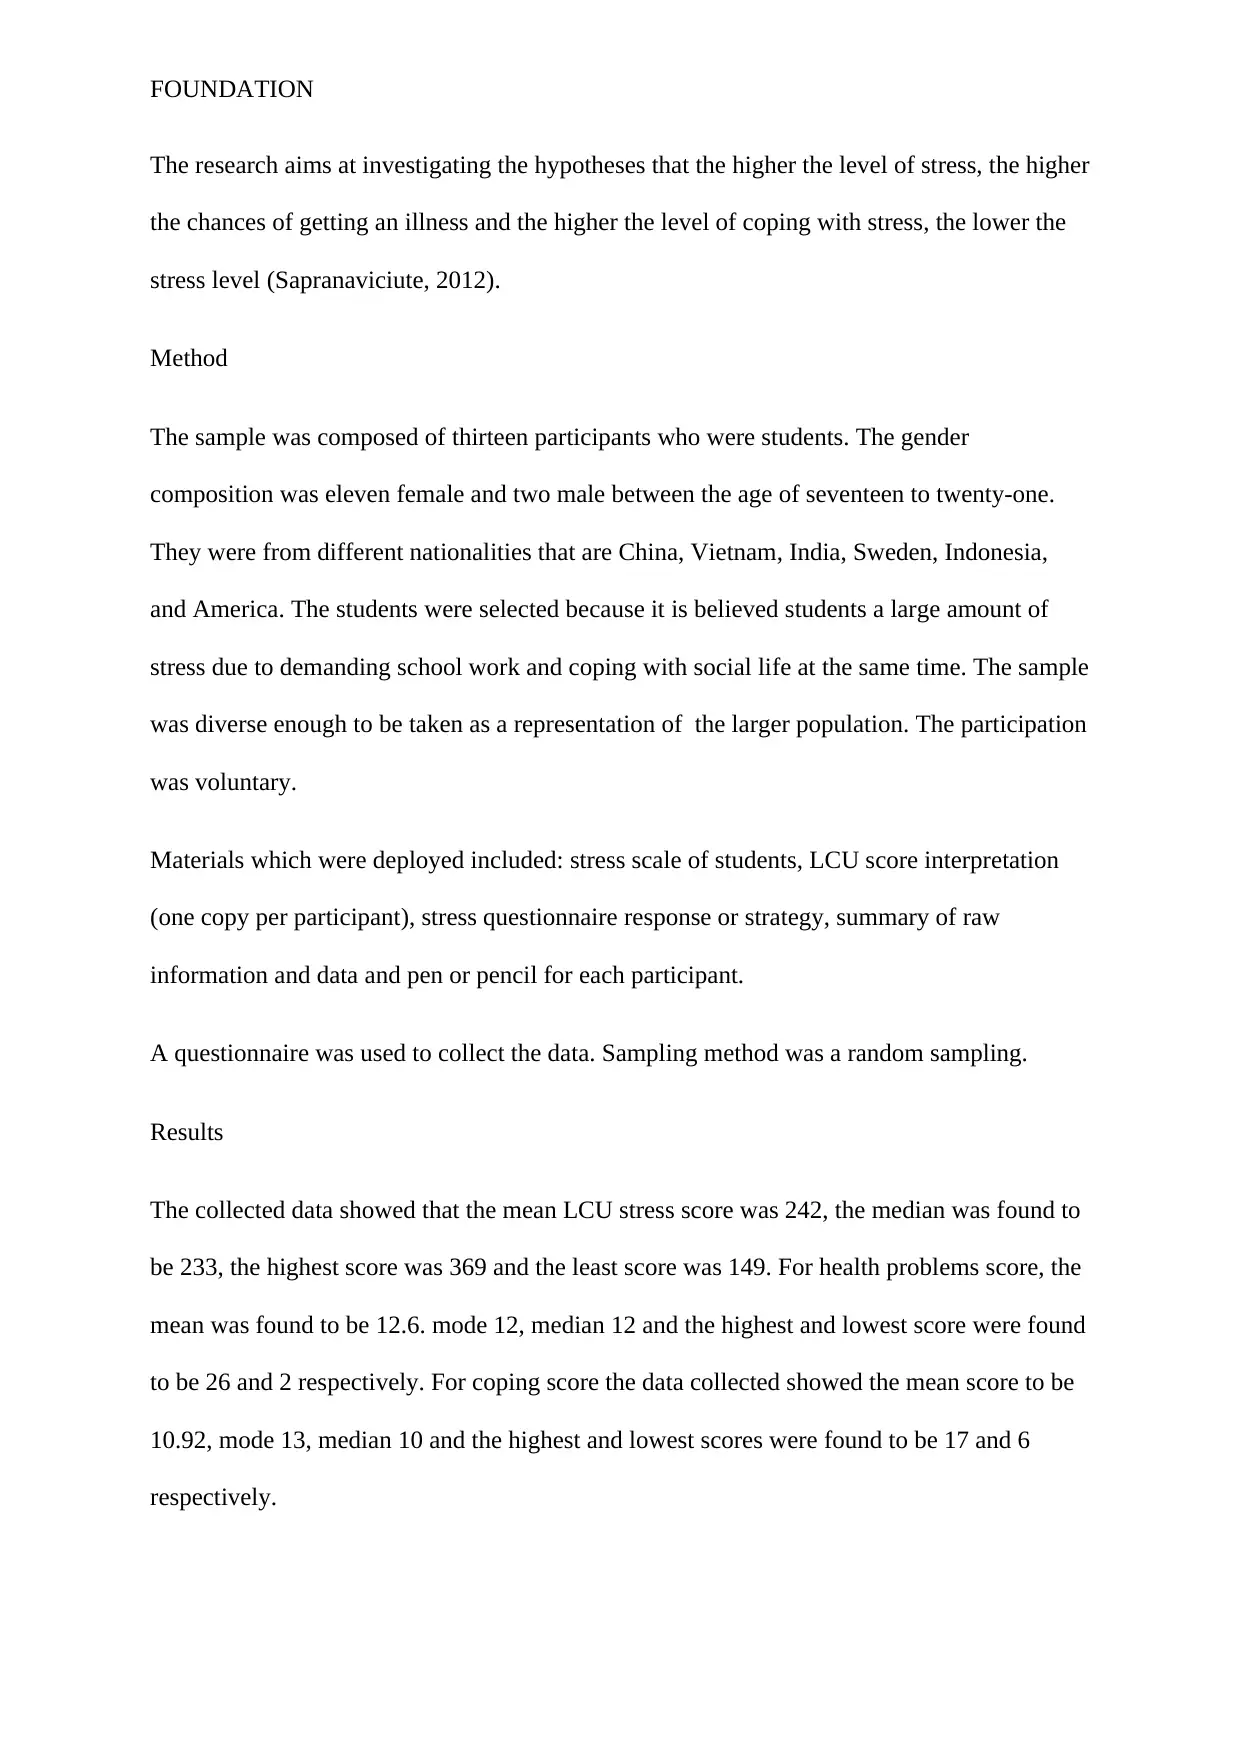
The research aims at investigating the hypotheses that the higher the level of stress, the higher
the chances of getting an illness and the higher the level of coping with stress, the lower the
stress level (Sapranaviciute, 2012).
Method
The sample was composed of thirteen participants who were students. The gender
composition was eleven female and two male between the age of seventeen to twenty-one.
They were from different nationalities that are China, Vietnam, India, Sweden, Indonesia,
and America. The students were selected because it is believed students a large amount of
stress due to demanding school work and coping with social life at the same time. The sample
was diverse enough to be taken as a representation of the larger population. The participation
was voluntary.
Materials which were deployed included: stress scale of students, LCU score interpretation
(one copy per participant), stress questionnaire response or strategy, summary of raw
information and data and pen or pencil for each participant.
A questionnaire was used to collect the data. Sampling method was a random sampling.
Results
The collected data showed that the mean LCU stress score was 242, the median was found to
be 233, the highest score was 369 and the least score was 149. For health problems score, the
mean was found to be 12.6. mode 12, median 12 and the highest and lowest score were found
to be 26 and 2 respectively. For coping score the data collected showed the mean score to be
10.92, mode 13, median 10 and the highest and lowest scores were found to be 17 and 6
respectively.
Paraphrase This Document
Need a fresh take? Get an instant paraphrase of this document with our AI Paraphraser
FOUNDATION
From the results, there were slight gender deviations with the females showing high levels of
focus of emotions ways of coping with stress more than the male. A look into the strategies
for coping for different occurrence was as well looked at by the research. Although there are
some differences, there is the relative consistency of response to a variety of events.
It was found out from the research that the correlation between the ability of a person to deal
with a stressful event and the stressful event itself was directly affected by the availability of
social and coping resources. This was so even though the correlation between coping and
social resources was quite complex and contradictory. An example such a contradiction and
complexity is the demise of a loved one which results into stress as well as lowering the
available support in as much as the remaining social relationships could be fundamental as far
as dealing with the loss is concerned.
Due to the complexity in the nature of the correlation between coping, the stressful event at
hand and social support, identification of positive coping and differentiating it from negative
coping is quite of a challenge. However, the research established that relying so much on
active attempts when dealing with the stressful event and less attempts to avoid handling it
brings about less levels of stress.
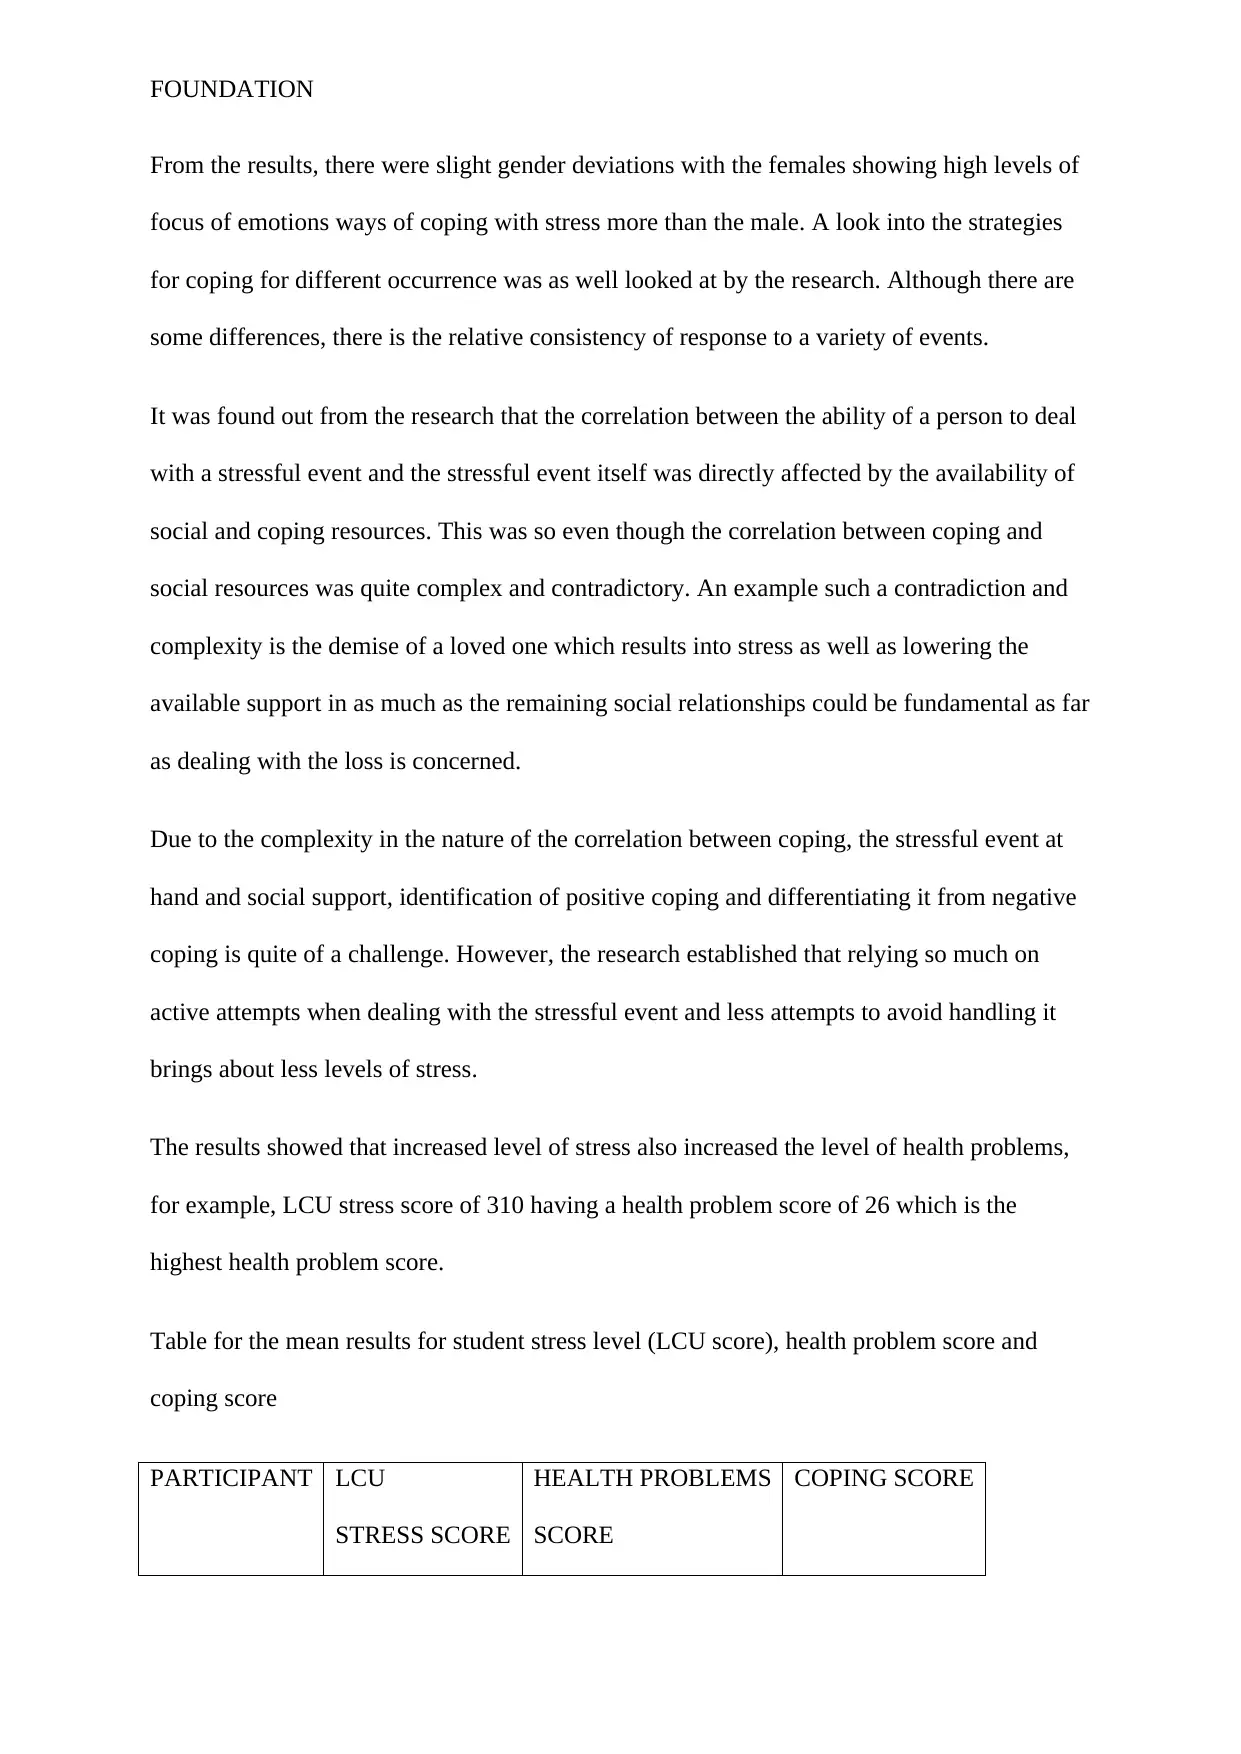
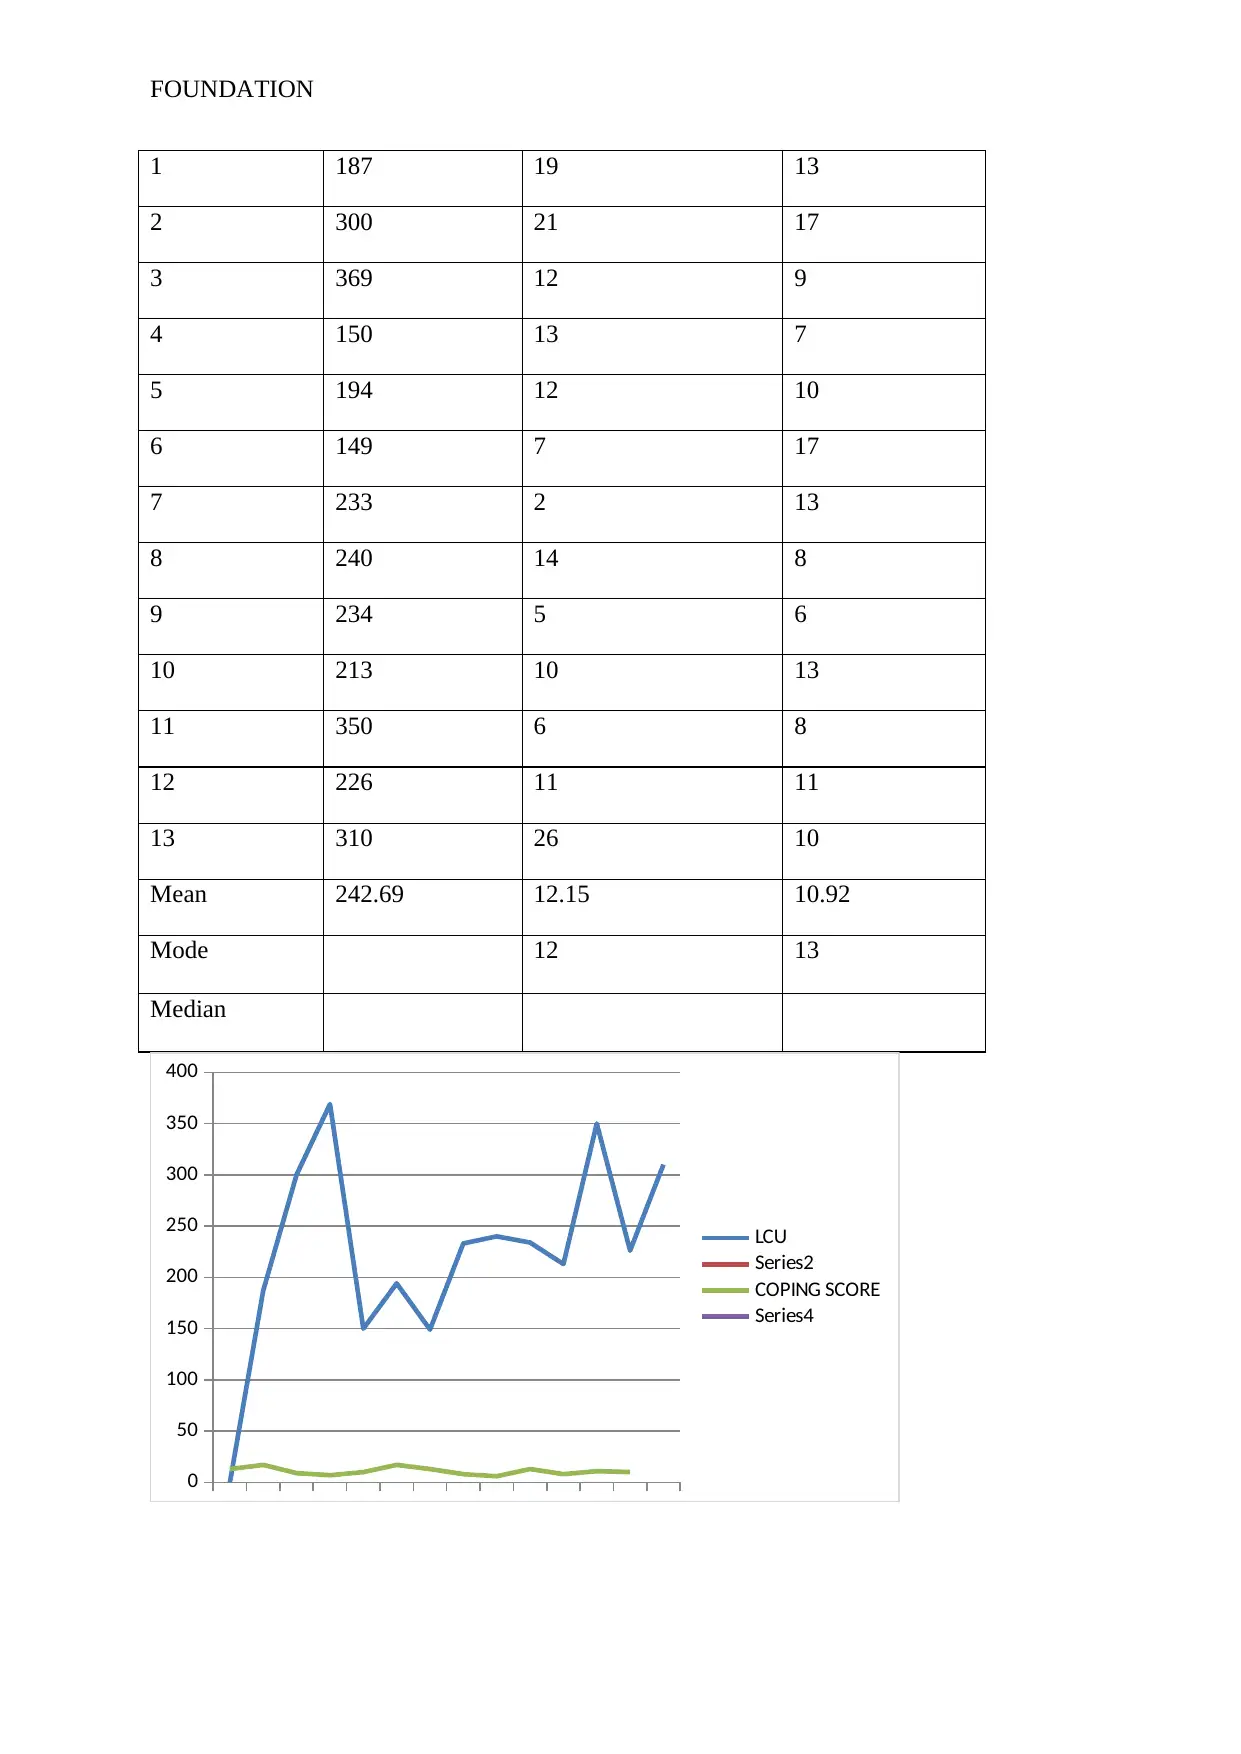
The results showed that increased level of stress also increased the level of health problems,
for example, LCU stress score of 310 having a health problem score of 26 which is the
highest health problem score.
Table for the mean results for student stress level (LCU score), health problem score and
coping score
PARTICIPANT LCU
STRESS SCORE
HEALTH PROBLEMS
SCORE
COPING SCORE
From the results, there were slight gender deviations with the females showing high levels of
focus of emotions ways of coping with stress more than the male. A look into the strategies
for coping for different occurrence was as well looked at by the research. Although there are
some differences, there is the relative consistency of response to a variety of events.
It was found out from the research that the correlation between the ability of a person to deal
with a stressful event and the stressful event itself was directly affected by the availability of
social and coping resources. This was so even though the correlation between coping and
social resources was quite complex and contradictory. An example such a contradiction and
complexity is the demise of a loved one which results into stress as well as lowering the
available support in as much as the remaining social relationships could be fundamental as far
as dealing with the loss is concerned.
Due to the complexity in the nature of the correlation between coping, the stressful event at
hand and social support, identification of positive coping and differentiating it from negative
coping is quite of a challenge. However, the research established that relying so much on
active attempts when dealing with the stressful event and less attempts to avoid handling it
brings about less levels of stress.
The results showed that increased level of stress also increased the level of health problems,
for example, LCU stress score of 310 having a health problem score of 26 which is the
highest health problem score.
Table for the mean results for student stress level (LCU score), health problem score and
coping score
PARTICIPANT LCU
STRESS SCORE
HEALTH PROBLEMS
SCORE
COPING SCORE
FOUNDATION
1 187 19 13
2 300 21 17
3 369 12 9
4 150 13 7
5 194 12 10
6 149 7 17
7 233 2 13
8 240 14 8
9 234 5 6
10 213 10 13
11 350 6 8
12 226 11 11
13 310 26 10
Mean 242.69 12.15 10.92
Mode 12 13
Median
0
50
100
150
200
250
300
350
400
LCU
Series2
COPING SCORE
Series4
1 187 19 13
2 300 21 17
3 369 12 9
4 150 13 7
5 194 12 10
6 149 7 17
7 233 2 13
8 240 14 8
9 234 5 6
10 213 10 13
11 350 6 8
12 226 11 11
13 310 26 10
Mean 242.69 12.15 10.92
Mode 12 13
Median
0
50
100
150
200
250
300
350
400
LCU
Series2
COPING SCORE
Series4
⊘ This is a preview!⊘
Do you want full access?
Subscribe today to unlock all pages.
Trusted by 1+ million students worldwide
FOUNDATION
1 2 3 4 5 6 7 8 9 10 11 12 13
0
50
100
150
200
250
300
350
400
HEALTH PROBLEMS SCORE
HEALTH PROBLEMS SCORE
HEALTH PROBLEMS SCORE
LCU STRESS SCORE
LCU STRESS SCORE
LCU STRESS SCORE
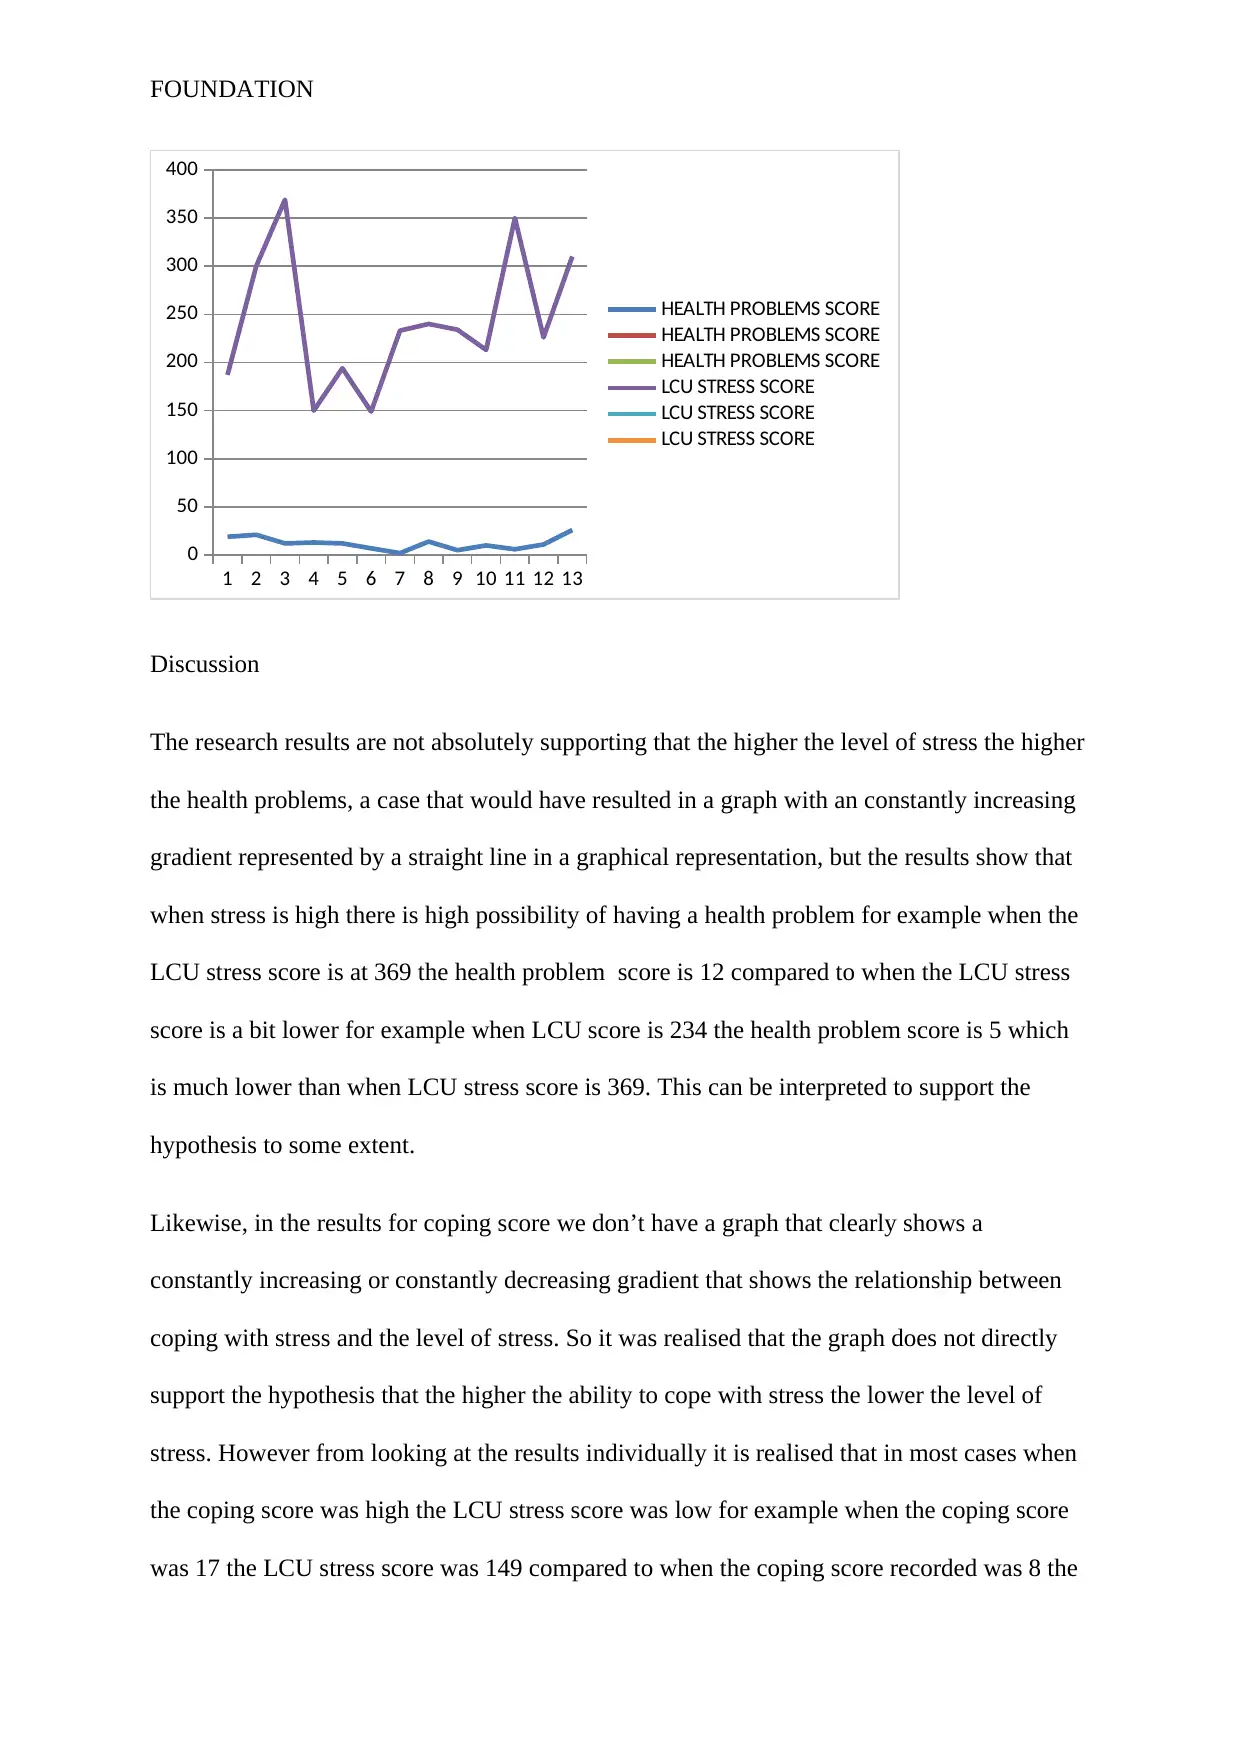
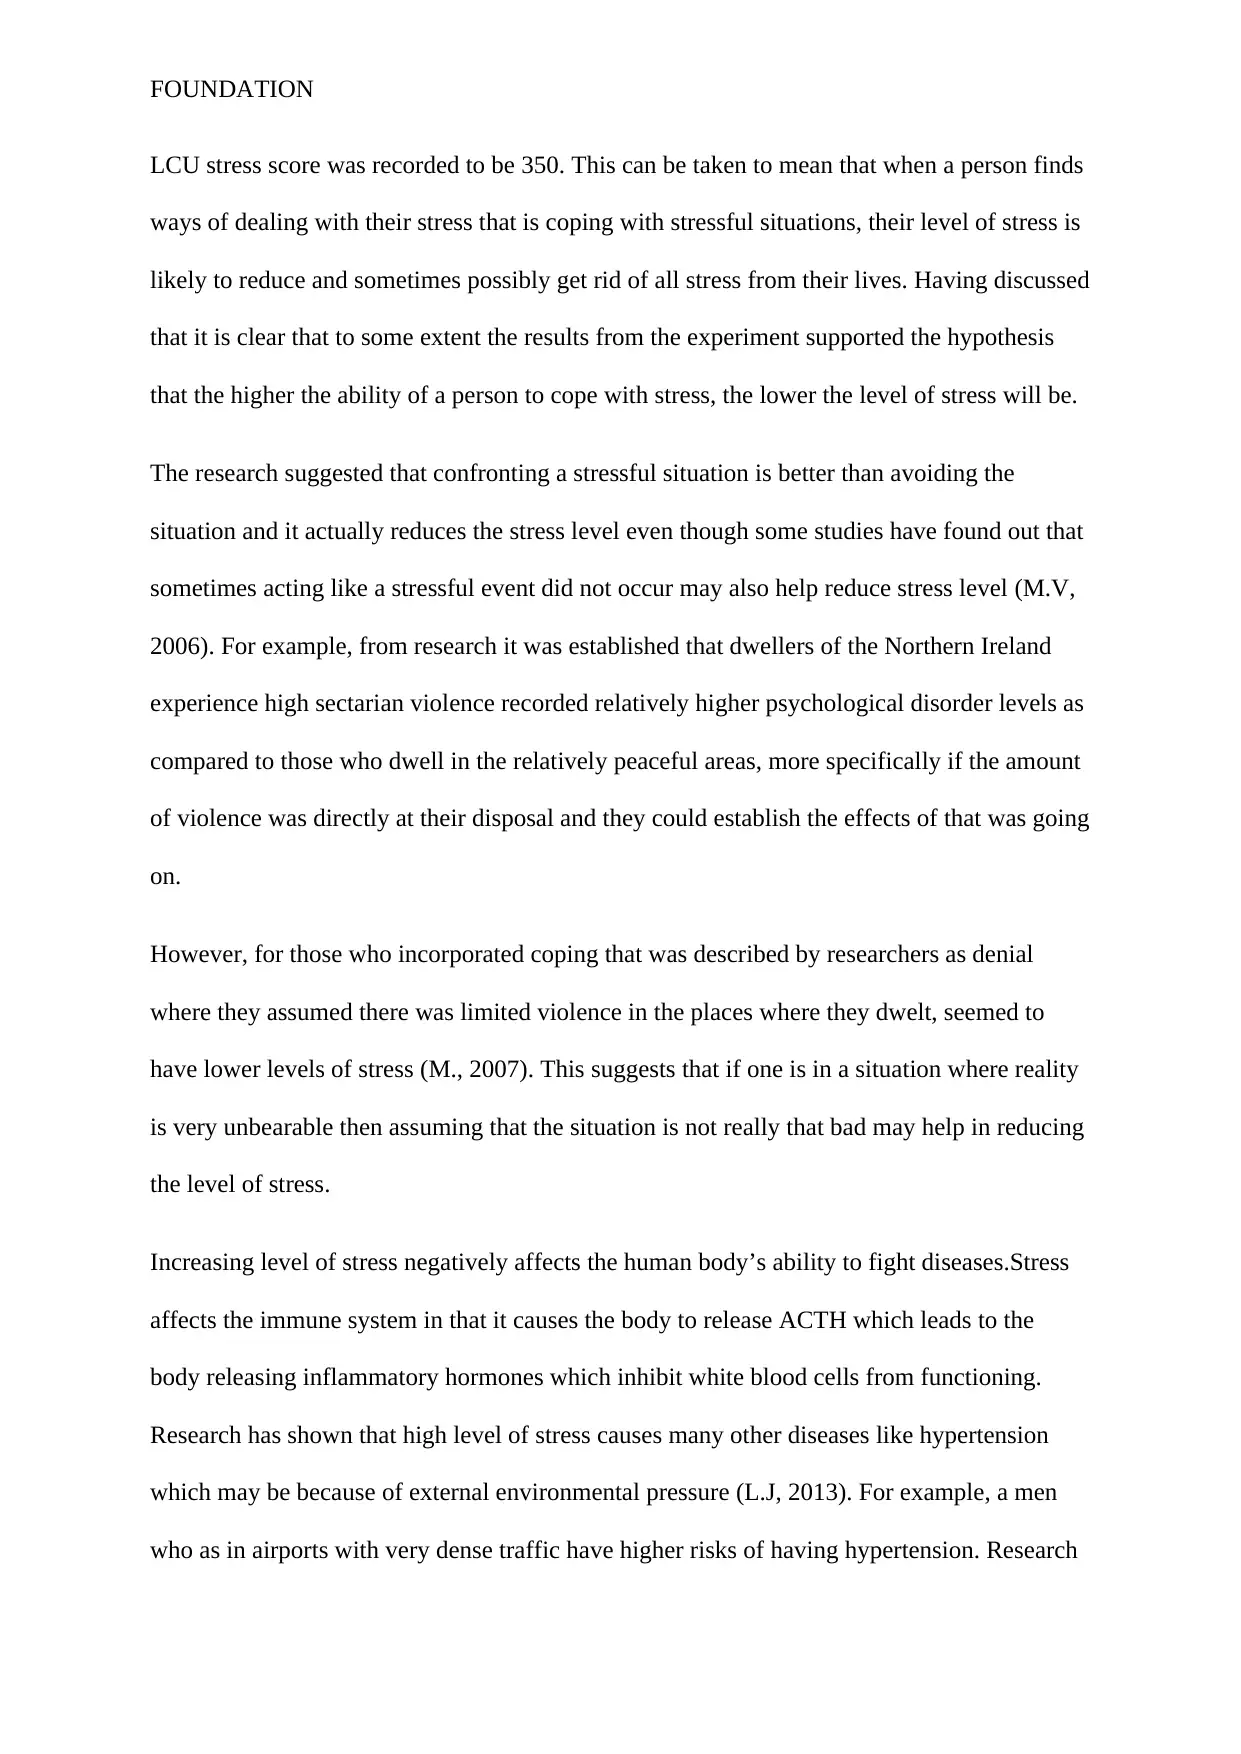
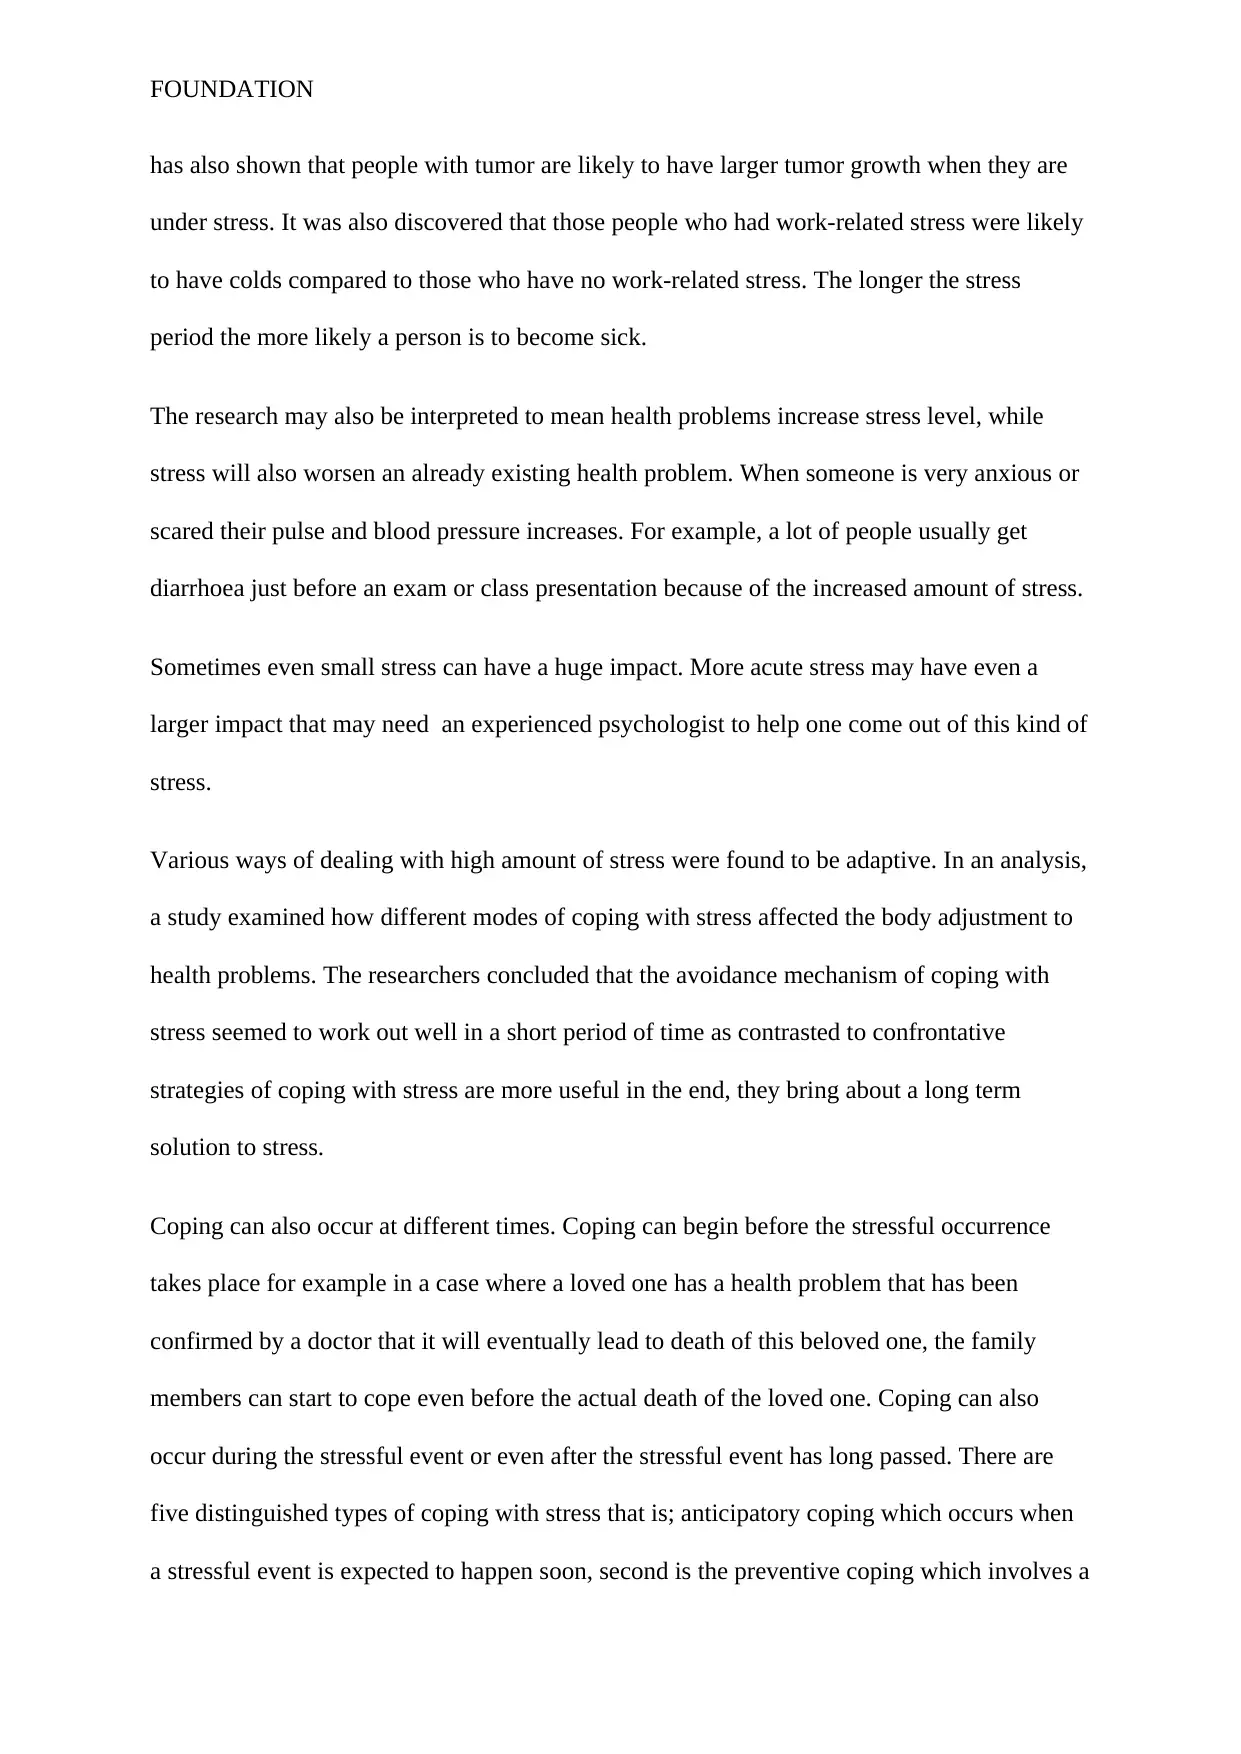
Discussion
The research results are not absolutely supporting that the higher the level of stress the higher
the health problems, a case that would have resulted in a graph with an constantly increasing
gradient represented by a straight line in a graphical representation, but the results show that
when stress is high there is high possibility of having a health problem for example when the
LCU stress score is at 369 the health problem score is 12 compared to when the LCU stress
score is a bit lower for example when LCU score is 234 the health problem score is 5 which
is much lower than when LCU stress score is 369. This can be interpreted to support the
hypothesis to some extent.
Likewise, in the results for coping score we don’t have a graph that clearly shows a
constantly increasing or constantly decreasing gradient that shows the relationship between
coping with stress and the level of stress. So it was realised that the graph does not directly
support the hypothesis that the higher the ability to cope with stress the lower the level of
stress. However from looking at the results individually it is realised that in most cases when
the coping score was high the LCU stress score was low for example when the coping score
was 17 the LCU stress score was 149 compared to when the coping score recorded was 8 the
1 2 3 4 5 6 7 8 9 10 11 12 13
0
50
100
150
200
250
300
350
400
HEALTH PROBLEMS SCORE
HEALTH PROBLEMS SCORE
HEALTH PROBLEMS SCORE
LCU STRESS SCORE
LCU STRESS SCORE
LCU STRESS SCORE
Discussion
The research results are not absolutely supporting that the higher the level of stress the higher
the health problems, a case that would have resulted in a graph with an constantly increasing
gradient represented by a straight line in a graphical representation, but the results show that
when stress is high there is high possibility of having a health problem for example when the
LCU stress score is at 369 the health problem score is 12 compared to when the LCU stress
score is a bit lower for example when LCU score is 234 the health problem score is 5 which
is much lower than when LCU stress score is 369. This can be interpreted to support the
hypothesis to some extent.
Likewise, in the results for coping score we don’t have a graph that clearly shows a
constantly increasing or constantly decreasing gradient that shows the relationship between
coping with stress and the level of stress. So it was realised that the graph does not directly
support the hypothesis that the higher the ability to cope with stress the lower the level of
stress. However from looking at the results individually it is realised that in most cases when
the coping score was high the LCU stress score was low for example when the coping score
was 17 the LCU stress score was 149 compared to when the coping score recorded was 8 the
Paraphrase This Document
Need a fresh take? Get an instant paraphrase of this document with our AI Paraphraser
FOUNDATION
LCU stress score was recorded to be 350. This can be taken to mean that when a person finds
ways of dealing with their stress that is coping with stressful situations, their level of stress is
likely to reduce and sometimes possibly get rid of all stress from their lives. Having discussed
that it is clear that to some extent the results from the experiment supported the hypothesis
that the higher the ability of a person to cope with stress, the lower the level of stress will be.
The research suggested that confronting a stressful situation is better than avoiding the
situation and it actually reduces the stress level even though some studies have found out that
sometimes acting like a stressful event did not occur may also help reduce stress level (M.V,
2006). For example, from research it was established that dwellers of the Northern Ireland
experience high sectarian violence recorded relatively higher psychological disorder levels as
compared to those who dwell in the relatively peaceful areas, more specifically if the amount
of violence was directly at their disposal and they could establish the effects of that was going
on.
However, for those who incorporated coping that was described by researchers as denial
where they assumed there was limited violence in the places where they dwelt, seemed to
have lower levels of stress (M., 2007). This suggests that if one is in a situation where reality
is very unbearable then assuming that the situation is not really that bad may help in reducing
the level of stress.
Increasing level of stress negatively affects the human body’s ability to fight diseases.Stress
affects the immune system in that it causes the body to release ACTH which leads to the
body releasing inflammatory hormones which inhibit white blood cells from functioning.
Research has shown that high level of stress causes many other diseases like hypertension
which may be because of external environmental pressure (L.J, 2013). For example, a men
who as in airports with very dense traffic have higher risks of having hypertension. Research
FOUNDATION
has also shown that people with tumor are likely to have larger tumor growth when they are
under stress. It was also discovered that those people who had work-related stress were likely
to have colds compared to those who have no work-related stress. The longer the stress
period the more likely a person is to become sick.
The research may also be interpreted to mean health problems increase stress level, while
stress will also worsen an already existing health problem. When someone is very anxious or
scared their pulse and blood pressure increases. For example, a lot of people usually get
diarrhoea just before an exam or class presentation because of the increased amount of stress.
Sometimes even small stress can have a huge impact. More acute stress may have even a
larger impact that may need an experienced psychologist to help one come out of this kind of
stress.
Various ways of dealing with high amount of stress were found to be adaptive. In an analysis,
a study examined how different modes of coping with stress affected the body adjustment to
health problems. The researchers concluded that the avoidance mechanism of coping with
stress seemed to work out well in a short period of time as contrasted to confrontative
strategies of coping with stress are more useful in the end, they bring about a long term
solution to stress.
Coping can also occur at different times. Coping can begin before the stressful occurrence
takes place for example in a case where a loved one has a health problem that has been
confirmed by a doctor that it will eventually lead to death of this beloved one, the family
members can start to cope even before the actual death of the loved one. Coping can also
occur during the stressful event or even after the stressful event has long passed. There are
five distinguished types of coping with stress that is; anticipatory coping which occurs when
a stressful event is expected to happen soon, second is the preventive coping which involves a
⊘ This is a preview!⊘
Do you want full access?
Subscribe today to unlock all pages.
Trusted by 1+ million students worldwide
FOUNDATION
person stopping behaviours that might cause stress in the future, the third is dynamic coping
which happens during the time that a person is already under stress, diverting one’s attention
to other issues apart from the stressful issue is a good example under this type of coping, the
fourth type is the reactive coping which usually occurs after a stressful event has passed for
example a person changing their lifestyle after having an accident and the final type is the
residual coping which occurs a very long time after the stressful event has passed for example
preventing one’s self from thinking too much about a situation long after a tragic accident
occurred in the past because of stress..
Conclusion
Having completed the research, it shows that people need to find ways of managing their
stress so as to avoid the harmful effects of stress especially illness/ It is seen that different
people have different ways of dealing with stress. The need to have stress coping mechanisms
is stressed as it is a major step towards a stress-free living. It has also been realised from the
research that there are different types of coping with stress, helping in the understanding of
the complex ways different people cope with different stressful situations and that it is
different for every person even if more people are facing the same stressful situation.
It is clear that stress is related to health problems in that either the stress cause illness or
worsen an already existing health problem or health problems increase the level of stress a
person is under which may be because of fear of how the sickness might end, in most cases
people fear death causing them to have a lot of stress.
Paraphrase This Document
Need a fresh take? Get an instant paraphrase of this document with our AI Paraphraser
FOUNDATION
References
Stress and Mental Health: Contemporary issues and prospects for the future. (1994). Boston,
MA: Springer US.
B., B.-C. (2014). Psychology of health and fitness: Applications for behavior change.
Billings, A. &. (1981). The role of coping response and social resources in attenuating the
stress of life events.
Federation, W. G. (1998). Bus drivers' alert: The relationship between stress and health: a
trade union guide for organizers and shop-stewards in the bus industry. London:
International Transport Workers' Federation.
Gazzaniga, M. S. (2012). Psychological science edition. New York: W.W. Norton &
Company.
Green, S. (2000). Stress Management: Staying in control. Psychology review.
L.J, A. (2013). The relationship between mental health problems, acculturative stress, and
academics performance in Latino English language learner adolescents.
M., T. S. (2007). The cortisol connection: Why stress makes you fat and ruins your health-
and what you can do about it. Alameda, CA: Hunter House.
M.V, L. (2006). Stress and mental health of college students. New York: Nova Science
Publishers.
P.E.T.E.R, B. (2014). KEEP CALM AND REDUCE STRESS. S1: LULU PRESS INC.
R.A, W. (2004). The stress effect: Discover the connection between stress and illness and
reclaim your health. New York: Avery.

FOUNDATION
Sapranaviciute, L. P. (2012). Central European Journal of Medicine.
Sapranaviciute, L. P. (2012). Central European Journal of Medicine.
⊘ This is a preview!⊘
Do you want full access?
Subscribe today to unlock all pages.
Trusted by 1+ million students worldwide
1 out of 12


Your All-in-One AI-Powered Toolkit for Academic Success.
+13062052269
info@desklib.com
Available 24*7 on WhatsApp / Email
![[object Object]](/_next/static/media/star-bottom.7253800d.svg)
Unlock your academic potential
Copyright © 2020–2026 A2Z Services. All Rights Reserved. Developed and managed by ZUCOL.