Exploring Graphs in Time Series Analysis: Advantages and Disadvantages

Verified

Added on  2023/06/08

|8
|1034
|444
Essay
AI Summary
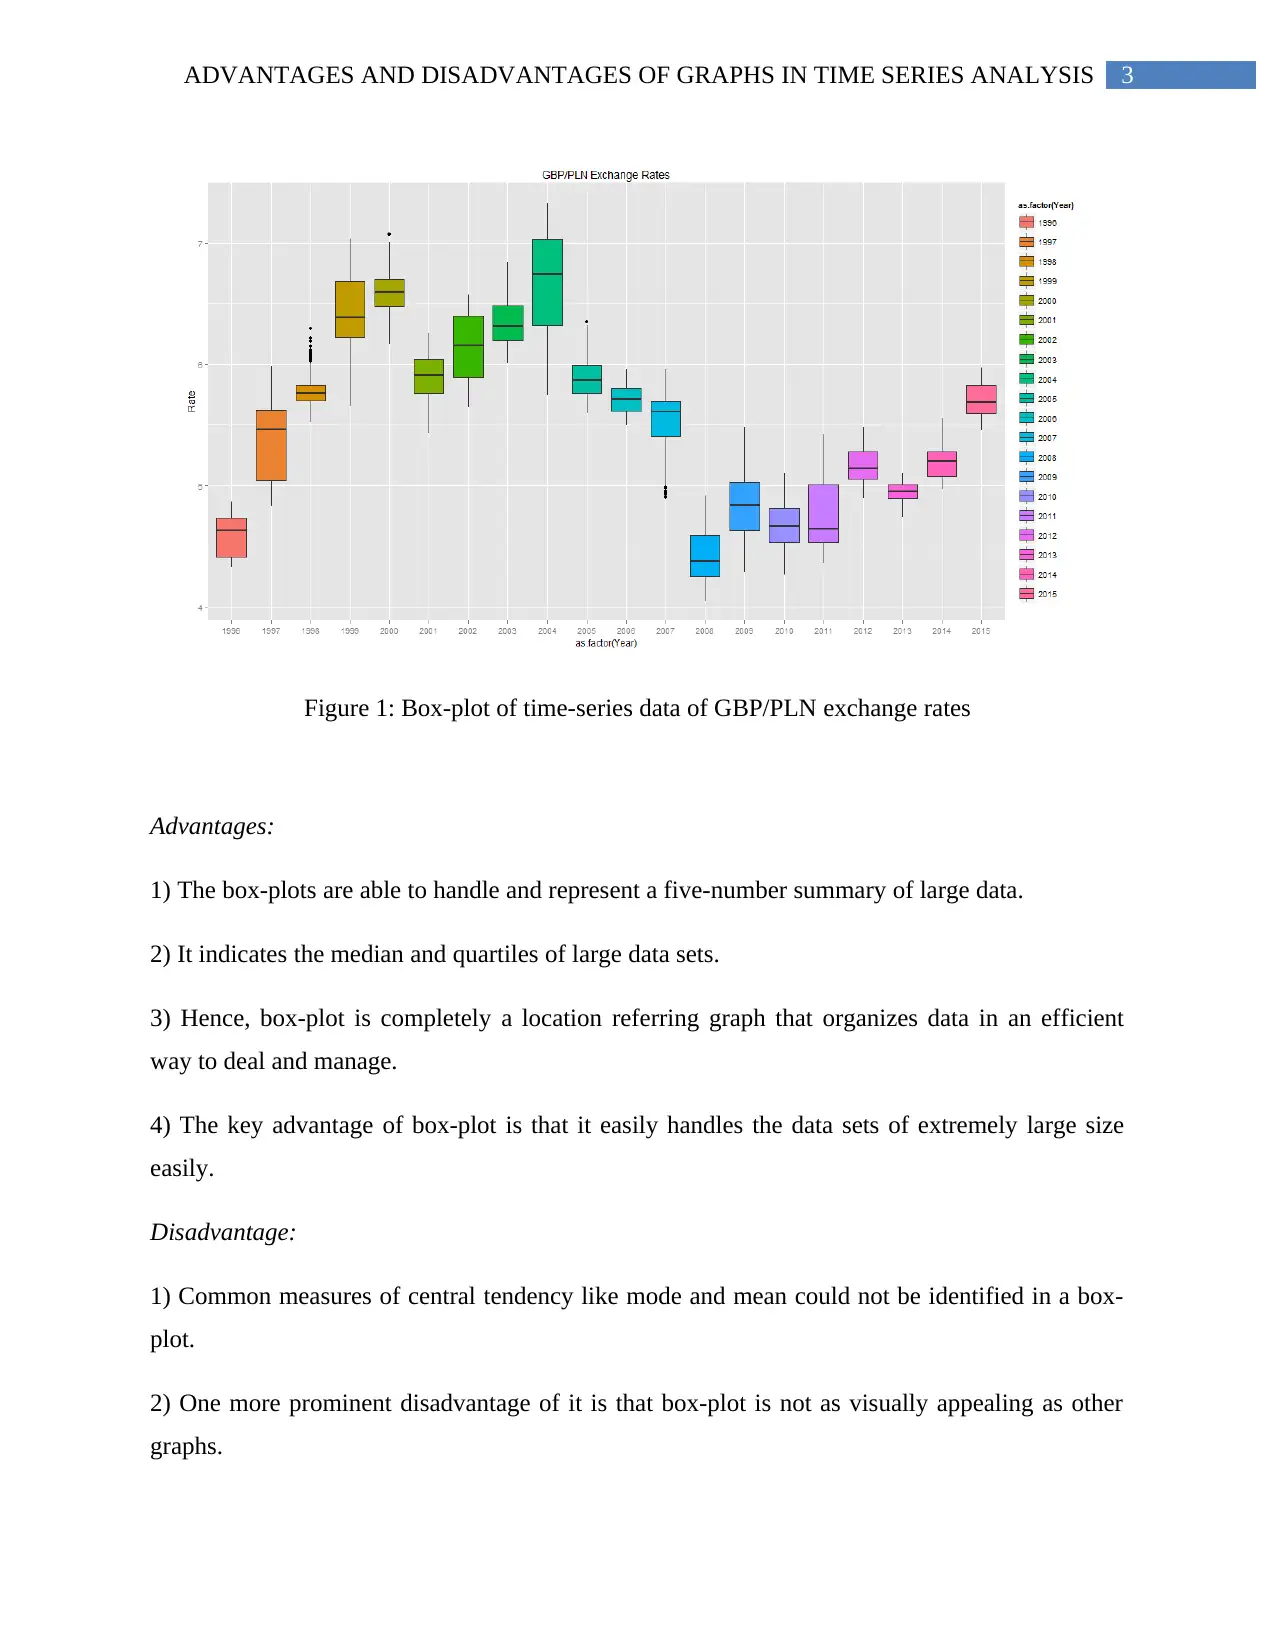
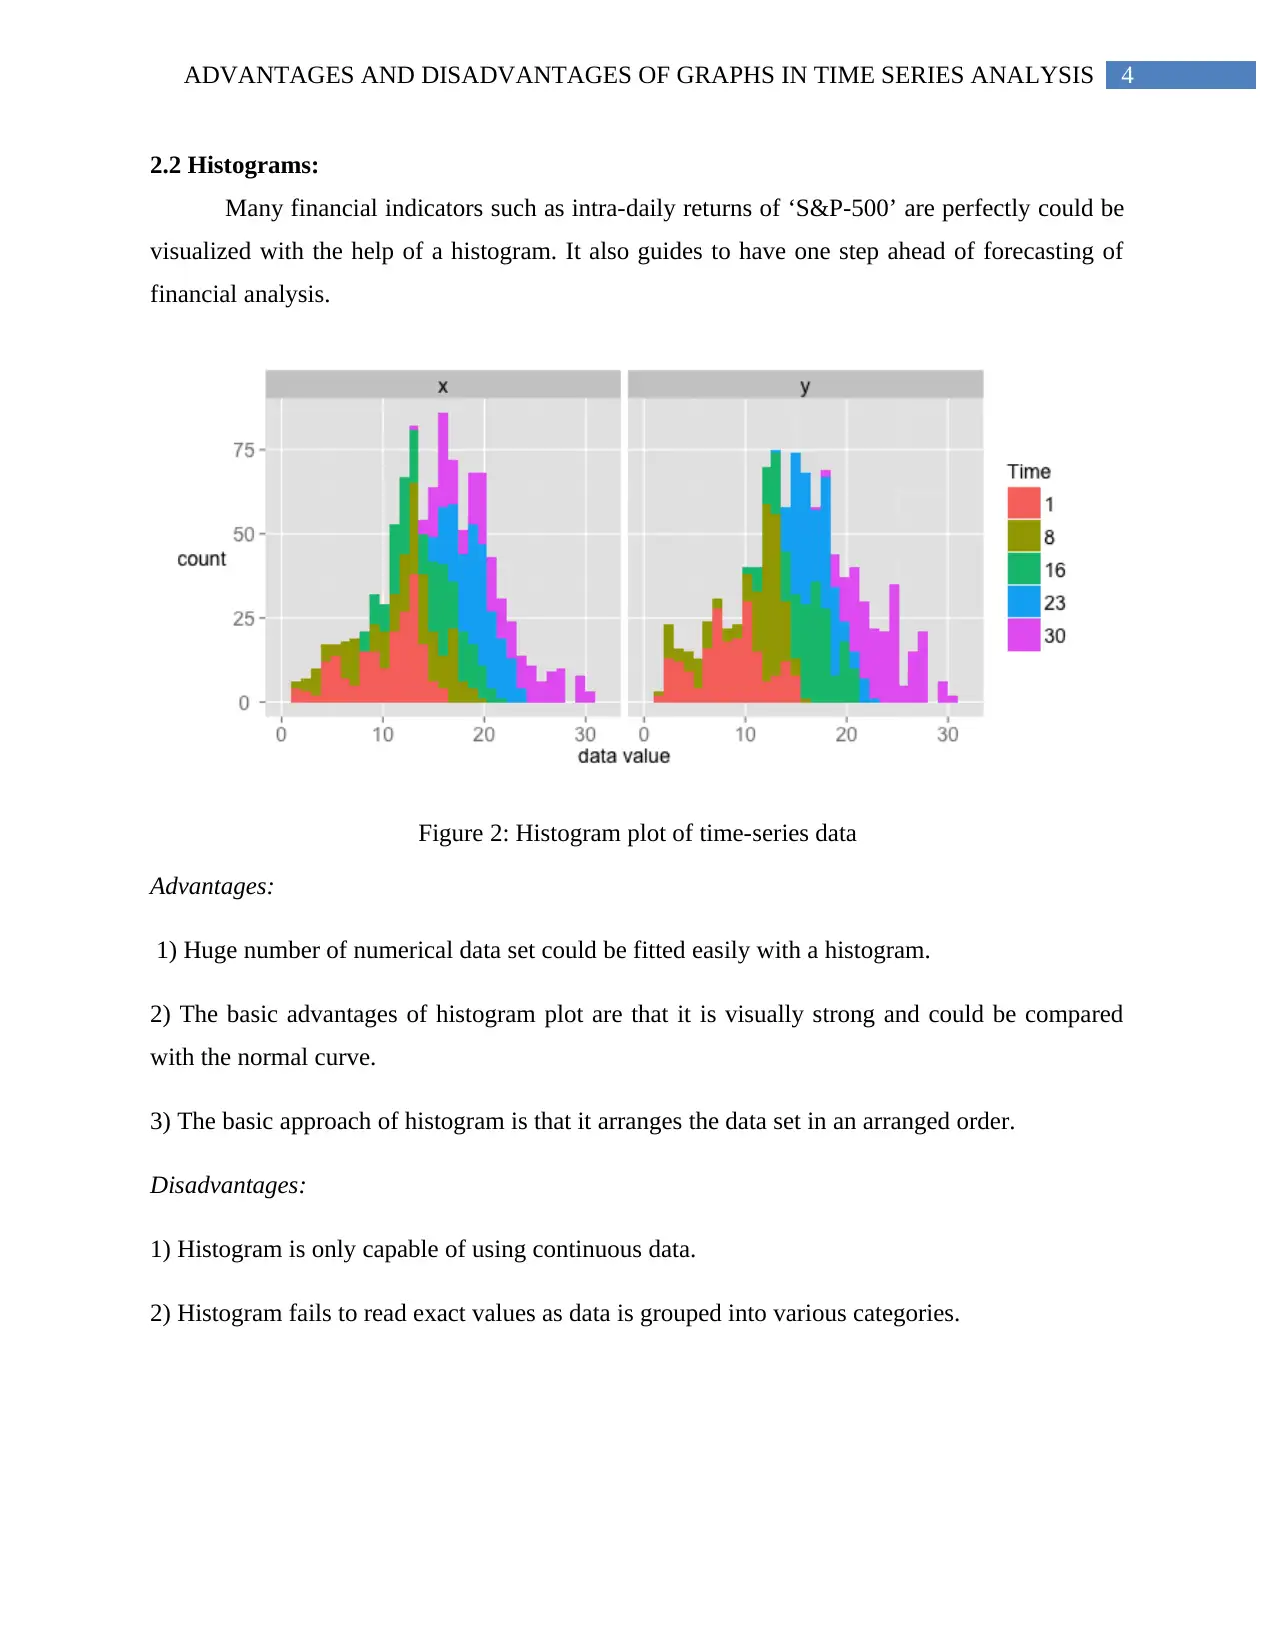
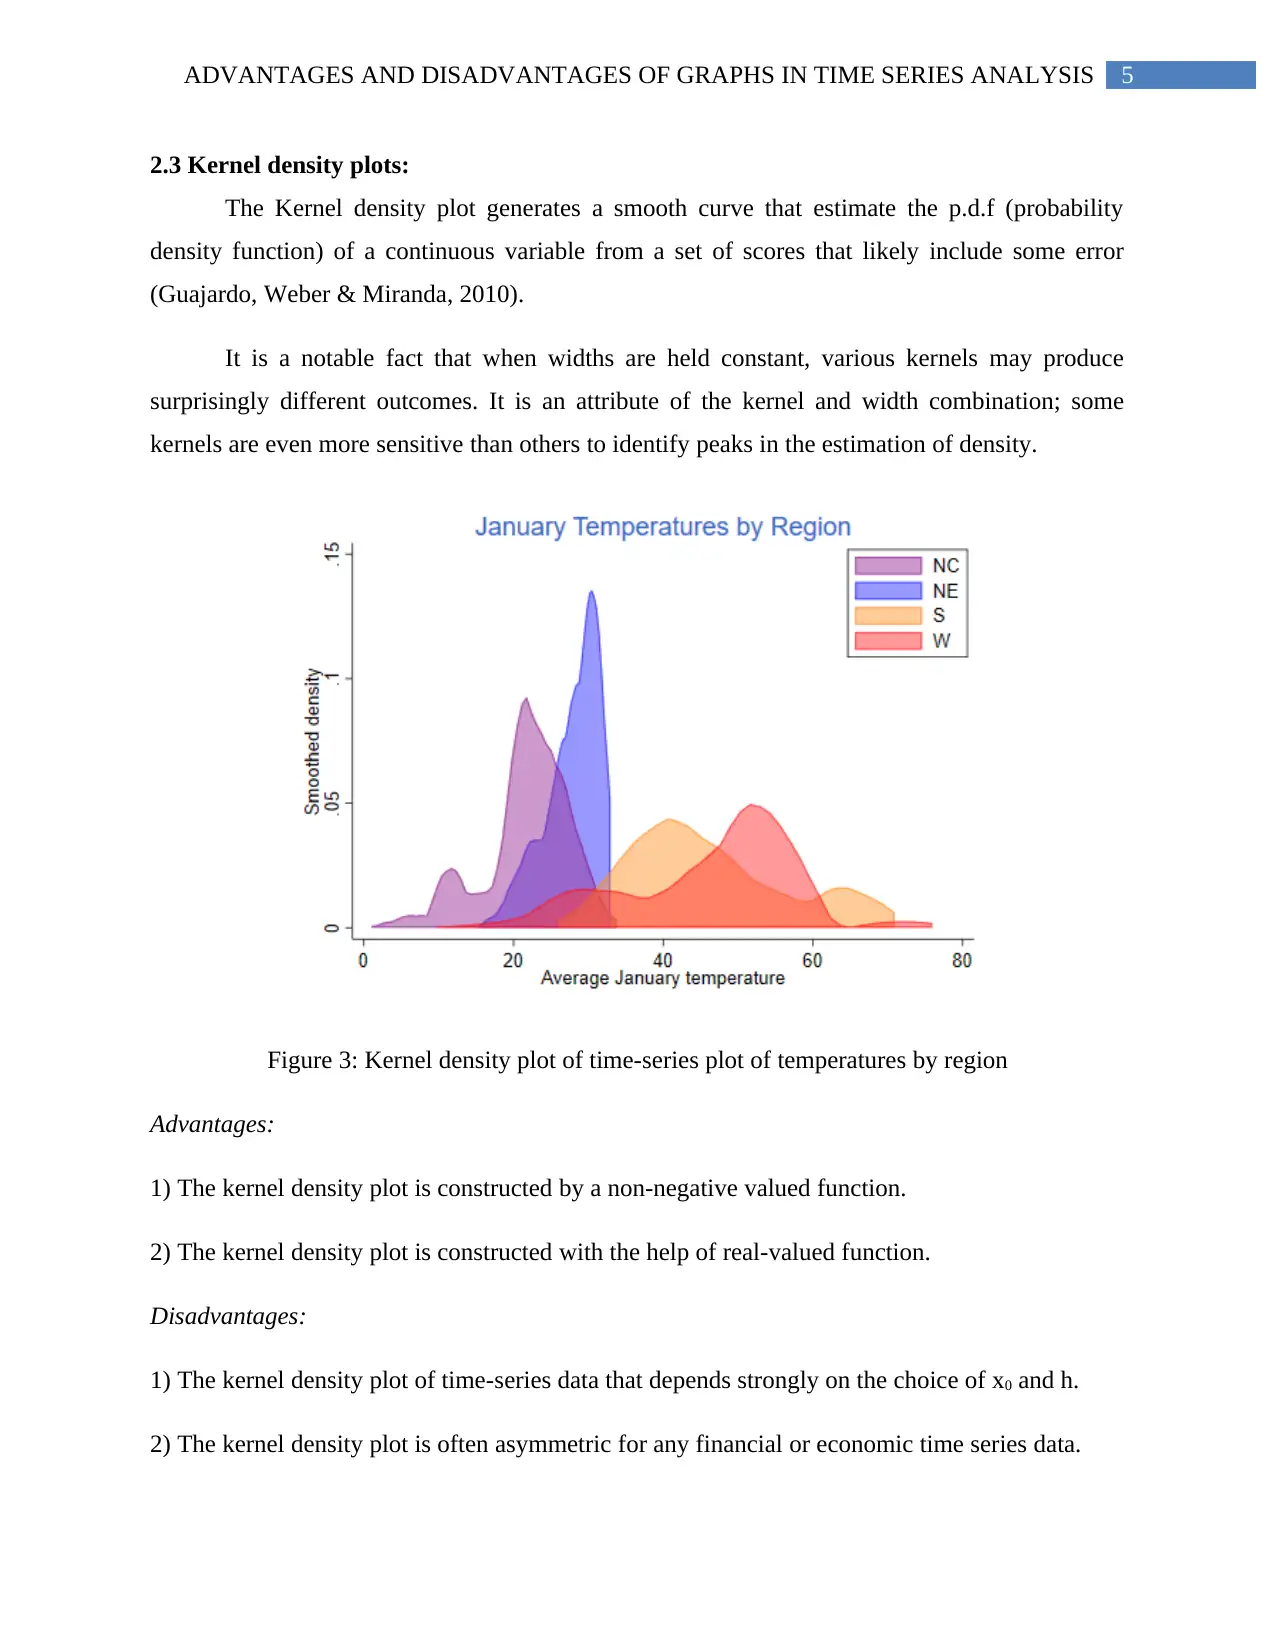
This essay provides a detailed analysis of the advantages and disadvantages of using various graphical plots in time series analysis. It focuses on boxplots, histograms, and kernel density plots, explaining how these tools are used for visual representation and analysis of time series data. The discussion covers the ability of boxplots to handle large datasets and represent five-number summaries, while also noting their limitations in displaying measures like mode and mean. Histograms are praised for their visual strength and ability to fit large numerical datasets, but criticized for only handling continuous data and failing to read exact values. Kernel density plots are examined for their ability to generate smooth curves and estimate probability density functions, with a focus on their dependence on parameter choices. The essay concludes by highlighting the effectiveness of box-whisker plots in identifying outliers and comparing data intervals, particularly in sectors like agriculture and industry, while also acknowledging the challenges of representing complex data like GDP and government expenditures using only histogram plots.
Document Page
Running Head: ADVANTAGES AND DISADVANTAGES OF GRAPHS IN TIME SERIES
ANALYSIS
Advantages and Disadvantages of Graphs in Time Series Analysis
Name of the student:
Name of the university:
Course ID:
tabler-icon-diamond-filled.svg

Paraphrase This Document

Need a fresh take? Get an instant paraphrase of this document with our AI Paraphraser
Document Page
1ADVANTAGES AND DISADVANTAGES OF GRAPHS IN TIME SERIES ANALYSIS
Table of Contents
1. Introduction and Background:.....................................................................................................2
2. Discussion:...................................................................................................................................2
2.1 Boxplots:................................................................................................................................2
2.2 Histograms:............................................................................................................................4
2.3 Kernel density plots:..............................................................................................................5
3. Summary:.....................................................................................................................................6
4. References:..................................................................................................................................7
Document Page
2ADVANTAGES AND DISADVANTAGES OF GRAPHS IN TIME SERIES ANALYSIS
1. Introduction and Background:
Graphical plots and charts are broadly utilized almost every kind of data or report and the
plots time series analysis is not an exception in that case. Generally graphical plots like boxplots,
histograms and kernel density plots are often utilized for visual representation and analysis of
time series data. Month or year wise plots can be extracted from economic or financial time
series data that is more vibrant and communicable.
2. Discussion:
The goal of time series plot is to investigate the inherent pattern of the data set. The
executive dashboards that consists various types of time series plots are beneficial for
interpreting a time-series data (Adhikari & Agrawal, 2013). The movement of closing price
indexes, year wise natural incidents (such as- rain, fire and snowfall) and population-oriented
indexes could be visualized with the help of daily histograms. Time series is no doubt a complex
field of data visualization that consists to study the evolution of one or more than one variables
through time.
2.1 Boxplots:
Box-plots are mainly the visualization of location measures. It includes the three quartiles
and terminal values of the data set.
Document Page
3ADVANTAGES AND DISADVANTAGES OF GRAPHS IN TIME SERIES ANALYSIS
Figure 1: Box-plot of time-series data of GBP/PLN exchange rates
Advantages:
1) The box-plots are able to handle and represent a five-number summary of large data.
2) It indicates the median and quartiles of large data sets.
3) Hence, box-plot is completely a location referring graph that organizes data in an efficient
way to deal and manage.
4) The key advantage of box-plot is that it easily handles the data sets of extremely large size
easily.
Disadvantage:
1) Common measures of central tendency like mode and mean could not be identified in a box-
plot.
2) One more prominent disadvantage of it is that box-plot is not as visually appealing as other
graphs.
tabler-icon-diamond-filled.svg

Paraphrase This Document

Need a fresh take? Get an instant paraphrase of this document with our AI Paraphraser
Document Page
4ADVANTAGES AND DISADVANTAGES OF GRAPHS IN TIME SERIES ANALYSIS
2.2 Histograms:
Many financial indicators such as intra-daily returns of ‘S&P-500’ are perfectly could be
visualized with the help of a histogram. It also guides to have one step ahead of forecasting of
financial analysis.
Figure 2: Histogram plot of time-series data
Advantages:
1) Huge number of numerical data set could be fitted easily with a histogram.
2) The basic advantages of histogram plot are that it is visually strong and could be compared
with the normal curve.
3) The basic approach of histogram is that it arranges the data set in an arranged order.
Disadvantages:
1) Histogram is only capable of using continuous data.
2) Histogram fails to read exact values as data is grouped into various categories.
Document Page
5ADVANTAGES AND DISADVANTAGES OF GRAPHS IN TIME SERIES ANALYSIS
2.3 Kernel density plots:
The Kernel density plot generates a smooth curve that estimate the p.d.f (probability
density function) of a continuous variable from a set of scores that likely include some error
(Guajardo, Weber & Miranda, 2010).
It is a notable fact that when widths are held constant, various kernels may produce
surprisingly different outcomes. It is an attribute of the kernel and width combination; some
kernels are even more sensitive than others to identify peaks in the estimation of density.
Figure 3: Kernel density plot of time-series plot of temperatures by region
Advantages:
1) The kernel density plot is constructed by a non-negative valued function.
2) The kernel density plot is constructed with the help of real-valued function.
Disadvantages:
1) The kernel density plot of time-series data that depends strongly on the choice of x0 and h.
2) The kernel density plot is often asymmetric for any financial or economic time series data.
Document Page
6ADVANTAGES AND DISADVANTAGES OF GRAPHS IN TIME SERIES ANALYSIS
3. Summary:
The concentration of time series data of agricultural sector of industrial sector are well
established by box-plots. The stock prices of different organizations could be created and
compared for each interval in a time series data visualized in a Box-Whisker plot (Box et al.,
2015). Box-whisker plot spot out the outliers and compares with the help of consistent intervals.
The monthly or quarterly data of ‘Gross domestic product’ (GDP), ‘Government consumption
expenditures’ and ‘Gross investment’ of any country could be easily shown in box-plot and
histogram which would be complicated to show with the help of histogram plots.
tabler-icon-diamond-filled.svg

Paraphrase This Document

Need a fresh take? Get an instant paraphrase of this document with our AI Paraphraser
Document Page
7ADVANTAGES AND DISADVANTAGES OF GRAPHS IN TIME SERIES ANALYSIS
4. References:
Adhikari, R., & Agrawal, R. K. (2013). An introductory study on time series modeling and
forecasting. arXiv preprint arXiv:1302.6613.
Box, G. E., Jenkins, G. M., Reinsel, G. C., & Ljung, G. M. (2015). Time series analysis:
forecasting and control. John Wiley & Sons.
Guajardo, J. A., Weber, R., & Miranda, J. (2010). A model updating strategy for predicting time
series with seasonal patterns. Applied Soft Computing, 10(1), 276-283.
chevron_up_icon
1 out of 8
circle_padding
hide_on_mobile
zoom_out_icon
[object Object]