Gross Savings (% GNI) - A Comparison of Hungary and Morocco
Added on 2023-05-30
25 Pages5304 Words494 Views
Student’s Surname, First name Name of module
Table of Contents
Introduction.......................................................................................................................................................... 3
Comparison of gross savings......................................................................................................................... 5
Descriptive statistics......................................................................................................................................... 5
Comparison between gross savings for Morocco and the world..................................................5
Comparison between gross savings for Hungary and the world...................................................6
Comparison between gross savings for Hungary and Morocco.....................................................6
Conclusions........................................................................................................................................................... 6
References.............................................................................................................................................................. 7
Appendix 1............................................................................................................................................................. 8
2
Student’s Surname, First name Name of module
Introduction
The gross national income (GNI) alludes to the aggregate local and outside yield guaranteed
by inhabitants of a nation (Omondi-Ochieng, 2015)which is calculated as;
GNI=Gross Domestic Product (GDP)+ factor salaries earned by outside inhabitants –
salary earned∈the nation by nonnatives
As opposed to the Gross Domestic Product which just estimates the income of people inside a
specific nation, Gross National Income estimates all the pay of a nation's occupants and
organizations, paying little respect to where it is created (Victor Levin, 2012).
As opposed to the GDP, GNI gives a decent gauge of a nation's national earnings (Naizhuo
Zhao, 2011). In many developing markets, inhabitants move to different nations where they
can procure a superior living. They send loads of cash back to their families in their home
district. This income is sufficient to drive financial development. It's tallied in Gross National
Income (GNI) and Gross National Product (GNP), however not in Gross Domestic Product
(GDP). Subsequently, correlations of GDP by nation will downplay the measure of these
nations' economies (COLEMAN, 2008).
The World Bank gives GNI information to all nations. To think about income between
countries, it expels the impacts of money trade rates (Hodges, 2014). For most countries there
is little distinction among GDP and GNI, since the contrast between income gotten by the
nation versus income made from other parts of the world tends not to be noteworthy
(Chukwu, 2010). For example, the U.S's. GNI was just about 1.5% higher than its GDP in
2011, as indicated by the World Bank.
For a few nations, in any case, the thing that matters is huge: GNI can be a lot higher than
GDP if a nation gets a lot of remote assistance, just like the case with East Timor. It very well
3
Student’s Surname, First name Name of module
may be much lower if outsiders control a vast extent of a nation's creation, just like the case
with Ireland, a low-impose ward where the European backups of a few global organizations
(ostensibly) are domiciled.
Estimating GNI per capita might be the most ideal approach to think about GNI between nations. This
technique calls for partitioning a nation's monetary yield by its populace (Cebula, 2014).
GNI per capita is an estimation of income partitioned by the quantity of individuals in the nation. It
contrasts the GNI of nations and distinctive populace sizes and ways of life.
The World Bank gives this information too. For this situation, it changes over income to U.S. dollars
utilizing the official conversion standard. It at that point applies the Atlas transformation strategy to
smooth out swapping scale unpredictability. It then partitions the GNI by the nation's populace to get
GNI per capita. This is done utilizing the nation's information from the center of the year to eliminate
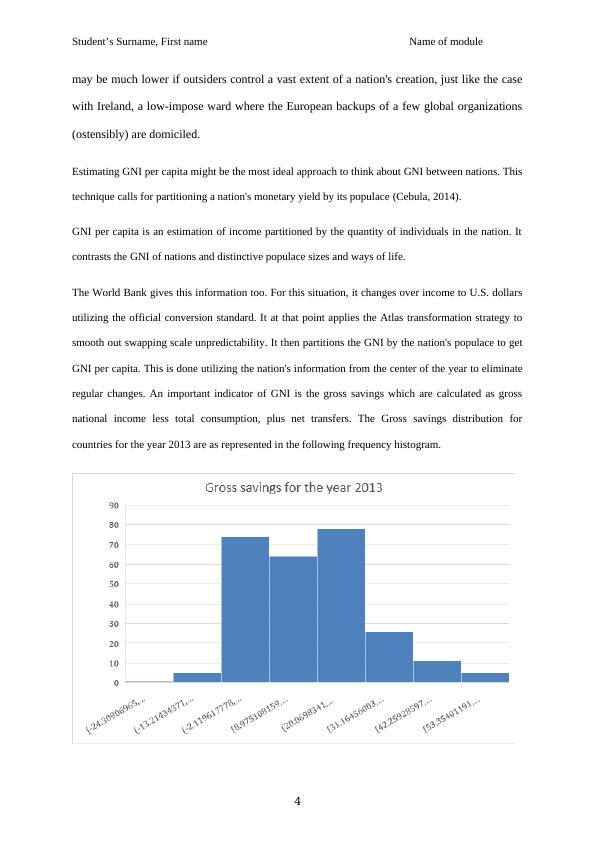
regular changes. An important indicator of GNI is the gross savings which are calculated as gross
national income less total consumption, plus net transfers. The Gross savings distribution for
countries for the year 2013 are as represented in the following frequency histogram.
4
may be much lower if outsiders control a vast extent of a nation's creation, just like the case
with Ireland, a low-impose ward where the European backups of a few global organizations
(ostensibly) are domiciled.
Estimating GNI per capita might be the most ideal approach to think about GNI between nations. This
technique calls for partitioning a nation's monetary yield by its populace (Cebula, 2014).
GNI per capita is an estimation of income partitioned by the quantity of individuals in the nation. It
contrasts the GNI of nations and distinctive populace sizes and ways of life.
The World Bank gives this information too. For this situation, it changes over income to U.S. dollars
utilizing the official conversion standard. It at that point applies the Atlas transformation strategy to
smooth out swapping scale unpredictability. It then partitions the GNI by the nation's populace to get
GNI per capita. This is done utilizing the nation's information from the center of the year to eliminate
regular changes. An important indicator of GNI is the gross savings which are calculated as gross
national income less total consumption, plus net transfers. The Gross savings distribution for
countries for the year 2013 are as represented in the following frequency histogram.
4
Student’s Surname, First name Name of module
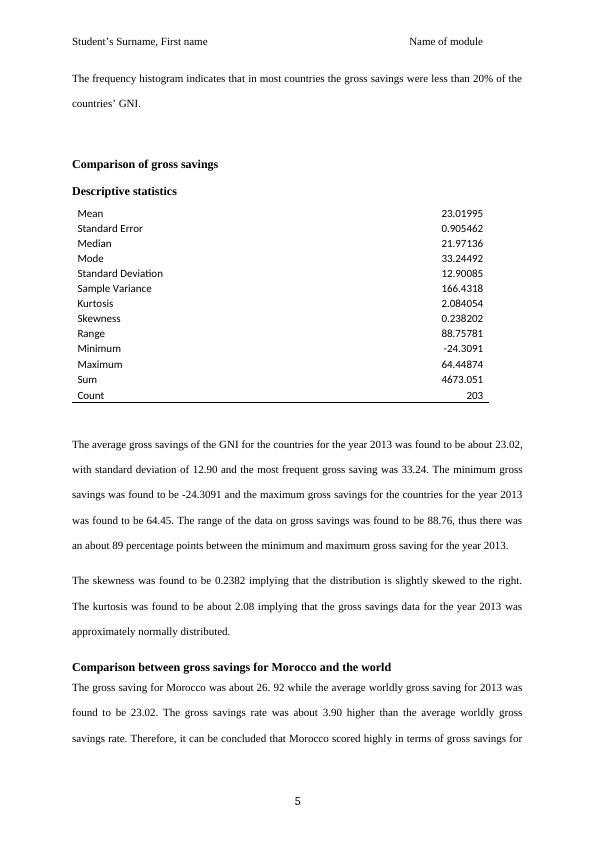
The frequency histogram indicates that in most countries the gross savings were less than 20% of the
countries’ GNI.
Comparison of gross savings
Descriptive statistics
Mean 23.01995
Standard Error 0.905462
Median 21.97136
Mode 33.24492
Standard Deviation 12.90085
Sample Variance 166.4318
Kurtosis 2.084054
Skewness 0.238202
Range 88.75781
Minimum -24.3091
Maximum 64.44874
Sum 4673.051
Count 203
The average gross savings of the GNI for the countries for the year 2013 was found to be about 23.02,
with standard deviation of 12.90 and the most frequent gross saving was 33.24. The minimum gross
savings was found to be -24.3091 and the maximum gross savings for the countries for the year 2013
was found to be 64.45. The range of the data on gross savings was found to be 88.76, thus there was
an about 89 percentage points between the minimum and maximum gross saving for the year 2013.
The skewness was found to be 0.2382 implying that the distribution is slightly skewed to the right.
The kurtosis was found to be about 2.08 implying that the gross savings data for the year 2013 was
approximately normally distributed.
Comparison between gross savings for Morocco and the world
The gross saving for Morocco was about 26. 92 while the average worldly gross saving for 2013 was
found to be 23.02. The gross savings rate was about 3.90 higher than the average worldly gross
savings rate. Therefore, it can be concluded that Morocco scored highly in terms of gross savings for
5
Student’s Surname, First name Name of module
the year 2013. Comparing with other nations, Morocco had a high gross saving rate compared to
many countries in the world.
Comparison between gross savings for Hungary and the world
The gross savings rate for Hungary for the year 2013 was 25.20. This value is higher than the worldly
gross savings rate average. The Hungary gross savings rate for the year 2013 was about 2.18 higher
than the worldly average rate. Hungary therefore can be said to score highly than most countries in the
world for the year 2013.
Comparison between gross savings for Hungary and Morocco
The gross savings rate for Morocco for the year 2013 was greater than the gross savings rate for
Hungary for the same year. Morocco’s rate was higher than Hungary’s rate by about 1.72%.
Conclusions
From our findings, we can conclude that both Hungary and Morocco had gross savings higher than
the worldly gross savings average for the year 2018.
National reserve funds are maintainable just insofar as the rate of profit for the residential speculation
is adequate to benefit the outside obligation. National sparing deficiencies, on this view, are just an
issue if the elements of outer obligation compromise sustainability. International financial market
incorporation have so far maintained the capital streams important to permit holding on national
savings, but, because of the interest-rate and exchange-rate implications, concern has been expressed
about the continued financing of such gaps.
6
End of preview
Want to access all the pages? Upload your documents or become a member.
Related Documents
A Comparison and Contrast between California, Hawaii, Florida, New York and New Jerseylg...
|8
|1797
|362