QMTH 104: Analyzing Factors Influencing Gym Usage in Australian Cities
VerifiedAdded on 2023/06/11
|16
|2350
|382
Report
AI Summary
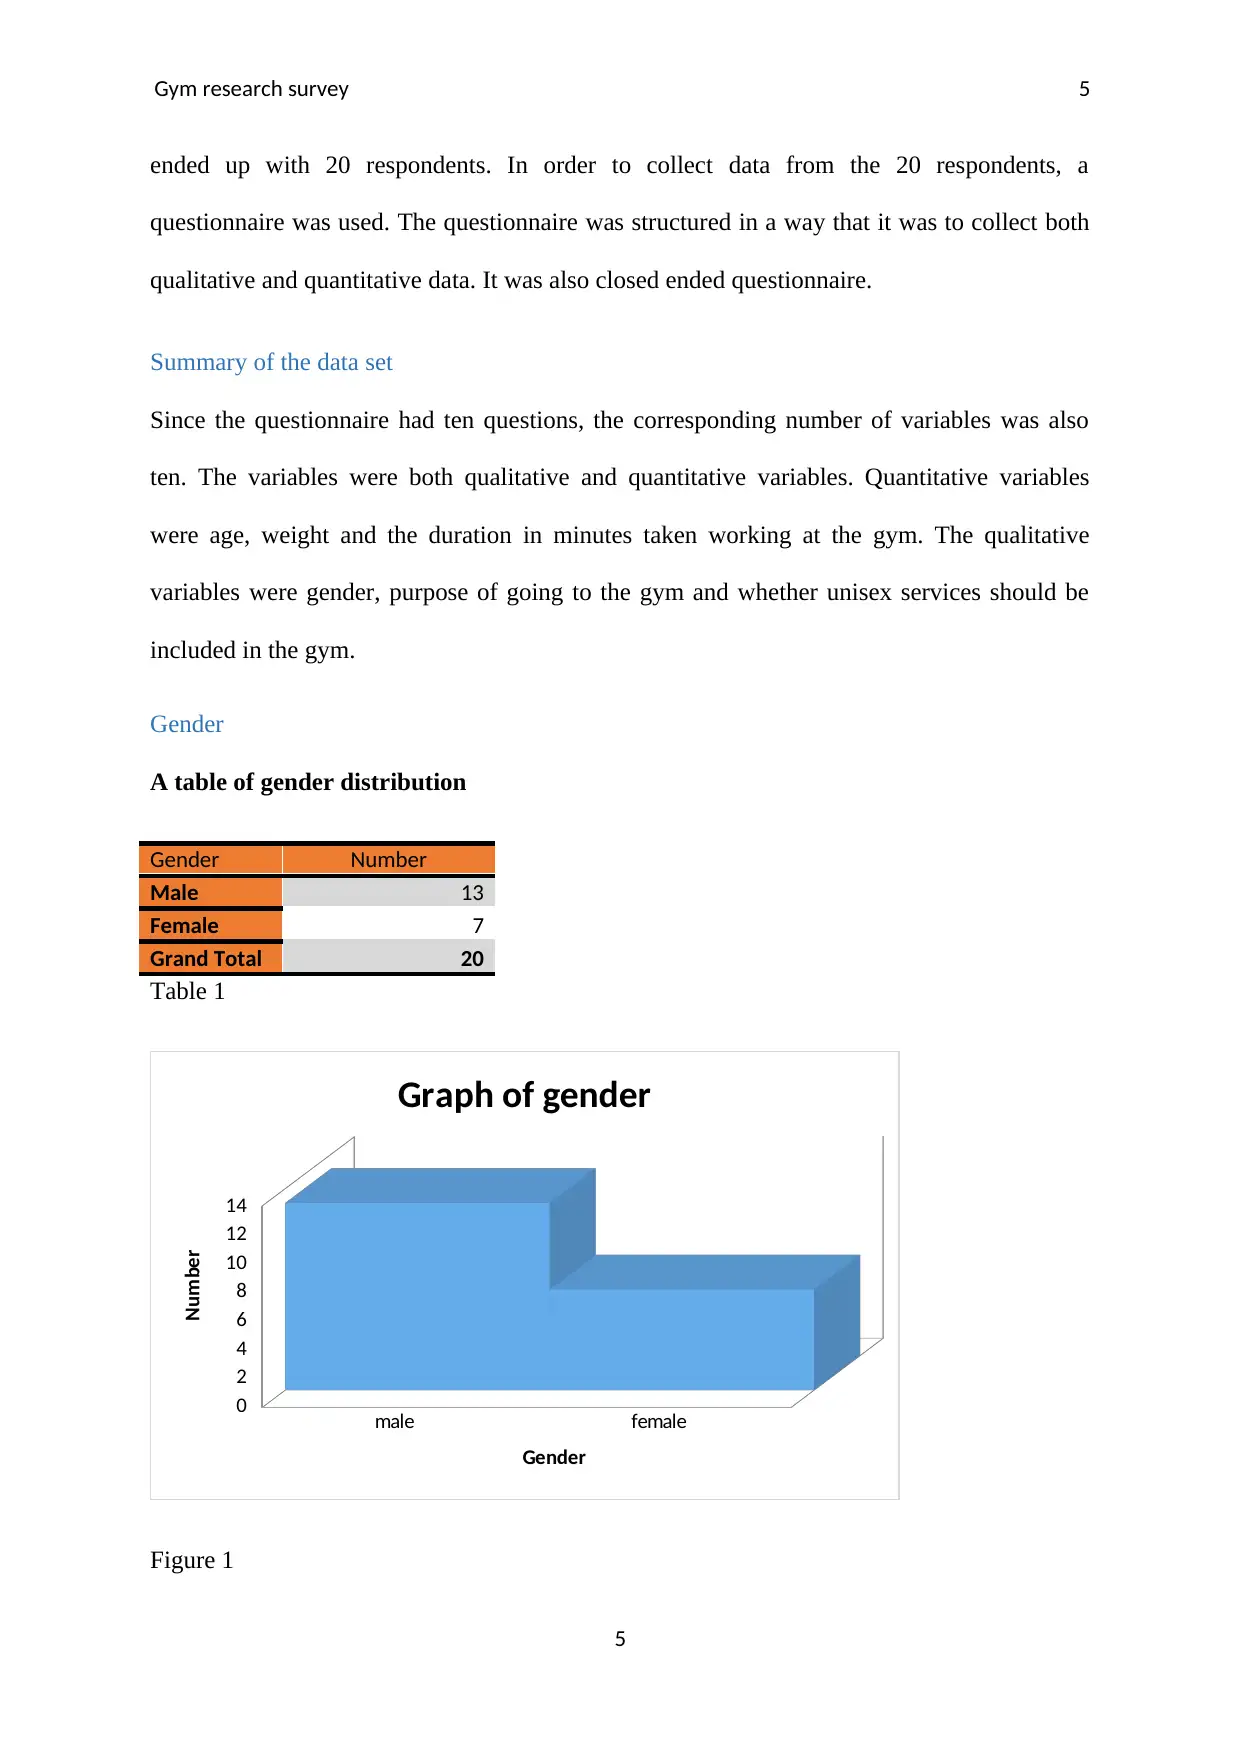
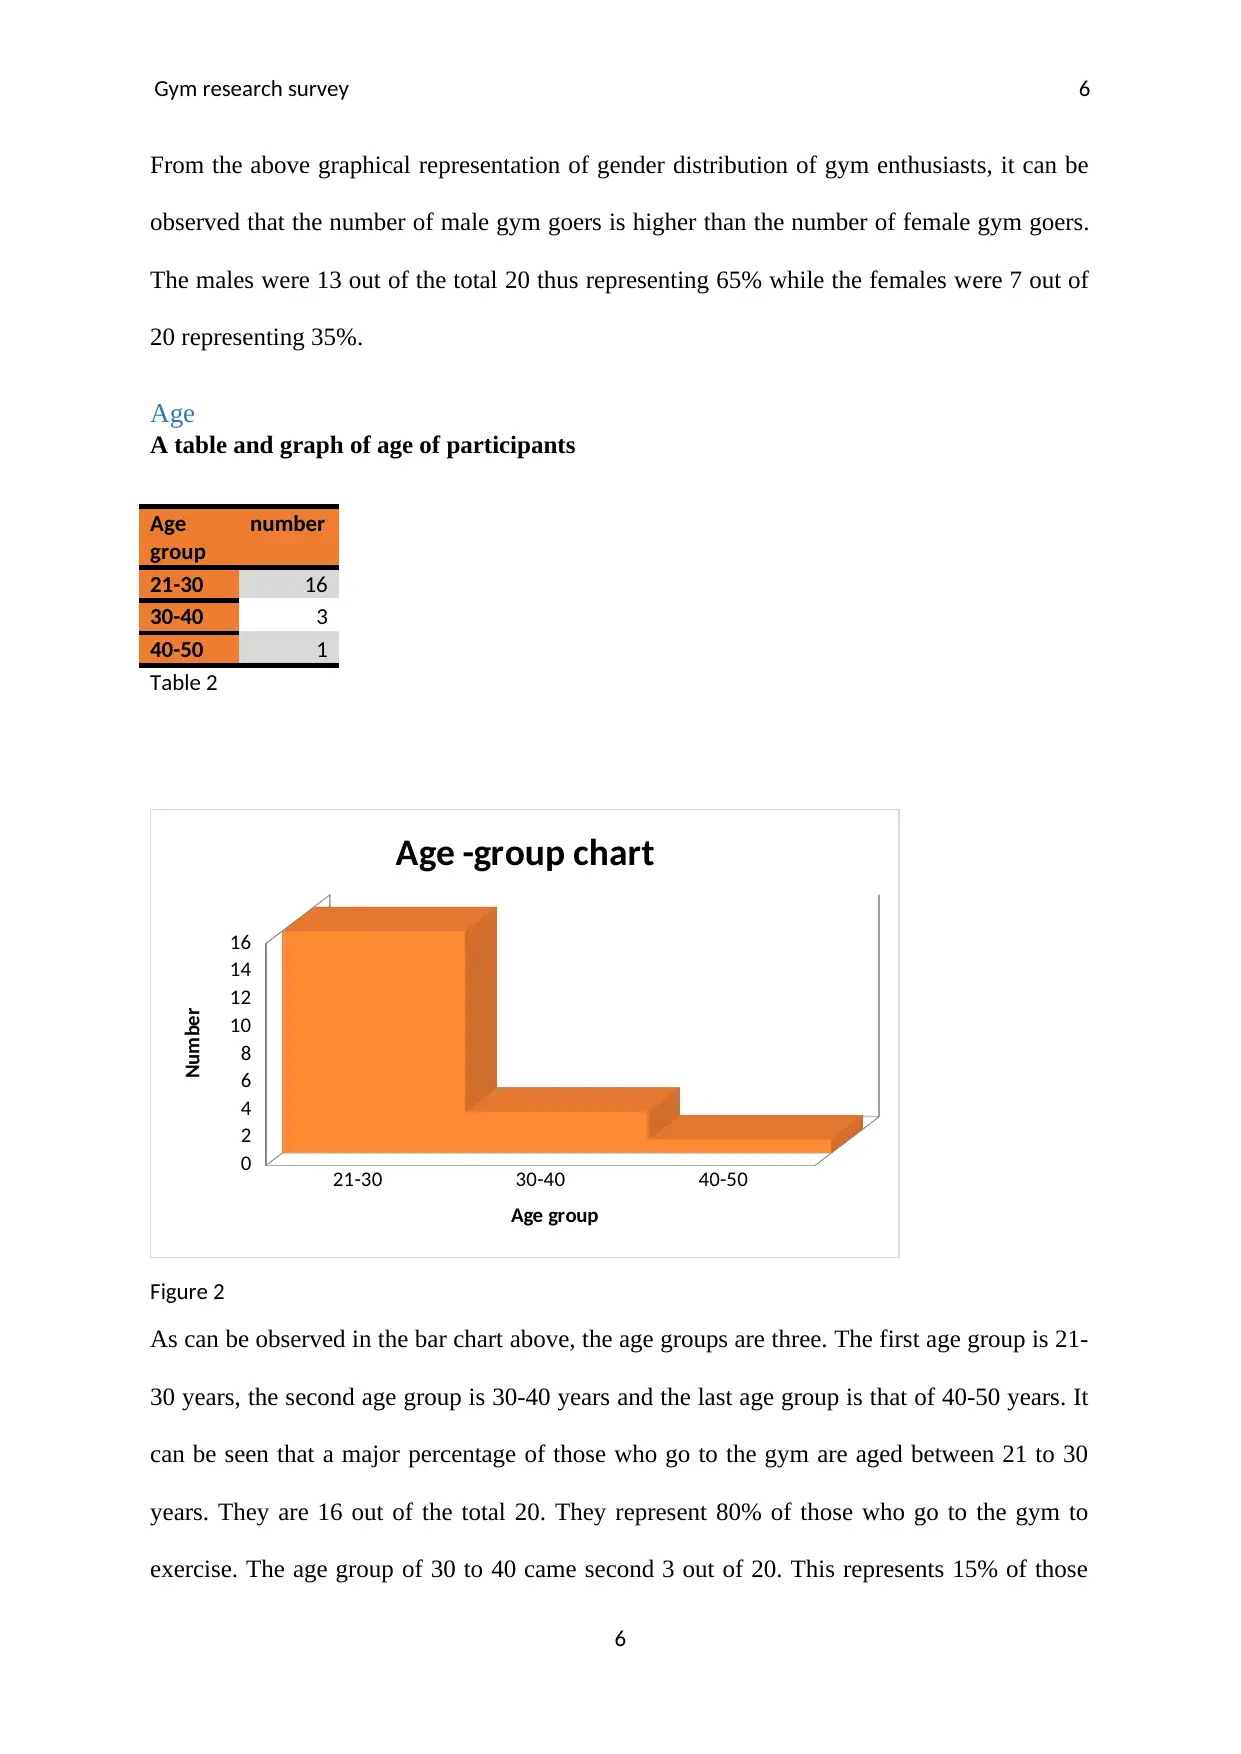
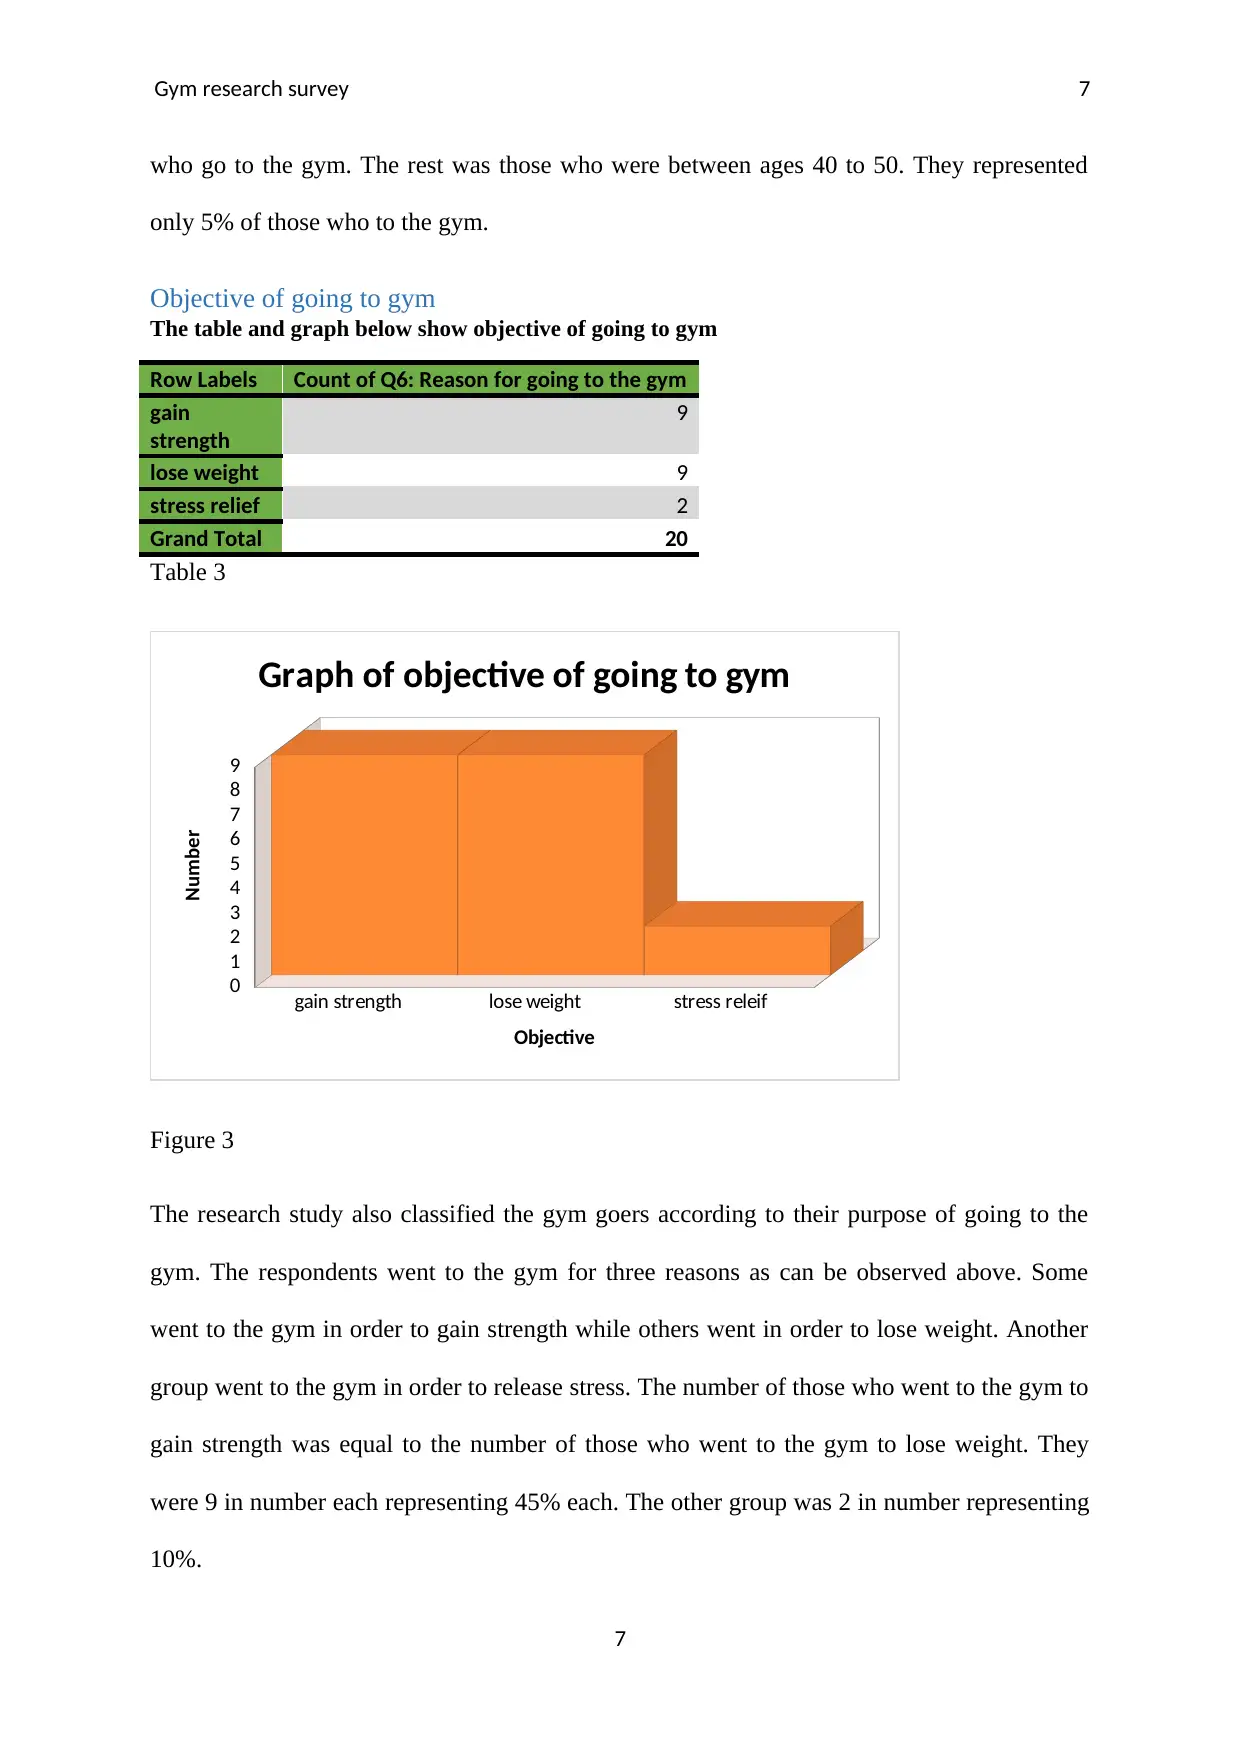
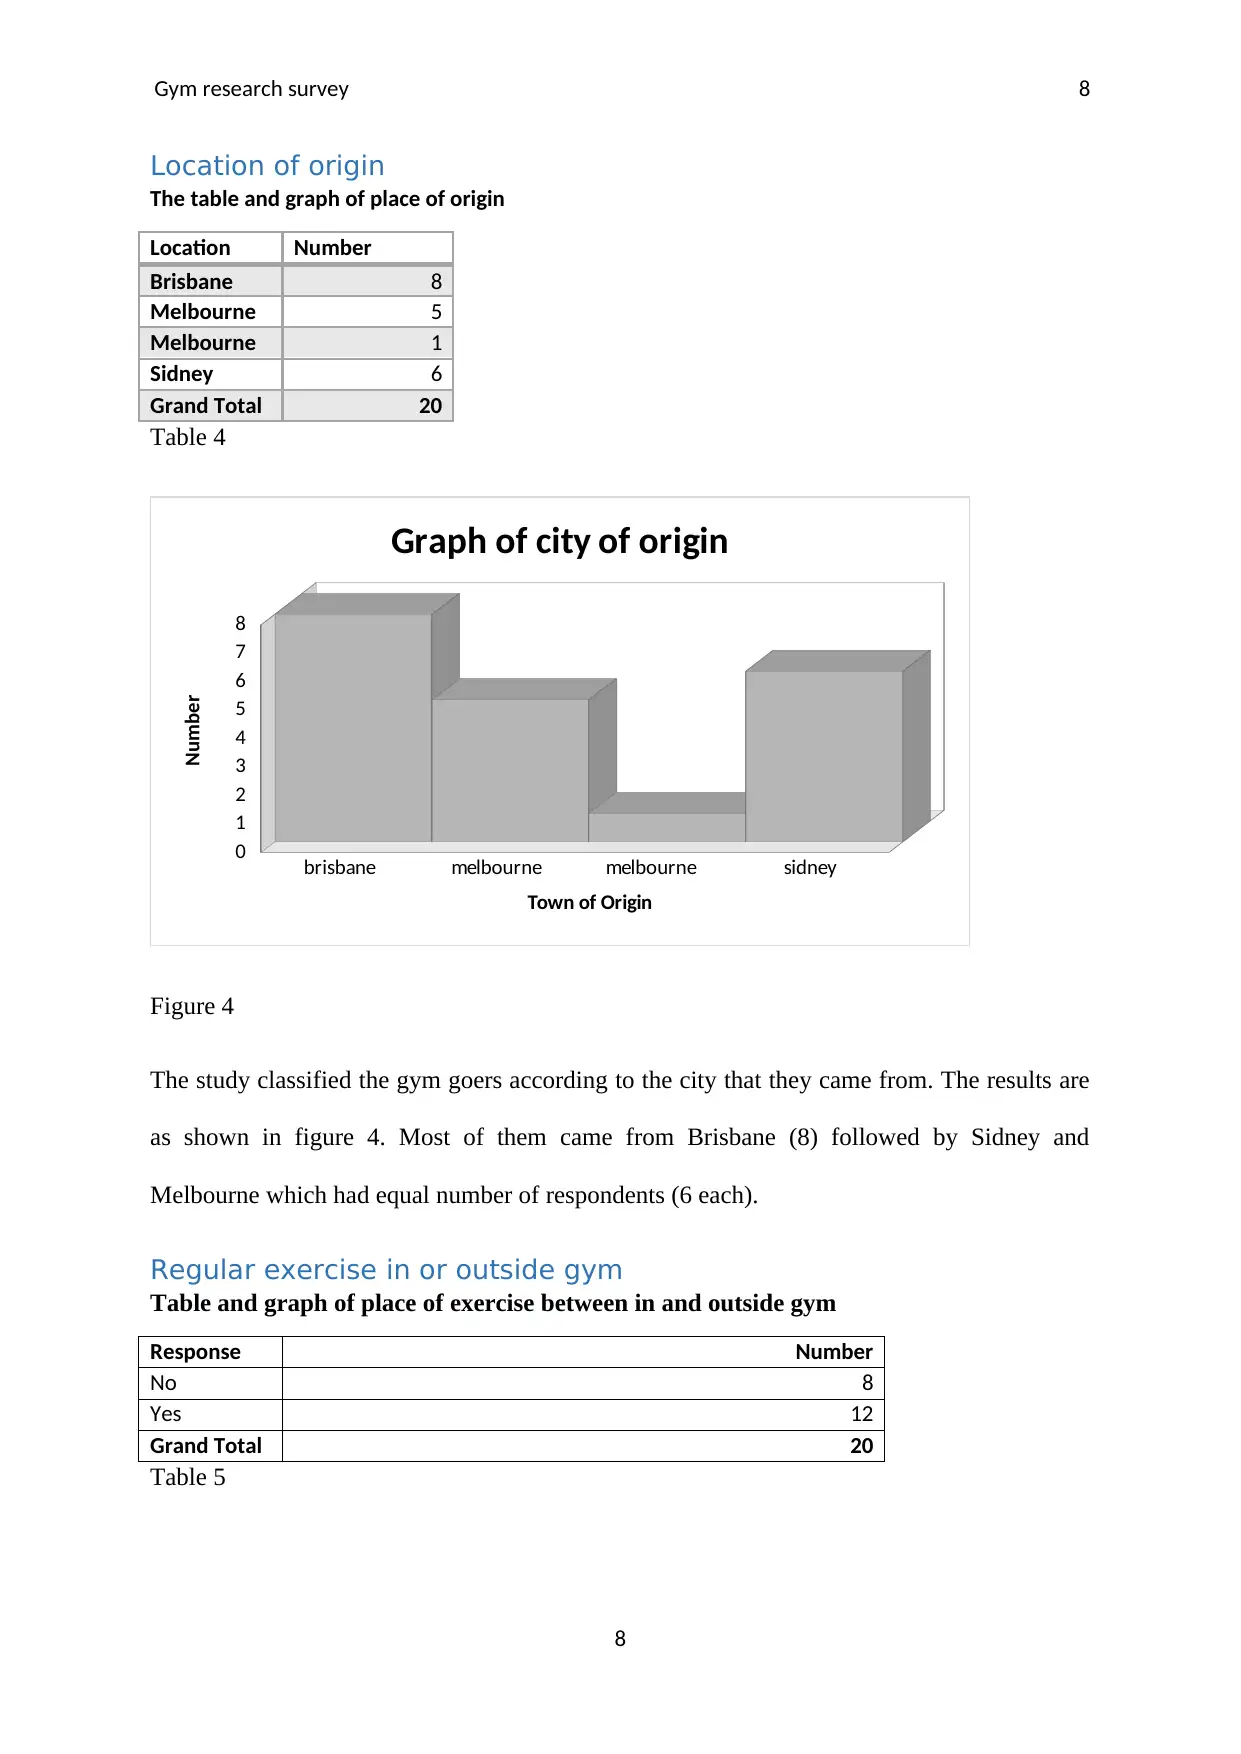
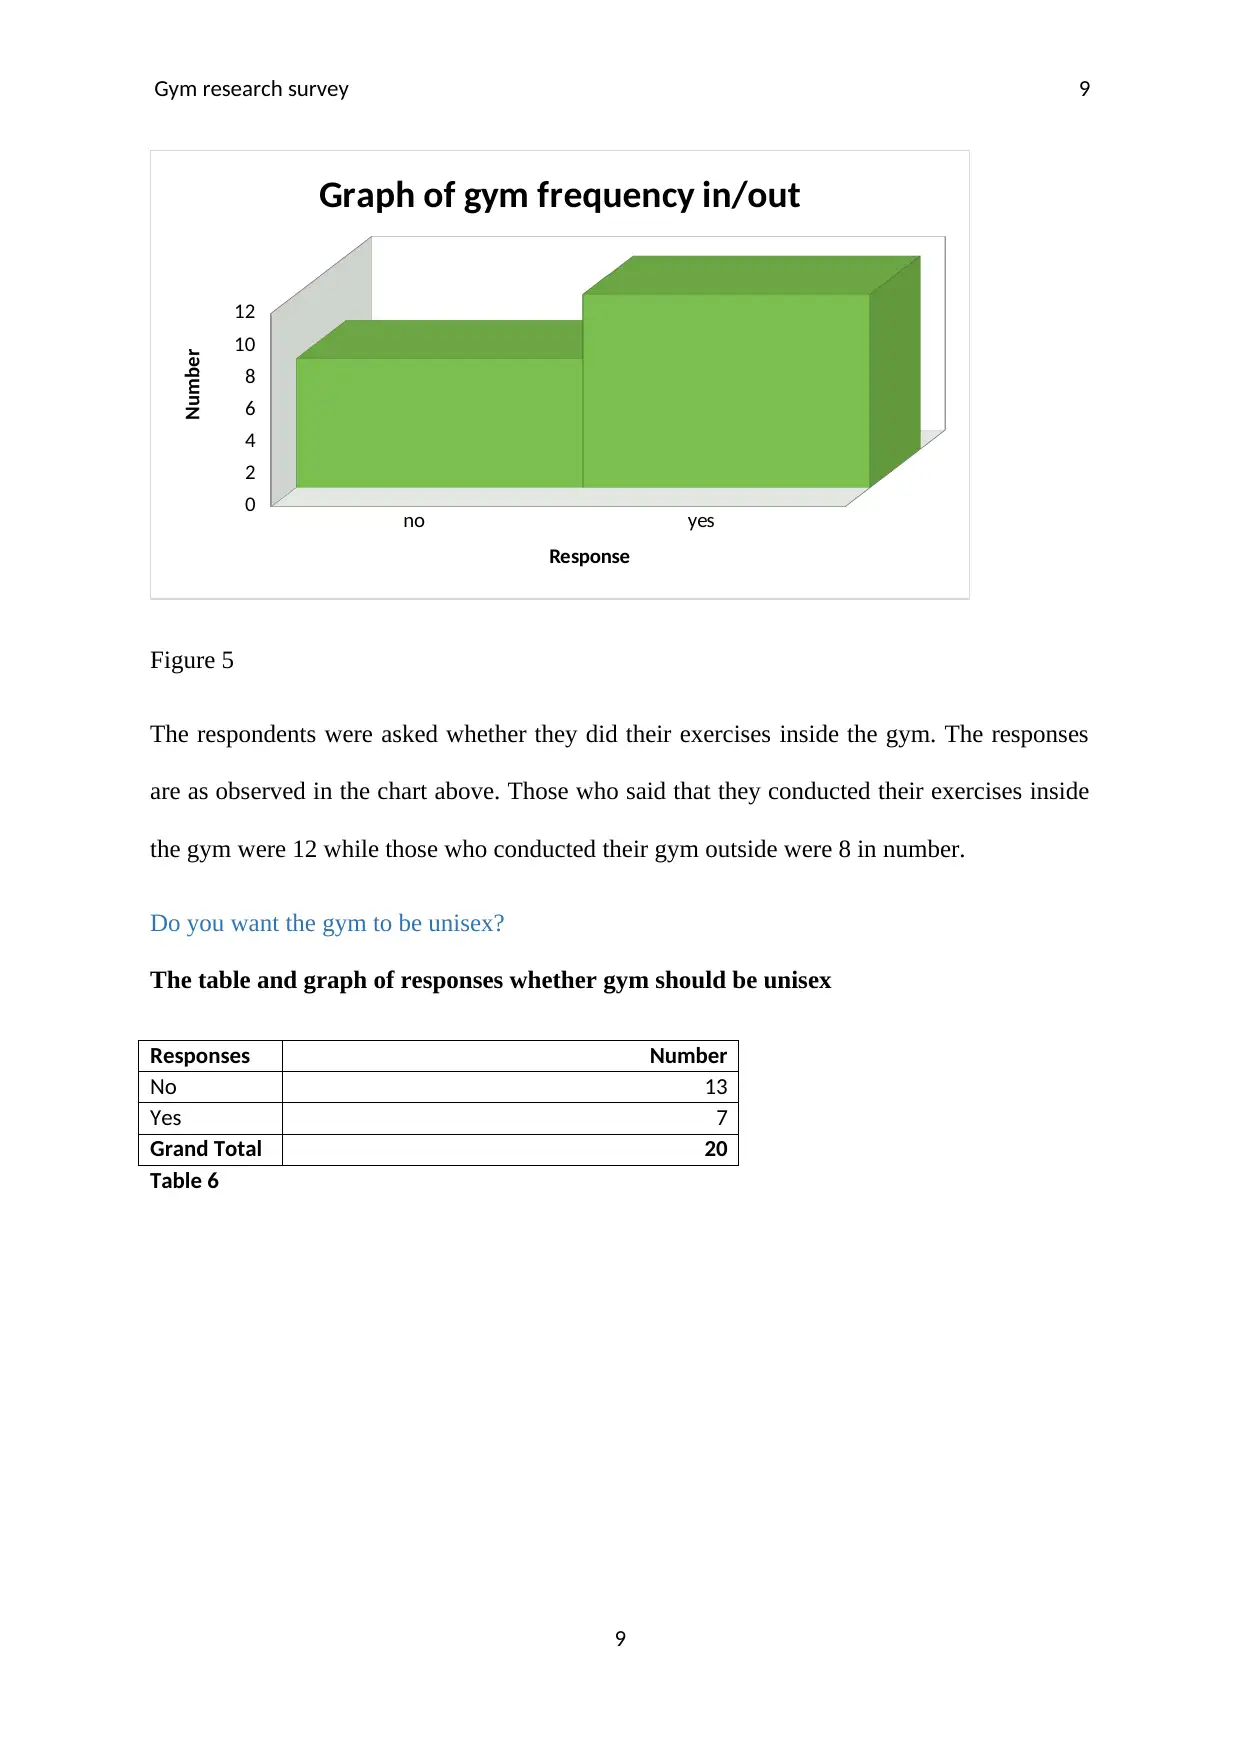
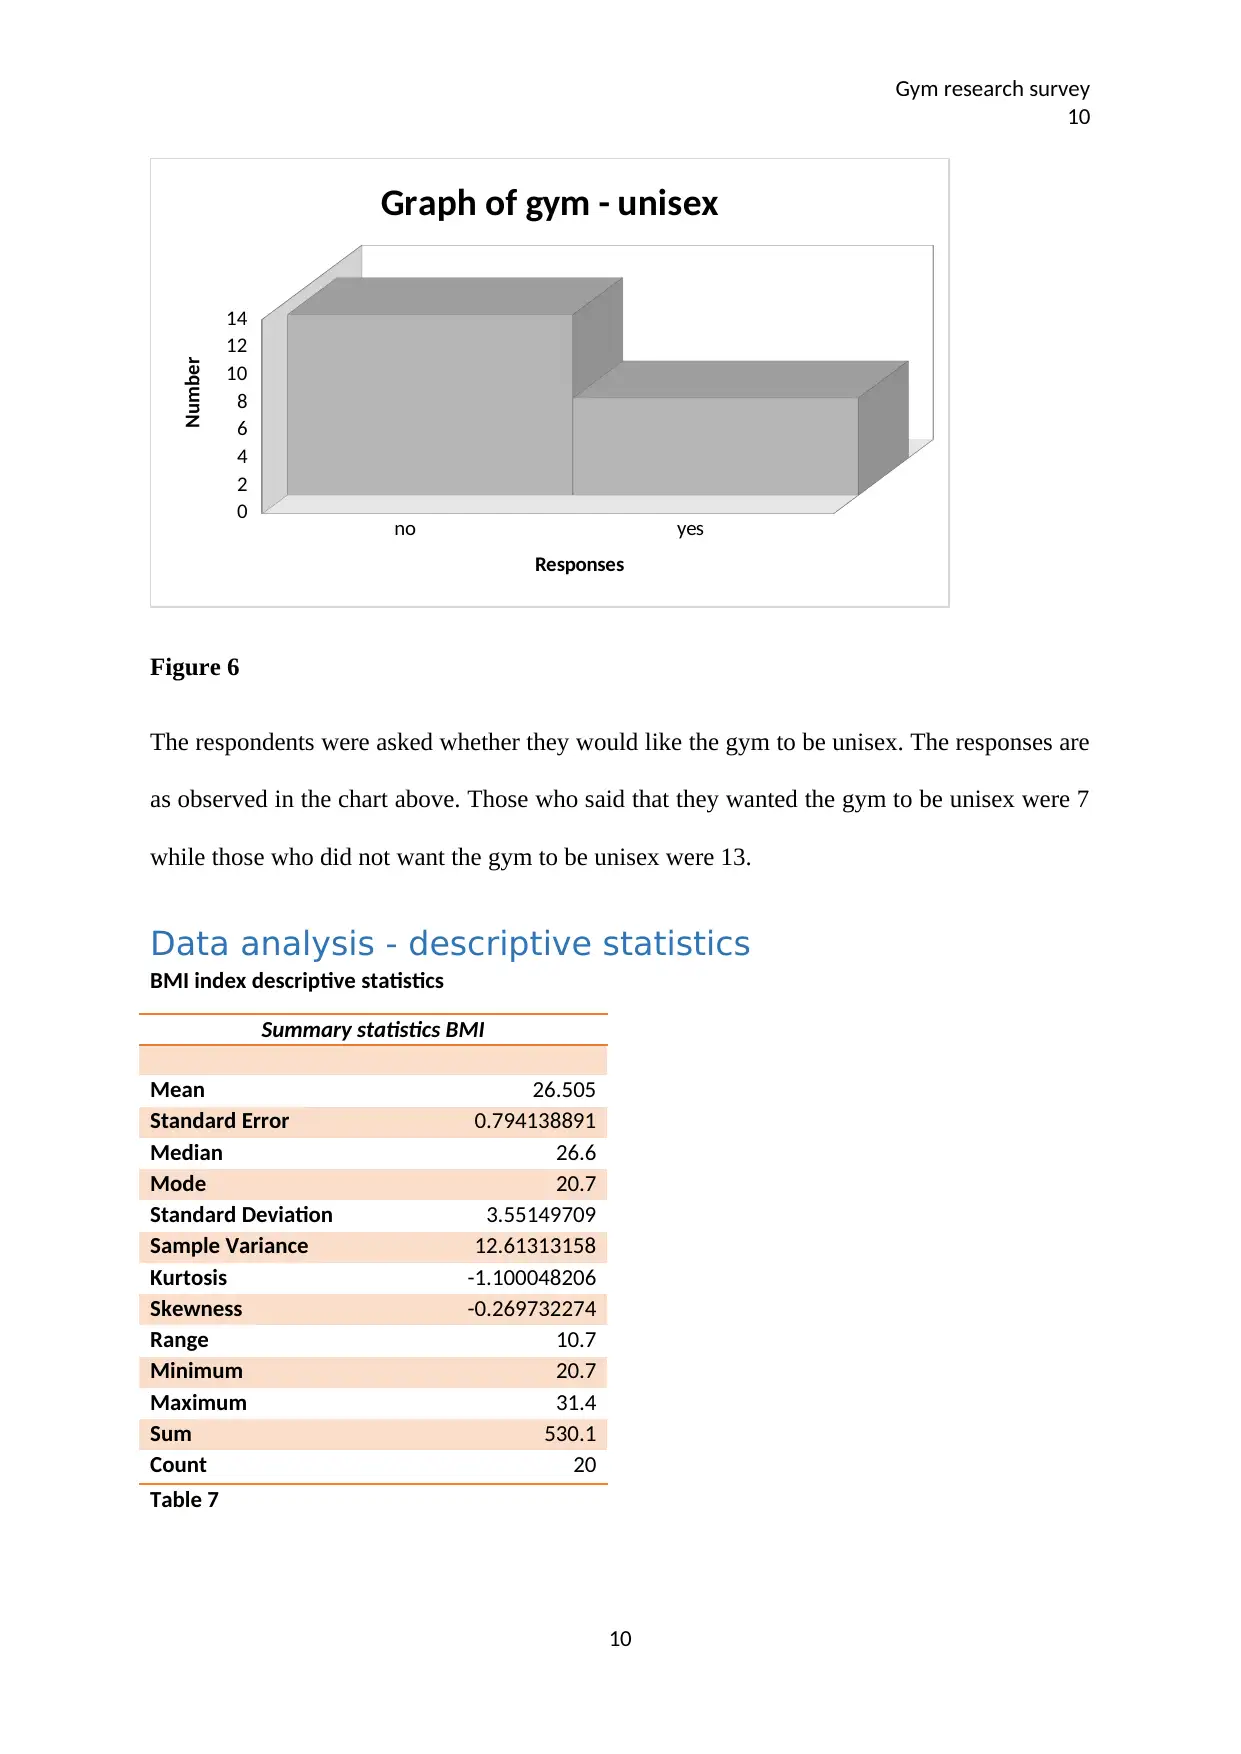
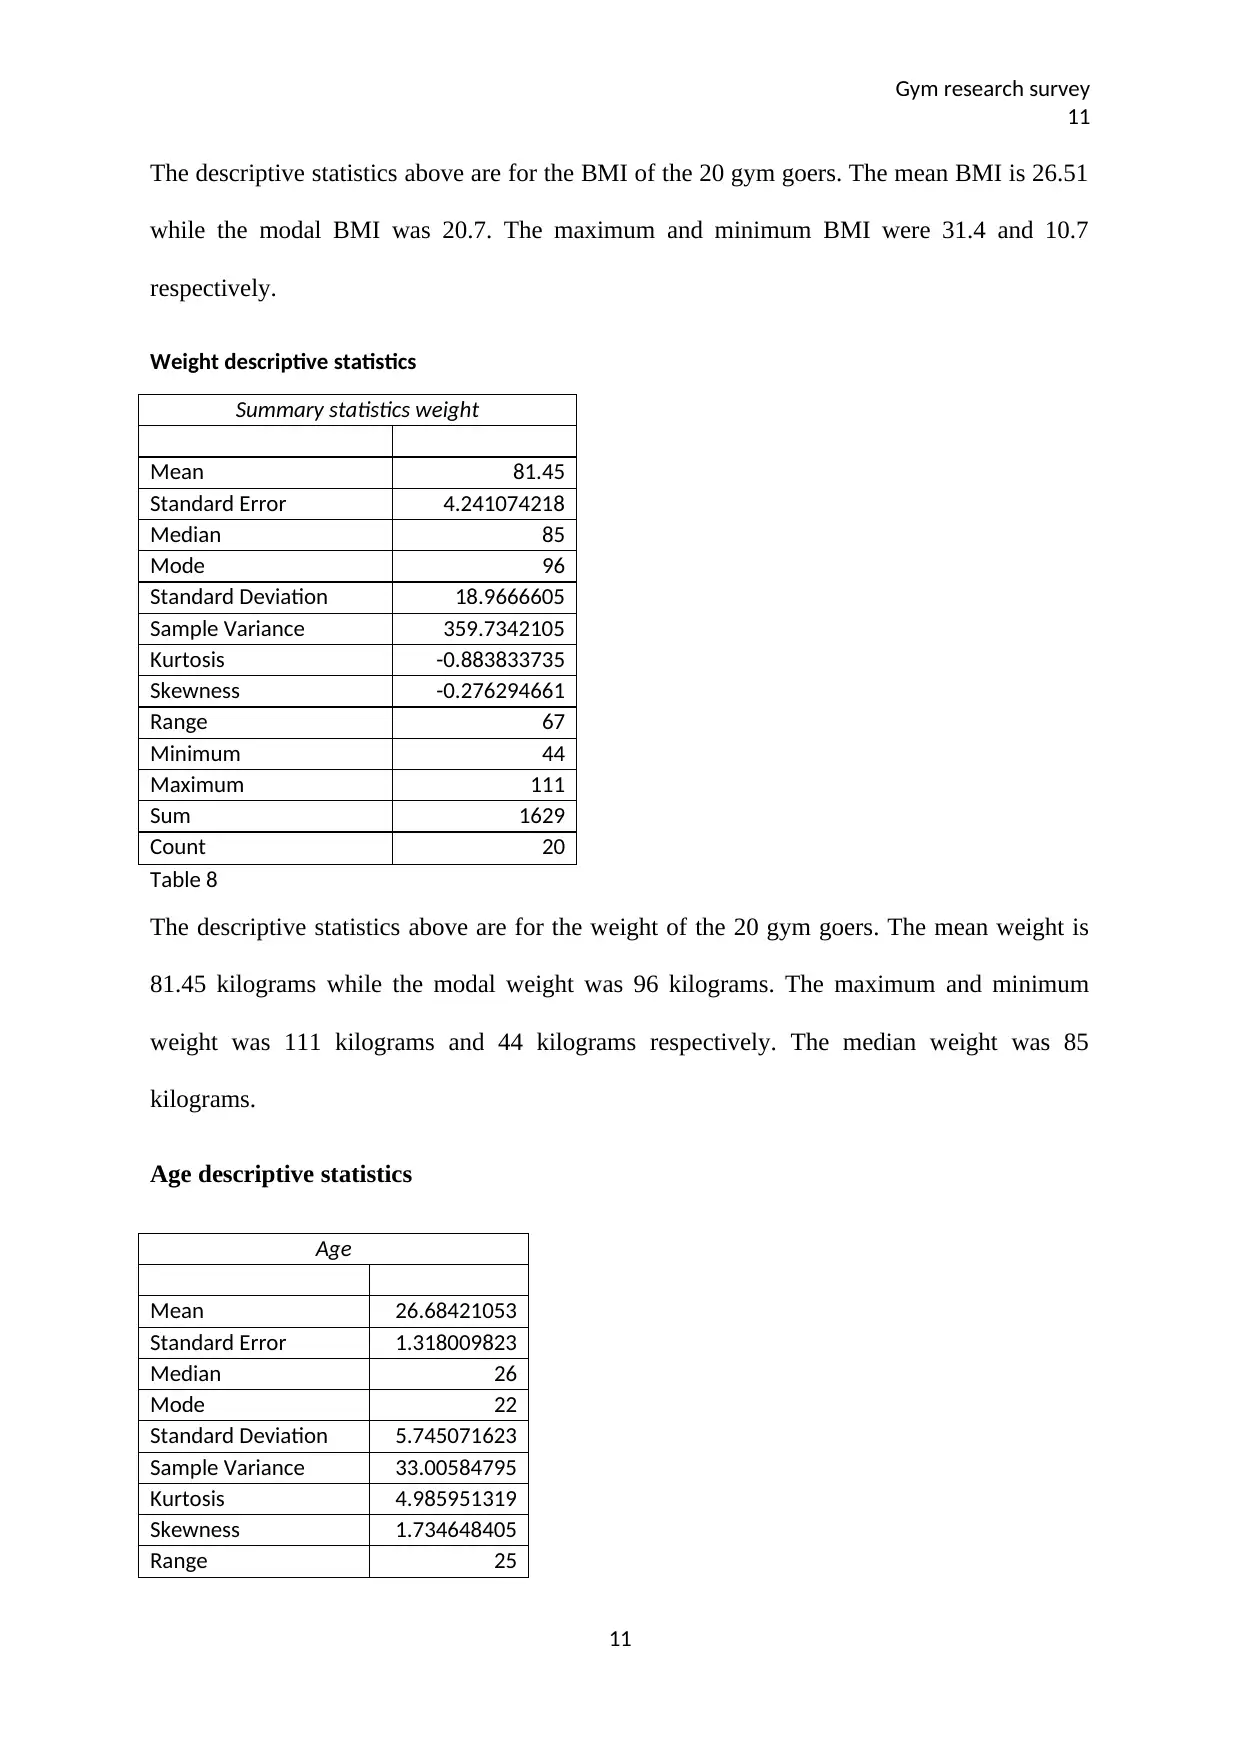
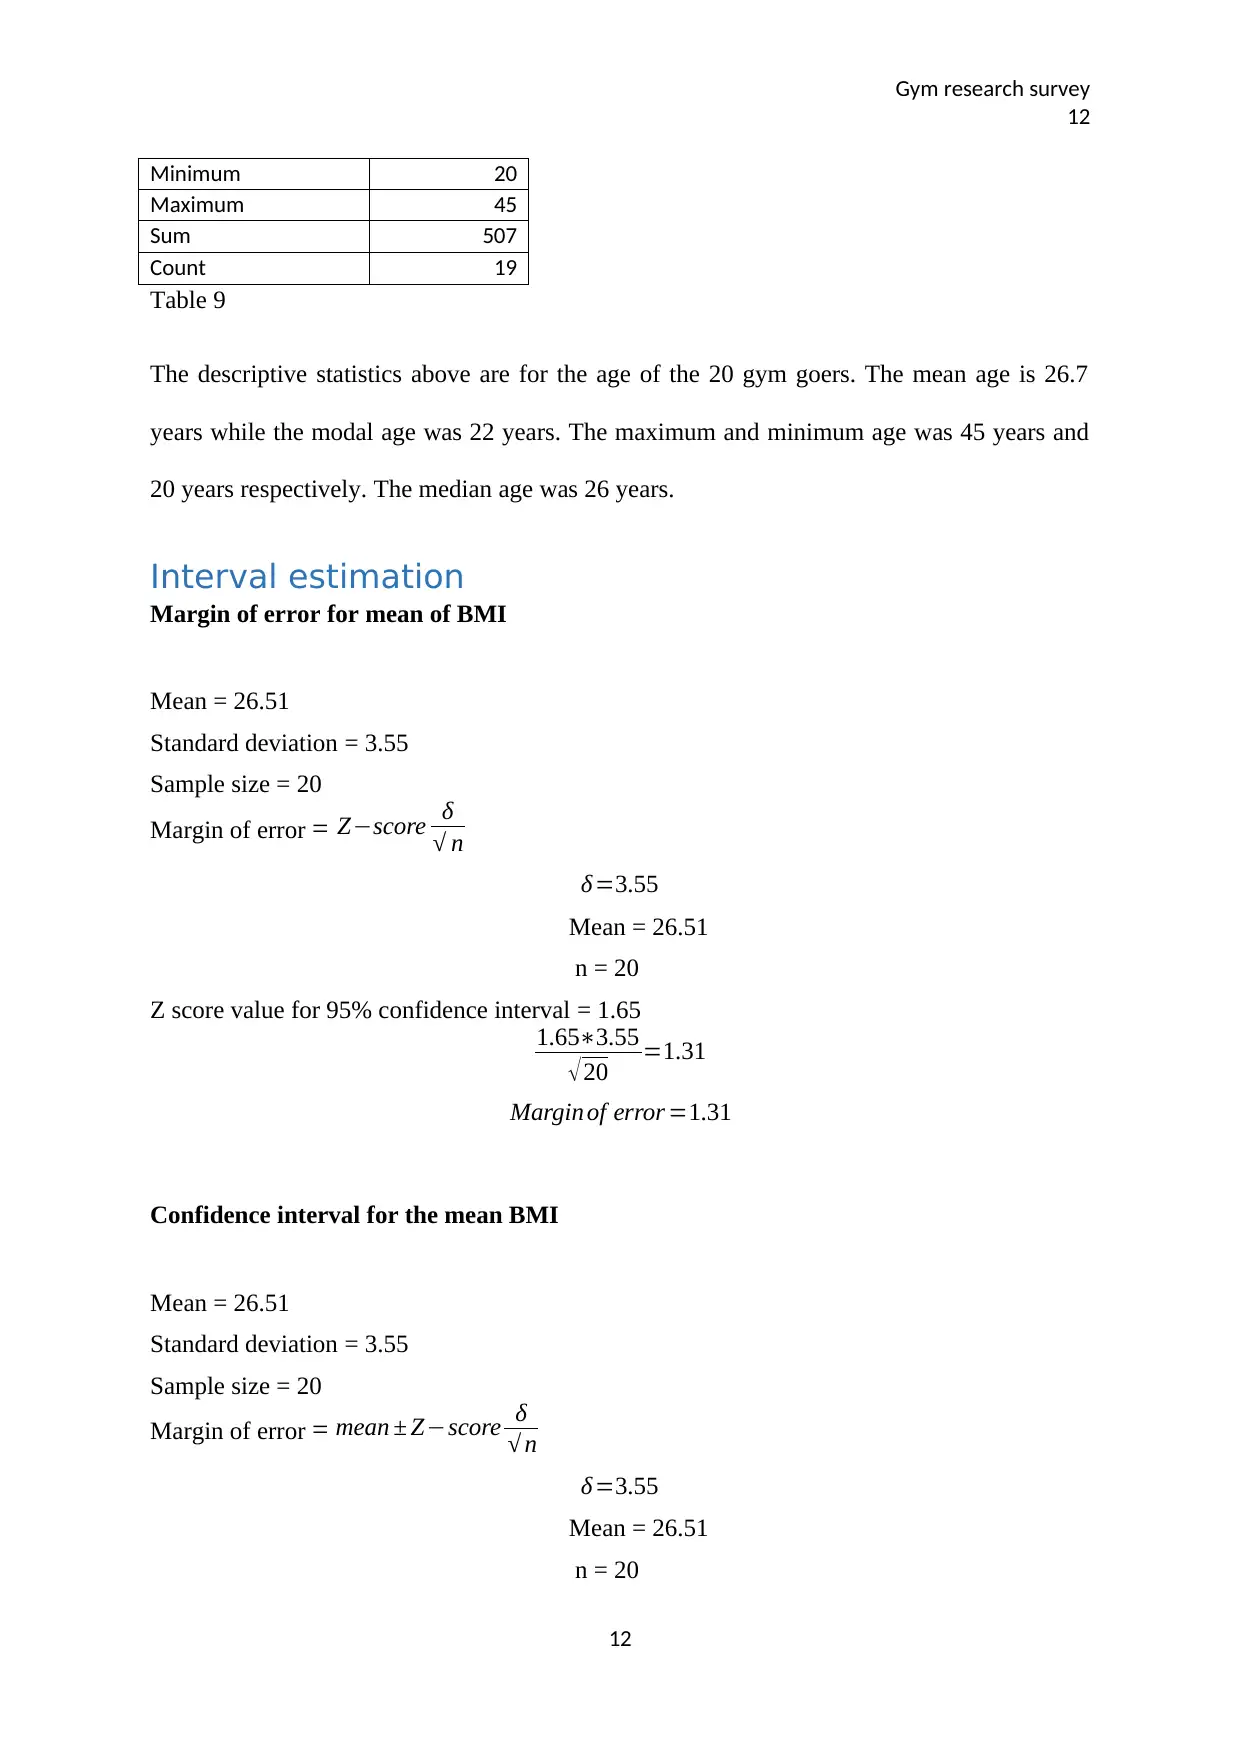
This report analyzes the factors influencing gym usage in Australian cities based on a research survey conducted to understand customer preferences in a competitive market. A sample of 20 participants was selected using judgmental and systematic sampling, and data was collected via questionnaires and analyzed using Excel with descriptive and inferential statistics. The study found that more males attend gyms than females, with the primary motivations being to gain strength and lose weight. The report includes data on gender, age, objectives for gym attendance, location of origin, exercise habits, and preferences regarding unisex gyms. Descriptive statistics cover BMI, weight, and age, along with interval estimations. The report concludes with recommendations based on the findings, noting a preference against unisex gyms among the majority of respondents. Desklib provides access to this and other solved assignments for students.

Gym research survey 1
Factors influencing gym usage in Australian cities
Reported by
To
Dr
1
Factors influencing gym usage in Australian cities
Reported by
To
Dr
1
Paraphrase This Document
Need a fresh take? Get an instant paraphrase of this document with our AI Paraphraser

Gym research survey 2
Executive Summary
There has been an increase in the number of gym or physical fitness centres across the world
and especially Australia due to growing demand to remain healthy. The springing up of these
kinds of businesses has led to high competition. Due to this competition, one company
resorted to carry out a survey in order to understand its customers and serve them well. A
sample of 20 participants was sampled through judgemental and systematic sampling.
Questionnaires were used to collect data which was later analysed using excel. Descriptive
statistics and inferential statistics were used. This research found that more males went to the
gym than females. It also found that many went to the gym in order to gain strength and to
lose weight.
2

Gym research survey 3
Contents
Executive Summary...............................................................................................................................2
Introduction..........................................................................................................................................4
Method of data collection......................................................................................................................4
Summary of the data set........................................................................................................................5
Gender...............................................................................................................................................5
Age....................................................................................................................................................6
Objective of going to gym.................................................................................................................7
Location of origin...............................................................................................................................8
Regular exercise in or outside gym....................................................................................................8
Do you want the gym to be unisex?...................................................................................................9
Data analysis - descriptive statistics....................................................................................................10
Interval estimation..............................................................................................................................12
Conclusion and recommendations.......................................................................................................15
Reference............................................................................................................................................16
3
⊘ This is a preview!⊘
Do you want full access?
Subscribe today to unlock all pages.

Trusted by 1+ million students worldwide

Gym research survey 4
Introduction
Due to gradual change in peoples’ lifestyle across the globe, many people have
reverted to having exercises in the gyms in their own towns. As opposed to currently, in the
past people used to walk going to work and other places due to low ownership of personal
cars. This has led to high demand of gym services across the world. In Australia in particular,
there has been mushrooming of gym business due to demand. Research has it that, Australia
was able to earn about million dollars as revenue from gym businesses (Smith, 2005). People
want to go to the gym in the morning and in the evenings. This demand has been triggered by
the clarion call that keeping fit enables an individual to keep many diseases away
(Thompson, 2013) and (Arnst , 2008). On the other side, the many number of gyms has led
to high competition in the sector in Australia. In order to remain competitive in the market,
One gym decided to conduct a survey on its customers so as to better understand them and
provide the services that they really require.
Method of data collection
This survey used primary method of data collection rather than secondary method of data
collection. This method was appropriate as it enabled the research collect responses that were
relevant to the survey. Two sampling methods were then used to select the respondents. In
order to select gym goers only, a judgemental type of sampling was employed. This is a
method where the researcher is allowed to pick respondents who have characteristics that suit
his research. After selecting 80 respondents, the research further employed systematic
sampling to select a sample of 20 respondents. In systematic sampling, the 80 respondents
were arranged in a line and every fourth respondent was picked. That is how the survey
4
Paraphrase This Document
Need a fresh take? Get an instant paraphrase of this document with our AI Paraphraser

Gym research survey 5
ended up with 20 respondents. In order to collect data from the 20 respondents, a
questionnaire was used. The questionnaire was structured in a way that it was to collect both
qualitative and quantitative data. It was also closed ended questionnaire.
Summary of the data set
Since the questionnaire had ten questions, the corresponding number of variables was also
ten. The variables were both qualitative and quantitative variables. Quantitative variables
were age, weight and the duration in minutes taken working at the gym. The qualitative
variables were gender, purpose of going to the gym and whether unisex services should be
included in the gym.
Gender
A table of gender distribution
Gender Number
Male 13
Female 7
Grand Total 20
Table 1
male female
0
2
4
6
8
10
12
14
Graph of gender
Gender
Number
Figure 1
5

Gym research survey 6
From the above graphical representation of gender distribution of gym enthusiasts, it can be
observed that the number of male gym goers is higher than the number of female gym goers.
The males were 13 out of the total 20 thus representing 65% while the females were 7 out of
20 representing 35%.
Age
A table and graph of age of participants
Age
group
number
21-30 16
30-40 3
40-50 1
Table 2
21-30 30-40 40-50
0
2
4
6
8
10
12
14
16
Age -group chart
Age group
Number
Figure 2
As can be observed in the bar chart above, the age groups are three. The first age group is 21-
30 years, the second age group is 30-40 years and the last age group is that of 40-50 years. It
can be seen that a major percentage of those who go to the gym are aged between 21 to 30
years. They are 16 out of the total 20. They represent 80% of those who go to the gym to
exercise. The age group of 30 to 40 came second 3 out of 20. This represents 15% of those
6
⊘ This is a preview!⊘
Do you want full access?
Subscribe today to unlock all pages.

Trusted by 1+ million students worldwide

Gym research survey 7
who go to the gym. The rest was those who were between ages 40 to 50. They represented
only 5% of those who to the gym.
Objective of going to gym
The table and graph below show objective of going to gym
Row Labels Count of Q6: Reason for going to the gym
gain
strength
9
lose weight 9
stress relief 2
Grand Total 20
Table 3
gain strength lose weight stress releif
0
1
2
3
4
5
6
7
8
9
Graph of objective of going to gym
Objective
Number
Figure 3
The research study also classified the gym goers according to their purpose of going to the
gym. The respondents went to the gym for three reasons as can be observed above. Some
went to the gym in order to gain strength while others went in order to lose weight. Another
group went to the gym in order to release stress. The number of those who went to the gym to
gain strength was equal to the number of those who went to the gym to lose weight. They
were 9 in number each representing 45% each. The other group was 2 in number representing
10%.
7
Paraphrase This Document
Need a fresh take? Get an instant paraphrase of this document with our AI Paraphraser

Gym research survey 8
Location of origin
The table and graph of place of origin
Location Number
Brisbane 8
Melbourne 5
Melbourne 1
Sidney 6
Grand Total 20
Table 4
brisbane melbourne melbourne sidney
0
1
2
3
4
5
6
7
8
Graph of city of origin
Town of Origin
Number
Figure 4
The study classified the gym goers according to the city that they came from. The results are
as shown in figure 4. Most of them came from Brisbane (8) followed by Sidney and
Melbourne which had equal number of respondents (6 each).
Regular exercise in or outside gym
Table and graph of place of exercise between in and outside gym
Response Number
No 8
Yes 12
Grand Total 20
Table 5
8

Gym research survey 9
no yes
0
2
4
6
8
10
12
Graph of gym frequency in/out
Response
Number
Figure 5
The respondents were asked whether they did their exercises inside the gym. The responses
are as observed in the chart above. Those who said that they conducted their exercises inside
the gym were 12 while those who conducted their gym outside were 8 in number.
Do you want the gym to be unisex?
The table and graph of responses whether gym should be unisex
Responses Number
No 13
Yes 7
Grand Total 20
Table 6
9
⊘ This is a preview!⊘
Do you want full access?
Subscribe today to unlock all pages.

Trusted by 1+ million students worldwide

Gym research survey
10
no yes
0
2
4
6
8
10
12
14
Graph of gym - unisex
Responses
Number
Figure 6
The respondents were asked whether they would like the gym to be unisex. The responses are
as observed in the chart above. Those who said that they wanted the gym to be unisex were 7
while those who did not want the gym to be unisex were 13.
Data analysis - descriptive statistics
BMI index descriptive statistics
Summary statistics BMI
Mean 26.505
Standard Error 0.794138891
Median 26.6
Mode 20.7
Standard Deviation 3.55149709
Sample Variance 12.61313158
Kurtosis -1.100048206
Skewness -0.269732274
Range 10.7
Minimum 20.7
Maximum 31.4
Sum 530.1
Count 20
Table 7
10
10
no yes
0
2
4
6
8
10
12
14
Graph of gym - unisex
Responses
Number
Figure 6
The respondents were asked whether they would like the gym to be unisex. The responses are
as observed in the chart above. Those who said that they wanted the gym to be unisex were 7
while those who did not want the gym to be unisex were 13.
Data analysis - descriptive statistics
BMI index descriptive statistics
Summary statistics BMI
Mean 26.505
Standard Error 0.794138891
Median 26.6
Mode 20.7
Standard Deviation 3.55149709
Sample Variance 12.61313158
Kurtosis -1.100048206
Skewness -0.269732274
Range 10.7
Minimum 20.7
Maximum 31.4
Sum 530.1
Count 20
Table 7
10
Paraphrase This Document
Need a fresh take? Get an instant paraphrase of this document with our AI Paraphraser

Gym research survey
11
The descriptive statistics above are for the BMI of the 20 gym goers. The mean BMI is 26.51
while the modal BMI was 20.7. The maximum and minimum BMI were 31.4 and 10.7
respectively.
Weight descriptive statistics
Summary statistics weight
Mean 81.45
Standard Error 4.241074218
Median 85
Mode 96
Standard Deviation 18.9666605
Sample Variance 359.7342105
Kurtosis -0.883833735
Skewness -0.276294661
Range 67
Minimum 44
Maximum 111
Sum 1629
Count 20
Table 8
The descriptive statistics above are for the weight of the 20 gym goers. The mean weight is
81.45 kilograms while the modal weight was 96 kilograms. The maximum and minimum
weight was 111 kilograms and 44 kilograms respectively. The median weight was 85
kilograms.
Age descriptive statistics
Age
Mean 26.68421053
Standard Error 1.318009823
Median 26
Mode 22
Standard Deviation 5.745071623
Sample Variance 33.00584795
Kurtosis 4.985951319
Skewness 1.734648405
Range 25
11
11
The descriptive statistics above are for the BMI of the 20 gym goers. The mean BMI is 26.51
while the modal BMI was 20.7. The maximum and minimum BMI were 31.4 and 10.7
respectively.
Weight descriptive statistics
Summary statistics weight
Mean 81.45
Standard Error 4.241074218
Median 85
Mode 96
Standard Deviation 18.9666605
Sample Variance 359.7342105
Kurtosis -0.883833735
Skewness -0.276294661
Range 67
Minimum 44
Maximum 111
Sum 1629
Count 20
Table 8
The descriptive statistics above are for the weight of the 20 gym goers. The mean weight is
81.45 kilograms while the modal weight was 96 kilograms. The maximum and minimum
weight was 111 kilograms and 44 kilograms respectively. The median weight was 85
kilograms.
Age descriptive statistics
Age
Mean 26.68421053
Standard Error 1.318009823
Median 26
Mode 22
Standard Deviation 5.745071623
Sample Variance 33.00584795
Kurtosis 4.985951319
Skewness 1.734648405
Range 25
11

Gym research survey
12
Minimum 20
Maximum 45
Sum 507
Count 19
Table 9
The descriptive statistics above are for the age of the 20 gym goers. The mean age is 26.7
years while the modal age was 22 years. The maximum and minimum age was 45 years and
20 years respectively. The median age was 26 years.
Interval estimation
Margin of error for mean of BMI
Mean = 26.51
Standard deviation = 3.55
Sample size = 20
Margin of error = Z−score δ
√ n
δ=3.55
Mean = 26.51
n = 20
Z score value for 95% confidence interval = 1.65
1.65∗3.55
√20 =1.31
Margin of error =1.31
Confidence interval for the mean BMI
Mean = 26.51
Standard deviation = 3.55
Sample size = 20
Margin of error = mean ± Z−score δ
√ n
δ=3.55
Mean = 26.51
n = 20
12
12
Minimum 20
Maximum 45
Sum 507
Count 19
Table 9
The descriptive statistics above are for the age of the 20 gym goers. The mean age is 26.7
years while the modal age was 22 years. The maximum and minimum age was 45 years and
20 years respectively. The median age was 26 years.
Interval estimation
Margin of error for mean of BMI
Mean = 26.51
Standard deviation = 3.55
Sample size = 20
Margin of error = Z−score δ
√ n
δ=3.55
Mean = 26.51
n = 20
Z score value for 95% confidence interval = 1.65
1.65∗3.55
√20 =1.31
Margin of error =1.31
Confidence interval for the mean BMI
Mean = 26.51
Standard deviation = 3.55
Sample size = 20
Margin of error = mean ± Z−score δ
√ n
δ=3.55
Mean = 26.51
n = 20
12
⊘ This is a preview!⊘
Do you want full access?
Subscribe today to unlock all pages.

Trusted by 1+ million students worldwide
1 out of 16
Related Documents
Your All-in-One AI-Powered Toolkit for Academic Success.
+13062052269
info@desklib.com
Available 24*7 on WhatsApp / Email
Unlock your academic potential
Copyright © 2020–2026 A2Z Services. All Rights Reserved. Developed and managed by ZUCOL.


