Independent Expert's Report: Santos Limited Takeover by Harbour Energy
VerifiedAdded on 2021/06/17
|14
|1723
|43
Report
AI Summary
This report analyzes the proposed takeover of Santos Limited by Harbour Energy. The analysis includes an introduction to the offer, a company overview of Santos Limited, and a summary of opinions regarding the fairness of the offer. The report delves into trend analysis, financial ratio analysis (profitability, liquidity, efficiency, and capital structure), and valuation analysis using dividend discount models, discounted cash flow methods, and residual earnings methods. The financial performance of Santos is evaluated using the provided data, and the report concludes with a recommendation that the offer is neither reasonable nor fair. The report suggests that Santos should not accept the deal as it is currently structured, and it provides recommendations for either altering the deal terms or continuing to operate independently. The report highlights the importance of considering the intrinsic value of the stock rather than solely focusing on the market value and provides financial data and tables to support the analysis.
[ T y p e t h e c o m p a n y
n a m e ]
S a n t o s L i m i t e d
61287598792
61287598792
5 / 2 1 / 2 0 1 8
lenovo
1
Independent
Expert’s Report
about Santos
Limited
n a m e ]
S a n t o s L i m i t e d
61287598792
61287598792
5 / 2 1 / 2 0 1 8
lenovo
1
Independent
Expert’s Report
about Santos
Limited
Paraphrase This Document
Need a fresh take? Get an instant paraphrase of this document with our AI Paraphraser
ABN 53085479
AFS License no. 248598
Level 27, 268 George Street
The Directors Sydney NSW 2000 Australia
Santos Limited Telephone: 61287598792
PO Box 344 Fax: 61287598792
Whyalla www.Longrenedwards.com
South Australia 5600
Australia.
20 May 2018
Subject: Takeover offer by Harbour energy
Dear Sir,
Introduction:
1. On 3rd April 2018, Harbour energy issued its statement about the bid and the
announcement has been done by the company on the same date that:
a. The harbour energy would take over all the shares of the Santos limited.
b. The company would offer US $ 4.98 per share and $ 6.13 per share would be paid in
case and 37% shares would be franked dividend.
c. The closing price on 2nd April 2018 was $ 5.07.
d. The offer is quite higher than the market value of the company.
2. In addition, the harbour limited would pay only $ 6.13 per share and rest share would be
full frankly dividend which explains that the shareholders who accept the proposal of the
company would got $ 6.13 per share.
Company overview:
3. Santos limited is an Australian company which deals in the natural gas. The company is
engaged in production, development, exploration, sales of natural gas in Australian
market as well as international level.
4. The company produced the ethane, methane, liquid petroleum gas, shale gas and oil. The
company has been founded in 1954. The company has been awarded as second largest
independent oil and gas Production Company.
5. The financial performance of the company explains about the continuous loss to the
company. However, the deal offered by US energy player, Harbour energy is not good
for the company as the company could generate more profits from the market through
making few changes into the corporate strategies.
Summary of opinion:
6. The reports and analyst of company explains that the offer us neither reasonable nor fair.
The analyst reports explains about the few reasons:
Trend analysis:
7. Trend analysis is a study which measures the changes into the financial performance and
position of an organization.
8. On the basis of trend analysis study over the company, it has been measured that the total
revenue of the company in continuously enhancing as well as the trend explains that the
net loss trend of the company has been lower.
9. It has also impacted over the earnings per share of the company.
⊘ This is a preview!⊘
Do you want full access?
Subscribe today to unlock all pages.
Trusted by 1+ million students worldwide
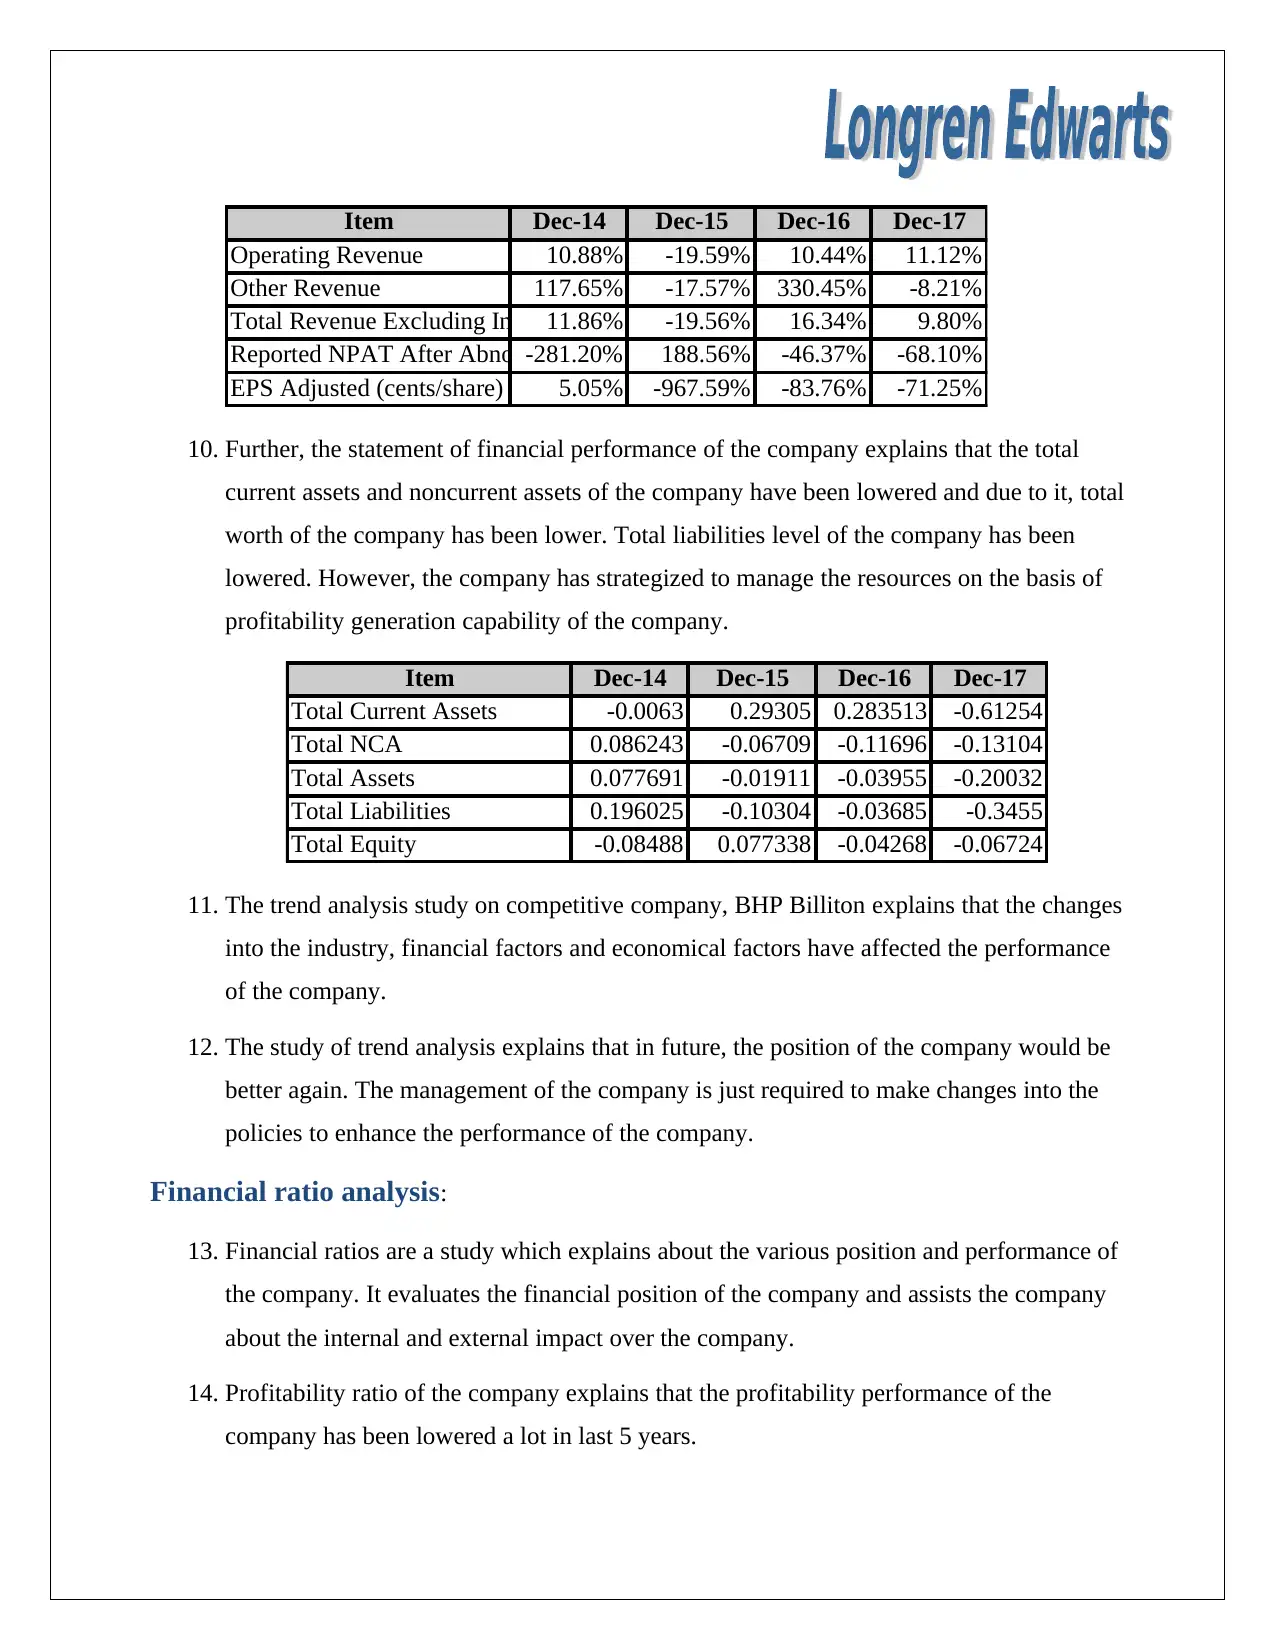
Item Dec-14 Dec-15 Dec-16 Dec-17
Operating Revenue 10.88% -19.59% 10.44% 11.12%
Other Revenue 117.65% -17.57% 330.45% -8.21%
Total Revenue Excluding Interest11.86% -19.56% 16.34% 9.80%
Reported NPAT After Abnormal-281.20% 188.56% -46.37% -68.10%
EPS Adjusted (cents/share) 5.05% -967.59% -83.76% -71.25%
10. Further, the statement of financial performance of the company explains that the total
current assets and noncurrent assets of the company have been lowered and due to it, total
worth of the company has been lower. Total liabilities level of the company has been
lowered. However, the company has strategized to manage the resources on the basis of
profitability generation capability of the company.
Item Dec-14 Dec-15 Dec-16 Dec-17
Total Current Assets -0.0063 0.29305 0.283513 -0.61254
Total NCA 0.086243 -0.06709 -0.11696 -0.13104
Total Assets 0.077691 -0.01911 -0.03955 -0.20032
Total Liabilities 0.196025 -0.10304 -0.03685 -0.3455
Total Equity -0.08488 0.077338 -0.04268 -0.06724
11. The trend analysis study on competitive company, BHP Billiton explains that the changes
into the industry, financial factors and economical factors have affected the performance
of the company.
12. The study of trend analysis explains that in future, the position of the company would be
better again. The management of the company is just required to make changes into the
policies to enhance the performance of the company.
Financial ratio analysis:
13. Financial ratios are a study which explains about the various position and performance of
the company. It evaluates the financial position of the company and assists the company
about the internal and external impact over the company.
14. Profitability ratio of the company explains that the profitability performance of the
company has been lowered a lot in last 5 years.
Paraphrase This Document
Need a fresh take? Get an instant paraphrase of this document with our AI Paraphraser
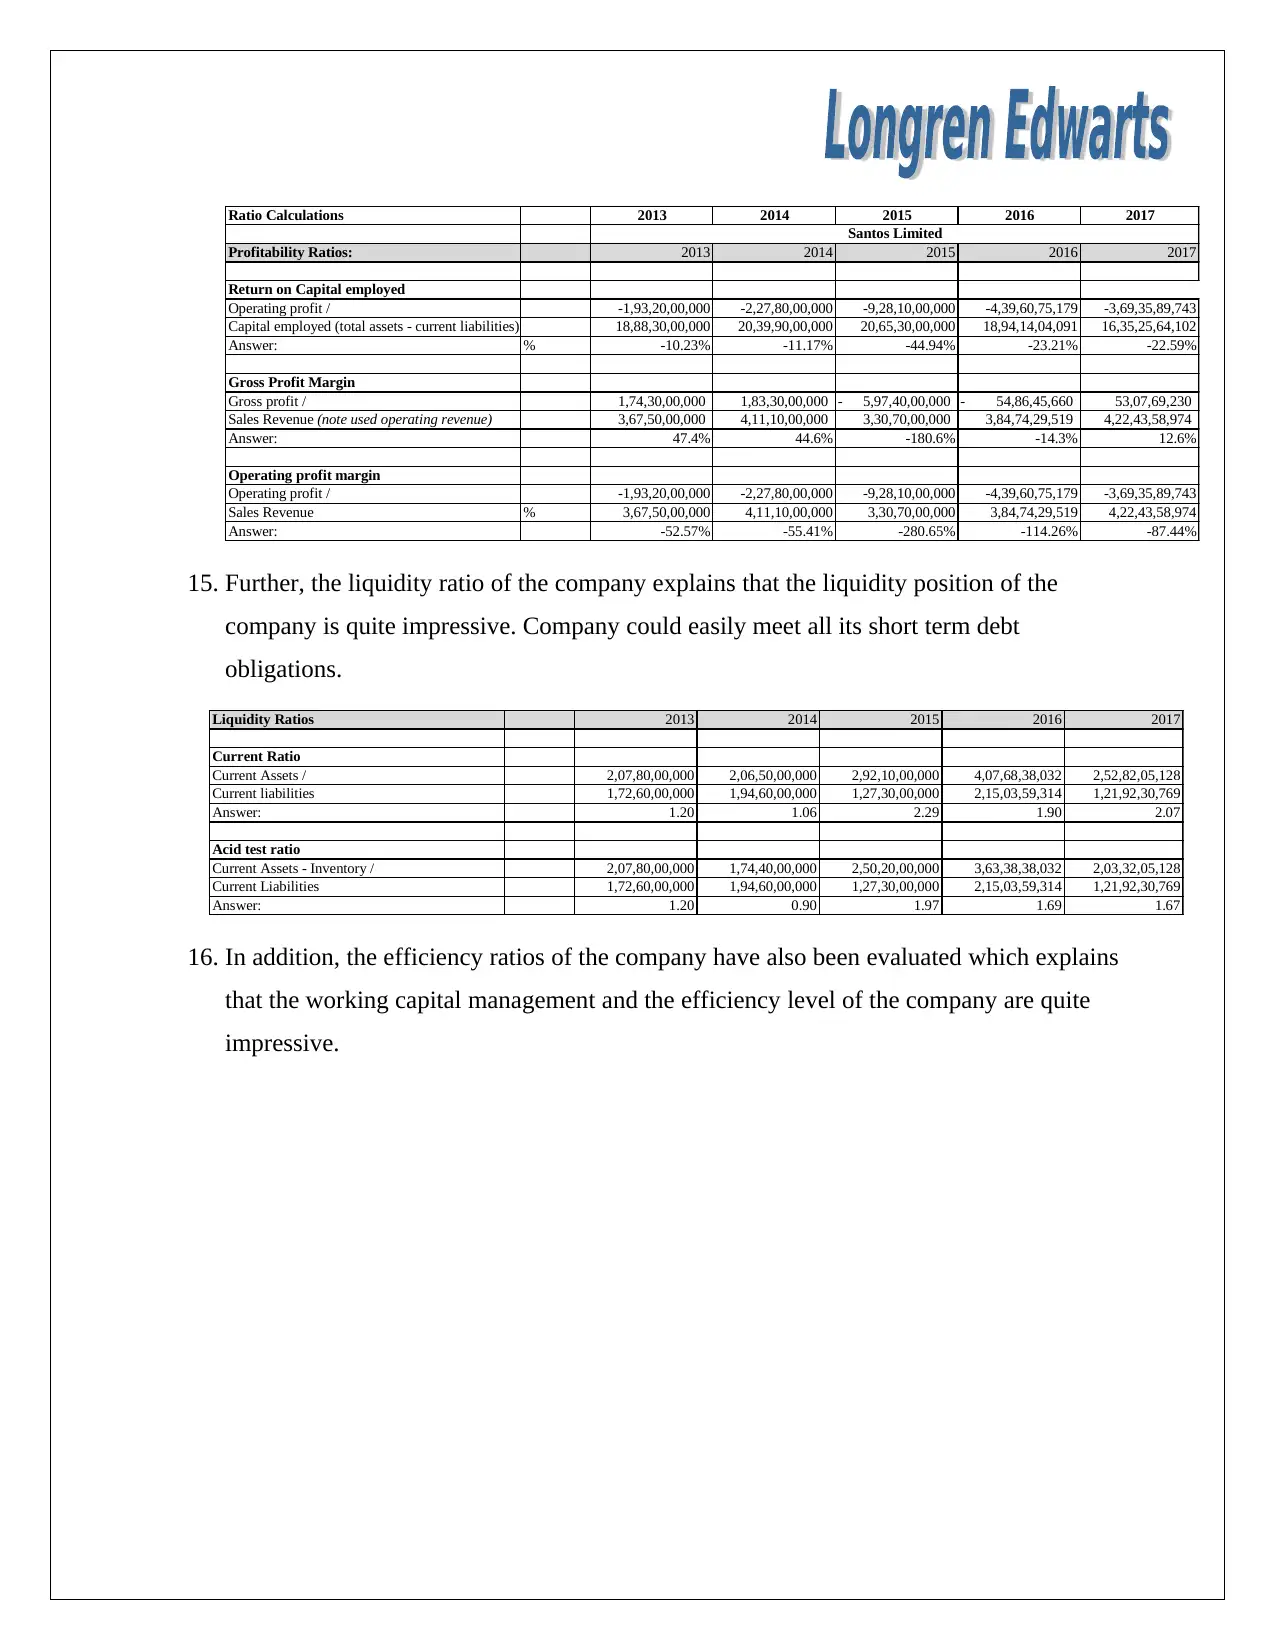
Ratio Calculations 2013 2014 2015 2016 2017
Profitability Ratios: 2013 2014 2015 2016 2017
Return on Capital employed
Operating profit / -1,93,20,00,000 -2,27,80,00,000 -9,28,10,00,000 -4,39,60,75,179 -3,69,35,89,743
Capital employed (total assets - current liabilities) 18,88,30,00,000 20,39,90,00,000 20,65,30,00,000 18,94,14,04,091 16,35,25,64,102
Answer: % -10.23% -11.17% -44.94% -23.21% -22.59%
Gross Profit Margin
Gross profit / 1,74,30,00,000 1,83,30,00,000 5,97,40,00,000- 54,86,45,660- 53,07,69,230
Sales Revenue (note used operating revenue) 3,67,50,00,000 4,11,10,00,000 3,30,70,00,000 3,84,74,29,519 4,22,43,58,974
Answer: 47.4% 44.6% -180.6% -14.3% 12.6%
Operating profit margin
Operating profit / -1,93,20,00,000 -2,27,80,00,000 -9,28,10,00,000 -4,39,60,75,179 -3,69,35,89,743
Sales Revenue % 3,67,50,00,000 4,11,10,00,000 3,30,70,00,000 3,84,74,29,519 4,22,43,58,974
Answer: -52.57% -55.41% -280.65% -114.26% -87.44%
Santos Limited
15. Further, the liquidity ratio of the company explains that the liquidity position of the
company is quite impressive. Company could easily meet all its short term debt
obligations.
Liquidity Ratios 2013 2014 2015 2016 2017
Current Ratio
Current Assets / 2,07,80,00,000 2,06,50,00,000 2,92,10,00,000 4,07,68,38,032 2,52,82,05,128
Current liabilities 1,72,60,00,000 1,94,60,00,000 1,27,30,00,000 2,15,03,59,314 1,21,92,30,769
Answer: 1.20 1.06 2.29 1.90 2.07
Acid test ratio
Current Assets - Inventory / 2,07,80,00,000 1,74,40,00,000 2,50,20,00,000 3,63,38,38,032 2,03,32,05,128
Current Liabilities 1,72,60,00,000 1,94,60,00,000 1,27,30,00,000 2,15,03,59,314 1,21,92,30,769
Answer: 1.20 0.90 1.97 1.69 1.67
16. In addition, the efficiency ratios of the company have also been evaluated which explains
that the working capital management and the efficiency level of the company are quite
impressive.
Asset Efficiency Ratios 2013 2014 2015 2016 2017
Trade payable payment period ratio
Accounts payable/ 0 1,23,50,00,000 1,38,20,00,000 84,90,00,000 71,86,29,076
Cost of sales 1,93,20,00,000 2,27,80,00,000 9,28,10,00,000 4,39,60,75,179 3,69,35,89,743
Answer: (note the above needs to be x 365) 0.0000 197.8819 54.3508 70.4913 71.0148
Inventory Turnover (days)
Average Inventory / 0 32,10,00,000 41,90,00,000 44,30,00,000 49,50,00,000
Cost of Sales # days 1,93,20,00,000 2,27,80,00,000 9,28,10,00,000 4,39,60,75,179 3,69,35,89,743
Answer: (note the above needs to be x 365) 0.00 51.43 16.48 36.78 48.92
Receivables Turnover (days)
Average trade debtors / 3,10,00,000 1,00,00,000 60,00,000 69,09,894 -
Sales revenue (note used operating revenue) # days 3,67,50,00,000 4,11,10,00,000 3,30,70,00,000 3,84,74,29,519 4,22,43,58,974
Answer: (note the above needs to be x 365) 3.08 0.89 0.66 0.66 0.00
17. Lastly, the capital structure and investment ratios have been calculated and it has been
measured that the company is not able to pay the interest amount to the debtors of the
company and thus debt level of the company has been lowered. Further, it has been found
that the company is facing huge loss. Still, it has managed to offer a good amount of
dividend to its stockholders.
Capital Structure Ratios 2013 2014 2015 2016 2017
Gearing ratio
Long term liabilities / 8,67,10,00,000 10,98,60,00,000 10,45,10,00,000 9,15,69,92,813 7,18,46,15,384
Capital employed 18,88,30,00,000 20,39,90,00,000 20,65,30,00,000 18,94,14,04,091 16,35,25,64,102
Answer: % 0.459 0.539 0.506 0.483 0.439
Interest Coverage Ratio
EBIT / -1,93,20,00,000 -2,27,80,00,000 -9,28,10,00,000 -4,39,60,75,179 -3,69,35,89,743
Net Finance Costs (used net interest expense) 6,20,00,000 11,60,00,000 29,70,00,000 40,90,65,782 37,69,23,076
Answer: times p.a -31.161 -19.638 -31.249 -10.747 -9.799
Santos Limited
⊘ This is a preview!⊘
Do you want full access?
Subscribe today to unlock all pages.
Trusted by 1+ million students worldwide
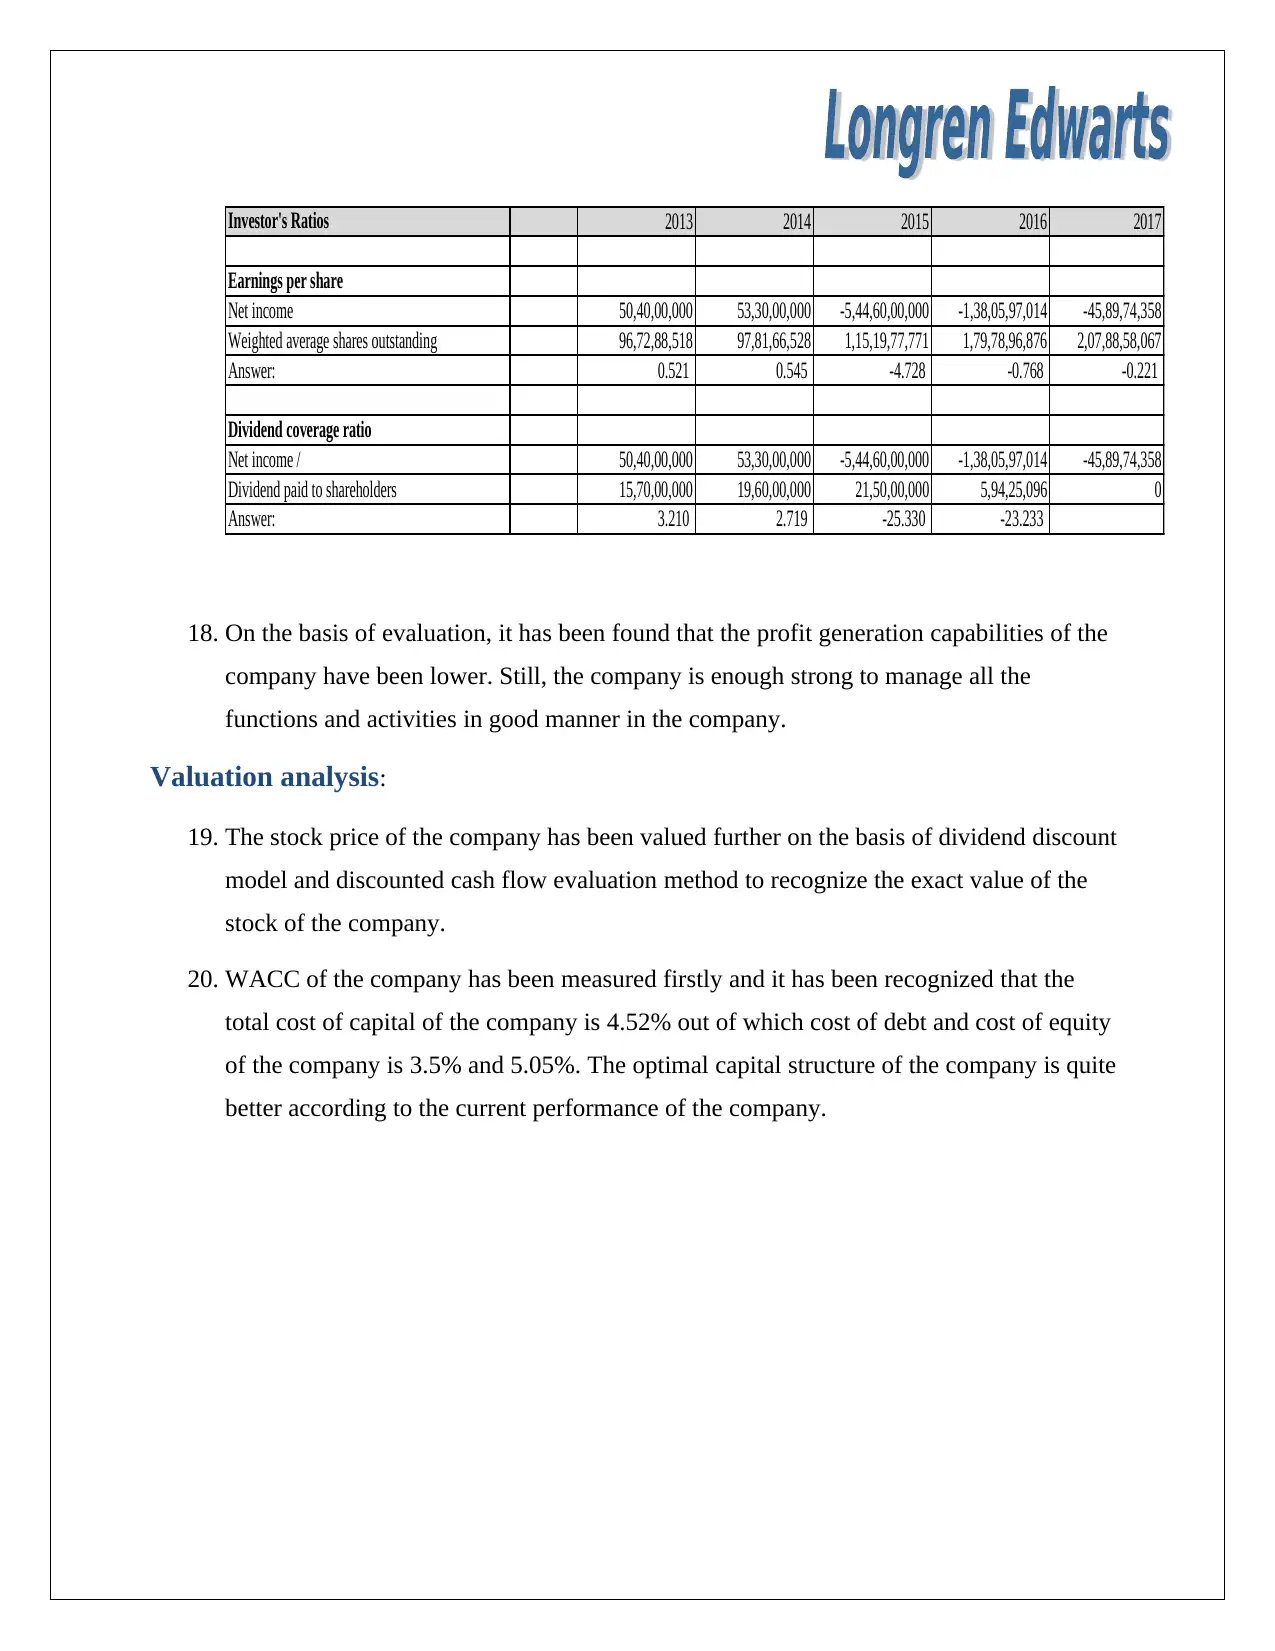
Investor's Ratios 2013 2014 2015 2016 2017
Earnings per share
Net income 50,40,00,000 53,30,00,000 -5,44,60,00,000 -1,38,05,97,014 -45,89,74,358
Weighted average shares outstanding 96,72,88,518 97,81,66,528 1,15,19,77,771 1,79,78,96,876 2,07,88,58,067
Answer: 0.521 0.545 -4.728 -0.768 -0.221
Dividend coverage ratio
Net income / 50,40,00,000 53,30,00,000 -5,44,60,00,000 -1,38,05,97,014 -45,89,74,358
Dividend paid to shareholders 15,70,00,000 19,60,00,000 21,50,00,000 5,94,25,096 0
Answer: 3.210 2.719 -25.330 -23.233
18. On the basis of evaluation, it has been found that the profit generation capabilities of the
company have been lower. Still, the company is enough strong to manage all the
functions and activities in good manner in the company.
Valuation analysis:
19. The stock price of the company has been valued further on the basis of dividend discount
model and discounted cash flow evaluation method to recognize the exact value of the
stock of the company.
20. WACC of the company has been measured firstly and it has been recognized that the
total cost of capital of the company is 4.52% out of which cost of debt and cost of equity
of the company is 3.5% and 5.05%. The optimal capital structure of the company is quite
better according to the current performance of the company.
Paraphrase This Document
Need a fresh take? Get an instant paraphrase of this document with our AI Paraphraser
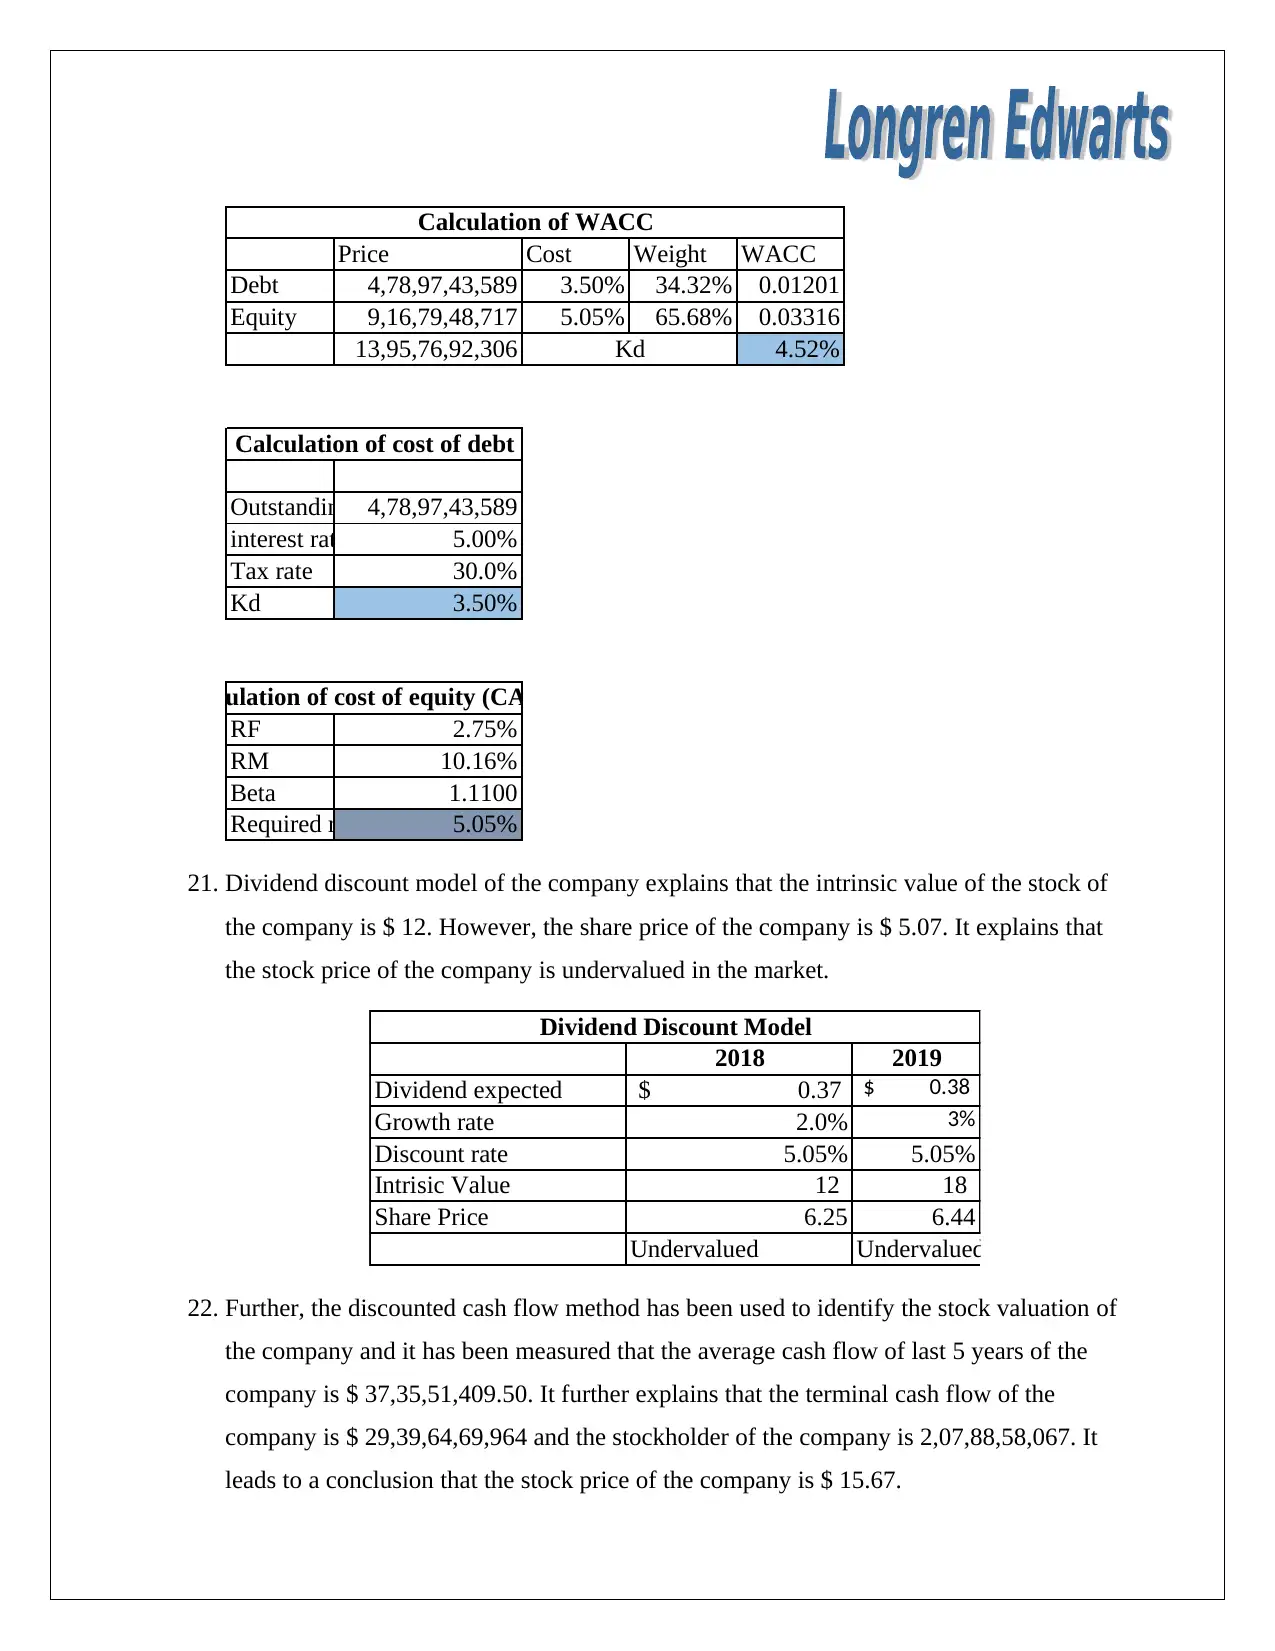
Price Cost Weight WACC
Debt 4,78,97,43,589 3.50% 34.32% 0.01201
Equity 9,16,79,48,717 5.05% 65.68% 0.03316
13,95,76,92,306 4.52%
Outstanding debt4,78,97,43,589
interest rate 5.00%
Tax rate 30.0%
Kd 3.50%
RF 2.75%
RM 10.16%
Beta 1.1100
Required rate of return5.05%
Calculation of WACC
Kd
Calculation of cost of debt
Calculation of cost of equity (CAPM)
21. Dividend discount model of the company explains that the intrinsic value of the stock of
the company is $ 12. However, the share price of the company is $ 5.07. It explains that
the stock price of the company is undervalued in the market.
2018 2019
Dividend expected 0.37$ 0.38$
Growth rate 2.0% 3%
Discount rate 5.05% 5.05%
Intrisic Value 12 18
Share Price 6.25 6.44
Undervalued Undervalued
Dividend Discount Model
22. Further, the discounted cash flow method has been used to identify the stock valuation of
the company and it has been measured that the average cash flow of last 5 years of the
company is $ 37,35,51,409.50. It further explains that the terminal cash flow of the
company is $ 29,39,64,69,964 and the stockholder of the company is 2,07,88,58,067. It
leads to a conclusion that the stock price of the company is $ 15.67.
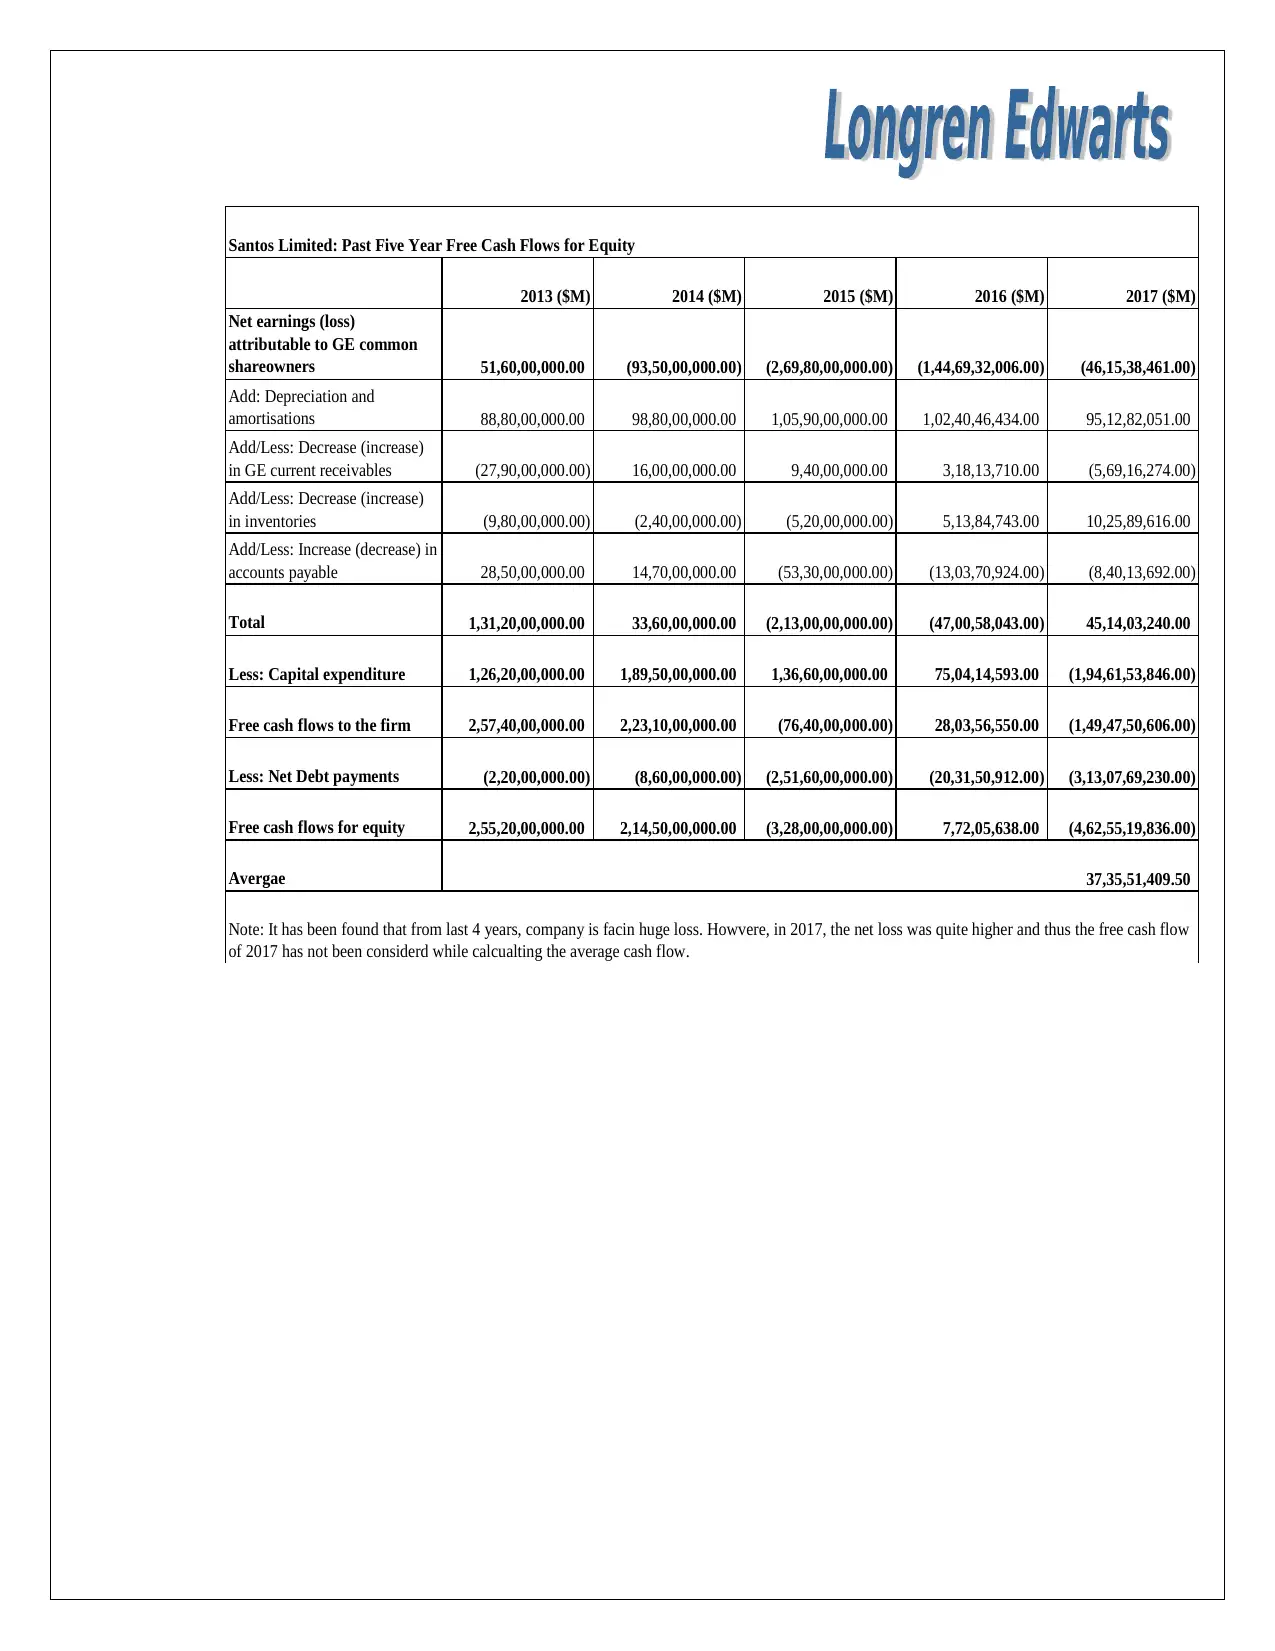
2013 ($M) 2014 ($M) 2015 ($M) 2016 ($M) 2017 ($M)
Net earnings (loss)
attributable to GE common
shareowners 51,60,00,000.00 (93,50,00,000.00) (2,69,80,00,000.00) (1,44,69,32,006.00) (46,15,38,461.00)
Add: Depreciation and
amortisations 88,80,00,000.00 98,80,00,000.00 1,05,90,00,000.00 1,02,40,46,434.00 95,12,82,051.00
Add/Less: Decrease (increase)
in GE current receivables (27,90,00,000.00) 16,00,00,000.00 9,40,00,000.00 3,18,13,710.00 (5,69,16,274.00)
Add/Less: Decrease (increase)
in inventories (9,80,00,000.00) (2,40,00,000.00) (5,20,00,000.00) 5,13,84,743.00 10,25,89,616.00
Add/Less: Increase (decrease) in
accounts payable 28,50,00,000.00 14,70,00,000.00 (53,30,00,000.00) (13,03,70,924.00) (8,40,13,692.00)
Total 1,31,20,00,000.00 33,60,00,000.00 (2,13,00,00,000.00) (47,00,58,043.00) 45,14,03,240.00
Less: Capital expenditure 1,26,20,00,000.00 1,89,50,00,000.00 1,36,60,00,000.00 75,04,14,593.00 (1,94,61,53,846.00)
Free cash flows to the firm 2,57,40,00,000.00 2,23,10,00,000.00 (76,40,00,000.00) 28,03,56,550.00 (1,49,47,50,606.00)
Less: Net Debt payments (2,20,00,000.00) (8,60,00,000.00) (2,51,60,00,000.00) (20,31,50,912.00) (3,13,07,69,230.00)
Free cash flows for equity 2,55,20,00,000.00 2,14,50,00,000.00 (3,28,00,00,000.00) 7,72,05,638.00 (4,62,55,19,836.00)
Avergae 37,35,51,409.50
Santos Limited: Past Five Year Free Cash Flows for Equity
Note: It has been found that from last 4 years, company is facin huge loss. Howvere, in 2017, the net loss was quite higher and thus the free cash flow
of 2017 has not been considerd while calcualting the average cash flow.
⊘ This is a preview!⊘
Do you want full access?
Subscribe today to unlock all pages.
Trusted by 1+ million students worldwide
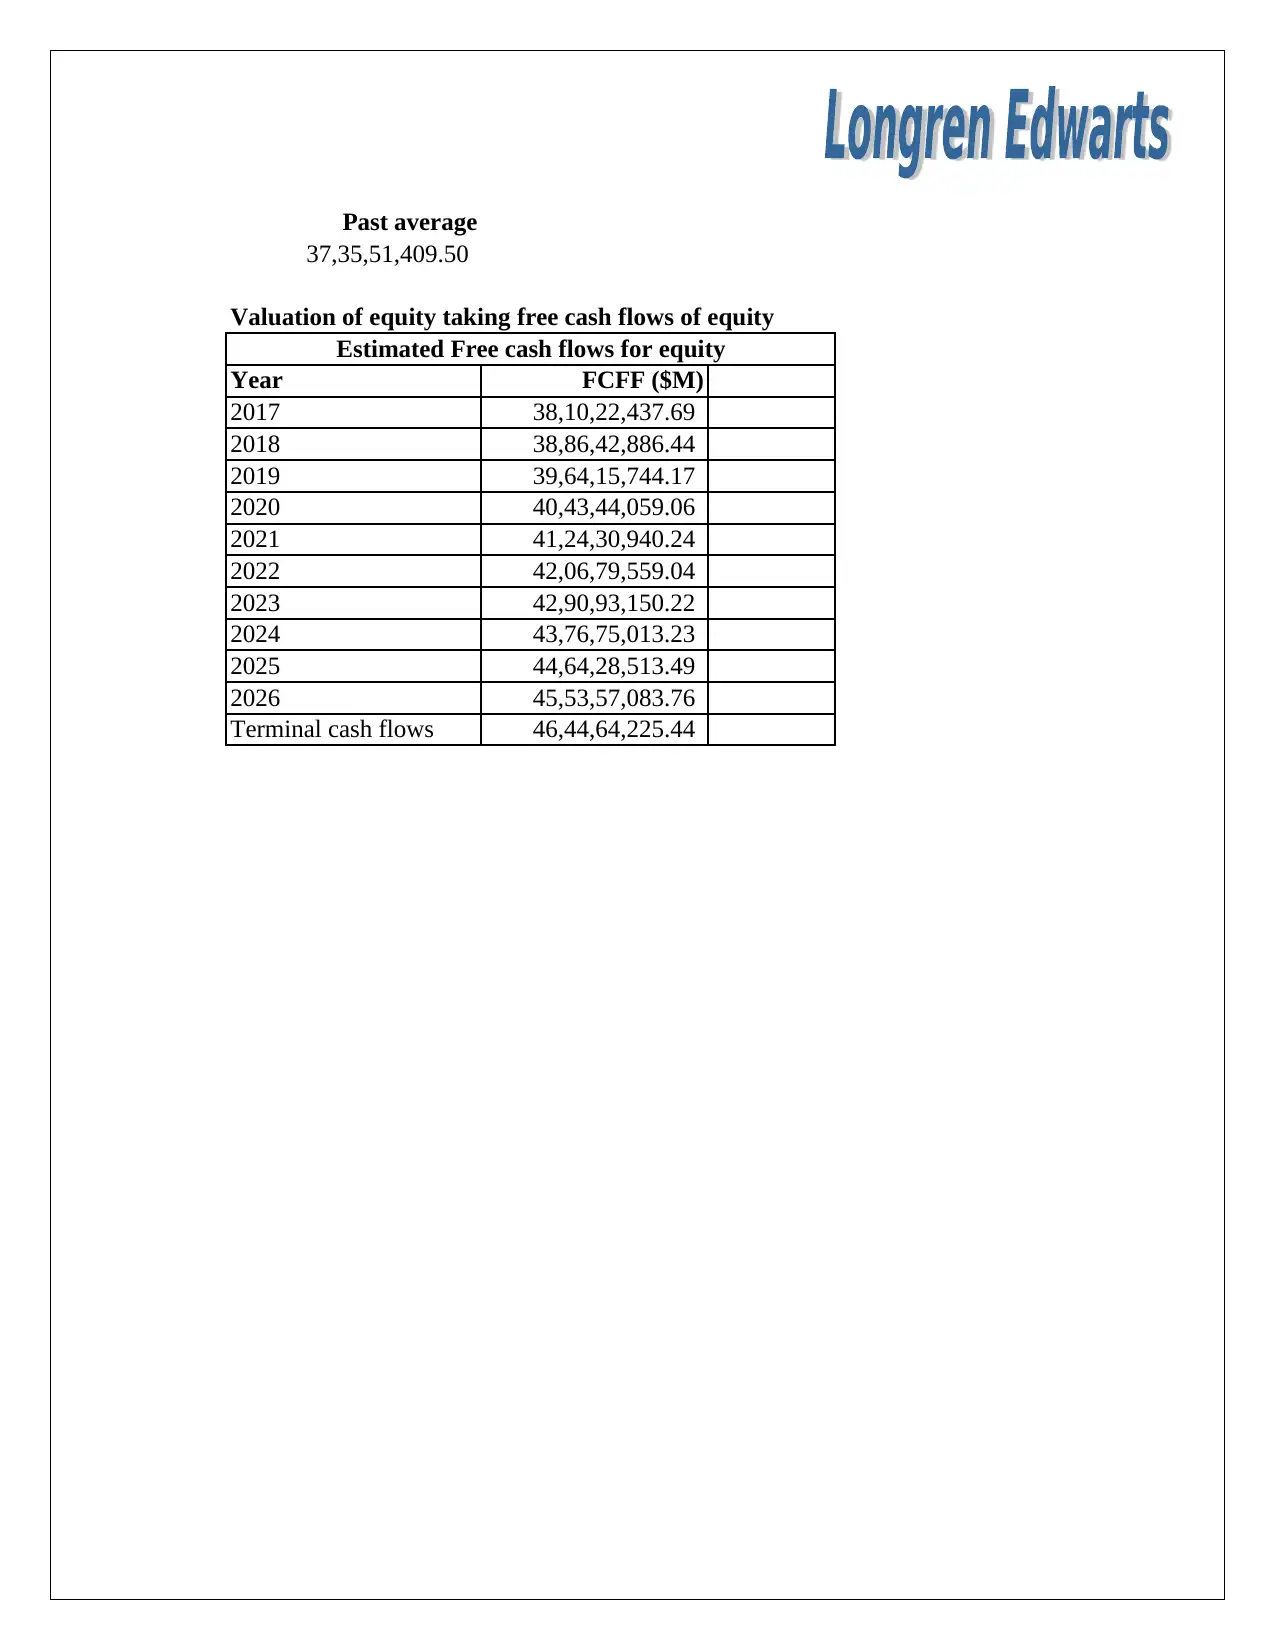
Past average
37,35,51,409.50
Valuation of equity taking free cash flows of equity
Year FCFF ($M)
2017 38,10,22,437.69
2018 38,86,42,886.44
2019 39,64,15,744.17
2020 40,43,44,059.06
2021 41,24,30,940.24
2022 42,06,79,559.04
2023 42,90,93,150.22
2024 43,76,75,013.23
2025 44,64,28,513.49
2026 45,53,57,083.76
Terminal cash flows 46,44,64,225.44
Estimated Free cash flows for equity
Paraphrase This Document
Need a fresh take? Get an instant paraphrase of this document with our AI Paraphraser
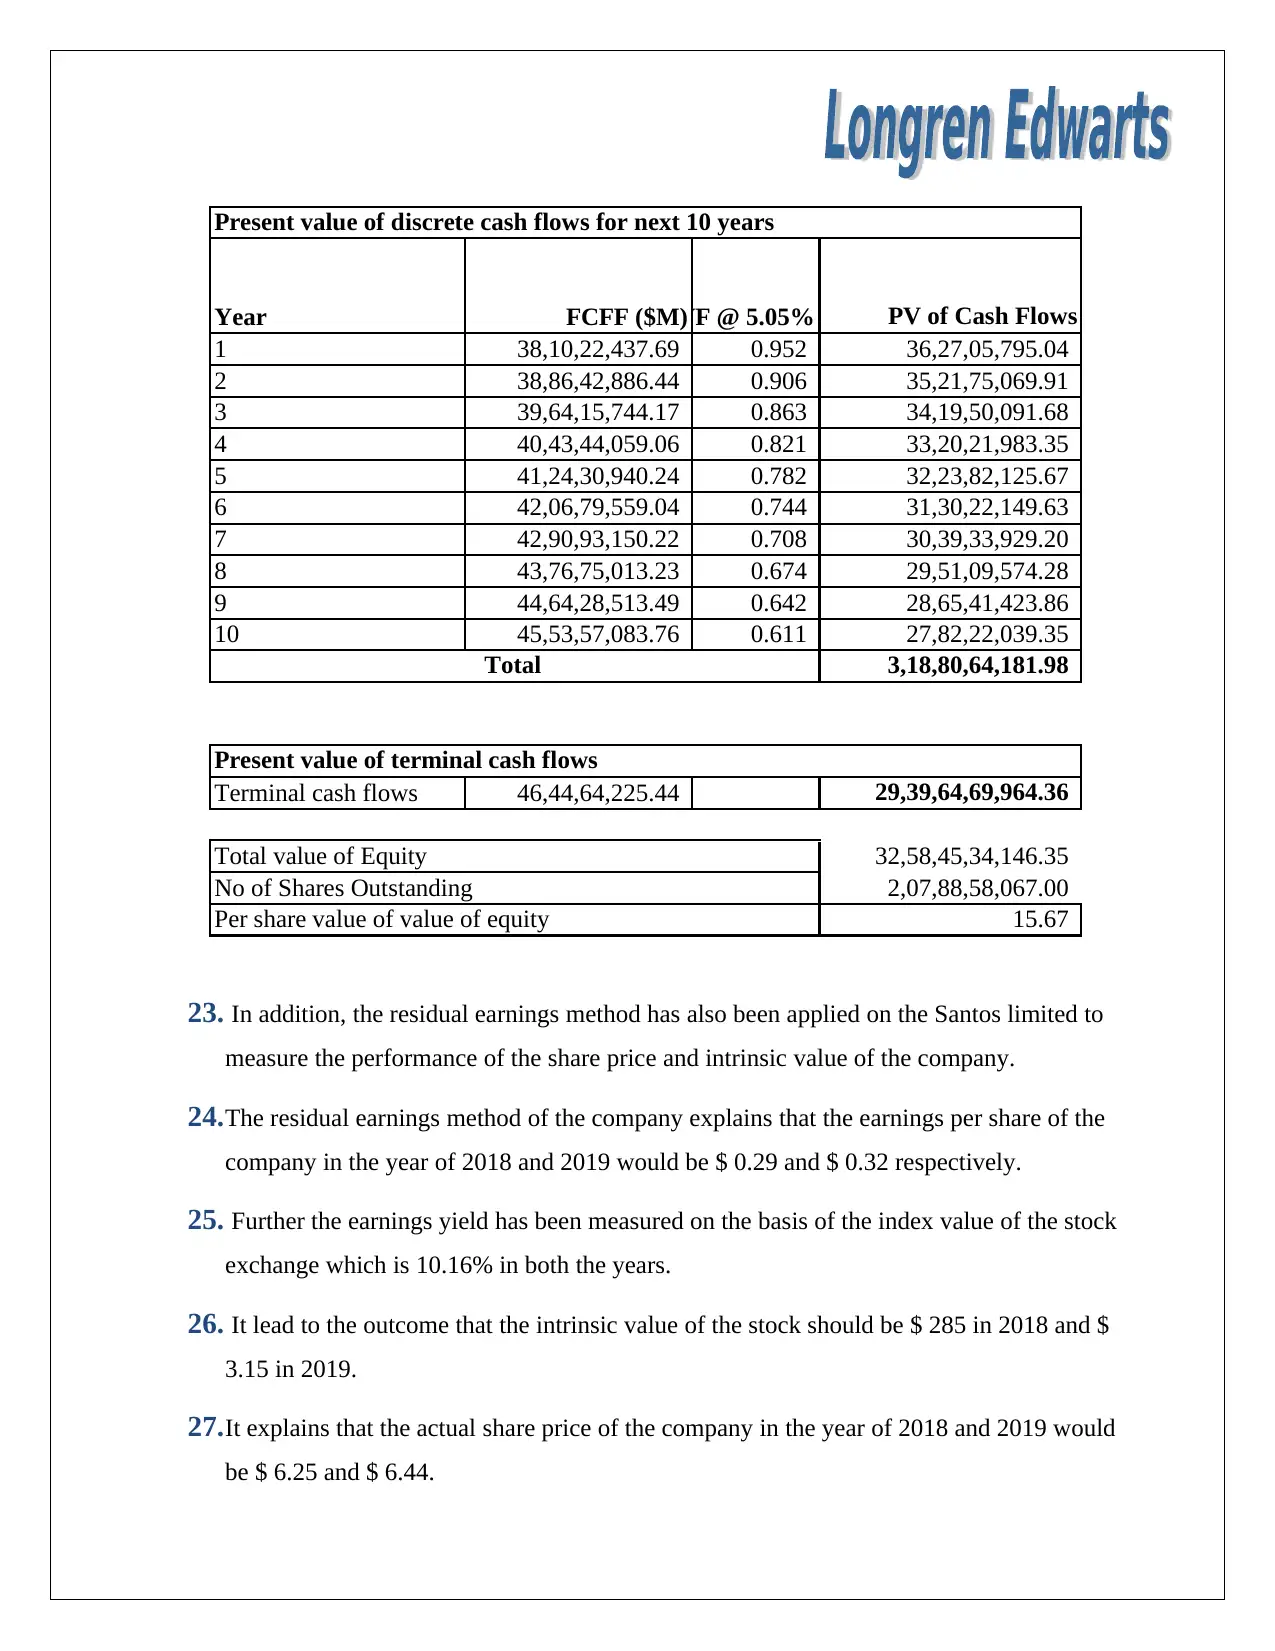
Year FCFF ($M)PVF @ 5.05% PV of Cash Flows
1 38,10,22,437.69 0.952 36,27,05,795.04
2 38,86,42,886.44 0.906 35,21,75,069.91
3 39,64,15,744.17 0.863 34,19,50,091.68
4 40,43,44,059.06 0.821 33,20,21,983.35
5 41,24,30,940.24 0.782 32,23,82,125.67
6 42,06,79,559.04 0.744 31,30,22,149.63
7 42,90,93,150.22 0.708 30,39,33,929.20
8 43,76,75,013.23 0.674 29,51,09,574.28
9 44,64,28,513.49 0.642 28,65,41,423.86
10 45,53,57,083.76 0.611 27,82,22,039.35
3,18,80,64,181.98
Terminal cash flows 46,44,64,225.44 29,39,64,69,964.36
32,58,45,34,146.35
2,07,88,58,067.00
15.67
Total value of Equity
No of Shares Outstanding
Per share value of value of equity
Present value of discrete cash flows for next 10 years
Total
Present value of terminal cash flows
23. In addition, the residual earnings method has also been applied on the Santos limited to
measure the performance of the share price and intrinsic value of the company.
24.The residual earnings method of the company explains that the earnings per share of the
company in the year of 2018 and 2019 would be $ 0.29 and $ 0.32 respectively.
25. Further the earnings yield has been measured on the basis of the index value of the stock
exchange which is 10.16% in both the years.
26. It lead to the outcome that the intrinsic value of the stock should be $ 285 in 2018 and $
3.15 in 2019.
27.It explains that the actual share price of the company in the year of 2018 and 2019 would
be $ 6.25 and $ 6.44.
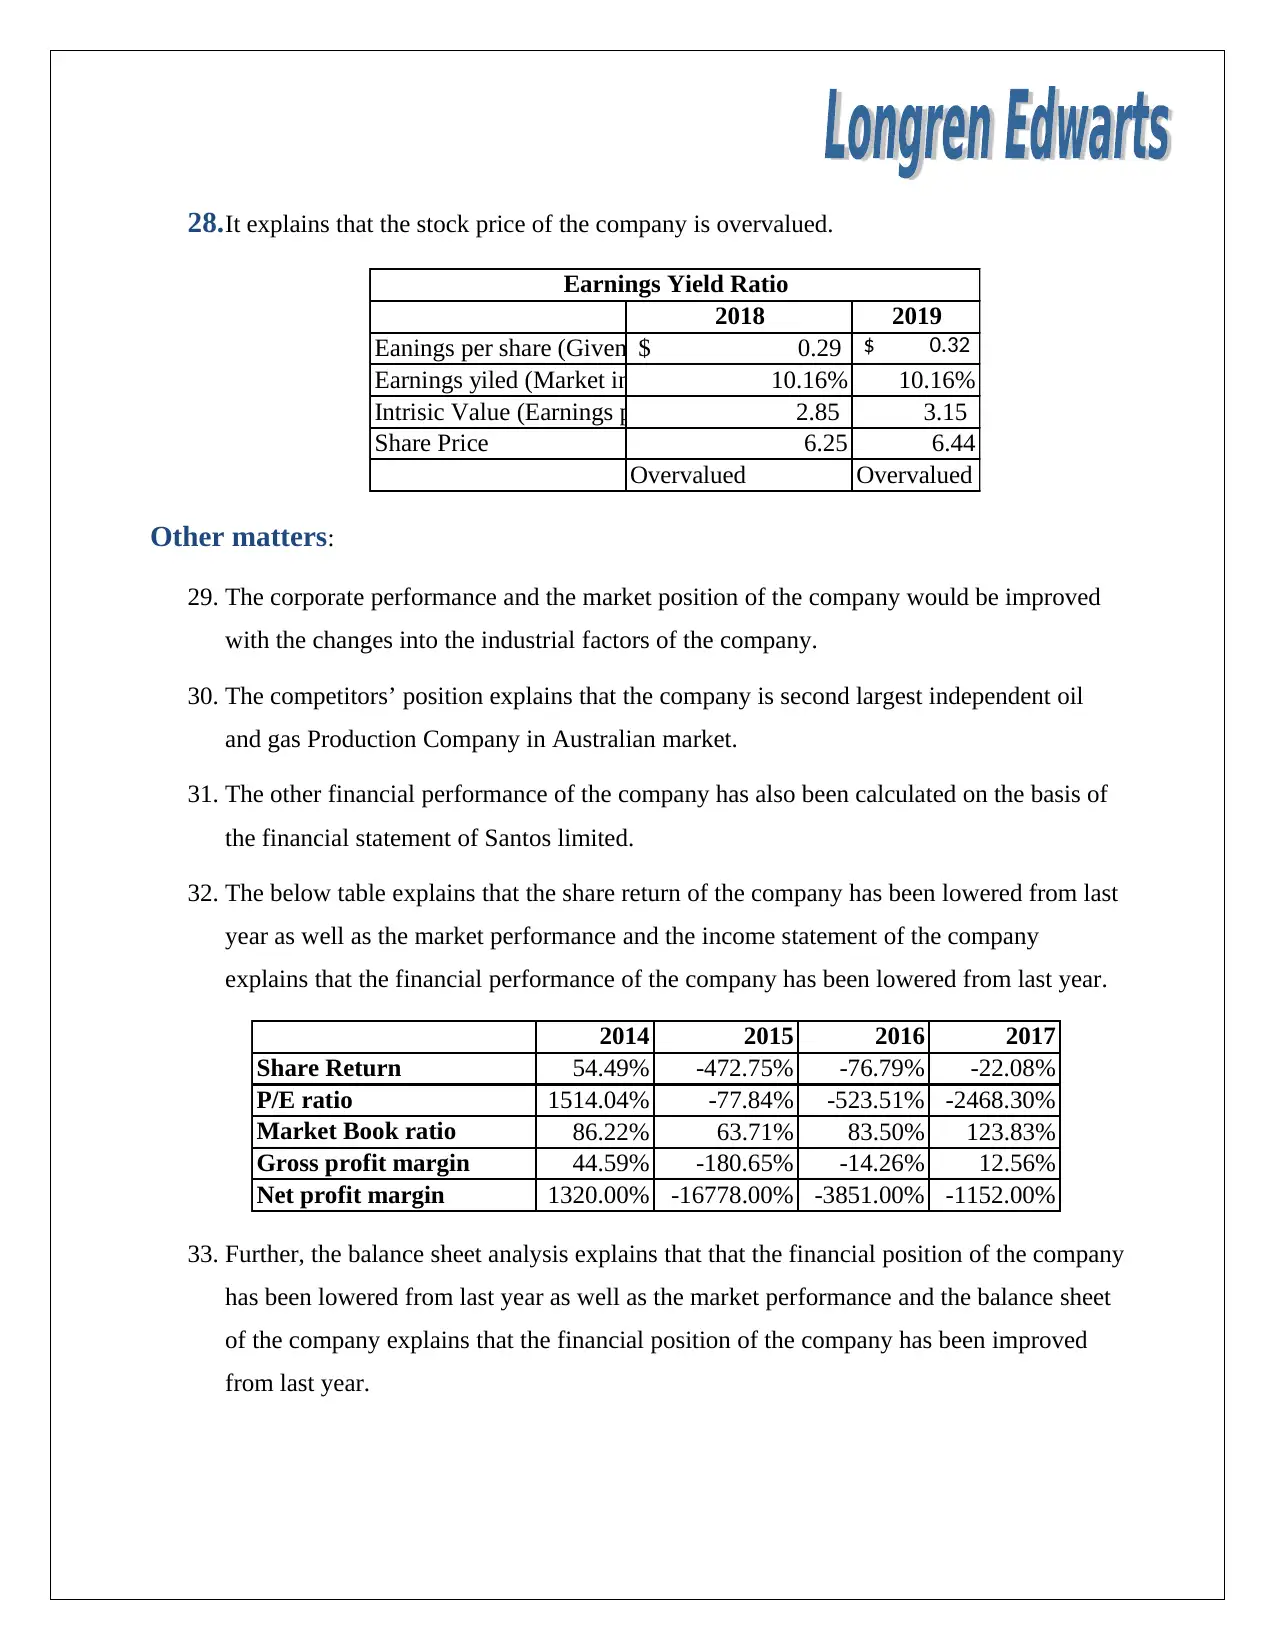
28.It explains that the stock price of the company is overvalued.
2018 2019
Eanings per share (Given in the case) 0.29$ 0.32$
Earnings yiled (Market index price) 10.16% 10.16%
Intrisic Value (Earnings per share / Earnings yield)2.85 3.15
Share Price 6.25 6.44
Overvalued Overvalued
Earnings Yield Ratio
Other matters:
29. The corporate performance and the market position of the company would be improved
with the changes into the industrial factors of the company.
30. The competitors’ position explains that the company is second largest independent oil
and gas Production Company in Australian market.
31. The other financial performance of the company has also been calculated on the basis of
the financial statement of Santos limited.
32. The below table explains that the share return of the company has been lowered from last
year as well as the market performance and the income statement of the company
explains that the financial performance of the company has been lowered from last year.
2014 2015 2016 2017
Share Return 54.49% -472.75% -76.79% -22.08%
P/E ratio 1514.04% -77.84% -523.51% -2468.30%
Market Book ratio 86.22% 63.71% 83.50% 123.83%
Gross profit margin 44.59% -180.65% -14.26% 12.56%
Net profit margin 1320.00% -16778.00% -3851.00% -1152.00%
33. Further, the balance sheet analysis explains that that the financial position of the company
has been lowered from last year as well as the market performance and the balance sheet
of the company explains that the financial position of the company has been improved
from last year.
⊘ This is a preview!⊘
Do you want full access?
Subscribe today to unlock all pages.
Trusted by 1+ million students worldwide
1 out of 14
Related Documents


Your All-in-One AI-Powered Toolkit for Academic Success.
+13062052269
info@desklib.com
Available 24*7 on WhatsApp / Email
![[object Object]](/_next/static/media/star-bottom.7253800d.svg)
Unlock your academic potential
Copyright © 2020–2026 A2Z Services. All Rights Reserved. Developed and managed by ZUCOL.