Health Economics
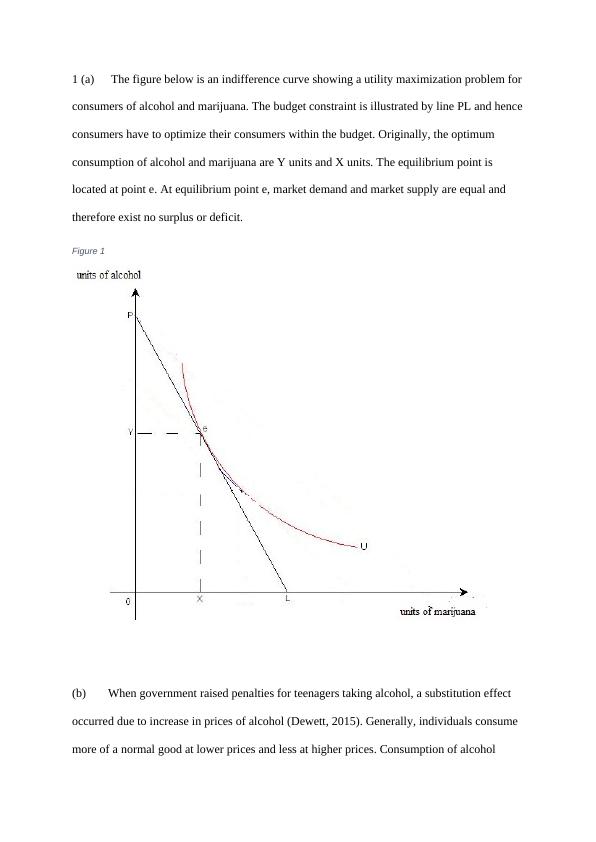
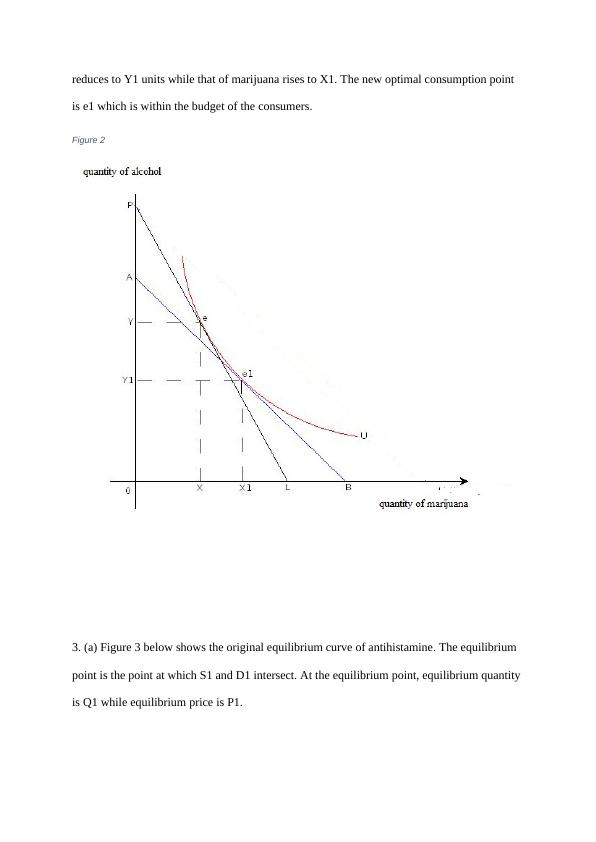
Create a figure showing utility maximization problem for consumers with alcohol and marijuana as perfect substitutes, and show how consumer choices change when penalties for teenagers trying to buy alcohol increase. Also, calculate average cost and marginal cost for a firm producing widgets and calculate the profit at a given market price.
Added on 2023-06-04
About This Document
Health Economics
Create a figure showing utility maximization problem for consumers with alcohol and marijuana as perfect substitutes, and show how consumer choices change when penalties for teenagers trying to buy alcohol increase. Also, calculate average cost and marginal cost for a firm producing widgets and calculate the profit at a given market price.
Added on 2023-06-04
End of preview
Want to access all the pages? Upload your documents or become a member.