Health Workforce Planning
VerifiedAdded on 2022/12/26
|15
|3863
|1
AI Summary
This report discusses the importance of health workforce planning and strategies to implement it. It highlights the shortage of health workers in India and the distribution patterns. The study focuses on the development of a workforce plan in India, including an environmental scan and identification of critical issues.
Contribute Materials
Your contribution can guide someone’s learning journey. Share your
documents today.

Running head: HEALTH WORKFORCE PLANNING
Health workforce planning
Name of the Student:
Name of the University:
Author Note:
Health workforce planning
Name of the Student:
Name of the University:
Author Note:
Secure Best Marks with AI Grader
Need help grading? Try our AI Grader for instant feedback on your assignments.
1HEALTH WORKFORCE PLANNING
Executive Summary
The global economy has created a total of 40 million jobs in the health sector by 2030 and it will
represent the workforce globally. However, it is important to note that the majority of the jobs
will be created in the developed and wealthy country and it will create a short of 18 million of
health workers especially in the lower middle income and low-income countries. India falls in
the low-income category country and it is important to mention that India is currently facing a
shortage of the health workforce. As per the WHO report on "The health workforce in India" the
total population was 1028610328 for the year 2001 and the total number of health workers was
2069540. It is important to mention that 83 percent of the total nurse workforce are female
nurses, while 30 percent of the entire health workers form the female health workers. It has also
been seen that about 53 percent of the male health workers are the doctors and only 17 percent of
the female health workforce were the doctors. The north-central states and the northeastern states
have a low density of the qualified workers and it is less when compared with the national
average. Similarly, the densities of the midwives, doctors and the qualified nurses varied largely
across the states and the same kind of the distribution patterns is not followed by the qualified
health workers.
2HEALTH WORKFORCE PLANNING
Contents
Introduction......................................................................................................................................3
Rationale..........................................................................................................................................4
Environmental Scan for the health workforce.................................................................................4
Data profile of the health workforce by category............................................................................6
Strategies relevant to implement the workforce plan......................................................................9
Conclusion.....................................................................................................................................11
Reference.......................................................................................................................................12
3HEALTH WORKFORCE PLANNING
Introduction
Workforce planning can be described as the process which ensures an organization to
have both the current and future access to the human capital and it also ensures the process
functions in an effective manner. Therefore, it can be said that workplace planning includes the
identification of both the current and future needs of the employees or staffs and explore the
cost-effective and appropriate means of retaining and recruiting the individuals. It has been
highlighted by the United Nations commission that there will be a shortfall of the 18 million
healthcare workers by the year 2030. It has mainly emphasized that the healthcare workers will
mainly be low in the countries that are low to middle-income countries so that the population
needs are achieved and met. This is done through a proper universal health coverage and it
increases the economic growth. This report has mentioned that the demand for the health
workers has increased to a great extent due to the increased rates of the non-communicable
diseases as well as the increase in aged population (Myrick & del Vecchio, 2016). The global
economy is projected to actually create a total of 40 million jobs in the health sector by 2030 and
it will represent the workforce globally. However, it is important to note that the majority of the
jobs will be created in the developed and wealthy country and will create a short of 18 million of
health workers especially in the lower middle income and low-income countries (Limb, 2016).
Therefore, it is important to mention that the investment in the health workforce is highly
required for making progress towards sustainable development goals. The goal also includes
inclusive economic growth, global security, and gains in health. This study will emphasize on the
development of a workforce plan in India and it will include the preparation of an environmental
scan, identification of the critical issues and the development strategies so that the issues are
identified. The national workforce plan will include a 5- year plan.
Secure Best Marks with AI Grader
Need help grading? Try our AI Grader for instant feedback on your assignments.
4HEALTH WORKFORCE PLANNING
Rationale
India is selected for the analysis of the workforce plan because according to the World
Health Statistics Report, 2015 India falls in the low-income category country and it is important
to mention that India is currently facing a shortage of the health workforce (Fan & Anand, 2016).
As per the WHO report on "The health workforce in India" the total number of population was
1028610328 for the 2001 and similarly the number of health workers were 2069540 and among
these the total number of doctors were 819475, the total number of nurses and midwives were
630406 and the total number of dentists were 24403. When considered in terms of density it is
seen that there are a total of 7.7 doctors for 1 lakh of population and the density of midwives
were 61.3 per 1 lakh population and only2.4 dentists for one lakh of the population (“WHO | The
health workforce in India,” 2016).
Environmental Scan for the health workforce
Studies have indicated that in between the year 2011 to 2012, there is a total of 2.5
million workers in India and the density is 20.9 workers per ten thousand populations. It is
important to mention that about 56.4 percent of the workers are unqualified and it includes 69
percent of health associates, 58 percent of the midwives and nurses, 56 percent of the
homeopathy (AYUSH) practitioners, Siddha, Unani, naturopathy, yoga and Ayurveda, 27
percent of the dentists, 42 percent of the allopathic doctors (Mathur, Singh, & Watt, 2015).
Moreover, in terms of the cadre, there is a total of 3.3 qualified allopathic doctors and there is a
total of 3 nurses for every ten thousand populations (fig 1). Whereas, out of the qualified
workers, there is a total of 77 percent are situated in the urban areas and the urban population is
found to be only 31 percent of the entire population in India. It is important to mention that there
exists a difference between rural and urban doctors that practice allopathy. It is important to
5HEALTH WORKFORCE PLANNING
mention that the density of the allopathy doctors is 11 times more than the urban areas in
comparison to the midwives and nurses which is again 5.5 times more than the urban areas (Rao,
Shahrawat, & Bhatnagar, 2016).
The health workforce of India has expanded significantly in the past decade and it is due
to the supply of the health workforce that are qualified have increased due to an increased
number of training institutes that trains the health workers, nurses and doctors. The National
Rural health mission is now called as the National Health Mission and this has increased and
added a total of 870,000 of a social activist whose sole purpose is to serve the community health
workers. It is important to mention that the developments are significant and the study also
highlights that India is now experiencing a shortage of health workers to a large extent in the
urban regions. This also highlights how the infusion of the social health activists have actually
reduced the inequity and deficit of the geographical distribution of the health workers. It is
important to mention that the data on the health workforce is weak in India as the routine sources
are not available and the information is largely fragmented and at the same time they are
unreliable as well. It has been found that the government sources only facilitate information on
the public sector workforce that is present in the rural areas, while at the same they are silent
about of the urban areas like the tertiary and secondary levels. The government also do not
provide data on the private sectors. The only place where the statistics are found are on the
homeopathy (AYUSH), Siddha, Unani, naturopathy, yoga, Ayurveda, pharmacists, nurses, and
doctors and it is provided in the professional councils and they publish statistics routinely.
However, it is a major concern that the lack of live registers also cast a shadow on the reliability
of the estimations. The important fact that is not taken into account is the number of practitioners
that are leaving the workforce due to retirement and or death. The ones that do not have a
6HEALTH WORKFORCE PLANNING
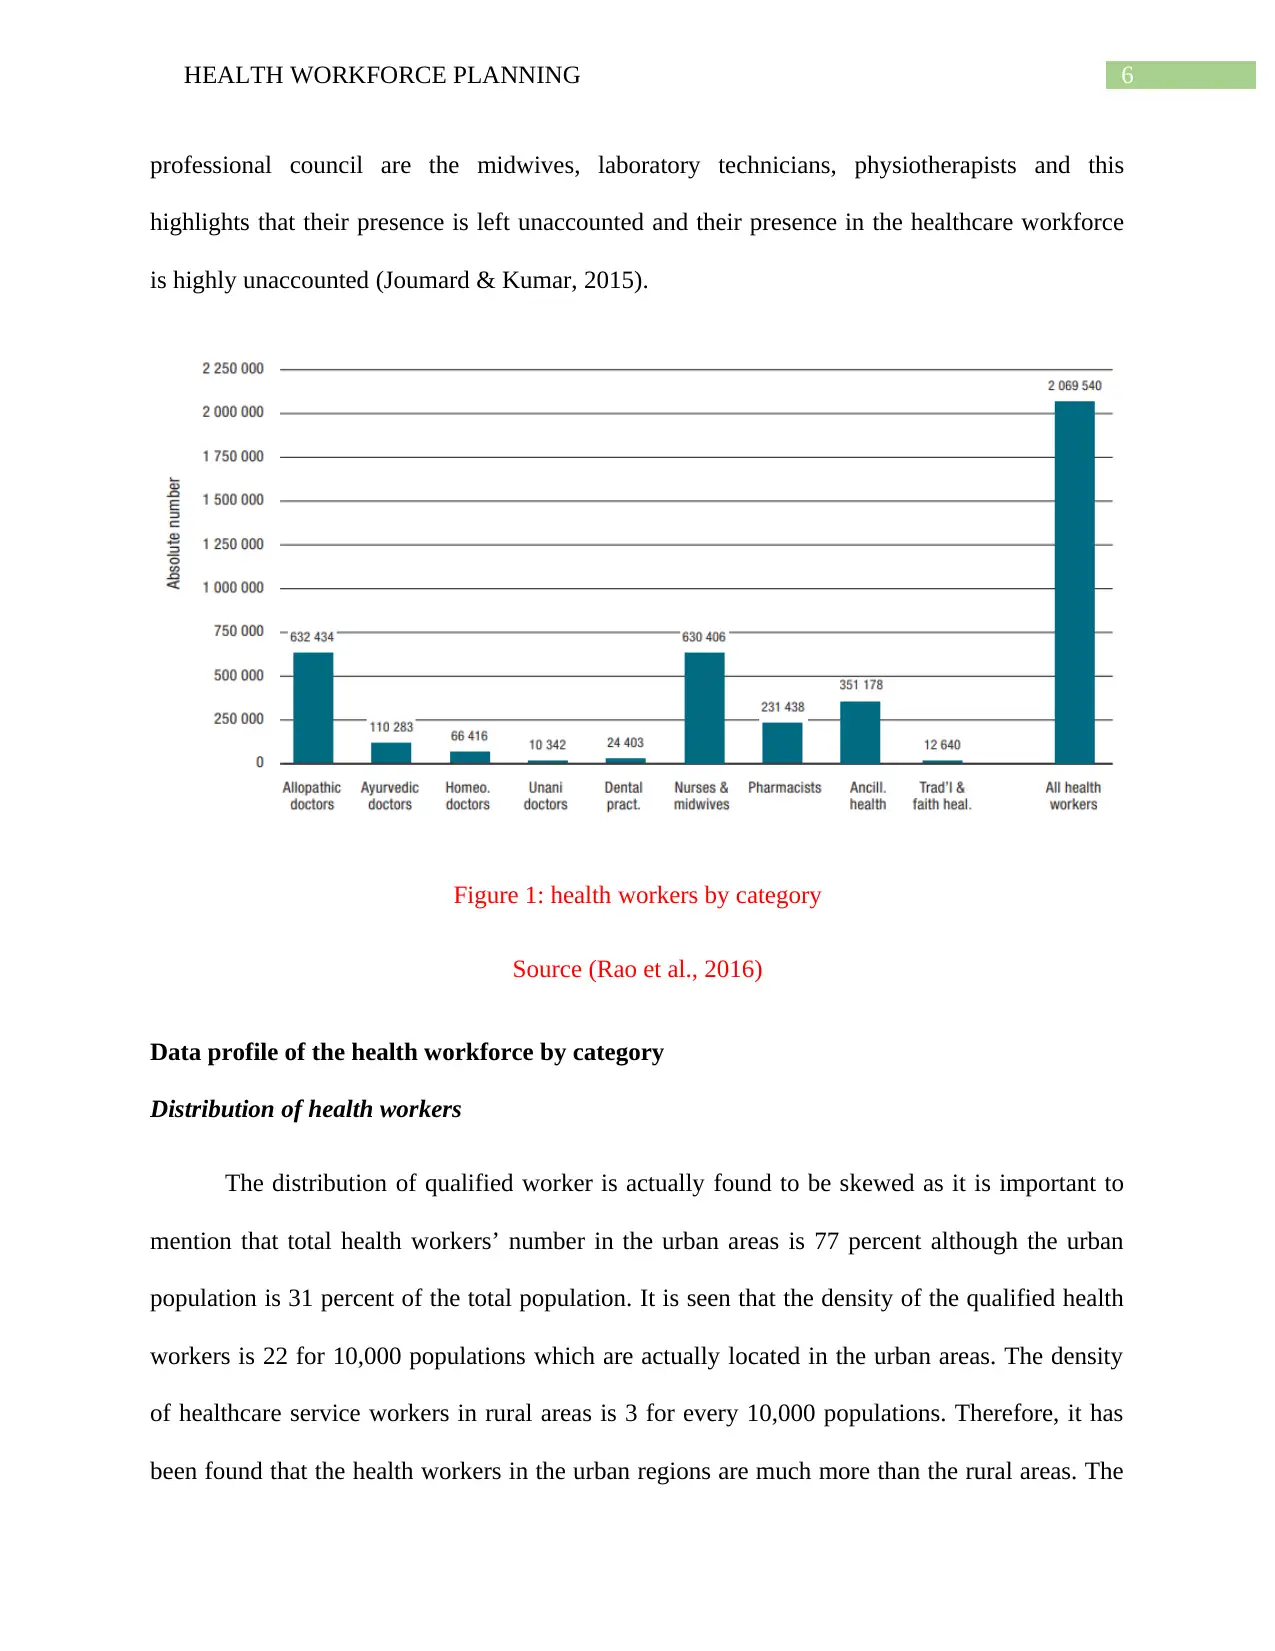
professional council are the midwives, laboratory technicians, physiotherapists and this
highlights that their presence is left unaccounted and their presence in the healthcare workforce
is highly unaccounted (Joumard & Kumar, 2015).
Figure 1: health workers by category
Source (Rao et al., 2016)
Data profile of the health workforce by category
Distribution of health workers
The distribution of qualified worker is actually found to be skewed as it is important to
mention that total health workers’ number in the urban areas is 77 percent although the urban
population is 31 percent of the total population. It is seen that the density of the qualified health
workers is 22 for 10,000 populations which are actually located in the urban areas. The density
of healthcare service workers in rural areas is 3 for every 10,000 populations. Therefore, it has
been found that the health workers in the urban regions are much more than the rural areas. The
Paraphrase This Document
Need a fresh take? Get an instant paraphrase of this document with our AI Paraphraser
7HEALTH WORKFORCE PLANNING
dominance of the urban healthcare workers is seen across all type of categories and the skewed
distribution is seen more in the allopathic doctors which is around 11 times more in the urban
areas in comparison to the rural areas, while at the same time the numbers of the allopathy
doctors are more than the midwives and the nurses (which is 5 times more in urban areas in
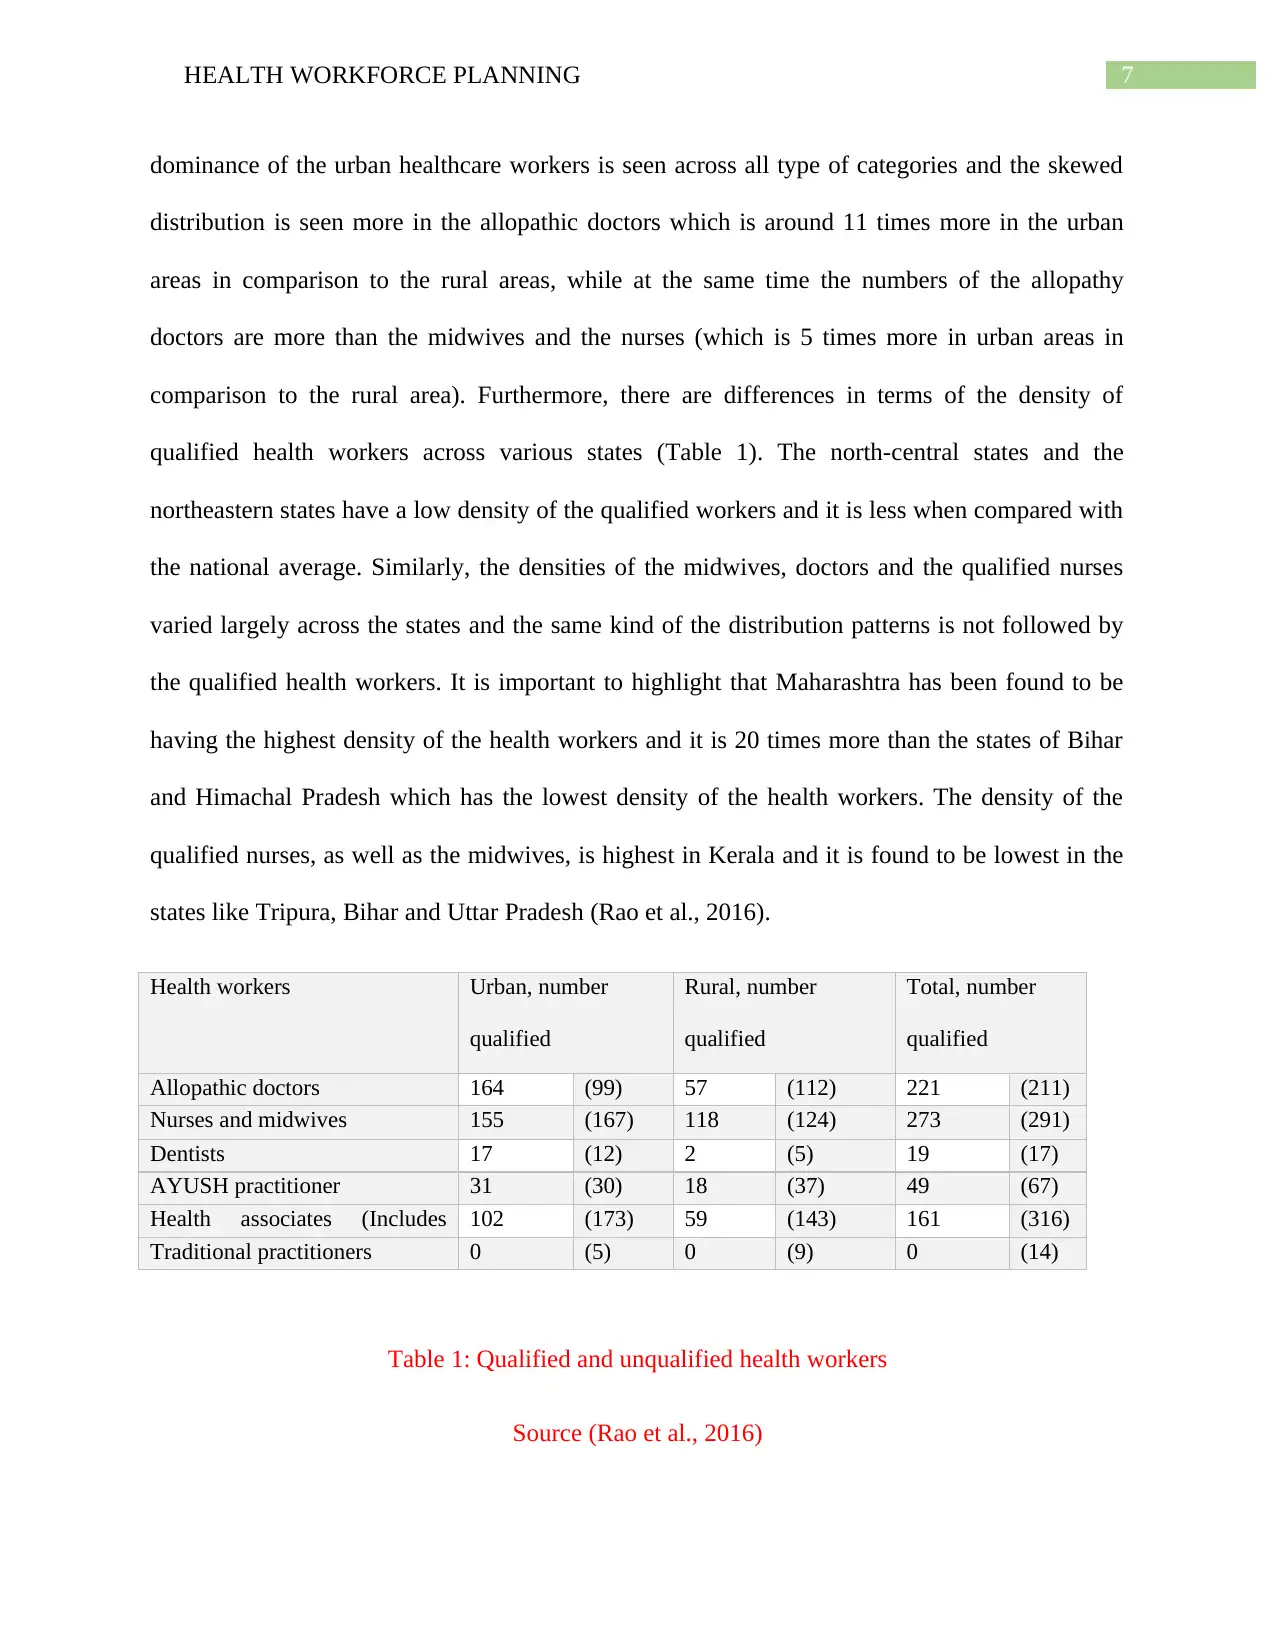
comparison to the rural area). Furthermore, there are differences in terms of the density of
qualified health workers across various states (Table 1). The north-central states and the
northeastern states have a low density of the qualified workers and it is less when compared with
the national average. Similarly, the densities of the midwives, doctors and the qualified nurses
varied largely across the states and the same kind of the distribution patterns is not followed by
the qualified health workers. It is important to highlight that Maharashtra has been found to be
having the highest density of the health workers and it is 20 times more than the states of Bihar
and Himachal Pradesh which has the lowest density of the health workers. The density of the
qualified nurses, as well as the midwives, is highest in Kerala and it is found to be lowest in the
states like Tripura, Bihar and Uttar Pradesh (Rao et al., 2016).
Health workers Urban, number
qualified
(unqualified)
Rural, number
qualified
(unqualified)
Total, number
qualified
(unqualified)Allopathic doctors 164 (99) 57 (112) 221 (211)
Nurses and midwives 155 (167) 118 (124) 273 (291)
Dentists 17 (12) 2 (5) 19 (17)
AYUSH practitioner 31 (30) 18 (37) 49 (67)
Health associates (Includes
pharmacists)
102 (173) 59 (143) 161 (316)
Traditional practitioners 0 (5) 0 (9) 0 (14)
Table 1: Qualified and unqualified health workers
Source (Rao et al., 2016)
dominance of the urban healthcare workers is seen across all type of categories and the skewed
distribution is seen more in the allopathic doctors which is around 11 times more in the urban
areas in comparison to the rural areas, while at the same time the numbers of the allopathy
doctors are more than the midwives and the nurses (which is 5 times more in urban areas in
comparison to the rural area). Furthermore, there are differences in terms of the density of
qualified health workers across various states (Table 1). The north-central states and the
northeastern states have a low density of the qualified workers and it is less when compared with
the national average. Similarly, the densities of the midwives, doctors and the qualified nurses
varied largely across the states and the same kind of the distribution patterns is not followed by
the qualified health workers. It is important to highlight that Maharashtra has been found to be
having the highest density of the health workers and it is 20 times more than the states of Bihar
and Himachal Pradesh which has the lowest density of the health workers. The density of the
qualified nurses, as well as the midwives, is highest in Kerala and it is found to be lowest in the
states like Tripura, Bihar and Uttar Pradesh (Rao et al., 2016).
Health workers Urban, number
qualified
(unqualified)
Rural, number
qualified
(unqualified)
Total, number
qualified
(unqualified)Allopathic doctors 164 (99) 57 (112) 221 (211)
Nurses and midwives 155 (167) 118 (124) 273 (291)
Dentists 17 (12) 2 (5) 19 (17)
AYUSH practitioner 31 (30) 18 (37) 49 (67)
Health associates (Includes
pharmacists)
102 (173) 59 (143) 161 (316)
Traditional practitioners 0 (5) 0 (9) 0 (14)
Table 1: Qualified and unqualified health workers
Source (Rao et al., 2016)
8HEALTH WORKFORCE PLANNING
Distribution on the basis of gender
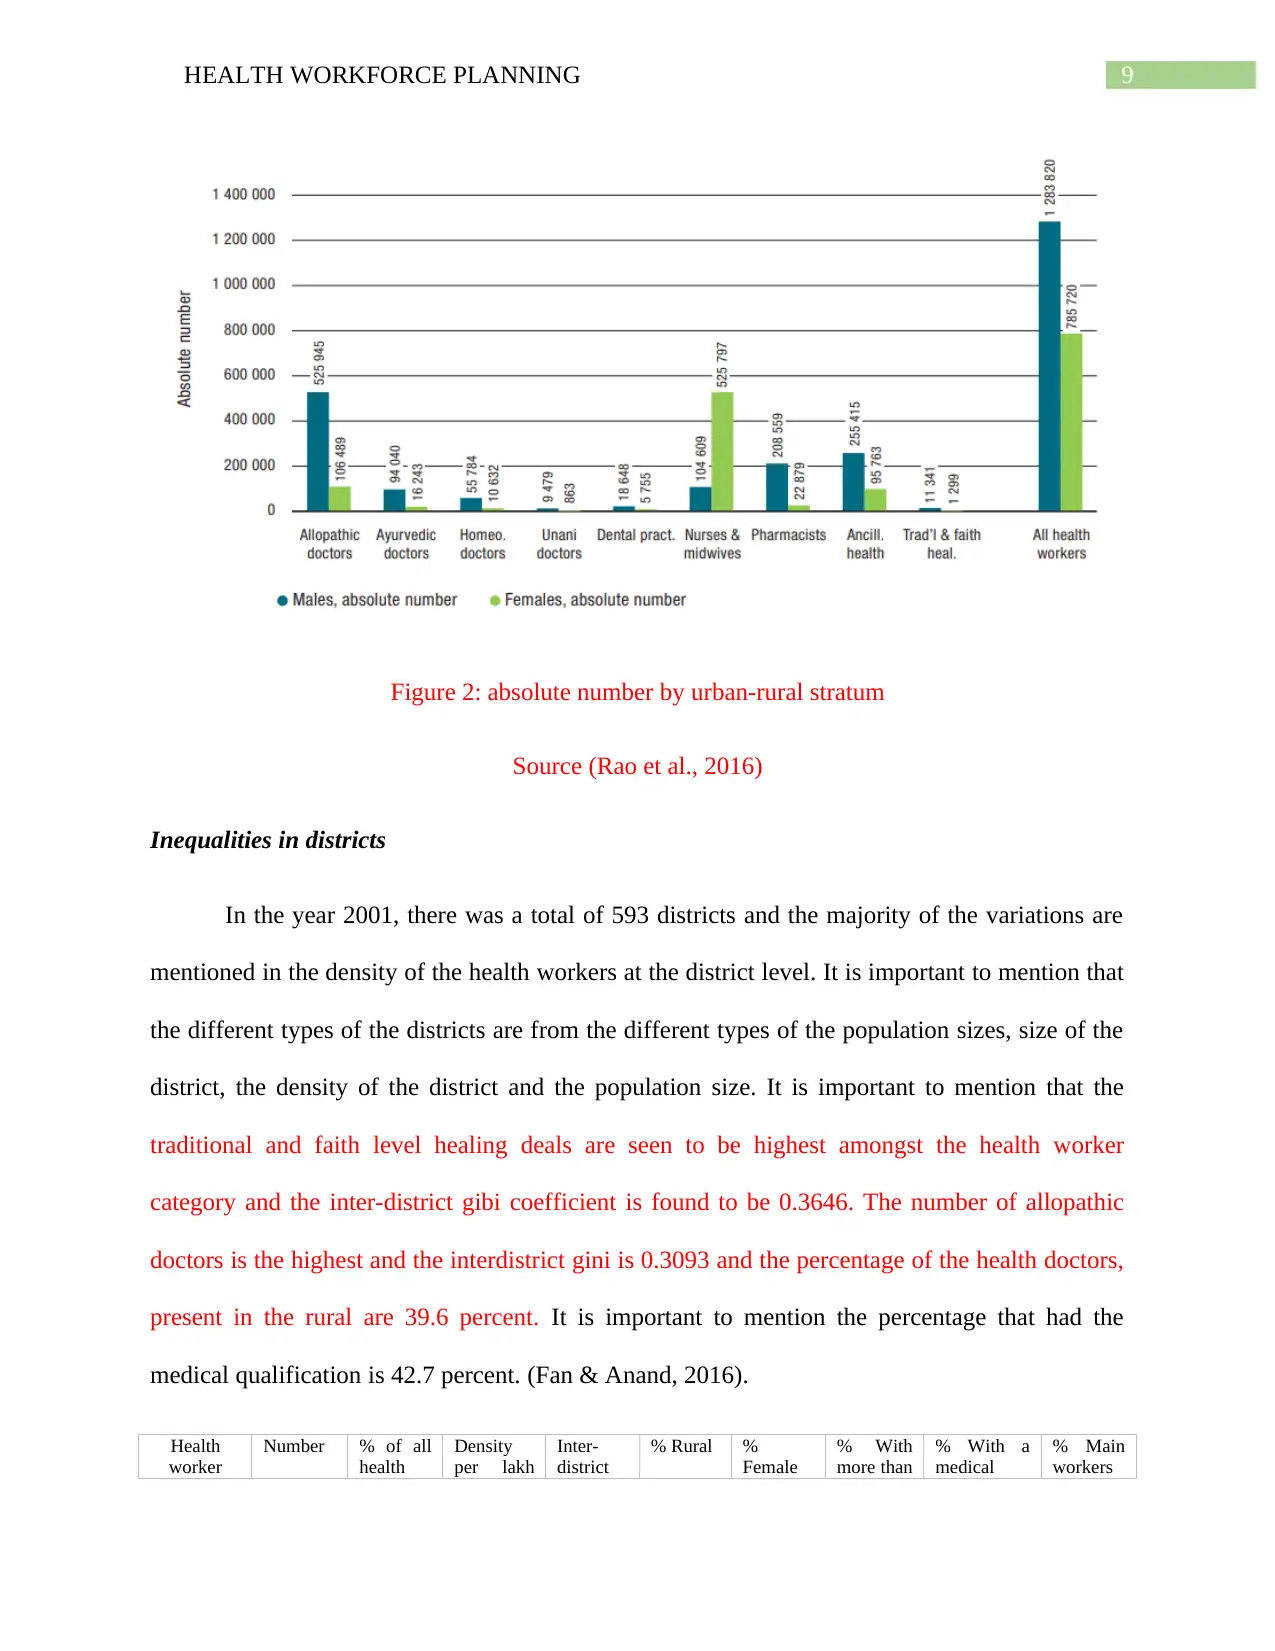
The total number of female health workers as well as male health workers are 785720
and 1283820 respectively. Therefore, it can be said that the male and female ratio of the health
workers is 1.6. Of the total health workers, 38 percent of the health workers are female and about
16 percent belongs to the category of female allopathic doctors. There are more female midwives
and nurses in comparison to male midwives and nurses. Therefore, 83 percent of the total nurse
workforce are female nurses, while 30 percent of the entire health workers form the female
health workers. It has also been seen that about 53 percent of the male health workers are the
doctors and only 17 percent of the female health workforce were the doctors (figure 2).
However, the percentage of the male health workers that were nurses were 8 percent and the
percentage of the female health workers that are nurses were 66 percent. It has been found that
the highest male and female ratio was Unani doctors and the ratio is 1.1. The lowest ratio is
noticed in the nurses and the male-female ratio was found to be 0.2. The density of the male
health worker at the national level was 124 and the density of the female health worker at the
national level is 76 and this adds up to a national average of 201 health worker (“WHO | The
health workforce in India,” 2016).
Distribution on the basis of gender
The total number of female health workers as well as male health workers are 785720
and 1283820 respectively. Therefore, it can be said that the male and female ratio of the health
workers is 1.6. Of the total health workers, 38 percent of the health workers are female and about
16 percent belongs to the category of female allopathic doctors. There are more female midwives
and nurses in comparison to male midwives and nurses. Therefore, 83 percent of the total nurse
workforce are female nurses, while 30 percent of the entire health workers form the female
health workers. It has also been seen that about 53 percent of the male health workers are the
doctors and only 17 percent of the female health workforce were the doctors (figure 2).
However, the percentage of the male health workers that were nurses were 8 percent and the
percentage of the female health workers that are nurses were 66 percent. It has been found that
the highest male and female ratio was Unani doctors and the ratio is 1.1. The lowest ratio is
noticed in the nurses and the male-female ratio was found to be 0.2. The density of the male
health worker at the national level was 124 and the density of the female health worker at the
national level is 76 and this adds up to a national average of 201 health worker (“WHO | The
health workforce in India,” 2016).
9HEALTH WORKFORCE PLANNING
Figure 2: absolute number by urban-rural stratum
Source (Rao et al., 2016)
Inequalities in districts
In the year 2001, there was a total of 593 districts and the majority of the variations are
mentioned in the density of the health workers at the district level. It is important to mention that
the different types of the districts are from the different types of the population sizes, size of the
district, the density of the district and the population size. It is important to mention that the
traditional and faith level healing deals are seen to be highest amongst the health worker
category and the inter-district gibi coefficient is found to be 0.3646. The number of allopathic
doctors is the highest and the interdistrict gini is 0.3093 and the percentage of the health doctors,
present in the rural are 39.6 percent. It is important to mention the percentage that had the
medical qualification is 42.7 percent. (Fan & Anand, 2016).
Health
worker
Number % of all
health
Density
per lakh
Inter-
district
% Rural %
Female
% With
more than
% With a
medical
% Main
workers
Secure Best Marks with AI Grader
Need help grading? Try our AI Grader for instant feedback on your assignments.
10HEALTH WORKFORCE PLANNING
category workers population gini secondary
schooling
qualification
Allopathic
doctors
632434 30.6 61.5 0.3093 39.6 16.8 68.6 42.7 97.7
Ayurvedic
doctors
110283 5.3 10.7 0.4212 42.4 14.7 74.8 60.1 97.3
Homeo.
doctors
66416 3.2 6.5 0.5410 45.8 16.0 66.9 41.8 97.2
Unani
doctors
10342 0.5 1.0 0.6588 32.4 8.3 60.9 45.8 96.9
Dental
pract.
24403 1.2 2.4 0.5604 20.8 23.6 62.1 42.3 97.2
Nurses &
Midwives
630406 30.5 61.3 0.4014 39.6 83.4 32.9 9.9 94.8
Pharmacists 231438 11.2 22.5 0.2892 45.1 9.9 31.8 8.3 95.7
Ancill.
health
351178 17 34.1 0.3646 41.6 27.3 39.2 5.8 96.4
Trad'l &
faith heal.
12640 0.6 1.2 0.7620 63.6 10.3 37.2 7.2 90.9
All health
workers
2069540 100 201.2 0.2858 40.8 38.0 48.6 23.3 96.3
All doctors
& nurses
1449881 70.1 141.0 0.3016 40.1 45.5 53.4 29.7 96.4
All doctors 819475 39.6 79.7 0.2926 40.4 16.4 69.2 45 97.3
AYUSH
doctors
187041 9 18.2 0.3523 43.0 14.8 71.2 52.8 97.6
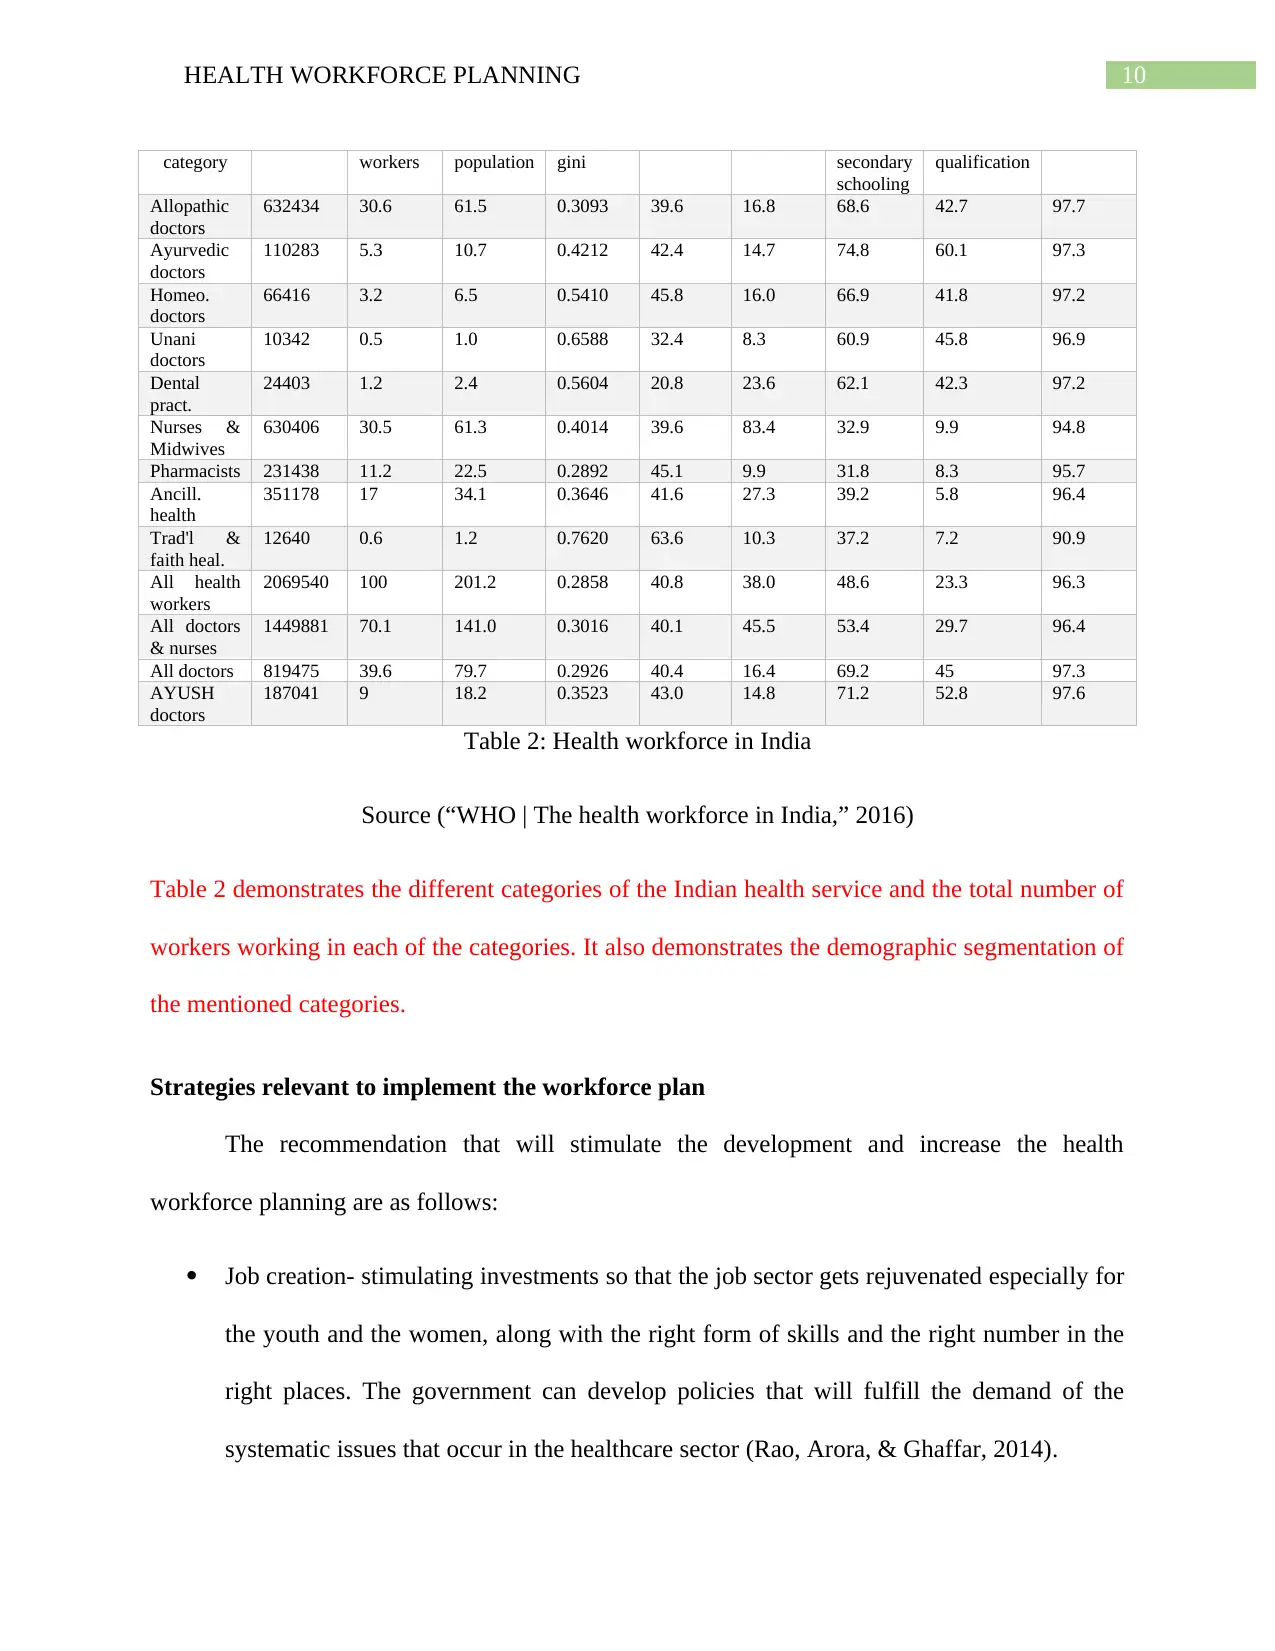
Table 2: Health workforce in India
Source (“WHO | The health workforce in India,” 2016)
Table 2 demonstrates the different categories of the Indian health service and the total number of
workers working in each of the categories. It also demonstrates the demographic segmentation of
the mentioned categories.
Strategies relevant to implement the workforce plan
The recommendation that will stimulate the development and increase the health
workforce planning are as follows:
Job creation- stimulating investments so that the job sector gets rejuvenated especially for
the youth and the women, along with the right form of skills and the right number in the
right places. The government can develop policies that will fulfill the demand of the
systematic issues that occur in the healthcare sector (Rao, Arora, & Ghaffar, 2014).
category workers population gini secondary
schooling
qualification
Allopathic
doctors
632434 30.6 61.5 0.3093 39.6 16.8 68.6 42.7 97.7
Ayurvedic
doctors
110283 5.3 10.7 0.4212 42.4 14.7 74.8 60.1 97.3
Homeo.
doctors
66416 3.2 6.5 0.5410 45.8 16.0 66.9 41.8 97.2
Unani
doctors
10342 0.5 1.0 0.6588 32.4 8.3 60.9 45.8 96.9
Dental
pract.
24403 1.2 2.4 0.5604 20.8 23.6 62.1 42.3 97.2
Nurses &
Midwives
630406 30.5 61.3 0.4014 39.6 83.4 32.9 9.9 94.8
Pharmacists 231438 11.2 22.5 0.2892 45.1 9.9 31.8 8.3 95.7
Ancill.
health
351178 17 34.1 0.3646 41.6 27.3 39.2 5.8 96.4
Trad'l &
faith heal.
12640 0.6 1.2 0.7620 63.6 10.3 37.2 7.2 90.9
All health
workers
2069540 100 201.2 0.2858 40.8 38.0 48.6 23.3 96.3
All doctors
& nurses
1449881 70.1 141.0 0.3016 40.1 45.5 53.4 29.7 96.4
All doctors 819475 39.6 79.7 0.2926 40.4 16.4 69.2 45 97.3
AYUSH
doctors
187041 9 18.2 0.3523 43.0 14.8 71.2 52.8 97.6
Table 2: Health workforce in India
Source (“WHO | The health workforce in India,” 2016)
Table 2 demonstrates the different categories of the Indian health service and the total number of
workers working in each of the categories. It also demonstrates the demographic segmentation of
the mentioned categories.
Strategies relevant to implement the workforce plan
The recommendation that will stimulate the development and increase the health
workforce planning are as follows:
Job creation- stimulating investments so that the job sector gets rejuvenated especially for
the youth and the women, along with the right form of skills and the right number in the
right places. The government can develop policies that will fulfill the demand of the
systematic issues that occur in the healthcare sector (Rao, Arora, & Ghaffar, 2014).
11HEALTH WORKFORCE PLANNING
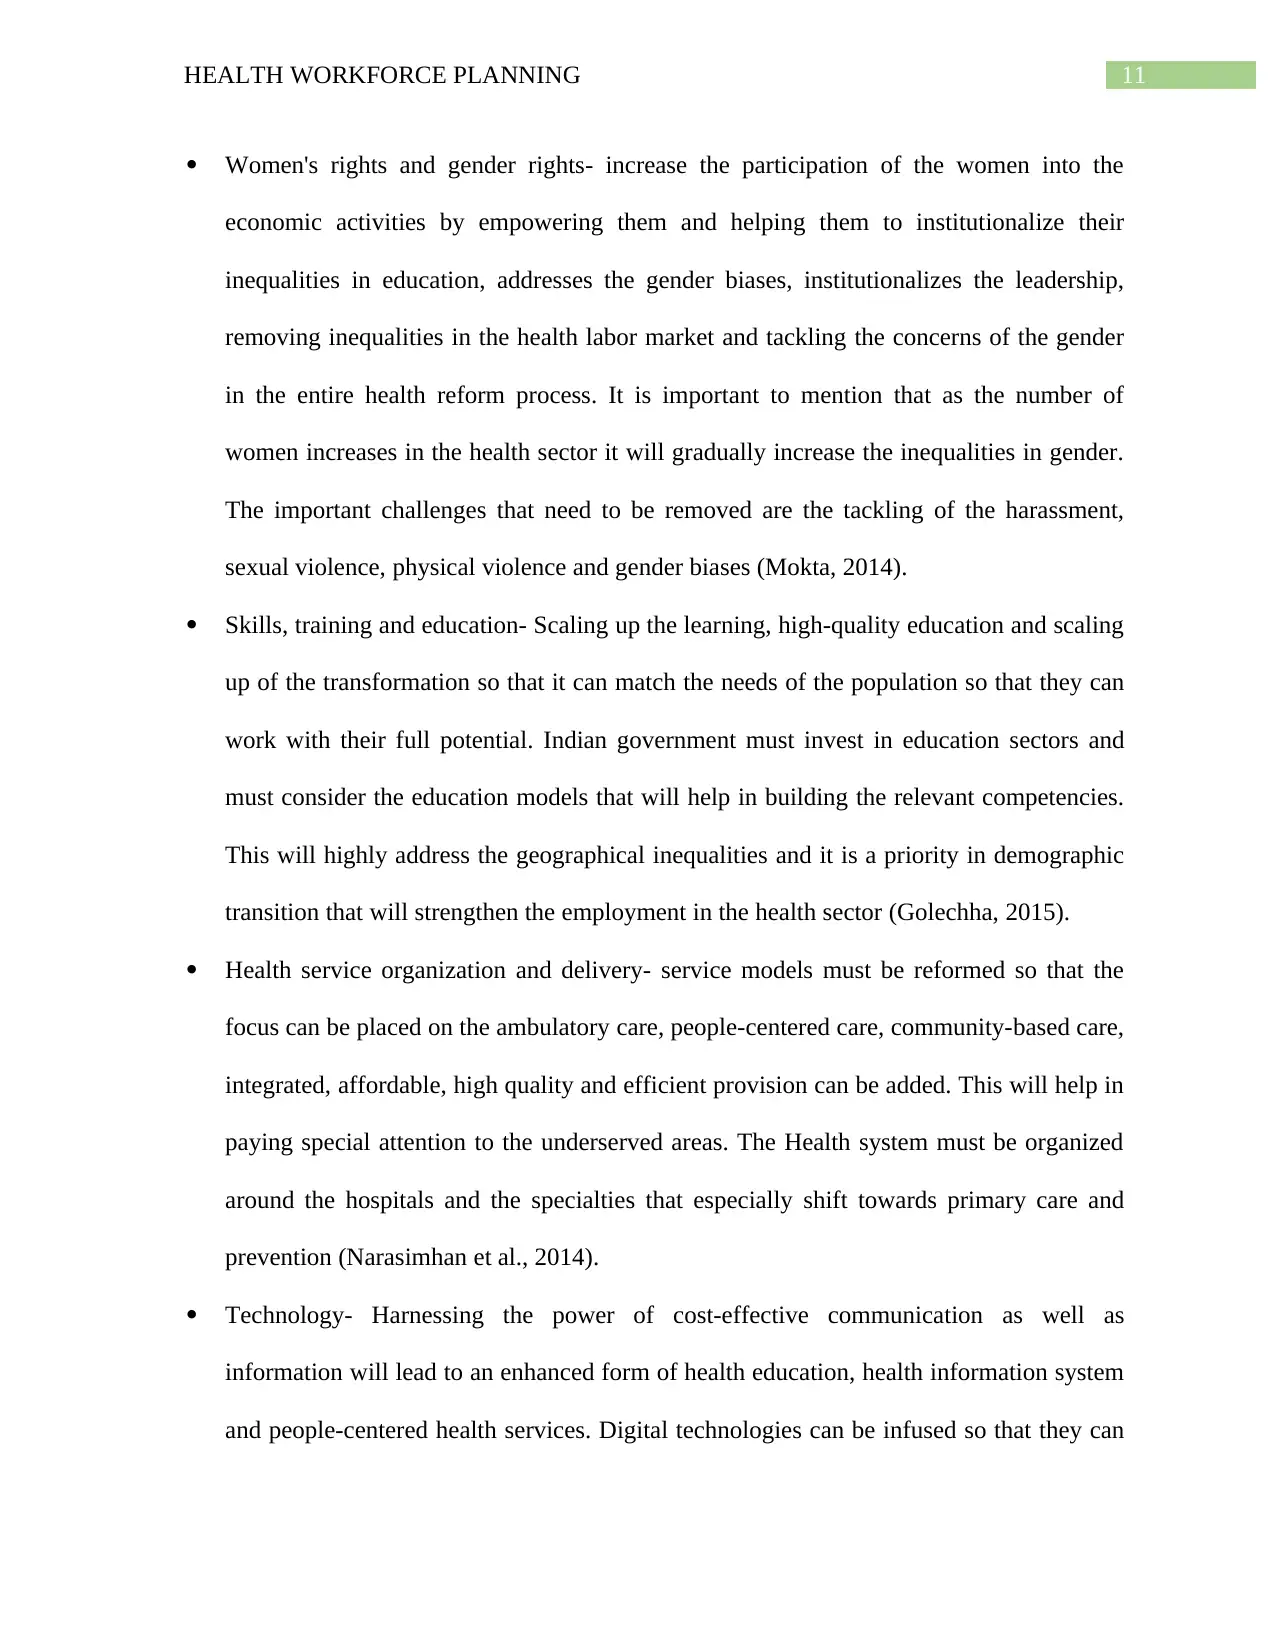
Women's rights and gender rights- increase the participation of the women into the
economic activities by empowering them and helping them to institutionalize their
inequalities in education, addresses the gender biases, institutionalizes the leadership,
removing inequalities in the health labor market and tackling the concerns of the gender
in the entire health reform process. It is important to mention that as the number of
women increases in the health sector it will gradually increase the inequalities in gender.
The important challenges that need to be removed are the tackling of the harassment,
sexual violence, physical violence and gender biases (Mokta, 2014).
Skills, training and education- Scaling up the learning, high-quality education and scaling
up of the transformation so that it can match the needs of the population so that they can
work with their full potential. Indian government must invest in education sectors and
must consider the education models that will help in building the relevant competencies.
This will highly address the geographical inequalities and it is a priority in demographic
transition that will strengthen the employment in the health sector (Golechha, 2015).
Health service organization and delivery- service models must be reformed so that the
focus can be placed on the ambulatory care, people-centered care, community-based care,
integrated, affordable, high quality and efficient provision can be added. This will help in
paying special attention to the underserved areas. The Health system must be organized
around the hospitals and the specialties that especially shift towards primary care and
prevention (Narasimhan et al., 2014).
Technology- Harnessing the power of cost-effective communication as well as
information will lead to an enhanced form of health education, health information system
and people-centered health services. Digital technologies can be infused so that they can
12HEALTH WORKFORCE PLANNING
bring the necessary changes to healthcare accessibility (de la Torre-Díez, López-
Coronado, Vaca, Aguado, & de Castro, 2014).
Humanitarian setting and crises-investments into the core competencies of the
international health regulations and it will be including the international and national
health worker into the humanitarian settings. It must be ensured that the security the
health workers and the protection of the health workers are at the top priority in the health
facilities and the health workers (“WHO | Working for health and growth,” 2019).
Conclusion
It can be concluded from the above discussion that the health workforce is not in good
condition that can sustain the increasing population. The demand for healthcare not only arises
from the aged population but it also arises from the burden of chronic diseases. Especially in
India the growing trend of diseases can be only be tackled with the proper workforce planning.
The condition of the information regarding the current workforce is highly unreliable and it
requires a major form of intervention that will enhance the workforce and their working ability.
Paraphrase This Document
Need a fresh take? Get an instant paraphrase of this document with our AI Paraphraser
13HEALTH WORKFORCE PLANNING
Reference
de la Torre-Díez, I., López-Coronado, M., Vaca, C., Aguado, J. S., & de Castro, C. (2014). Cost-
Utility and Cost-Effectiveness Studies of Telemedicine, Electronic, and Mobile Health
Systems in the Literature: A Systematic Review. Telemedicine and E-Health, 21(2), 81–
85. https://doi.org/10.1089/tmj.2014.0053
Fan, V., & Anand, S. (2016). The Health Workforce in India [Report]. Retrieved from World
Health Organization website: http://scholarspace.manoa.hawaii.edu/handle/10125/42580
Golechha, M. (2015). Healthcare agenda for the Indian government. The Indian Journal of
Medical Research, 141(2), 151–153.
Joumard, I., & Kumar, A. (2015). Improving Health Outcomes and Health Care in India.
https://doi.org/10.1787/5js7t9ptcr26-en
Limb, M. (2016). The world will lack 18 million health workers by 2030 without adequate
investment, warns UN. British Medical Journal Publishing Group.
Mathur, M. R., Singh, A., & Watt, R. (2015). Addressing inequalities in oral health in India: the
need for skill mix in the dental workforce. Journal of Family Medicine and Primary
Care, 4(2), 200–202. https://doi.org/10.4103/2249-4863.154632
Mokta, M. (2014). Empowerment of Women in India: A Critical Analysis. Indian Journal of
Public Administration, 60(3), 473–488. https://doi.org/10.1177/0019556120140308
Myrick, K., & del Vecchio, P. (2016). Peer support services in the behavioral healthcare
workforce: State of the field. Psychiatric Rehabilitation Journal, 39(3), 197–203.
https://doi.org/10.1037/prj0000188
Narasimhan, P., Bakshi, A., Kittusami, S., Prashant, S., Mathai, D., Bakshi, K., … Ray, P.
(2014). A customized m-Health system for improving Tuberculosis treatment adherence
14HEALTH WORKFORCE PLANNING
and follow-up in south India. Health and Technology, 4(1), 1–10.
https://doi.org/10.1007/s12553-013-0067-2
Rao, K. D., Arora, R., & Ghaffar, A. (2014). Health systems research in the time of health
system reform in India: a review. Health Research Policy and Systems, 12(1), 37.
https://doi.org/10.1186/1478-4505-12-37
Rao, K. D., Shahrawat, R., & Bhatnagar, A. (2016). Composition and distribution of the health
workforce in India: estimates based on data from the National Sample Survey. WHO
South-East Asia Journal of Public Health, 5(2), 133–140. https://doi.org/10.4103/2224-
3151.206250
WHO | The health workforce in India. (2016). Retrieved May 29, 2019, from WHO website:
http://www.who.int/hrh/resources/hwindia_health-obs16/en/
WHO | Working for health and growth: investing in the health workforce. (2019). Retrieved May
29, 2019, from WHO website: http://www.who.int/hrh/com-heeg/reports/en/
1 out of 15
Related Documents


Your All-in-One AI-Powered Toolkit for Academic Success.
+13062052269
info@desklib.com
Available 24*7 on WhatsApp / Email
![[object Object]](/_next/static/media/star-bottom.7253800d.svg)
Unlock your academic potential
© 2024 | Zucol Services PVT LTD | All rights reserved.