Financial Analysis and Performance of AEON Metals Limited Project
VerifiedAdded on 2020/05/16
|27
|5793
|84
Project
AI Summary
This project report provides a comprehensive financial analysis of AEON Metals Limited, an Australian company engaged in mineral exploration. The report begins with a company description and examines its ownership and governance structure, highlighting key stakeholders and management personnel. It then delves into performance ratios, including ROA, ROE, and debt ratios, to assess the company's financial health. The analysis further investigates changes in stock prices, significant factors influencing the stock, and calculations of CAPM and beta values to evaluate risk and return. WACC calculations are also presented to determine the cost of capital. The report concludes with a dividend policy review and recommendations for investors based on the financial performance and market position of AEON Metals Limited. The study uses data from annual reports and financial databases to support its findings.
Running Head: Finance For Business
1
Project Report: Finance for business
1
Project Report: Finance for business
Paraphrase This Document
Need a fresh take? Get an instant paraphrase of this document with our AI Paraphraser
Finance For Business
2
Contents
Introduction.......................................................................................................................3
1. Company description...............................................................................................3
2. Ownership governance structure.............................................................................3
3. Performance ratios...................................................................................................4
4. Changes in stock price.............................................................................................6
5. Significant factors....................................................................................................7
6. Calculation of CAPM and beta values.....................................................................7
7. WACC calculations.................................................................................................8
8. Debt ratios................................................................................................................9
9. Dividend policy........................................................................................................9
10. Recommendation and Conclusion.........................................................................10
References.......................................................................................................................11
Appendix.........................................................................................................................13
Finance For Business
3
Introduction:
Financial management is an effective way to manage and evaluate the money of a
business. Financial management of a company makes it easy for the company to evaluate the
performance of the company, new projects of the company, position of the company etc. It
accomplishes the objective of the company and assists the company to make various better
decisions. Financial management is an application of financial evaluation. In financial
evaluation, the investment opportunity of an organization is evaluated and it is investigated
that whether the company would be able to perform well in the market. Further, this study
assists every person who is linked with the company to evaluate that how the company is
performing in Australian market?
1. Company description:
AEON metals limited company is operating its activities into Australian market. This
company has engaged in tenement and prospect exploration of various minerals. This
company has explored and developed various projects into Australian market. The main
project of the company is “Walford Creek Base Metal Project” which has explored one of the
biggest mineral projects of the company (FT, 2018). This company is presenting itself very
well in the market. The financial performance and the activities of the company are quite
attractive. Further, the market position of the company is also great.
2. Ownership governance structure:
More to it, the financial performance and the position of the company has been
evaluated and for it, the annual report of the company has been evaluated and the main
people of the company have been analyzed. To evaluate that how many people are directly
and indirectly involving in the BOM of the company and managing the operations and
making decision about the activities of the company (Brammer, Brooks and Pavelin, 2006).
This structure is maintained by every company to measure, evaluate and make changes in the
operations, activities, investment proposal and position of the company. Following is the
details of the company:
Substantial stakeholders:
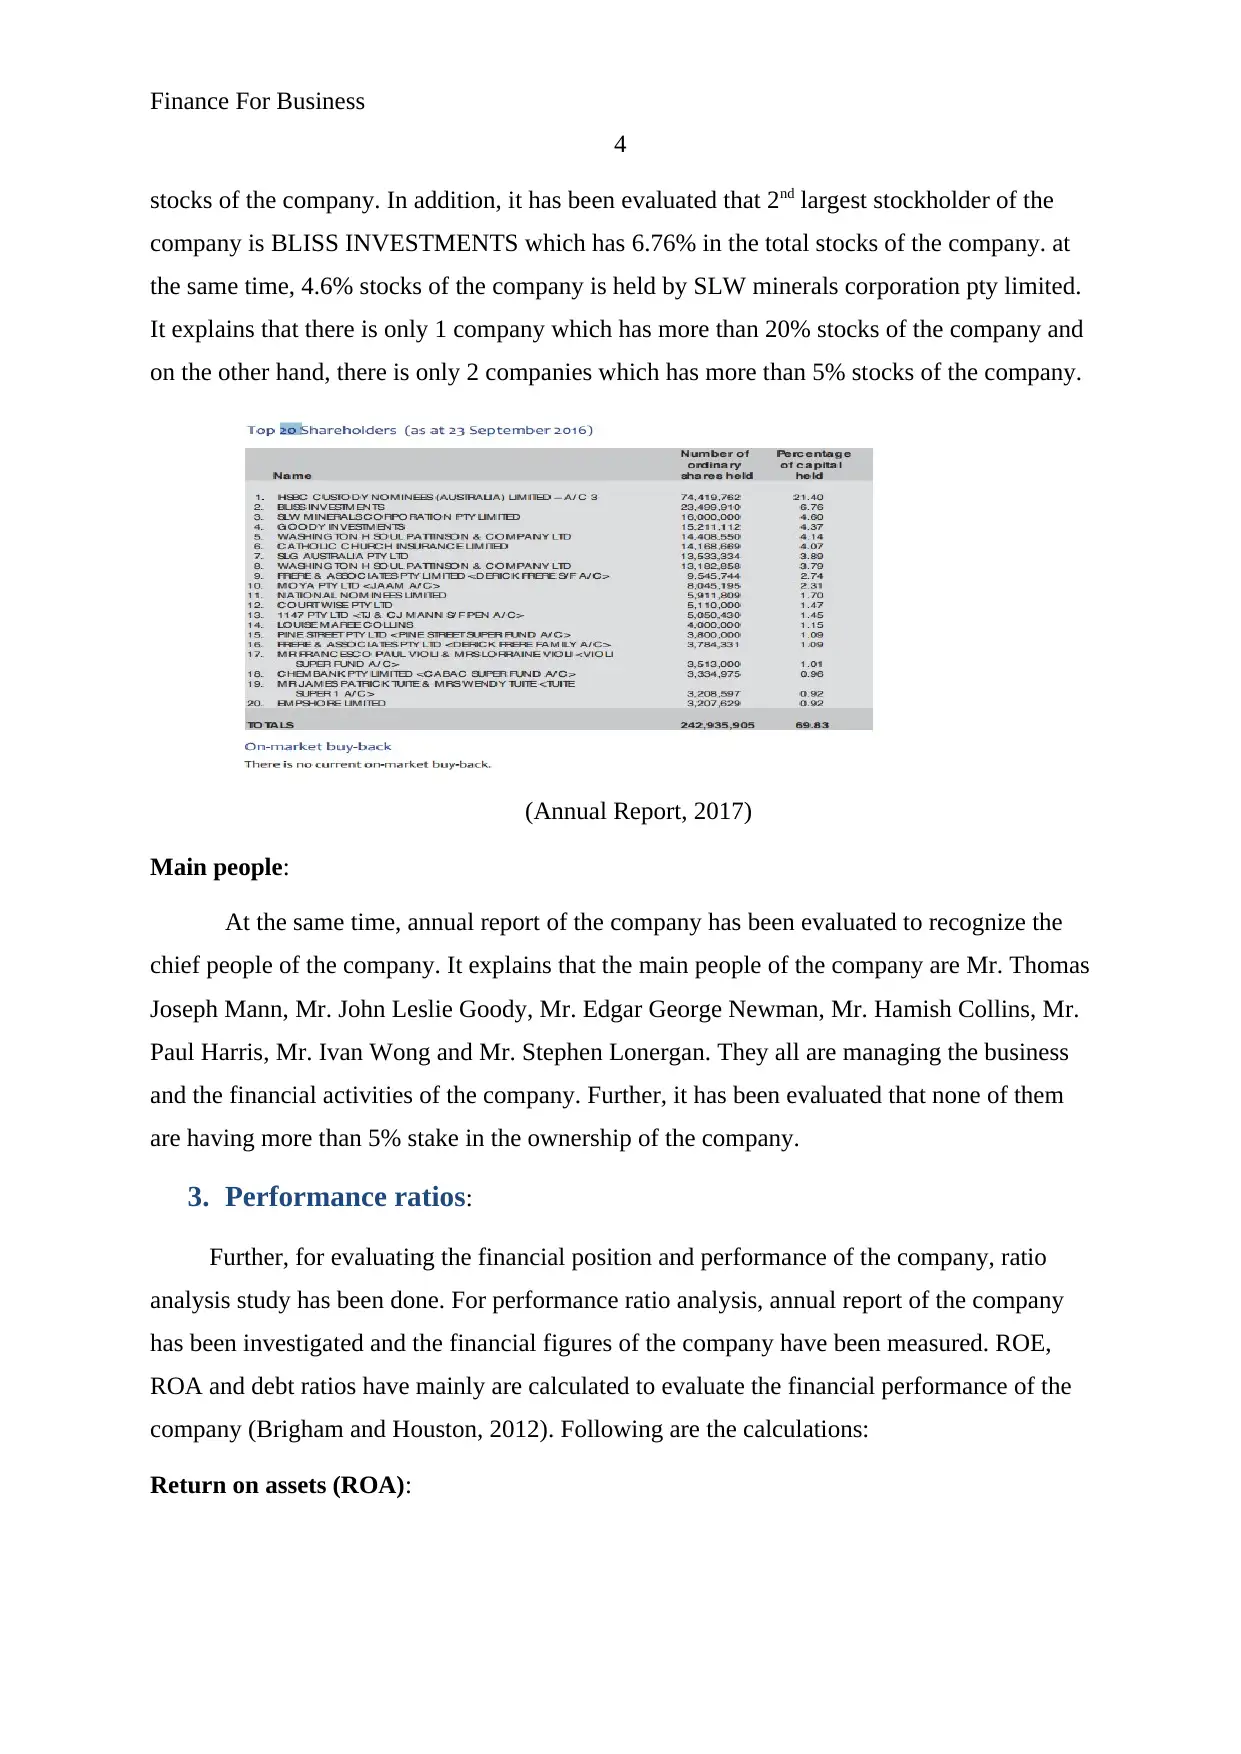
Accoridng to the study on the top investors of the company, it has been evaluated that
the HSBC is the main stakeholder of the company which has around 21.4% share in the total
3
Introduction:
Financial management is an effective way to manage and evaluate the money of a
business. Financial management of a company makes it easy for the company to evaluate the
performance of the company, new projects of the company, position of the company etc. It
accomplishes the objective of the company and assists the company to make various better
decisions. Financial management is an application of financial evaluation. In financial
evaluation, the investment opportunity of an organization is evaluated and it is investigated
that whether the company would be able to perform well in the market. Further, this study
assists every person who is linked with the company to evaluate that how the company is
performing in Australian market?
1. Company description:
AEON metals limited company is operating its activities into Australian market. This
company has engaged in tenement and prospect exploration of various minerals. This
company has explored and developed various projects into Australian market. The main
project of the company is “Walford Creek Base Metal Project” which has explored one of the
biggest mineral projects of the company (FT, 2018). This company is presenting itself very
well in the market. The financial performance and the activities of the company are quite
attractive. Further, the market position of the company is also great.
2. Ownership governance structure:
More to it, the financial performance and the position of the company has been
evaluated and for it, the annual report of the company has been evaluated and the main
people of the company have been analyzed. To evaluate that how many people are directly
and indirectly involving in the BOM of the company and managing the operations and
making decision about the activities of the company (Brammer, Brooks and Pavelin, 2006).
This structure is maintained by every company to measure, evaluate and make changes in the
operations, activities, investment proposal and position of the company. Following is the
details of the company:
Substantial stakeholders:
Accoridng to the study on the top investors of the company, it has been evaluated that
the HSBC is the main stakeholder of the company which has around 21.4% share in the total
⊘ This is a preview!⊘
Do you want full access?
Subscribe today to unlock all pages.
Trusted by 1+ million students worldwide
Finance For Business
4
stocks of the company. In addition, it has been evaluated that 2nd largest stockholder of the
company is BLISS INVESTMENTS which has 6.76% in the total stocks of the company. at
the same time, 4.6% stocks of the company is held by SLW minerals corporation pty limited.
It explains that there is only 1 company which has more than 20% stocks of the company and
on the other hand, there is only 2 companies which has more than 5% stocks of the company.
(Annual Report, 2017)
Main people:
At the same time, annual report of the company has been evaluated to recognize the
chief people of the company. It explains that the main people of the company are Mr. Thomas
Joseph Mann, Mr. John Leslie Goody, Mr. Edgar George Newman, Mr. Hamish Collins, Mr.
Paul Harris, Mr. Ivan Wong and Mr. Stephen Lonergan. They all are managing the business
and the financial activities of the company. Further, it has been evaluated that none of them
are having more than 5% stake in the ownership of the company.
3. Performance ratios:
Further, for evaluating the financial position and performance of the company, ratio
analysis study has been done. For performance ratio analysis, annual report of the company
has been investigated and the financial figures of the company have been measured. ROE,
ROA and debt ratios have mainly are calculated to evaluate the financial performance of the
company (Brigham and Houston, 2012). Following are the calculations:
Return on assets (ROA):
Paraphrase This Document
Need a fresh take? Get an instant paraphrase of this document with our AI Paraphraser
Finance For Business
5
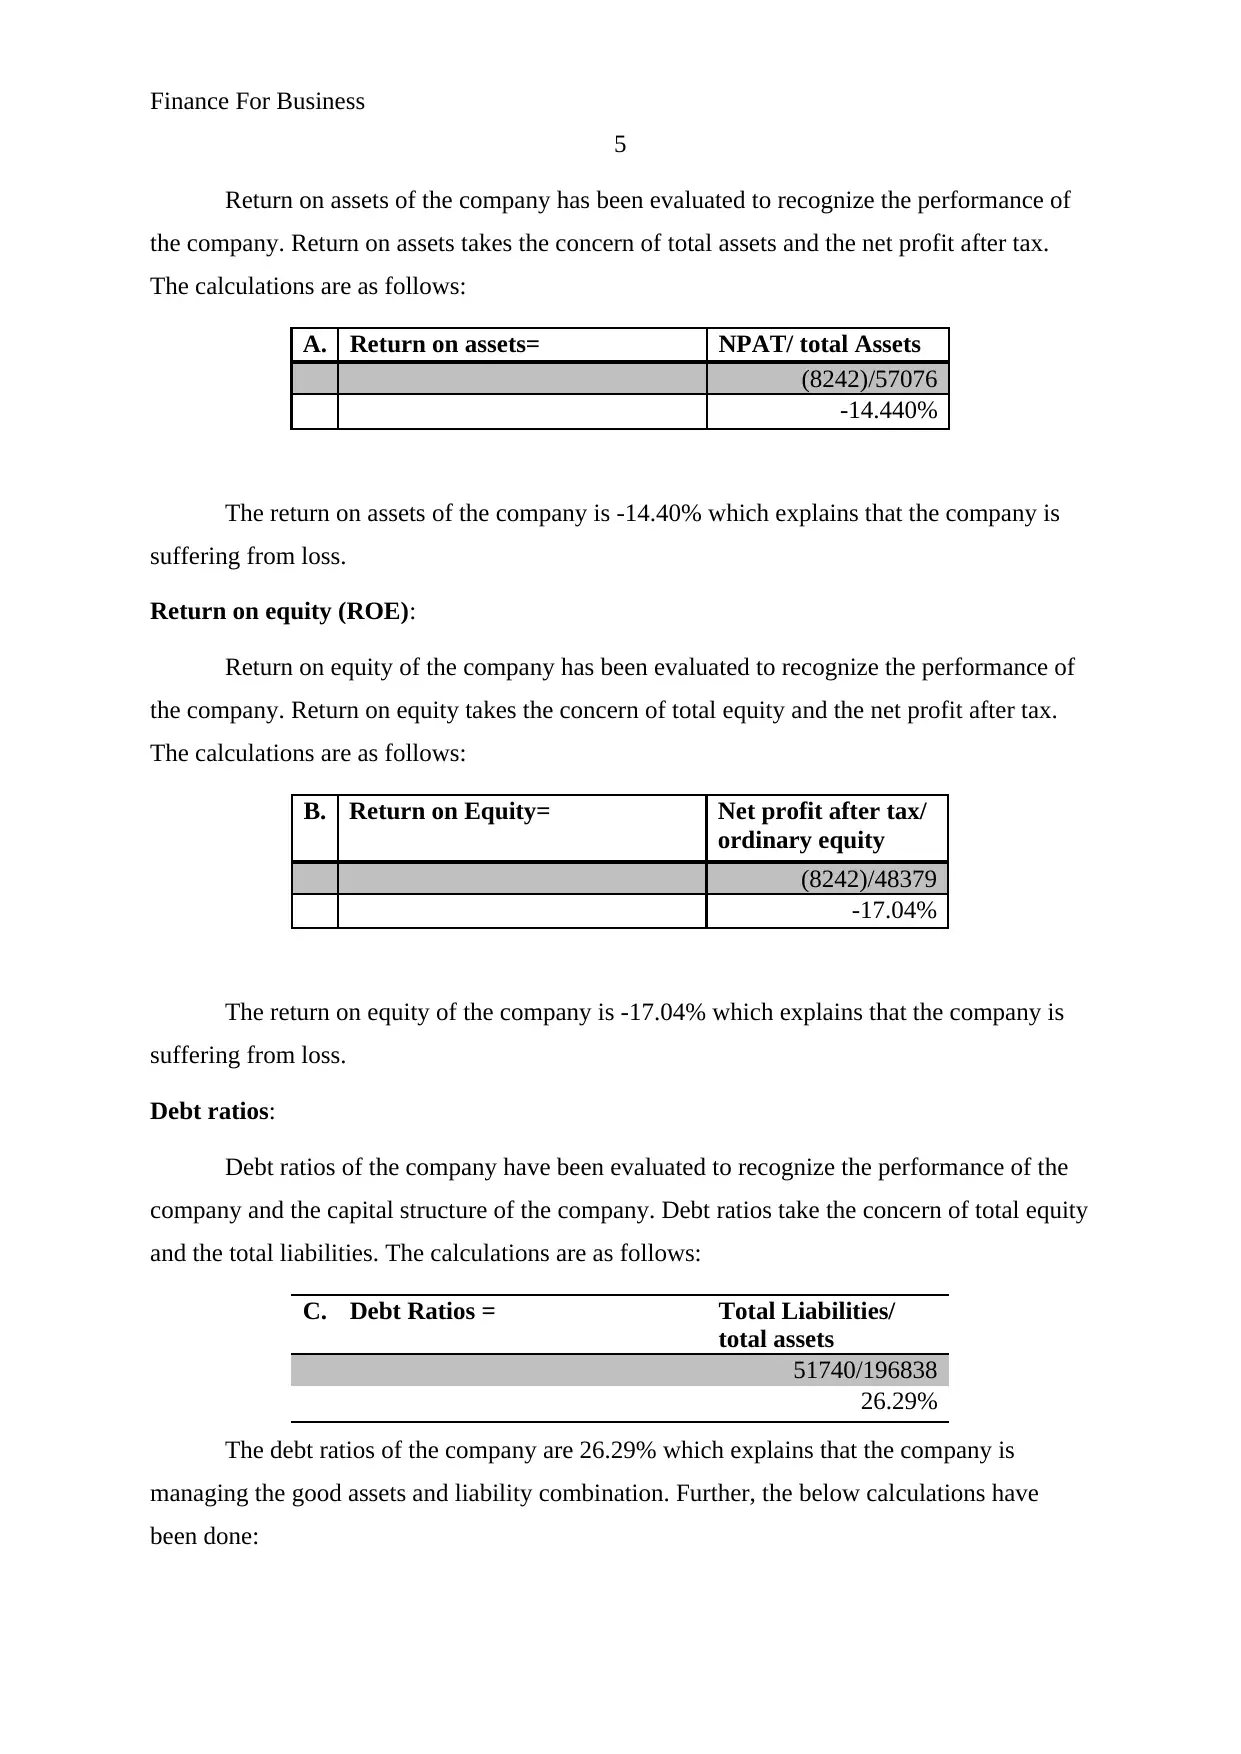
Return on assets of the company has been evaluated to recognize the performance of
the company. Return on assets takes the concern of total assets and the net profit after tax.
The calculations are as follows:
A. Return on assets= NPAT/ total Assets
(8242)/57076
-14.440%
The return on assets of the company is -14.40% which explains that the company is
suffering from loss.
Return on equity (ROE):
Return on equity of the company has been evaluated to recognize the performance of
the company. Return on equity takes the concern of total equity and the net profit after tax.
The calculations are as follows:
B. Return on Equity= Net profit after tax/
ordinary equity
(8242)/48379
-17.04%
The return on equity of the company is -17.04% which explains that the company is
suffering from loss.
Debt ratios:
Debt ratios of the company have been evaluated to recognize the performance of the
company and the capital structure of the company. Debt ratios take the concern of total equity
and the total liabilities. The calculations are as follows:
C. Debt Ratios = Total Liabilities/
total assets
51740/196838
26.29%
The debt ratios of the company are 26.29% which explains that the company is
managing the good assets and liability combination. Further, the below calculations have
been done:
5
Return on assets of the company has been evaluated to recognize the performance of
the company. Return on assets takes the concern of total assets and the net profit after tax.
The calculations are as follows:
A. Return on assets= NPAT/ total Assets
(8242)/57076
-14.440%
The return on assets of the company is -14.40% which explains that the company is
suffering from loss.
Return on equity (ROE):
Return on equity of the company has been evaluated to recognize the performance of
the company. Return on equity takes the concern of total equity and the net profit after tax.
The calculations are as follows:
B. Return on Equity= Net profit after tax/
ordinary equity
(8242)/48379
-17.04%
The return on equity of the company is -17.04% which explains that the company is
suffering from loss.
Debt ratios:
Debt ratios of the company have been evaluated to recognize the performance of the
company and the capital structure of the company. Debt ratios take the concern of total equity
and the total liabilities. The calculations are as follows:
C. Debt Ratios = Total Liabilities/
total assets
51740/196838
26.29%
The debt ratios of the company are 26.29% which explains that the company is
managing the good assets and liability combination. Further, the below calculations have
been done:
Finance For Business
6
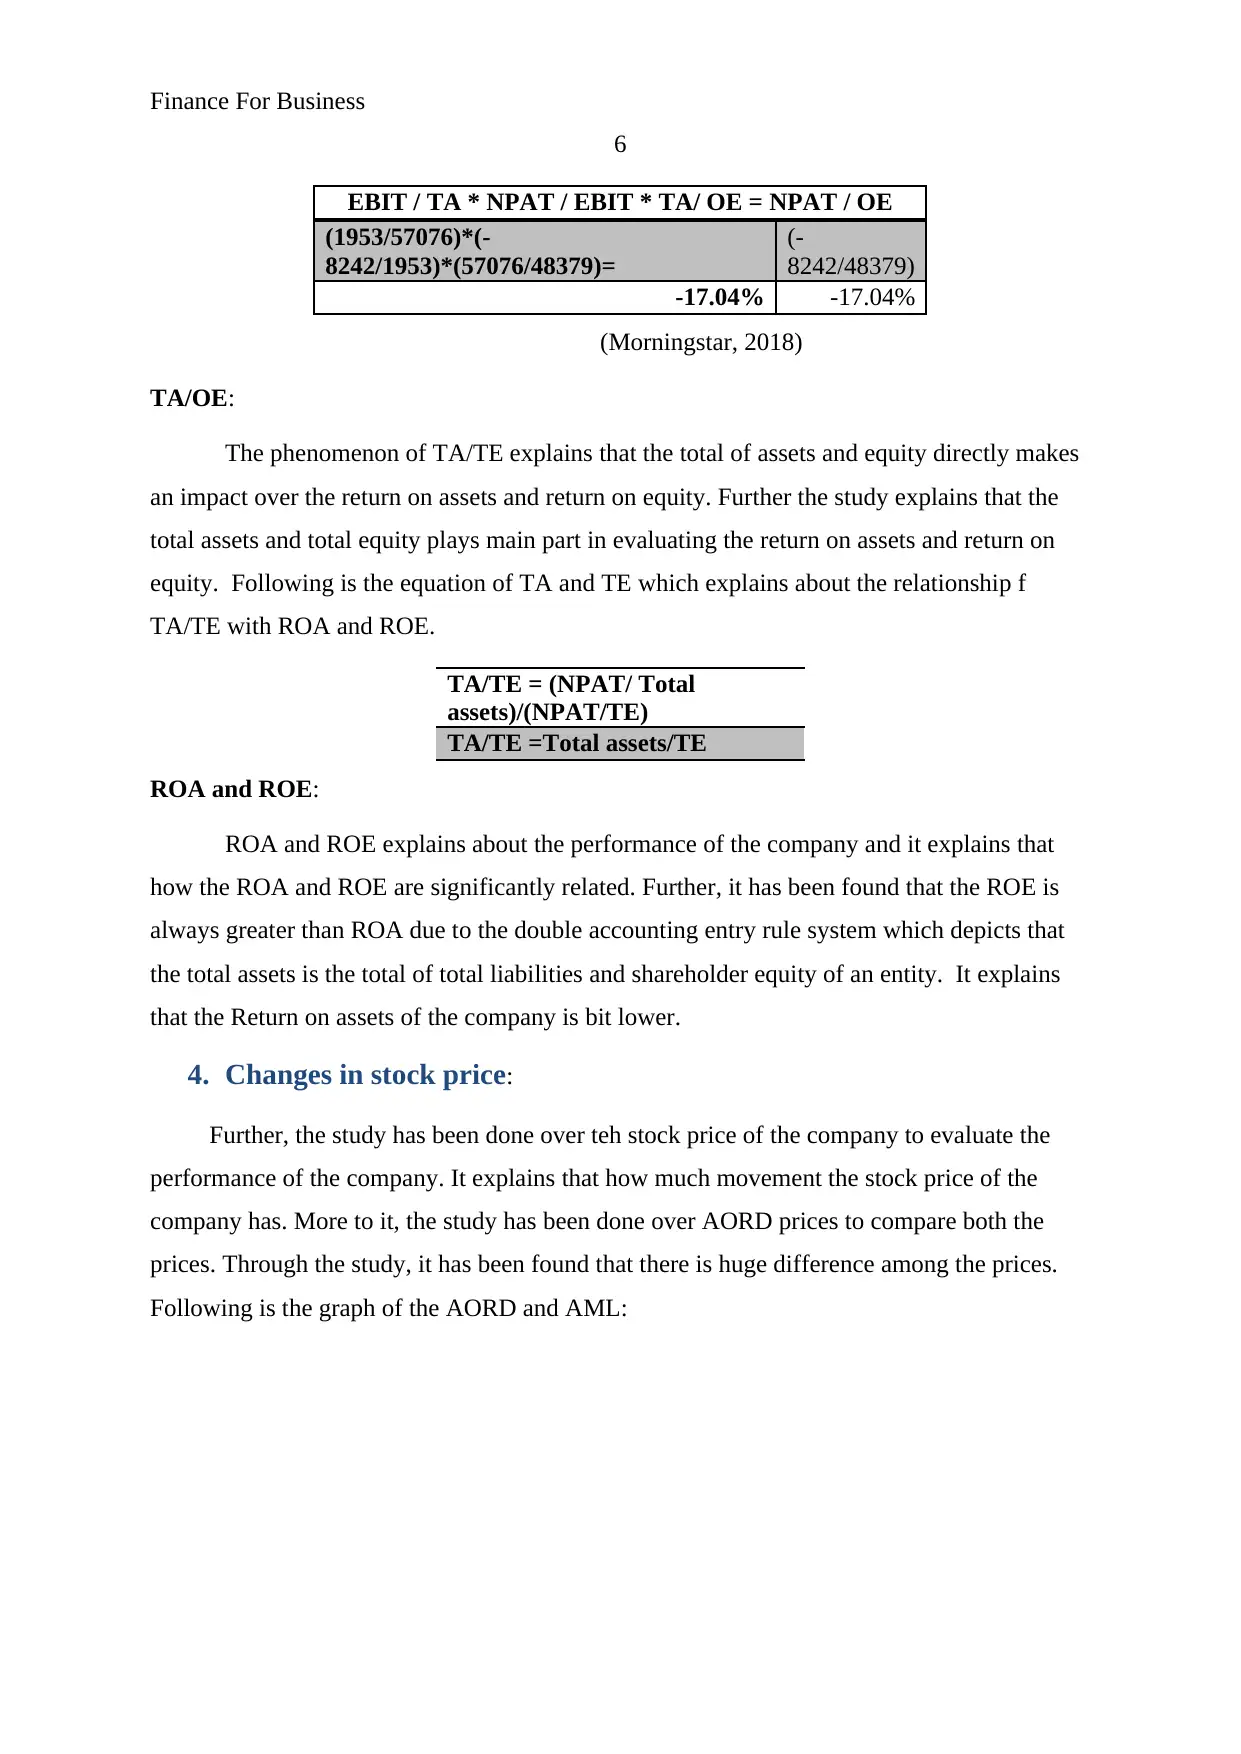
EBIT / TA * NPAT / EBIT * TA/ OE = NPAT / OE
(1953/57076)*(-
8242/1953)*(57076/48379)=
(-
8242/48379)
-17.04% -17.04%
(Morningstar, 2018)
TA/OE:
The phenomenon of TA/TE explains that the total of assets and equity directly makes
an impact over the return on assets and return on equity. Further the study explains that the
total assets and total equity plays main part in evaluating the return on assets and return on
equity. Following is the equation of TA and TE which explains about the relationship f
TA/TE with ROA and ROE.
TA/TE = (NPAT/ Total
assets)/(NPAT/TE)
TA/TE =Total assets/TE
ROA and ROE:
ROA and ROE explains about the performance of the company and it explains that
how the ROA and ROE are significantly related. Further, it has been found that the ROE is
always greater than ROA due to the double accounting entry rule system which depicts that
the total assets is the total of total liabilities and shareholder equity of an entity. It explains
that the Return on assets of the company is bit lower.
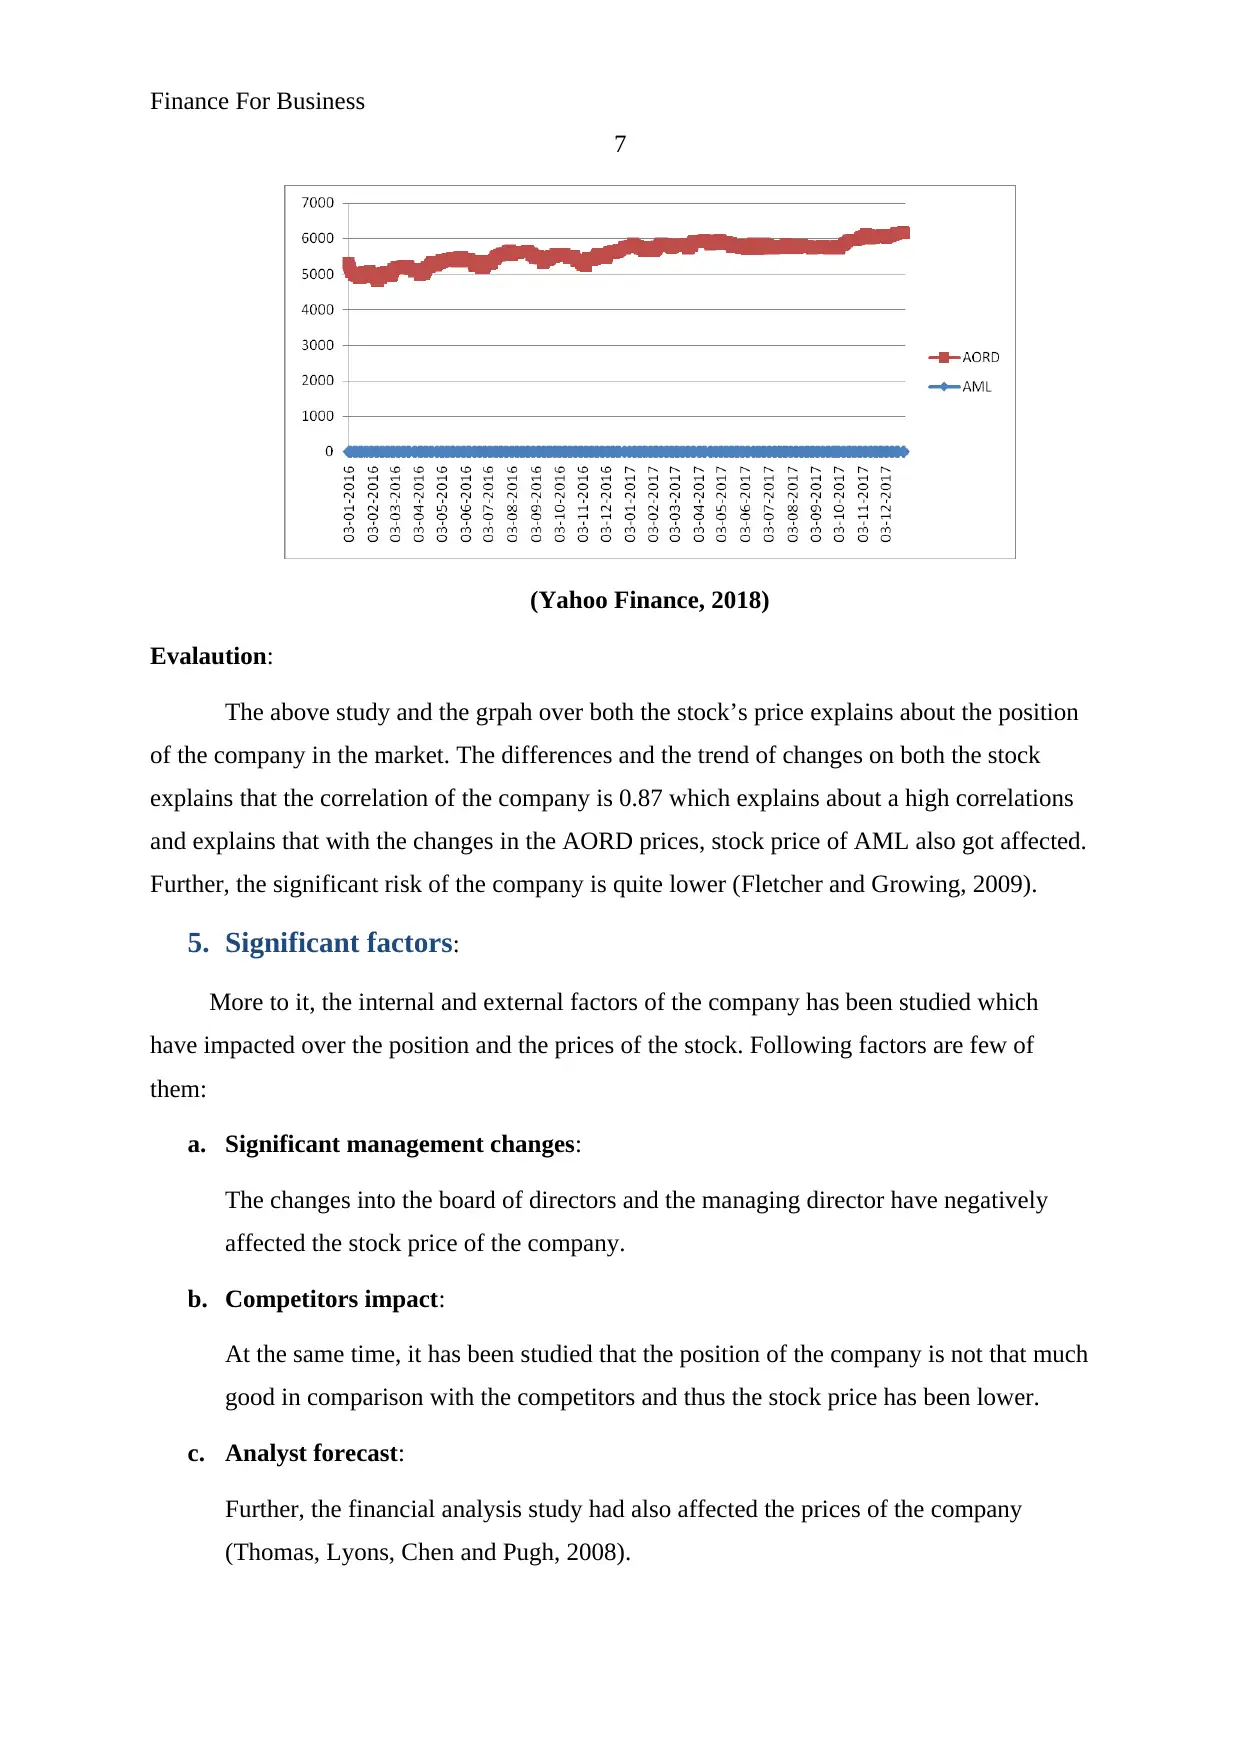
4. Changes in stock price:
Further, the study has been done over teh stock price of the company to evaluate the
performance of the company. It explains that how much movement the stock price of the
company has. More to it, the study has been done over AORD prices to compare both the
prices. Through the study, it has been found that there is huge difference among the prices.
Following is the graph of the AORD and AML:
6
EBIT / TA * NPAT / EBIT * TA/ OE = NPAT / OE
(1953/57076)*(-
8242/1953)*(57076/48379)=
(-
8242/48379)
-17.04% -17.04%
(Morningstar, 2018)
TA/OE:
The phenomenon of TA/TE explains that the total of assets and equity directly makes
an impact over the return on assets and return on equity. Further the study explains that the
total assets and total equity plays main part in evaluating the return on assets and return on
equity. Following is the equation of TA and TE which explains about the relationship f
TA/TE with ROA and ROE.
TA/TE = (NPAT/ Total
assets)/(NPAT/TE)
TA/TE =Total assets/TE
ROA and ROE:
ROA and ROE explains about the performance of the company and it explains that
how the ROA and ROE are significantly related. Further, it has been found that the ROE is
always greater than ROA due to the double accounting entry rule system which depicts that
the total assets is the total of total liabilities and shareholder equity of an entity. It explains
that the Return on assets of the company is bit lower.
4. Changes in stock price:
Further, the study has been done over teh stock price of the company to evaluate the
performance of the company. It explains that how much movement the stock price of the
company has. More to it, the study has been done over AORD prices to compare both the
prices. Through the study, it has been found that there is huge difference among the prices.
Following is the graph of the AORD and AML:
⊘ This is a preview!⊘
Do you want full access?
Subscribe today to unlock all pages.
Trusted by 1+ million students worldwide
Finance For Business
7
(Yahoo Finance, 2018)
Evalaution:
The above study and the grpah over both the stock’s price explains about the position
of the company in the market. The differences and the trend of changes on both the stock
explains that the correlation of the company is 0.87 which explains about a high correlations
and explains that with the changes in the AORD prices, stock price of AML also got affected.
Further, the significant risk of the company is quite lower (Fletcher and Growing, 2009).
5. Significant factors:
More to it, the internal and external factors of the company has been studied which
have impacted over the position and the prices of the stock. Following factors are few of
them:
a. Significant management changes:
The changes into the board of directors and the managing director have negatively
affected the stock price of the company.
b. Competitors impact:
At the same time, it has been studied that the position of the company is not that much
good in comparison with the competitors and thus the stock price has been lower.
c. Analyst forecast:
Further, the financial analysis study had also affected the prices of the company
(Thomas, Lyons, Chen and Pugh, 2008).
Paraphrase This Document
Need a fresh take? Get an instant paraphrase of this document with our AI Paraphraser
Finance For Business
8
d. Law suits:
Law suits have also played a role in the stock price of the company.
e. Industry wide factors:
At the end, industry factors are also important to evaluate the stock price.
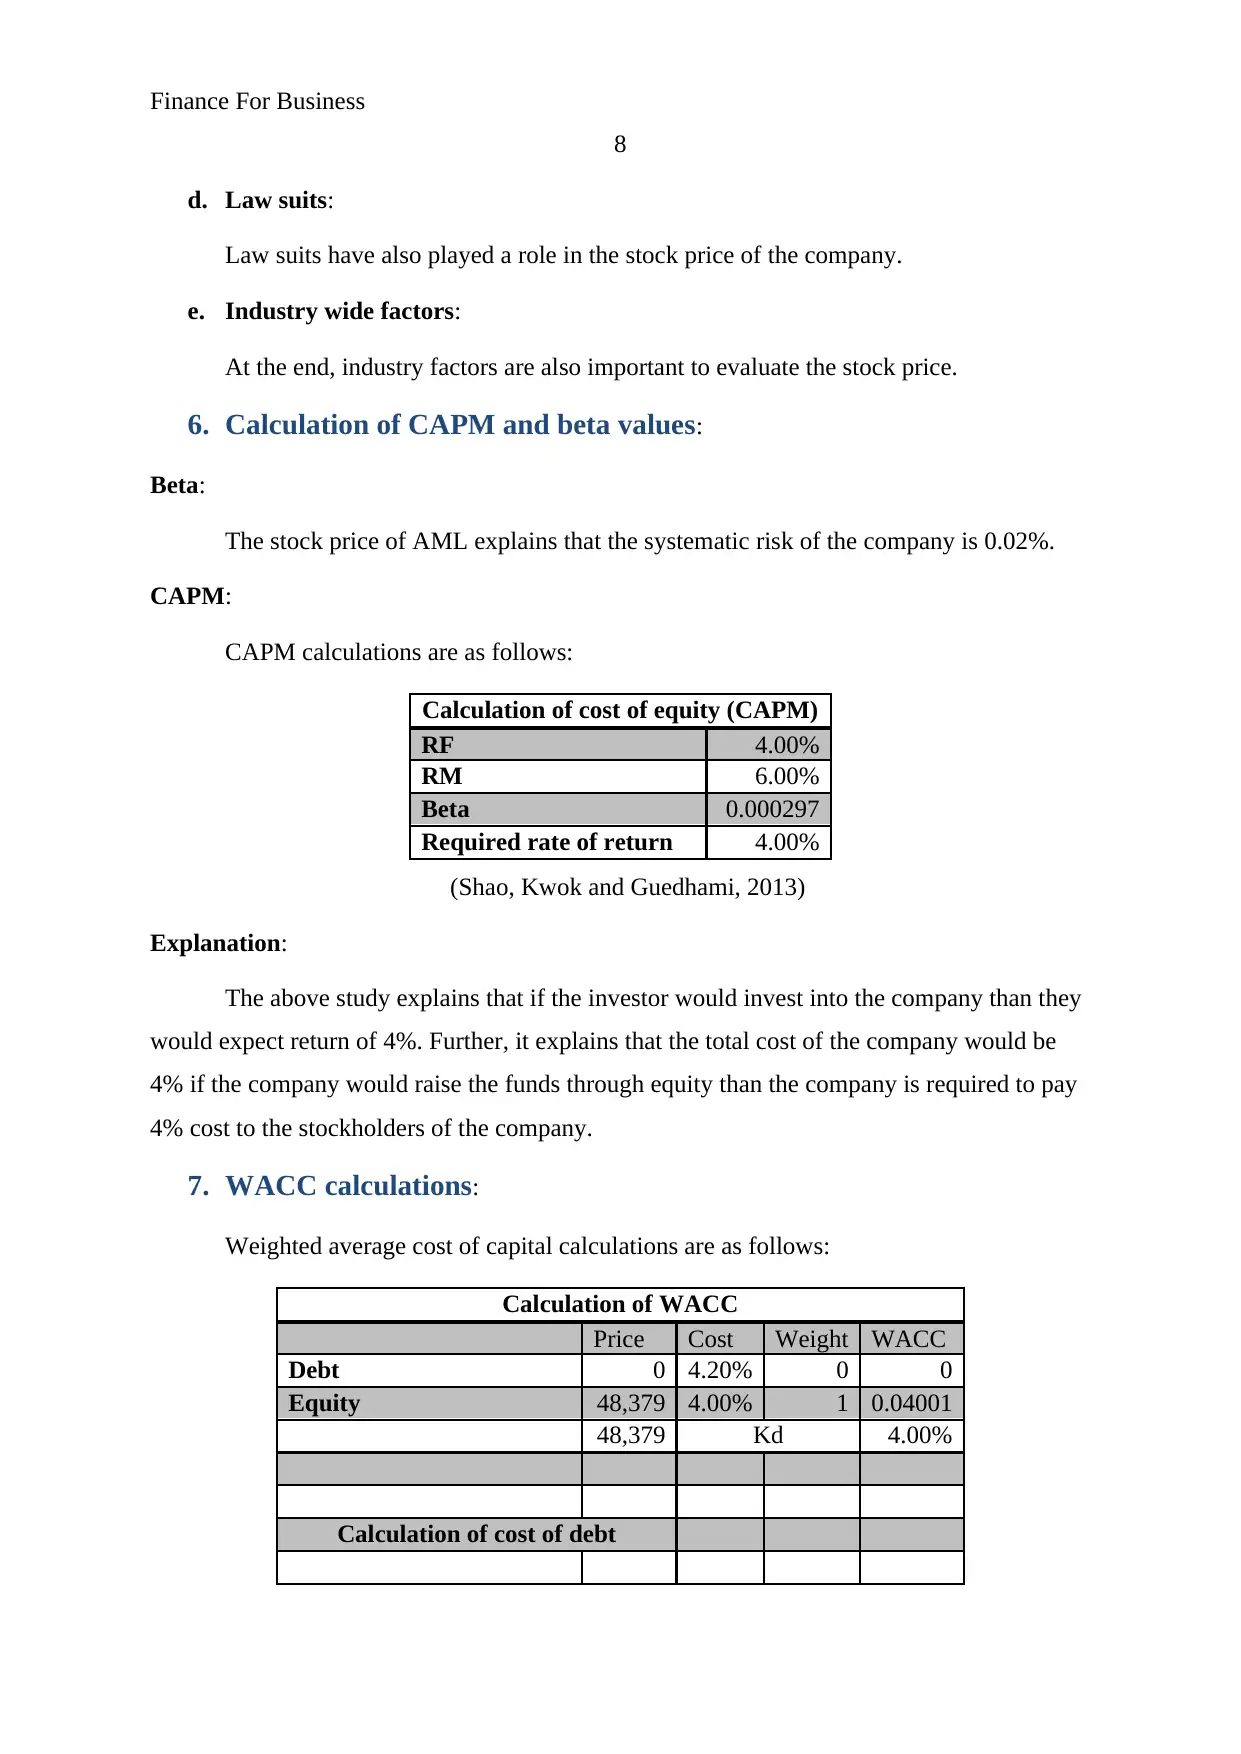
6. Calculation of CAPM and beta values:
Beta:
The stock price of AML explains that the systematic risk of the company is 0.02%.
CAPM:
CAPM calculations are as follows:
Calculation of cost of equity (CAPM)
RF 4.00%
RM 6.00%
Beta 0.000297
Required rate of return 4.00%
(Shao, Kwok and Guedhami, 2013)
Explanation:
The above study explains that if the investor would invest into the company than they
would expect return of 4%. Further, it explains that the total cost of the company would be
4% if the company would raise the funds through equity than the company is required to pay
4% cost to the stockholders of the company.
7. WACC calculations:
Weighted average cost of capital calculations are as follows:
Calculation of WACC
Price Cost Weight WACC
Debt 0 4.20% 0 0
Equity 48,379 4.00% 1 0.04001
48,379 Kd 4.00%
Calculation of cost of debt
8
d. Law suits:
Law suits have also played a role in the stock price of the company.
e. Industry wide factors:
At the end, industry factors are also important to evaluate the stock price.
6. Calculation of CAPM and beta values:
Beta:
The stock price of AML explains that the systematic risk of the company is 0.02%.
CAPM:
CAPM calculations are as follows:
Calculation of cost of equity (CAPM)
RF 4.00%
RM 6.00%
Beta 0.000297
Required rate of return 4.00%
(Shao, Kwok and Guedhami, 2013)
Explanation:
The above study explains that if the investor would invest into the company than they
would expect return of 4%. Further, it explains that the total cost of the company would be
4% if the company would raise the funds through equity than the company is required to pay
4% cost to the stockholders of the company.
7. WACC calculations:
Weighted average cost of capital calculations are as follows:
Calculation of WACC
Price Cost Weight WACC
Debt 0 4.20% 0 0
Equity 48,379 4.00% 1 0.04001
48,379 Kd 4.00%
Calculation of cost of debt
Finance For Business
9
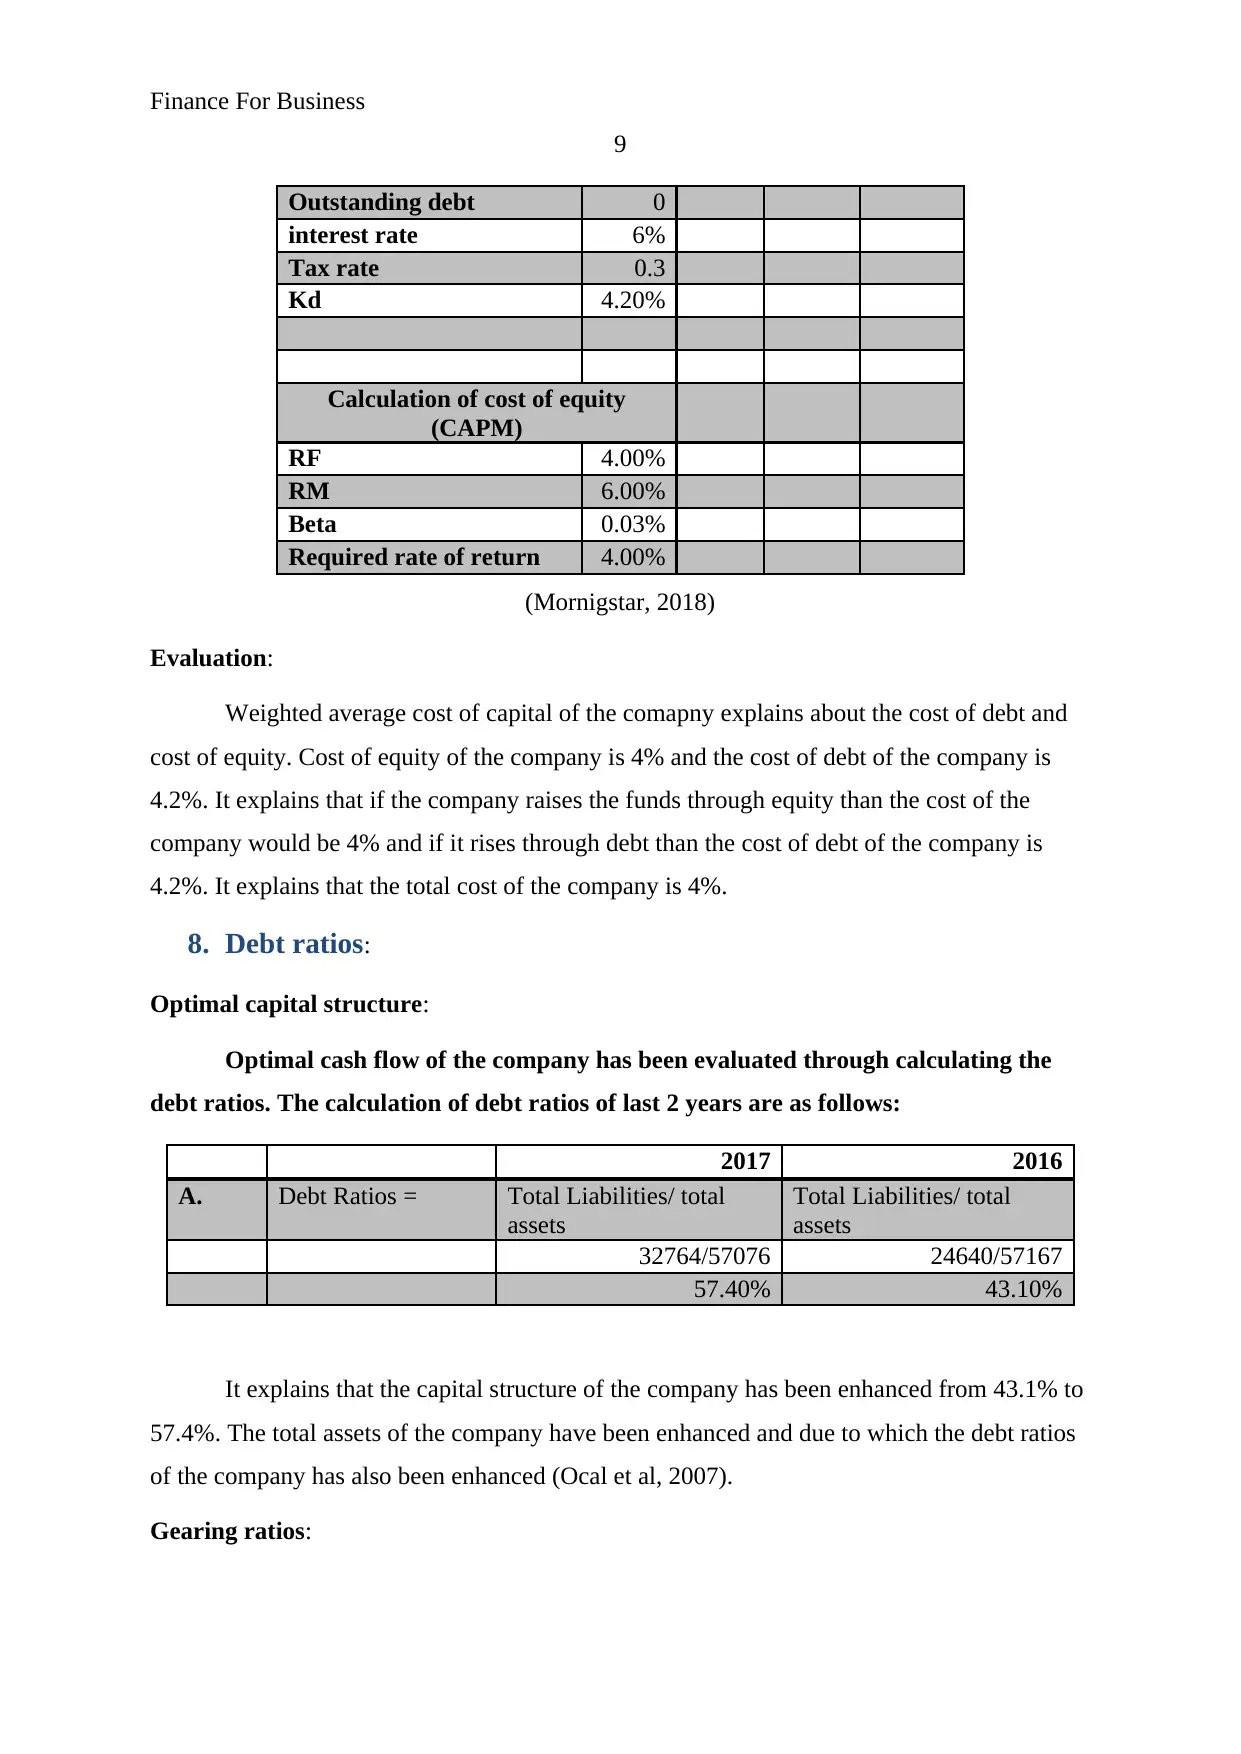
Outstanding debt 0
interest rate 6%
Tax rate 0.3
Kd 4.20%
Calculation of cost of equity
(CAPM)
RF 4.00%
RM 6.00%
Beta 0.03%
Required rate of return 4.00%
(Mornigstar, 2018)
Evaluation:
Weighted average cost of capital of the comapny explains about the cost of debt and
cost of equity. Cost of equity of the company is 4% and the cost of debt of the company is
4.2%. It explains that if the company raises the funds through equity than the cost of the
company would be 4% and if it rises through debt than the cost of debt of the company is
4.2%. It explains that the total cost of the company is 4%.
8. Debt ratios:
Optimal capital structure:
Optimal cash flow of the company has been evaluated through calculating the
debt ratios. The calculation of debt ratios of last 2 years are as follows:
2017 2016
A. Debt Ratios = Total Liabilities/ total
assets
Total Liabilities/ total
assets
32764/57076 24640/57167
57.40% 43.10%
It explains that the capital structure of the company has been enhanced from 43.1% to
57.4%. The total assets of the company have been enhanced and due to which the debt ratios
of the company has also been enhanced (Ocal et al, 2007).
Gearing ratios:
9
Outstanding debt 0
interest rate 6%
Tax rate 0.3
Kd 4.20%
Calculation of cost of equity
(CAPM)
RF 4.00%
RM 6.00%
Beta 0.03%
Required rate of return 4.00%
(Mornigstar, 2018)
Evaluation:
Weighted average cost of capital of the comapny explains about the cost of debt and
cost of equity. Cost of equity of the company is 4% and the cost of debt of the company is
4.2%. It explains that if the company raises the funds through equity than the cost of the
company would be 4% and if it rises through debt than the cost of debt of the company is
4.2%. It explains that the total cost of the company is 4%.
8. Debt ratios:
Optimal capital structure:
Optimal cash flow of the company has been evaluated through calculating the
debt ratios. The calculation of debt ratios of last 2 years are as follows:
2017 2016
A. Debt Ratios = Total Liabilities/ total
assets
Total Liabilities/ total
assets
32764/57076 24640/57167
57.40% 43.10%
It explains that the capital structure of the company has been enhanced from 43.1% to
57.4%. The total assets of the company have been enhanced and due to which the debt ratios
of the company has also been enhanced (Ocal et al, 2007).
Gearing ratios:
⊘ This is a preview!⊘
Do you want full access?
Subscribe today to unlock all pages.
Trusted by 1+ million students worldwide
Finance For Business
10
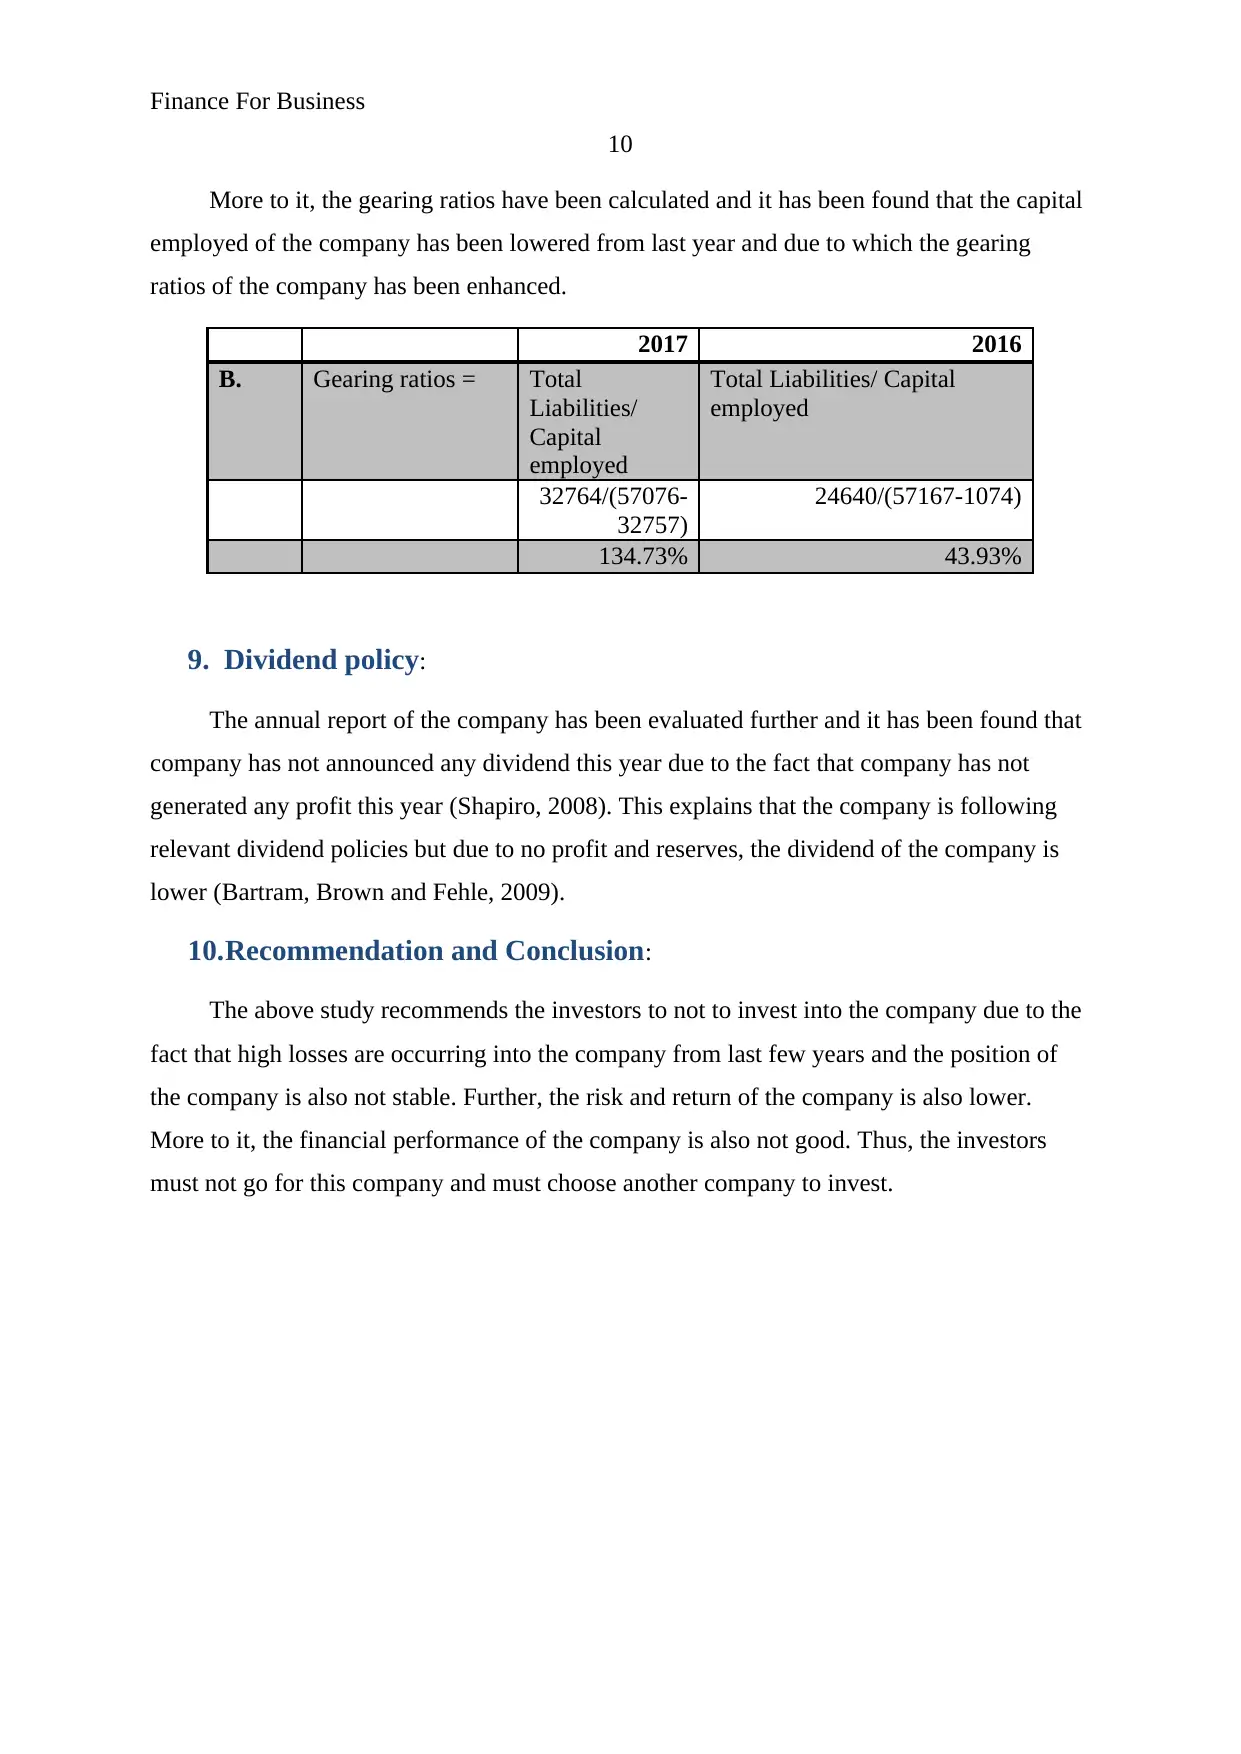
More to it, the gearing ratios have been calculated and it has been found that the capital
employed of the company has been lowered from last year and due to which the gearing
ratios of the company has been enhanced.
2017 2016
B. Gearing ratios = Total
Liabilities/
Capital
employed
Total Liabilities/ Capital
employed
32764/(57076-
32757)
24640/(57167-1074)
134.73% 43.93%
9. Dividend policy:
The annual report of the company has been evaluated further and it has been found that
company has not announced any dividend this year due to the fact that company has not
generated any profit this year (Shapiro, 2008). This explains that the company is following
relevant dividend policies but due to no profit and reserves, the dividend of the company is
lower (Bartram, Brown and Fehle, 2009).
10.Recommendation and Conclusion:
The above study recommends the investors to not to invest into the company due to the
fact that high losses are occurring into the company from last few years and the position of
the company is also not stable. Further, the risk and return of the company is also lower.
More to it, the financial performance of the company is also not good. Thus, the investors
must not go for this company and must choose another company to invest.
10
More to it, the gearing ratios have been calculated and it has been found that the capital
employed of the company has been lowered from last year and due to which the gearing
ratios of the company has been enhanced.
2017 2016
B. Gearing ratios = Total
Liabilities/
Capital
employed
Total Liabilities/ Capital
employed
32764/(57076-
32757)
24640/(57167-1074)
134.73% 43.93%
9. Dividend policy:
The annual report of the company has been evaluated further and it has been found that
company has not announced any dividend this year due to the fact that company has not
generated any profit this year (Shapiro, 2008). This explains that the company is following
relevant dividend policies but due to no profit and reserves, the dividend of the company is
lower (Bartram, Brown and Fehle, 2009).
10.Recommendation and Conclusion:
The above study recommends the investors to not to invest into the company due to the
fact that high losses are occurring into the company from last few years and the position of
the company is also not stable. Further, the risk and return of the company is also lower.
More to it, the financial performance of the company is also not good. Thus, the investors
must not go for this company and must choose another company to invest.
Paraphrase This Document
Need a fresh take? Get an instant paraphrase of this document with our AI Paraphraser
Finance For Business
11
References:
Annual report. 2017. AEON Metals limited. viewed Jan 22, 2018,
http://aeonmetals.com.au/assets/uploads/2016/09/2016-Sep-30-Annual-Report-to-
Shareholders.pdf
Bartram, S. M., Brown, G. W., and Fehle, F. R. 2009. International evidence on financial
derivatives usage. Financial management, 38(1), 185-206.
Brammer, S., Brooks, C., and Pavelin, S. 2006. Corporate social performance and stock
returns: UK evidence from disaggregate measures. Financial management, 35(3), 97-116.
Brigham, E. F., and Houston, J. F. 2012. Fundamentals of financial management. Cengage
Learning.
Fletcher, J and Growing, D 1979, Effective writing for accountants, The Institute of
Chartered Accountants in England and Wales, London.
Thomas, C, Lyons, K, Chen, P and Pugh, J 2008, Financial Resource Management, Study
Guide, Department of Maritime and Logistics Management, Australian Maritime College,
Launceston, p.3.11.
FT. 2017. AEON Metals limited. viewed Jan 22, 2018,
https://markets.ft.com/data/equities/tearsheet/summary?s=AML:ASX
Morningstar. 2017. AEON Metals limited. viewed Jan 22, 2018,
http://financials.morningstar.com/cash-flow/cf.html?t=AMLandregion=ausandculture=en-US
Öcal, M. E., Oral, E. L., Erdis, E., and Vural, G. 2007. Industry financial ratios—application
of factor analysis in Turkish construction industry. Building and Environment, 42(1), 385-
392.
Shapiro, A. C. 2008. Multinational financial management. John Wiley and Sons.
Finance For Business
12
Yahoo Finance. 2017. AEON Metals limited. viewed Jan 22, 2018,
https://finance.yahoo.com/quote/AML.AX/history?
period1=1451586600andperiod2=1514658600andinterval=1dandfilter=historyandfrequency=
1d
12
Yahoo Finance. 2017. AEON Metals limited. viewed Jan 22, 2018,
https://finance.yahoo.com/quote/AML.AX/history?
period1=1451586600andperiod2=1514658600andinterval=1dandfilter=historyandfrequency=
1d
⊘ This is a preview!⊘
Do you want full access?
Subscribe today to unlock all pages.
Trusted by 1+ million students worldwide
1 out of 27
Related Documents


Your All-in-One AI-Powered Toolkit for Academic Success.
+13062052269
info@desklib.com
Available 24*7 on WhatsApp / Email
![[object Object]](/_next/static/media/star-bottom.7253800d.svg)
Unlock your academic potential
Copyright © 2020–2026 A2Z Services. All Rights Reserved. Developed and managed by ZUCOL.