HI6007 Group Assignment: Regression Analysis of Credit Card User Data
VerifiedAdded on 2020/04/07
|17
|2905
|237
Project
AI Summary
This group assignment presents a comprehensive analysis of credit card user data. Task 1 focuses on descriptive statistics, including mean, median, standard deviation, and regression analysis. The analysis examines the relationships between income, household size, and the amount charged to credit cards. Two regression models are developed, with income and household size as independent variables. Task 2 involves the analysis of student performance data, including final exam scores and assignment scores for three different courses. Descriptive statistics are provided for each assessment, and correlation analysis is performed to identify relationships between different assessment components. The project provides a detailed statistical overview of the data, offering valuable insights into credit card usage and student performance.

Running Head: HI6007 GROUP ASSİGNMENT
Student Name:
Partner(s) Name:
Course:
Professor Name:
Date Submitted:
HI6007 Group Assignment
Student Name:
Partner(s) Name:
Course:
Professor Name:
Date Submitted:
HI6007 Group Assignment
Paraphrase This Document
Need a fresh take? Get an instant paraphrase of this document with our AI Paraphraser
HI6007 Group Assignment
Task 1
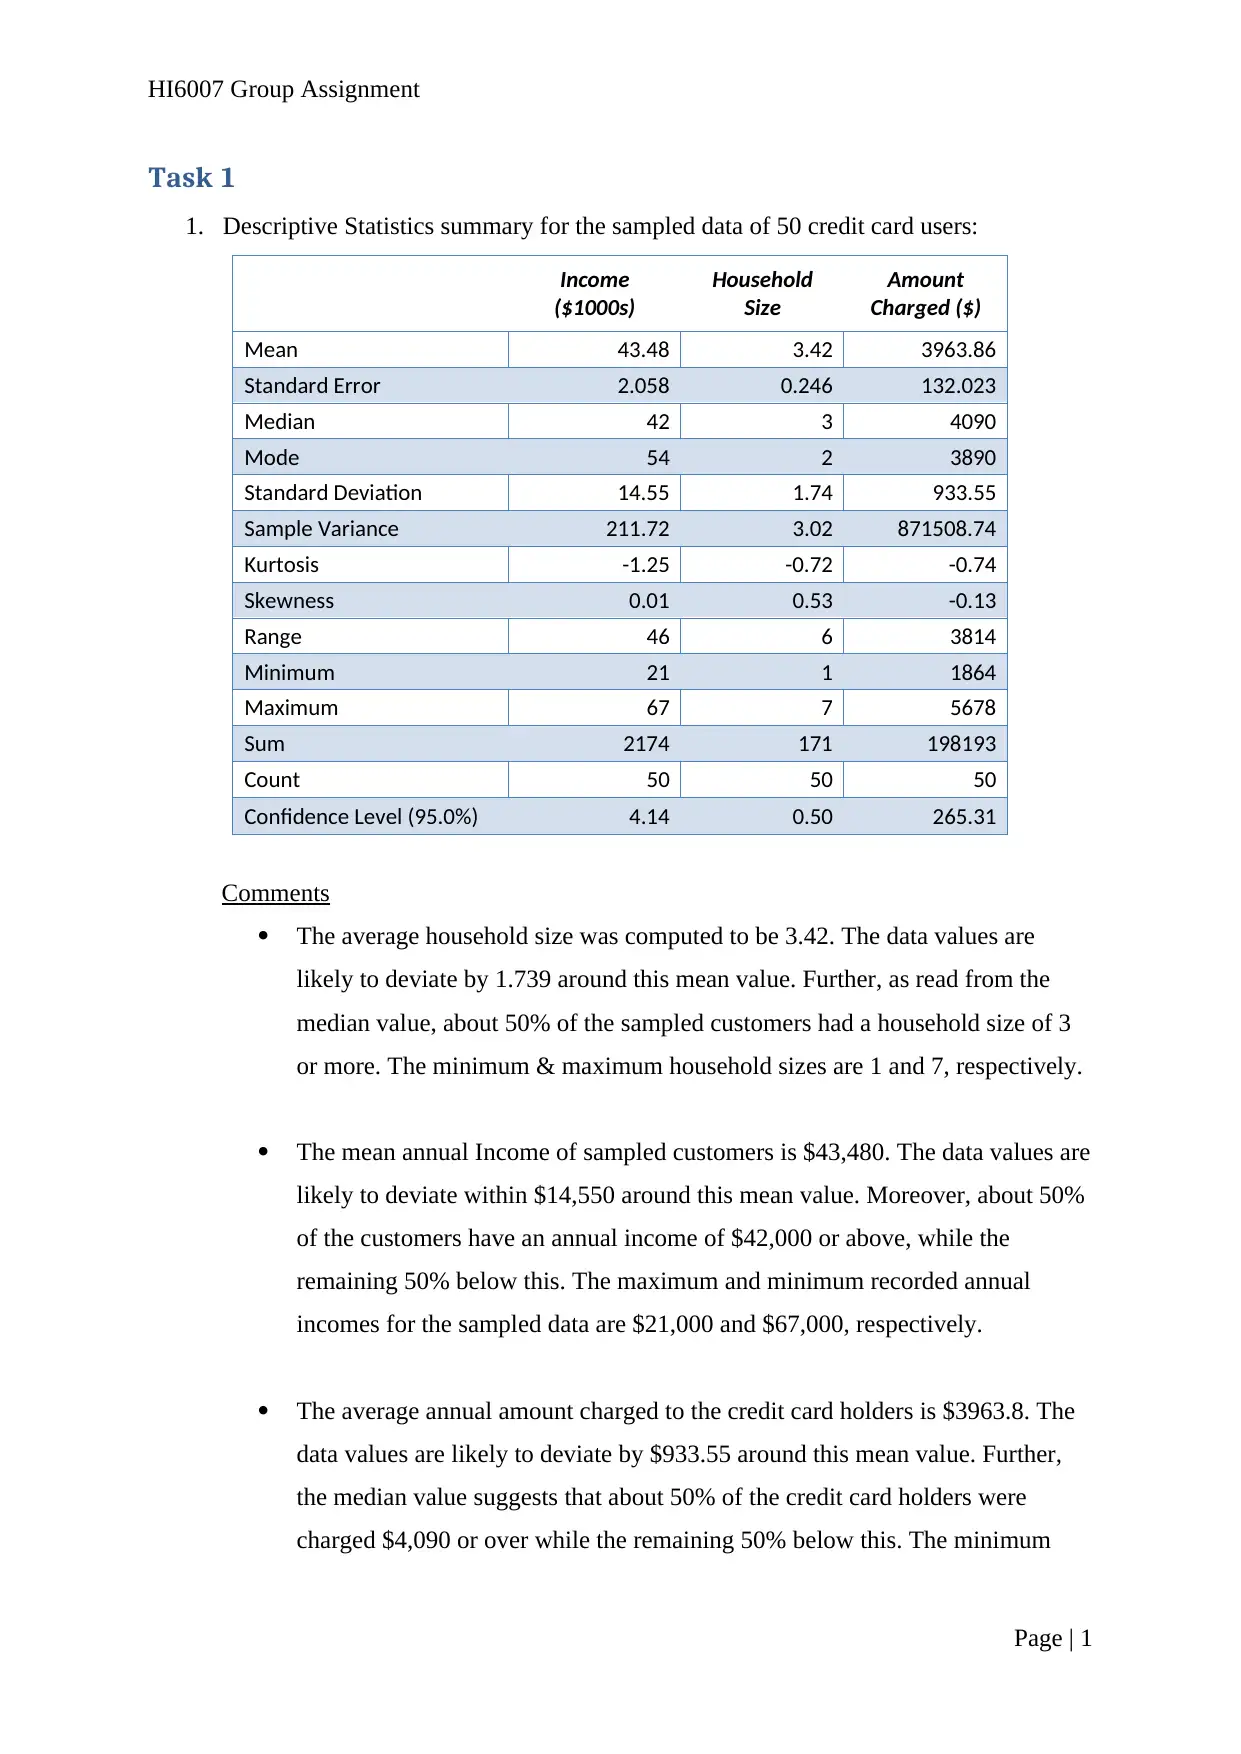
1. Descriptive Statistics summary for the sampled data of 50 credit card users:
Income
($1000s)
Household
Size
Amount
Charged ($)
Mean 43.48 3.42 3963.86
Standard Error 2.058 0.246 132.023
Median 42 3 4090
Mode 54 2 3890
Standard Deviation 14.55 1.74 933.55
Sample Variance 211.72 3.02 871508.74
Kurtosis -1.25 -0.72 -0.74
Skewness 0.01 0.53 -0.13
Range 46 6 3814
Minimum 21 1 1864
Maximum 67 7 5678
Sum 2174 171 198193
Count 50 50 50
Confidence Level (95.0%) 4.14 0.50 265.31
Comments
The average household size was computed to be 3.42. The data values are
likely to deviate by 1.739 around this mean value. Further, as read from the
median value, about 50% of the sampled customers had a household size of 3
or more. The minimum & maximum household sizes are 1 and 7, respectively.
The mean annual Income of sampled customers is $43,480. The data values are
likely to deviate within $14,550 around this mean value. Moreover, about 50%
of the customers have an annual income of $42,000 or above, while the
remaining 50% below this. The maximum and minimum recorded annual
incomes for the sampled data are $21,000 and $67,000, respectively.
The average annual amount charged to the credit card holders is $3963.8. The
data values are likely to deviate by $933.55 around this mean value. Further,
the median value suggests that about 50% of the credit card holders were
charged $4,090 or over while the remaining 50% below this. The minimum
Page | 1
Task 1
1. Descriptive Statistics summary for the sampled data of 50 credit card users:
Income
($1000s)
Household
Size
Amount
Charged ($)
Mean 43.48 3.42 3963.86
Standard Error 2.058 0.246 132.023
Median 42 3 4090
Mode 54 2 3890
Standard Deviation 14.55 1.74 933.55
Sample Variance 211.72 3.02 871508.74
Kurtosis -1.25 -0.72 -0.74
Skewness 0.01 0.53 -0.13
Range 46 6 3814
Minimum 21 1 1864
Maximum 67 7 5678
Sum 2174 171 198193
Count 50 50 50
Confidence Level (95.0%) 4.14 0.50 265.31
Comments
The average household size was computed to be 3.42. The data values are
likely to deviate by 1.739 around this mean value. Further, as read from the
median value, about 50% of the sampled customers had a household size of 3
or more. The minimum & maximum household sizes are 1 and 7, respectively.
The mean annual Income of sampled customers is $43,480. The data values are
likely to deviate within $14,550 around this mean value. Moreover, about 50%
of the customers have an annual income of $42,000 or above, while the
remaining 50% below this. The maximum and minimum recorded annual
incomes for the sampled data are $21,000 and $67,000, respectively.
The average annual amount charged to the credit card holders is $3963.8. The
data values are likely to deviate by $933.55 around this mean value. Further,
the median value suggests that about 50% of the credit card holders were
charged $4,090 or over while the remaining 50% below this. The minimum
Page | 1
HI6007 Group Assignment
and maximum amounts charged to credit card holders are $1,864 and $5,678,
respectively.
The kurtosis and skewness factors for all the three variables further indicate
that distribution is approximately normal (with some measure of skewness).
2. Following regression models and equations were obtained for the 2 cases:
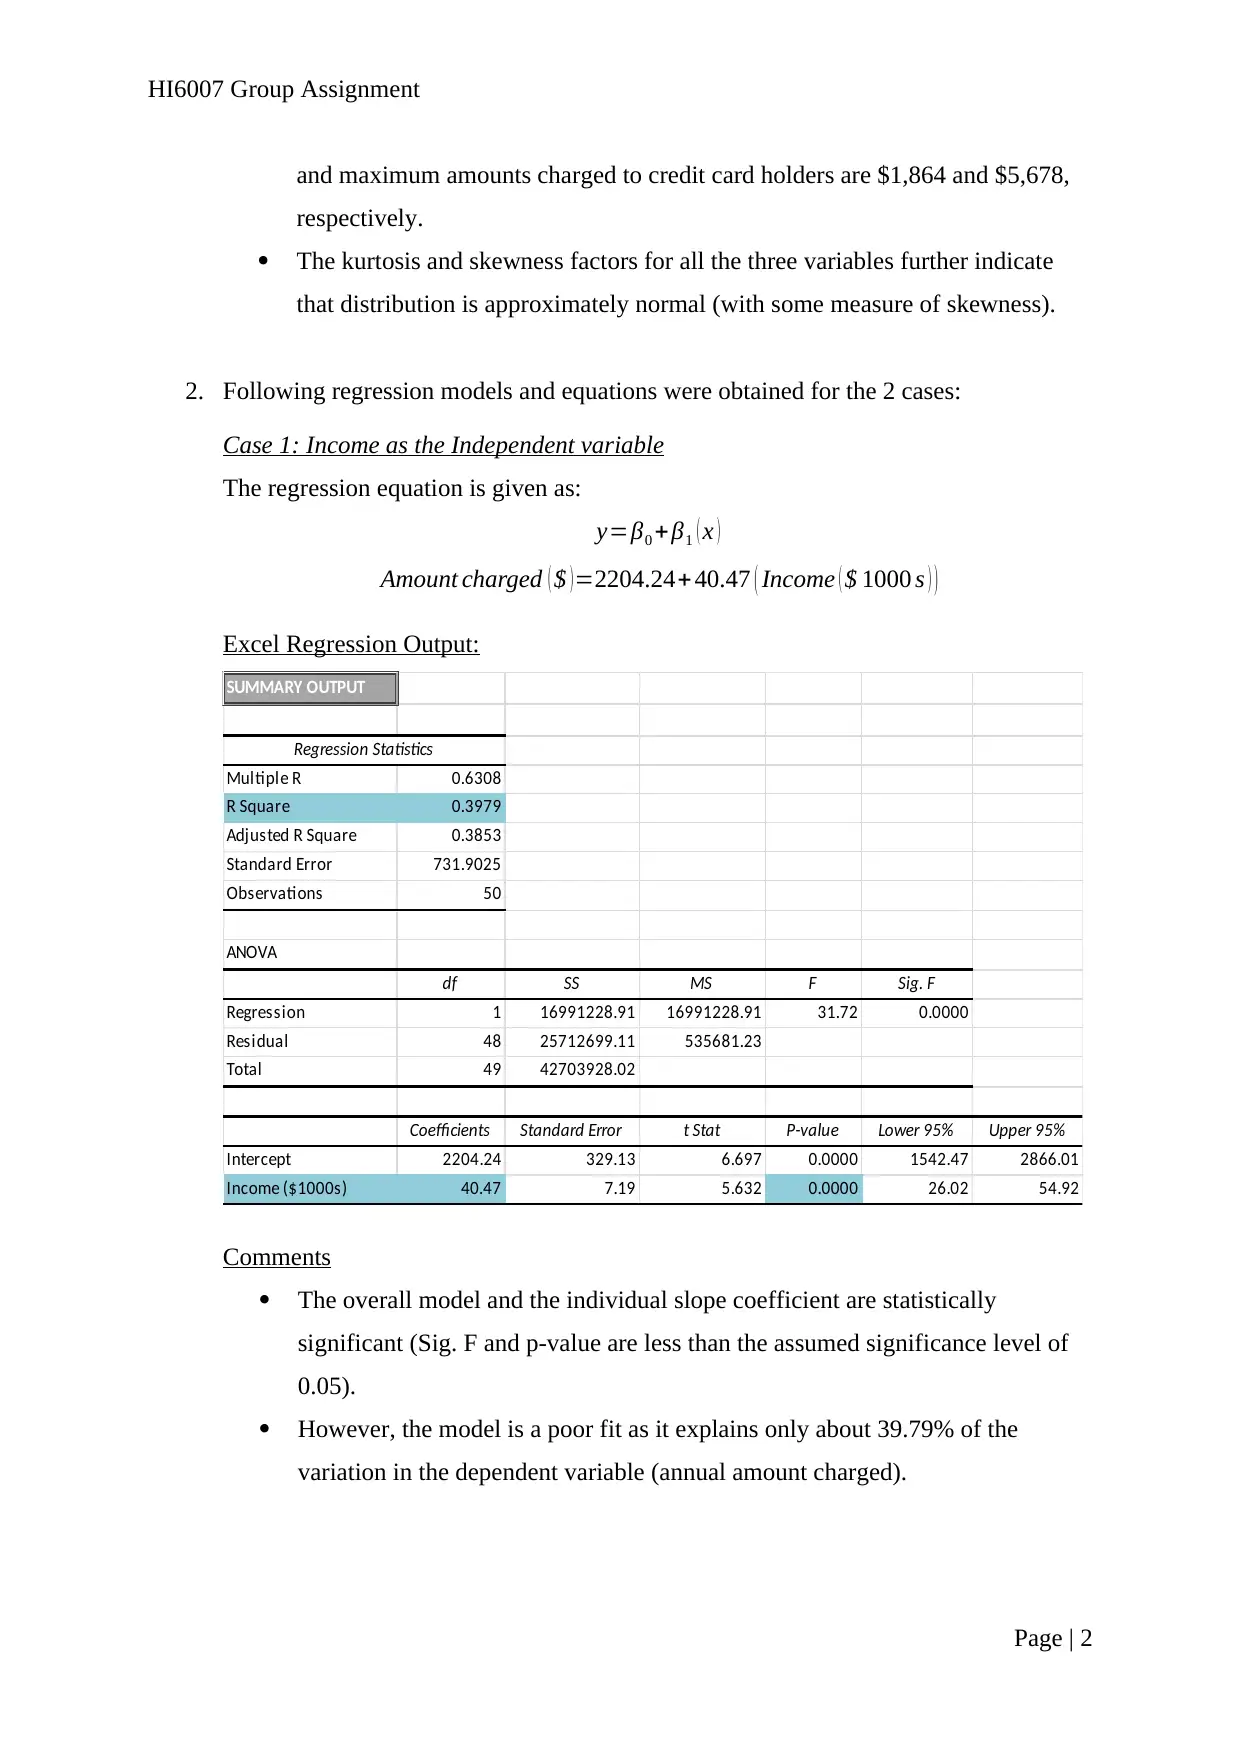
Case 1: Income as the Independent variable
The regression equation is given as:
y=β0 +β1 ( x )
Amount charged ( $ )=2204.24+ 40.47 ( Income ( $ 1000 s ) )
Excel Regression Output:
SUMMARY OUTPUT
Regression Statistics
Multiple R 0.6308
R Square 0.3979
Adjusted R Square 0.3853
Standard Error 731.9025
Observations 50
ANOVA
df SS MS F Sig. F
Regression 1 16991228.91 16991228.91 31.72 0.0000
Residual 48 25712699.11 535681.23
Total 49 42703928.02
Coefficients Standard Error t Stat P-value Lower 95% Upper 95%
Intercept 2204.24 329.13 6.697 0.0000 1542.47 2866.01
Income ($1000s) 40.47 7.19 5.632 0.0000 26.02 54.92
Comments
The overall model and the individual slope coefficient are statistically
significant (Sig. F and p-value are less than the assumed significance level of
0.05).
However, the model is a poor fit as it explains only about 39.79% of the
variation in the dependent variable (annual amount charged).
Page | 2
and maximum amounts charged to credit card holders are $1,864 and $5,678,
respectively.
The kurtosis and skewness factors for all the three variables further indicate
that distribution is approximately normal (with some measure of skewness).
2. Following regression models and equations were obtained for the 2 cases:
Case 1: Income as the Independent variable
The regression equation is given as:
y=β0 +β1 ( x )
Amount charged ( $ )=2204.24+ 40.47 ( Income ( $ 1000 s ) )
Excel Regression Output:
SUMMARY OUTPUT
Regression Statistics
Multiple R 0.6308
R Square 0.3979
Adjusted R Square 0.3853
Standard Error 731.9025
Observations 50
ANOVA
df SS MS F Sig. F
Regression 1 16991228.91 16991228.91 31.72 0.0000
Residual 48 25712699.11 535681.23
Total 49 42703928.02
Coefficients Standard Error t Stat P-value Lower 95% Upper 95%
Intercept 2204.24 329.13 6.697 0.0000 1542.47 2866.01
Income ($1000s) 40.47 7.19 5.632 0.0000 26.02 54.92
Comments
The overall model and the individual slope coefficient are statistically
significant (Sig. F and p-value are less than the assumed significance level of
0.05).
However, the model is a poor fit as it explains only about 39.79% of the
variation in the dependent variable (annual amount charged).
Page | 2
⊘ This is a preview!⊘
Do you want full access?
Subscribe today to unlock all pages.
Trusted by 1+ million students worldwide
HI6007 Group Assignment
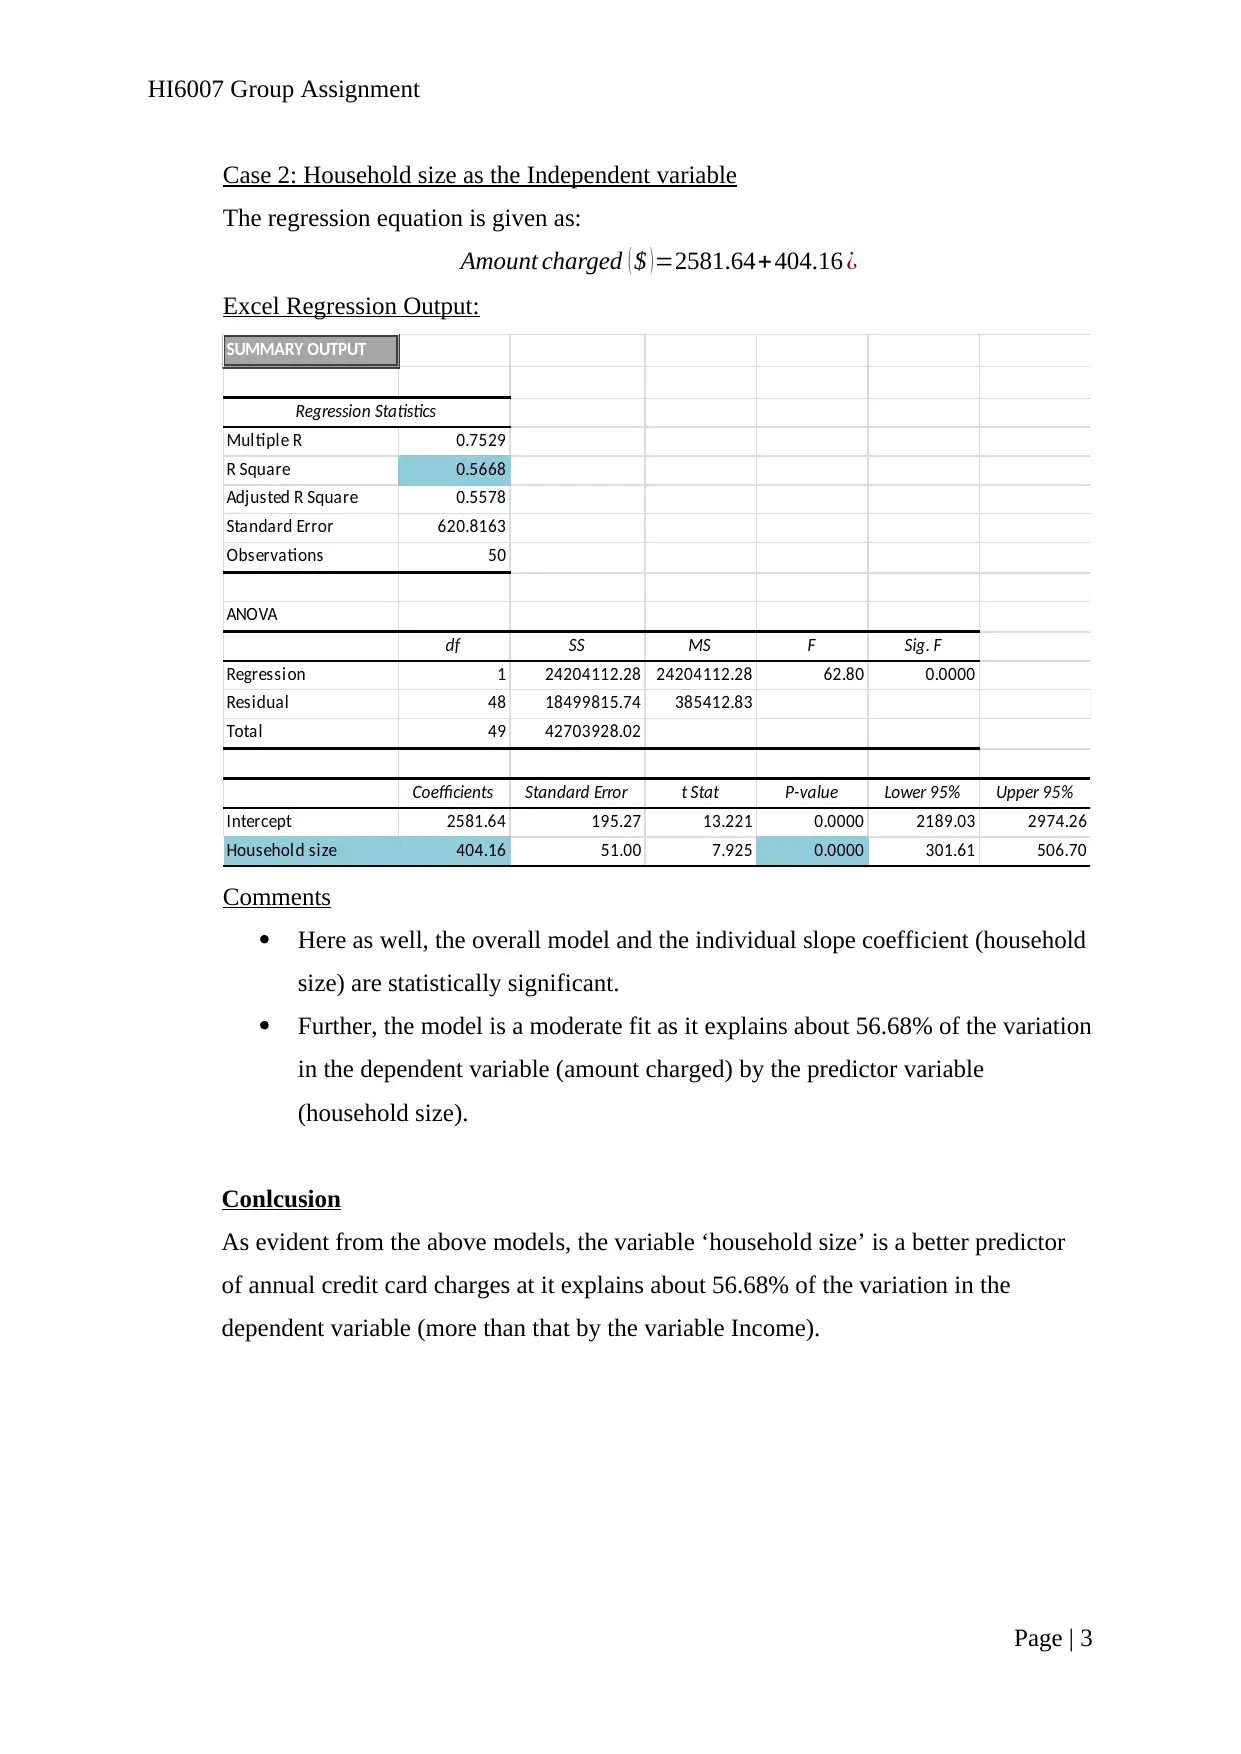
Case 2: Household size as the Independent variable
The regression equation is given as:
Amount charged ( $ )=2581.64+404.16 ¿
Excel Regression Output:
SUMMARY OUTPUT
Regression Statistics
Multiple R 0.7529
R Square 0.5668
Adjusted R Square 0.5578
Standard Error 620.8163
Observations 50
ANOVA
df SS MS F Sig. F
Regression 1 24204112.28 24204112.28 62.80 0.0000
Residual 48 18499815.74 385412.83
Total 49 42703928.02
Coefficients Standard Error t Stat P-value Lower 95% Upper 95%
Intercept 2581.64 195.27 13.221 0.0000 2189.03 2974.26
Household size 404.16 51.00 7.925 0.0000 301.61 506.70
Comments
Here as well, the overall model and the individual slope coefficient (household
size) are statistically significant.
Further, the model is a moderate fit as it explains about 56.68% of the variation
in the dependent variable (amount charged) by the predictor variable
(household size).
Conlcusion
As evident from the above models, the variable ‘household size’ is a better predictor
of annual credit card charges at it explains about 56.68% of the variation in the
dependent variable (more than that by the variable Income).
Page | 3
Paraphrase This Document
Need a fresh take? Get an instant paraphrase of this document with our AI Paraphraser
HI6007 Group Assignment
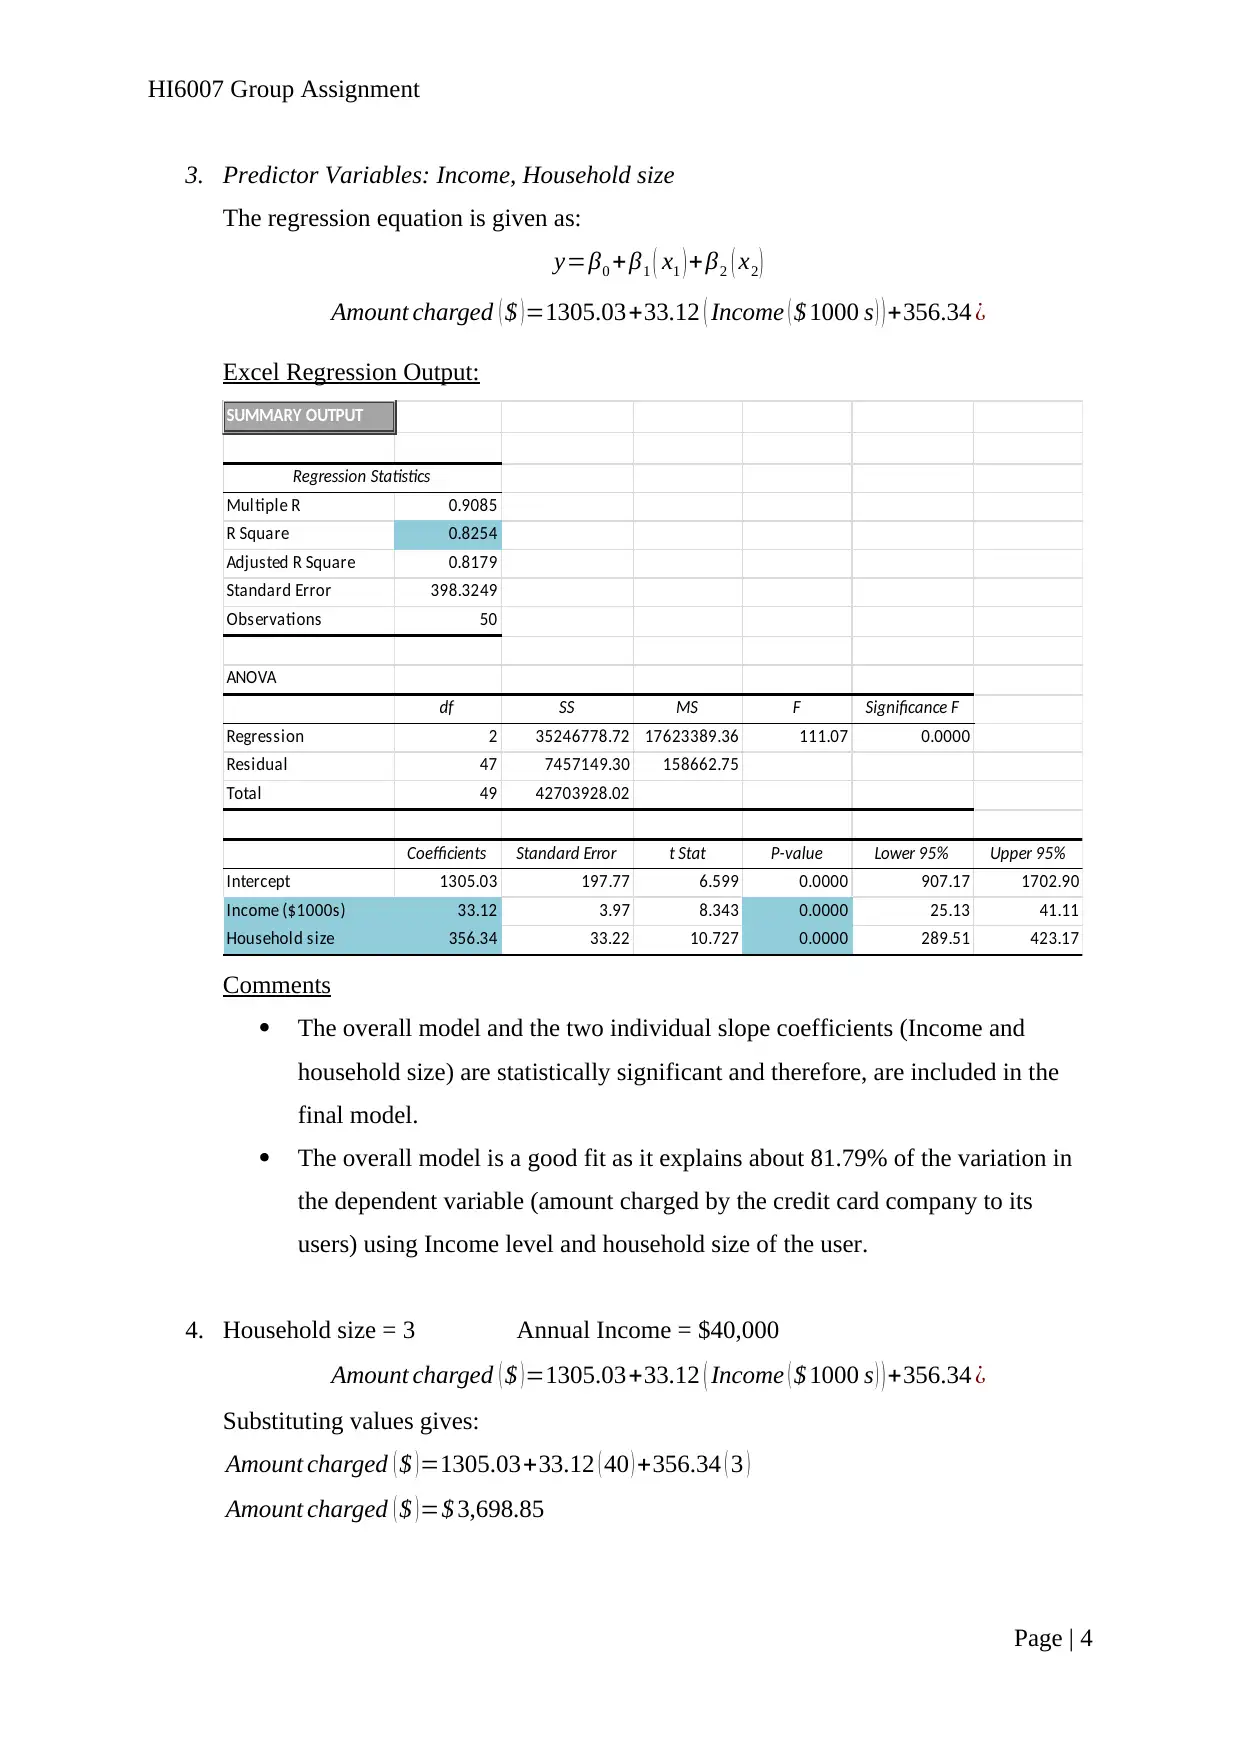
3. Predictor Variables: Income, Household size
The regression equation is given as:
y=β0 +β1 ( x1 ) + β2 ( x2 )
Amount charged ( $ ) =1305.03+33.12 ( Income ( $ 1000 s ) ) +356.34 ¿
Excel Regression Output:
SUMMARY OUTPUT
Regression Statistics
Multiple R 0.9085
R Square 0.8254
Adjusted R Square 0.8179
Standard Error 398.3249
Observations 50
ANOVA
df SS MS F Significance F
Regression 2 35246778.72 17623389.36 111.07 0.0000
Residual 47 7457149.30 158662.75
Total 49 42703928.02
Coefficients Standard Error t Stat P-value Lower 95% Upper 95%
Intercept 1305.03 197.77 6.599 0.0000 907.17 1702.90
Income ($1000s) 33.12 3.97 8.343 0.0000 25.13 41.11
Household size 356.34 33.22 10.727 0.0000 289.51 423.17
Comments
The overall model and the two individual slope coefficients (Income and
household size) are statistically significant and therefore, are included in the
final model.
The overall model is a good fit as it explains about 81.79% of the variation in
the dependent variable (amount charged by the credit card company to its
users) using Income level and household size of the user.
4. Household size = 3 Annual Income = $40,000
Amount charged ( $ ) =1305.03+33.12 ( Income ( $ 1000 s ) ) +356.34 ¿
Substituting values gives:
Amount charged ( $ ) =1305.03+33.12 ( 40 ) +356.34 ( 3 )
Amount charged ( $ ) =$ 3,698.85
Page | 4
HI6007 Group Assignment
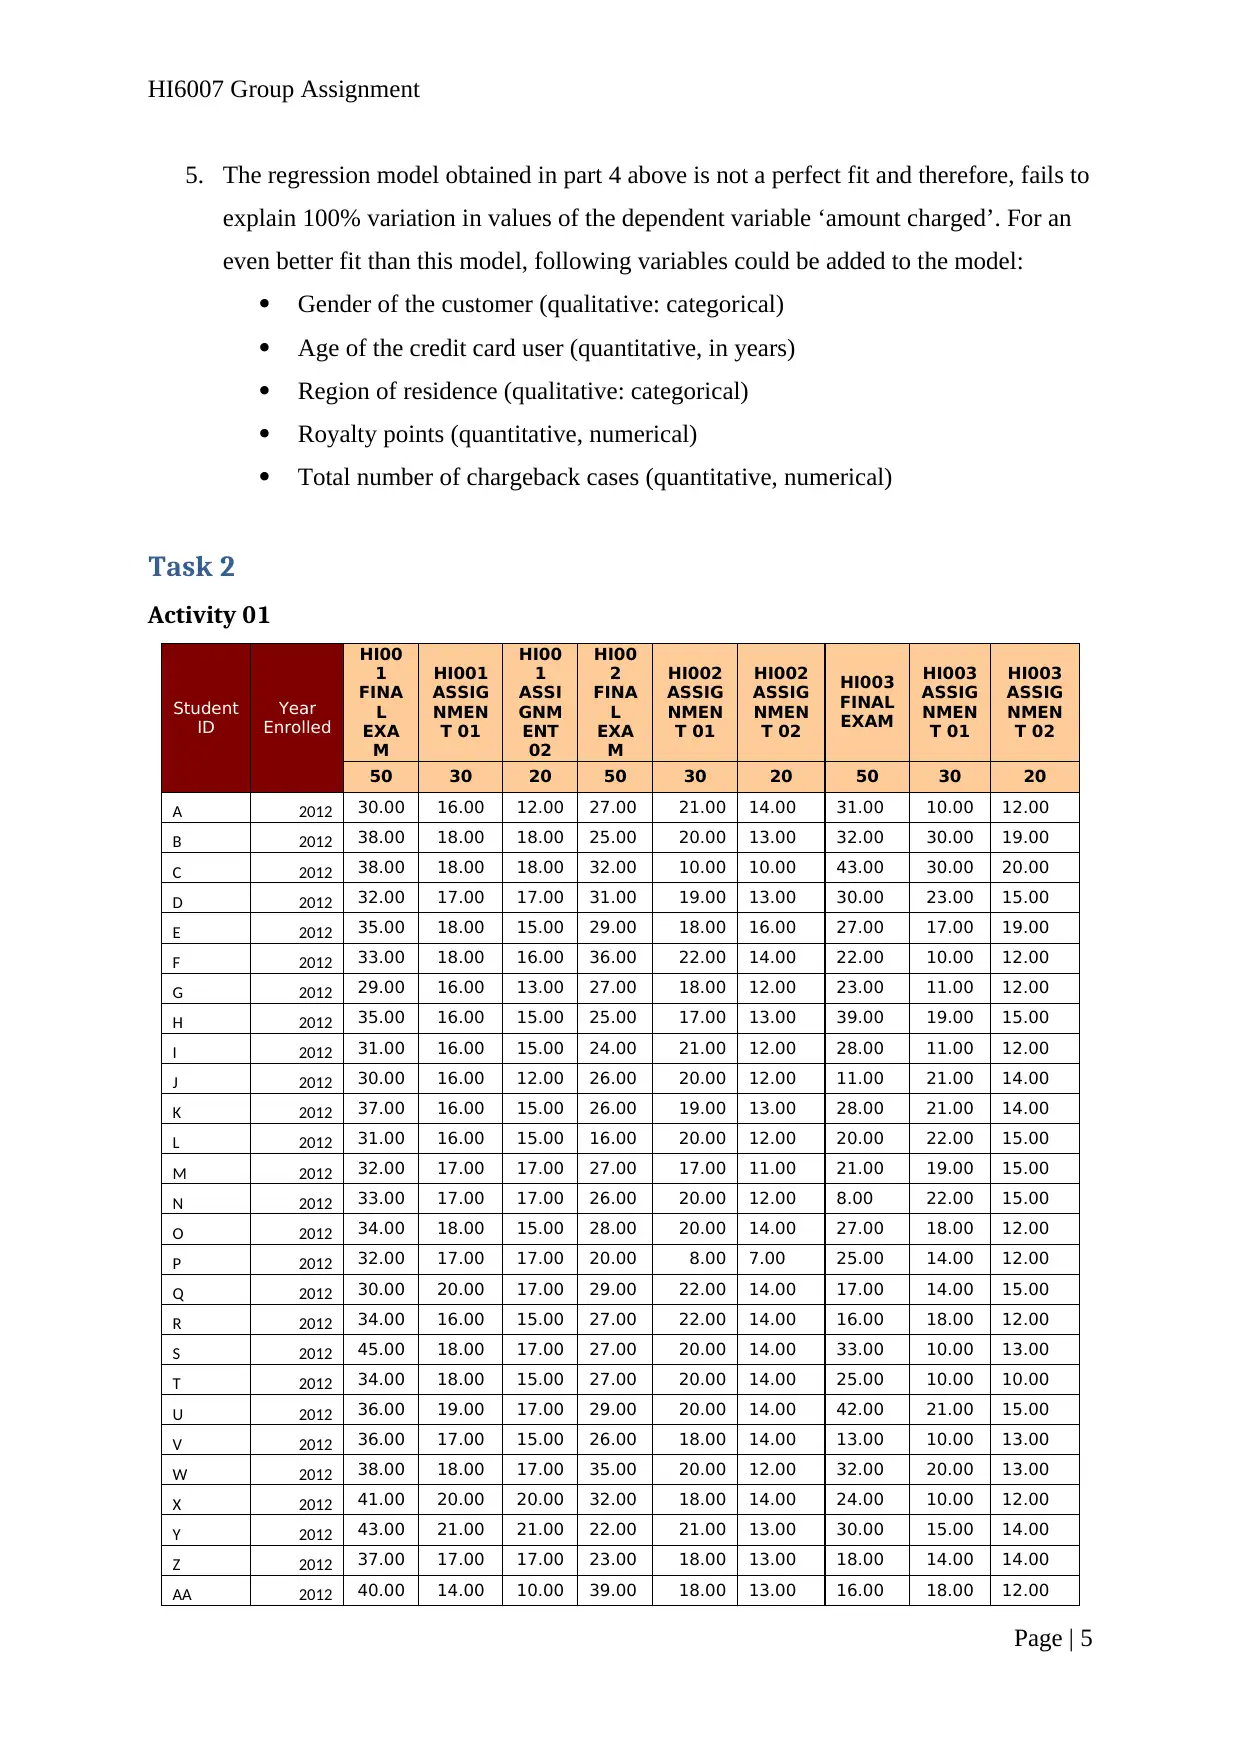
5. The regression model obtained in part 4 above is not a perfect fit and therefore, fails to
explain 100% variation in values of the dependent variable ‘amount charged’. For an
even better fit than this model, following variables could be added to the model:
Gender of the customer (qualitative: categorical)
Age of the credit card user (quantitative, in years)
Region of residence (qualitative: categorical)
Royalty points (quantitative, numerical)
Total number of chargeback cases (quantitative, numerical)
Task 2
Activity 01
Student
ID
Year
Enrolled
HI00
1
FINA
L
EXA
M
HI001
ASSIG
NMEN
T 01
HI00
1
ASSI
GNM
ENT
02
HI00
2
FINA
L
EXA
M
HI002
ASSIG
NMEN
T 01
HI002
ASSIG
NMEN
T 02
HI003
FINAL
EXAM
HI003
ASSIG
NMEN
T 01
HI003
ASSIG
NMEN
T 02
50 30 20 50 30 20 50 30 20
A 2012 30.00 16.00 12.00 27.00 21.00 14.00 31.00 10.00 12.00
B 2012 38.00 18.00 18.00 25.00 20.00 13.00 32.00 30.00 19.00
C 2012 38.00 18.00 18.00 32.00 10.00 10.00 43.00 30.00 20.00
D 2012 32.00 17.00 17.00 31.00 19.00 13.00 30.00 23.00 15.00
E 2012 35.00 18.00 15.00 29.00 18.00 16.00 27.00 17.00 19.00
F 2012 33.00 18.00 16.00 36.00 22.00 14.00 22.00 10.00 12.00
G 2012 29.00 16.00 13.00 27.00 18.00 12.00 23.00 11.00 12.00
H 2012 35.00 16.00 15.00 25.00 17.00 13.00 39.00 19.00 15.00
I 2012 31.00 16.00 15.00 24.00 21.00 12.00 28.00 11.00 12.00
J 2012 30.00 16.00 12.00 26.00 20.00 12.00 11.00 21.00 14.00
K 2012 37.00 16.00 15.00 26.00 19.00 13.00 28.00 21.00 14.00
L 2012 31.00 16.00 15.00 16.00 20.00 12.00 20.00 22.00 15.00
M 2012 32.00 17.00 17.00 27.00 17.00 11.00 21.00 19.00 15.00
N 2012 33.00 17.00 17.00 26.00 20.00 12.00 8.00 22.00 15.00
O 2012 34.00 18.00 15.00 28.00 20.00 14.00 27.00 18.00 12.00
P 2012 32.00 17.00 17.00 20.00 8.00 7.00 25.00 14.00 12.00
Q 2012 30.00 20.00 17.00 29.00 22.00 14.00 17.00 14.00 15.00
R 2012 34.00 16.00 15.00 27.00 22.00 14.00 16.00 18.00 12.00
S 2012 45.00 18.00 17.00 27.00 20.00 14.00 33.00 10.00 13.00
T 2012 34.00 18.00 15.00 27.00 20.00 14.00 25.00 10.00 10.00
U 2012 36.00 19.00 17.00 29.00 20.00 14.00 42.00 21.00 15.00
V 2012 36.00 17.00 15.00 26.00 18.00 14.00 13.00 10.00 13.00
W 2012 38.00 18.00 17.00 35.00 20.00 12.00 32.00 20.00 13.00
X 2012 41.00 20.00 20.00 32.00 18.00 14.00 24.00 10.00 12.00
Y 2012 43.00 21.00 21.00 22.00 21.00 13.00 30.00 15.00 14.00
Z 2012 37.00 17.00 17.00 23.00 18.00 13.00 18.00 14.00 14.00
AA 2012 40.00 14.00 10.00 39.00 18.00 13.00 16.00 18.00 12.00
Page | 5
⊘ This is a preview!⊘
Do you want full access?
Subscribe today to unlock all pages.
Trusted by 1+ million students worldwide
HI6007 Group Assignment
AB 2012 38.00 18.00 15.00 26.00 19.00 13.00 25.00 19.00 15.00
AC 2012 29.00 18.00 18.00 MC 17.00 11.00 23.00 10.00 13.00
AD 2012 36.00 17.00 15.00 30.00 20.00 14.00 4.00 10.00 13.00
AE 2013 37.00 18.00 17.00 36.00 21.00 13.00 25.00 10.00 11.00
AF 2013 34.00 16.00 17.00 31.00 18.00 13.00 40.00 18.00 12.00
AG 2013 32.00 17.00 17.00 28.00 20.00 14.00 35.00 15.00 14.00
AH 2013 30.00 8.00 8.00 30.00 19.00 13.00 4.00 19.00 14.00
AI 2013 31.00 17.00 17.00 28.00 20.00 12.00 37.00 19.00 14.00
AJ 2013 34.00 17.00 16.00 29.00 19.00 12.00 25.00 19.00 14.00
AK 2013 36.00 17.00 15.00 24.00 19.00 13.00 20.00 19.00 14.00
AL 2013 30.00 18.00 17.00 28.00 20.00 12.00 39.00 20.00 13.00
AM 2013 37.00 16.00 18.00 24.00 18.00 13.00 26.00 18.00 12.00
AN 2013 31.00 15.00 16.00 24.00 19.00 13.00 24.00 15.00 8.00
AO 2013 37.00 19.00 17.00 28.00 19.00 13.00 40.00 22.00 16.00
AP 2013 38.00 18.00 17.00 35.00 21.00 14.00 25.00 20.00 13.00
AQ 2013 23.00 18.00 14.00 35.00 21.00 14.00 25.00 10.00 10.00
AR 2013 26.00 17.00 13.00 36.00 22.00 14.00 20.00 12.00 14.00
AS 2013 38.00 15.00 15.00 25.00 21.00 11.00 10.00 22.00 18.00
AT 2013 23.00 17.00 14.00 16.00 19.00 13.00 32.00 18.00 13.00
AU 2013 37.00 18.00 17.00 33.00 10.00 13.00 28.00 20.00 15.00
AV 2013 30.00 18.00 17.00 26.00 18.00 13.00 25.00 18.00 13.00
AW 2013 33.00 18.00 16.00 12.00 8.00 7.00 10.00 18.00 13.00
AX 2013 34.00 18.00 16.00 24.00 17.00 14.00 34.00 24.00 16.00
AY 2013 24.00 15.00 10.00 28.00 20.00 13.00 38.00 19.00 13.00
AZ 2013 41.00 20.00 21.00 36.00 18.00 16.00 42.00 18.00 13.00
BA 2013 31.00 18.00 18.00 27.00 10.00 13.00 24.00 20.00 14.00
BB 2013 34.00 18.00 16.00 25.00 20.00 13.00 23.00 20.00 15.00
BC 2013 31.00 17.00 18.00 32.00 21.00 12.00 26.00 20.00 12.00
BD 2013 20.00 10.00 10.00 25.00 18.00 12.00 33.00 19.00 13.00
BE 2013 26.00 19.00 19.00 20.00 10.00 10.00 23.00 22.00 13.00
BF 2013 25.00 18.00 13.00 26.00 17.00 11.00 26.00 19.00 13.00
BG 2013 24.00 18.00 14.00 17.00 18.00 13.00 17.00 18.00 13.00
BH 2013 38.00 22.00 18.00 18.00 10.00 5.00 30.00 20.00 15.00
BI 2013 34.00 20.00 14.00 24.00 4.00 4.00 23.00 20.00 15.00
BJ 2013 MC 22.00 17.00 32.00 18.00 14.00 24.00 20.00 13.00
BK 2013 MC 19.00 17.00 27.00 20.00 14.00 26.00 20.00 12.00
BL 2013 40.00 19.00 17.00 21.00 20.00 14.00 35.00 22.00 13.00
BM 2014 29.00 15.00 14.00 30.00 15.00 14.00 25.00 19.00 13.00
BN 2014 37.00 17.00 17.00 25.00 18.00 14.00 32.00 20.00 12.00
BO 2014 29.00 18.00 15.00 34.00 14.00 12.00 26.00 20.00 12.00
BP 2014 29.00 15.00 13.00 32.00 17.00 11.00 25.00 19.00 14.00
BQ 2014 29.00 16.00 13.00 18.00 18.00 12.00 15.00 19.00 14.00
BR 2014 31.00 18.00 16.00 27.00 18.00 12.00 24.00 19.00 13.00
BS 2014 29.00 17.00 16.00 22.00 18.00 12.00 32.00 19.00 14.00
BT 2014 28.00 16.00 13.00 24.00 20.00 14.00 25.00 19.00 14.00
BU 2014 32.00 18.00 15.00 24.00 20.00 14.00 29.00 22.00 13.00
BV 2014 29.00 17.00 12.00 24.00 20.00 14.00 39.00 18.00 13.00
BW 2014 33.00 16.00 16.00 33.00 13.00 14.00 25.00 18.00 13.00
Page | 6
Paraphrase This Document
Need a fresh take? Get an instant paraphrase of this document with our AI Paraphraser
HI6007 Group Assignment
BX 2014 33.00 18.00 16.00 25.00 12.00 11.00 25.00 19.00 14.00
BY 2014 25.00 16.00 16.00 28.00 14.00 12.00 15.00 19.00 14.00
BZ 2014 29.00 16.00 12.00 28.00 20.00 12.00 26.00 19.00 13.00
CA 2014 40.00 18.00 18.00 19.00 19.00 8.00 16.00 19.00 13.00
CB 2014 23.00 17.00 15.00 26.00 19.00 8.00 18.00 20.00 12.00
CC 2014 36.00 19.00 18.00 28.00 19.00 10.00 30.00 18.00 13.00
CD 2014 30.00 16.00 12.00 23.00 19.00 12.00 15.00 20.00 13.00
CE 2014 36.00 18.00 17.00 25.00 15.00 12.00 37.00 20.00 14.00
CF 2014 24.00 15.00 13.00 20.00 14.00 12.00 24.00 20.00 14.00
CG 2014 30.00 15.00 12.00 31.00 14.00 12.00 26.00 19.00 13.00
CH 2014 29.00 16.00 13.00 18.00 20.00 8.00 22.00 20.00 14.00
CI 2014 35.00 18.00 15.00 26.00 20.00 12.00 32.00 18.00 13.00
CJ 2014 34.00 15.00 16.00 16.00 18.00 14.00 24.00 20.00 14.00
CK 2014 28.00 14.00 14.00 27.00 19.00 12.00 25.00 19.00 14.00
CL 2014 34.00 19.00 15.00 25.00 20.00 13.00 32.00 18.00 13.00
CM 2014 24.00 18.00 14.00 30.00 20.00 13.00 28.00 20.00 15.00
CN 2014 26.00 17.00 14.00 40.00 17.00 13.00 25.00 16.00 13.00
CO 2014 24.00 20.00 13.00 19.00 15.00 14.00 25.00 20.00 13.00
CP 2014 33.00 15.00 17.00 25.00 19.00 13.00 42.00 20.00 12.00
CQ 2014 38.00 18.00 16.00 26.00 18.00 12.00 40.00 15.00 18.00
CR 2014 29.00 16.00 13.00 29.00 13.00 14.00 25.00 20.00 13.00
CS 2014 31.00 18.00 16.00 31.00 18.00 13.00 26.00 20.00 12.00
CT 2014 37.00 21.00 18.00 32.00 17.00 11.00 25.00 22.00 14.00
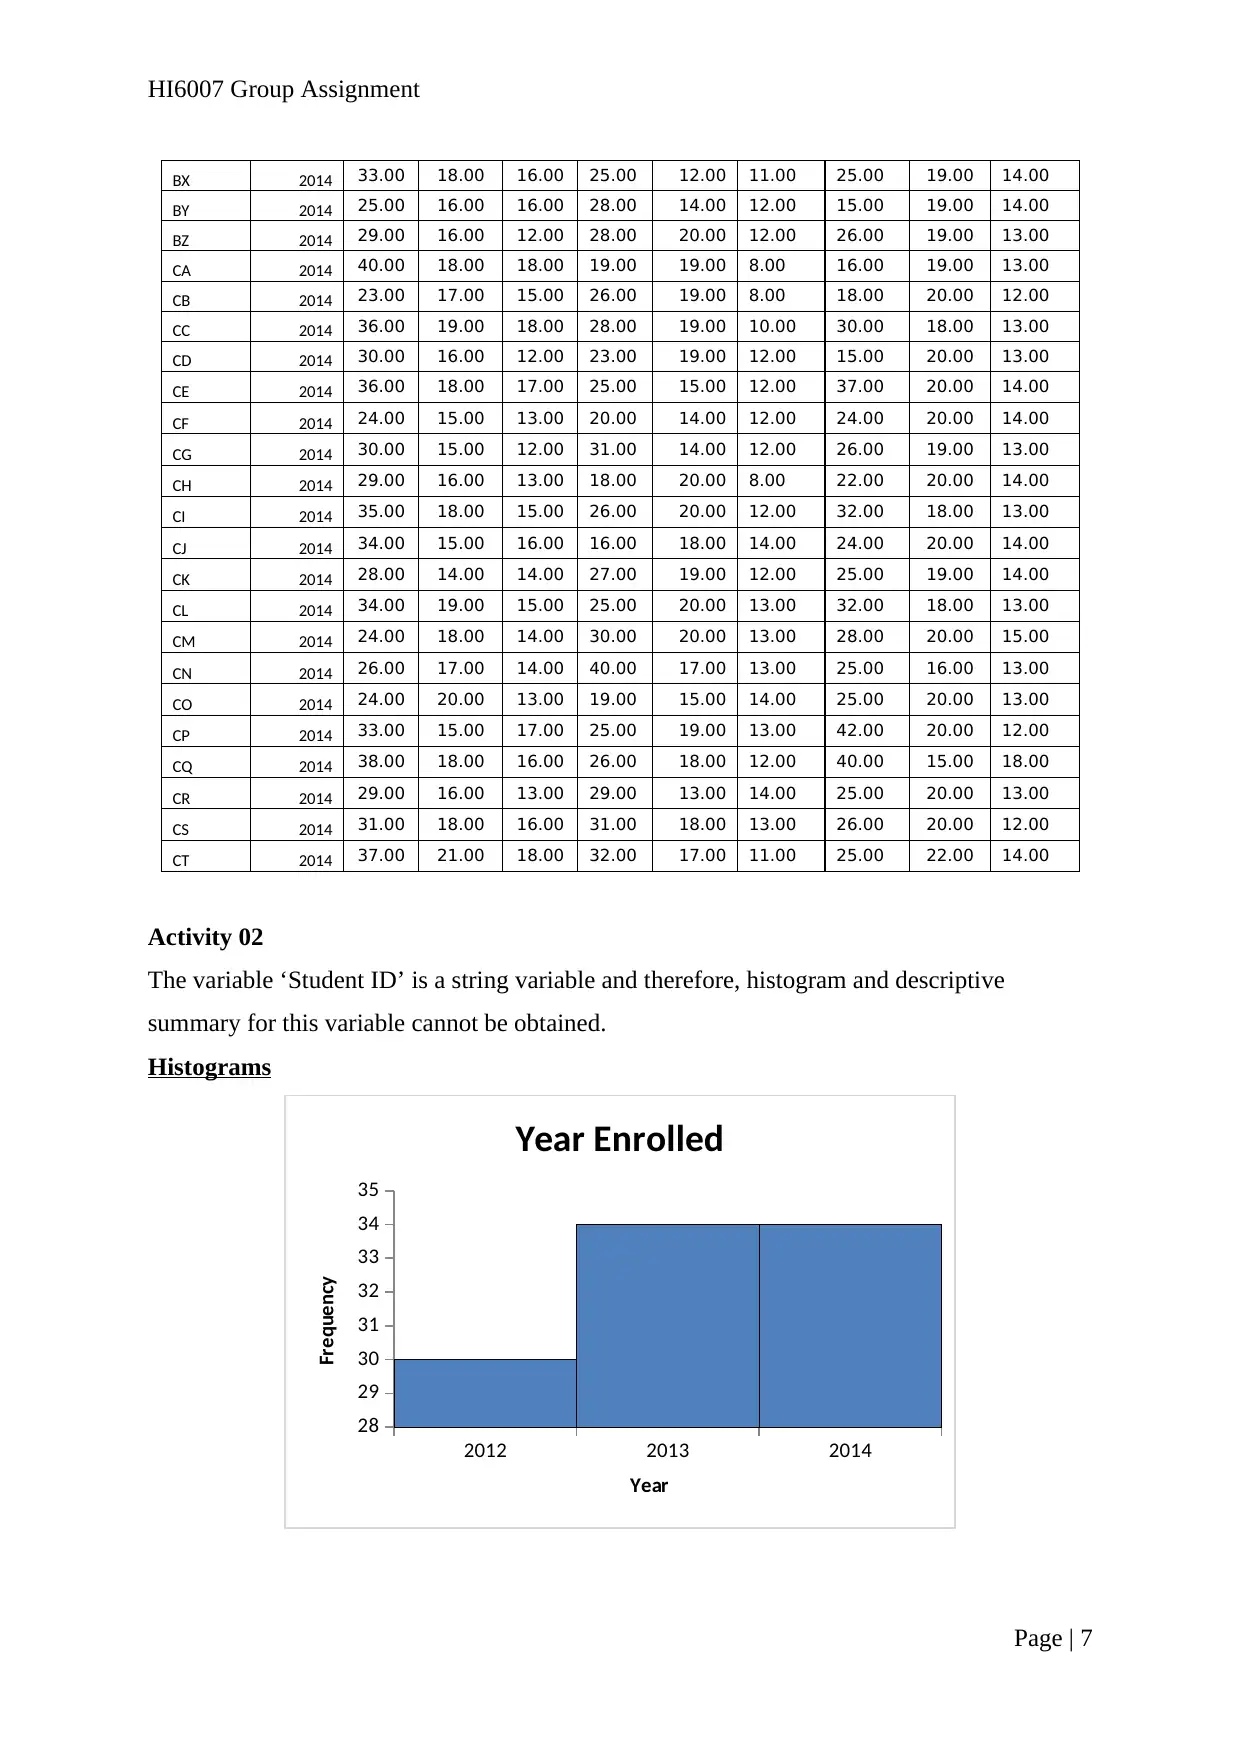
Activity 02
The variable ‘Student ID’ is a string variable and therefore, histogram and descriptive
summary for this variable cannot be obtained.
Histograms
2012 2013 2014
28
29
30
31
32
33
34
35
Year Enrolled
Year
Frequency
Page | 7
BX 2014 33.00 18.00 16.00 25.00 12.00 11.00 25.00 19.00 14.00
BY 2014 25.00 16.00 16.00 28.00 14.00 12.00 15.00 19.00 14.00
BZ 2014 29.00 16.00 12.00 28.00 20.00 12.00 26.00 19.00 13.00
CA 2014 40.00 18.00 18.00 19.00 19.00 8.00 16.00 19.00 13.00
CB 2014 23.00 17.00 15.00 26.00 19.00 8.00 18.00 20.00 12.00
CC 2014 36.00 19.00 18.00 28.00 19.00 10.00 30.00 18.00 13.00
CD 2014 30.00 16.00 12.00 23.00 19.00 12.00 15.00 20.00 13.00
CE 2014 36.00 18.00 17.00 25.00 15.00 12.00 37.00 20.00 14.00
CF 2014 24.00 15.00 13.00 20.00 14.00 12.00 24.00 20.00 14.00
CG 2014 30.00 15.00 12.00 31.00 14.00 12.00 26.00 19.00 13.00
CH 2014 29.00 16.00 13.00 18.00 20.00 8.00 22.00 20.00 14.00
CI 2014 35.00 18.00 15.00 26.00 20.00 12.00 32.00 18.00 13.00
CJ 2014 34.00 15.00 16.00 16.00 18.00 14.00 24.00 20.00 14.00
CK 2014 28.00 14.00 14.00 27.00 19.00 12.00 25.00 19.00 14.00
CL 2014 34.00 19.00 15.00 25.00 20.00 13.00 32.00 18.00 13.00
CM 2014 24.00 18.00 14.00 30.00 20.00 13.00 28.00 20.00 15.00
CN 2014 26.00 17.00 14.00 40.00 17.00 13.00 25.00 16.00 13.00
CO 2014 24.00 20.00 13.00 19.00 15.00 14.00 25.00 20.00 13.00
CP 2014 33.00 15.00 17.00 25.00 19.00 13.00 42.00 20.00 12.00
CQ 2014 38.00 18.00 16.00 26.00 18.00 12.00 40.00 15.00 18.00
CR 2014 29.00 16.00 13.00 29.00 13.00 14.00 25.00 20.00 13.00
CS 2014 31.00 18.00 16.00 31.00 18.00 13.00 26.00 20.00 12.00
CT 2014 37.00 21.00 18.00 32.00 17.00 11.00 25.00 22.00 14.00
Activity 02
The variable ‘Student ID’ is a string variable and therefore, histogram and descriptive
summary for this variable cannot be obtained.
Histograms
2012 2013 2014
28
29
30
31
32
33
34
35
Year Enrolled
Year
Frequency
Page | 7
HI6007 Group Assignment
0-6 7-13 14-20 21-27 28-34 35-41 42-48 49 and
over
0
10
20
30
40
50
60
HI001 Final Exam
Marks (out of 50)
Frequency
0-3 4-7 8-11 12-15 16-19 20-23 24-27 28 or
more
0
10
20
30
40
50
60
70
80
HI001 ASSIGNMENT 01
Marks (out of 30)
Frequency
0-2 3-5 6-8 9-11 12-14 15-17 18 and
over
0
10
20
30
40
50
60
HI001 ASSIGNMENT 02
Marks (out of 20)
Frequency
Page | 8
⊘ This is a preview!⊘
Do you want full access?
Subscribe today to unlock all pages.
Trusted by 1+ million students worldwide
HI6007 Group Assignment
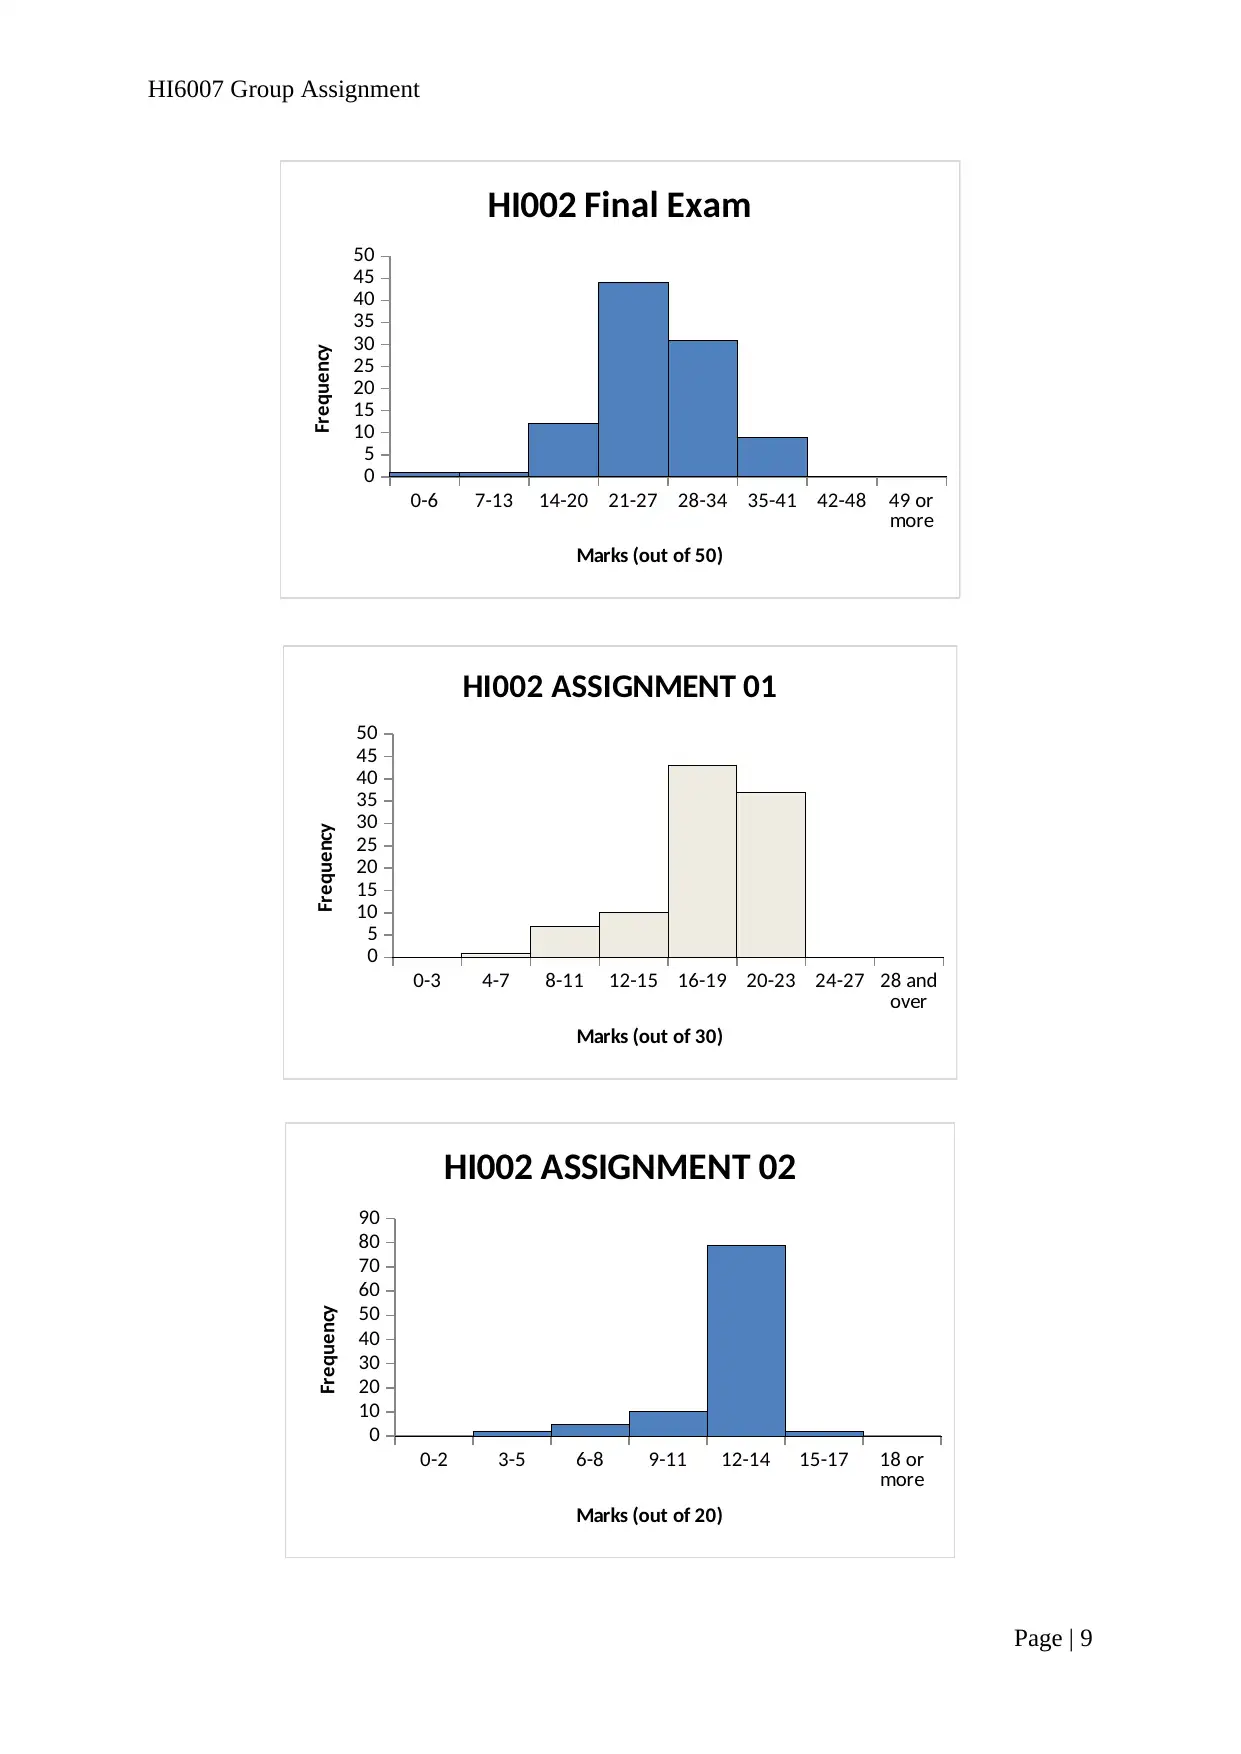
0-6 7-13 14-20 21-27 28-34 35-41 42-48 49 or
more
0
5
10
15
20
25
30
35
40
45
50
HI002 Final Exam
Marks (out of 50)
Frequency
0-3 4-7 8-11 12-15 16-19 20-23 24-27 28 and
over
0
5
10
15
20
25
30
35
40
45
50
HI002 ASSIGNMENT 01
Marks (out of 30)
Frequency
0-2 3-5 6-8 9-11 12-14 15-17 18 or
more
0
10
20
30
40
50
60
70
80
90
HI002 ASSIGNMENT 02
Marks (out of 20)
Frequency
Page | 9
Paraphrase This Document
Need a fresh take? Get an instant paraphrase of this document with our AI Paraphraser
HI6007 Group Assignment
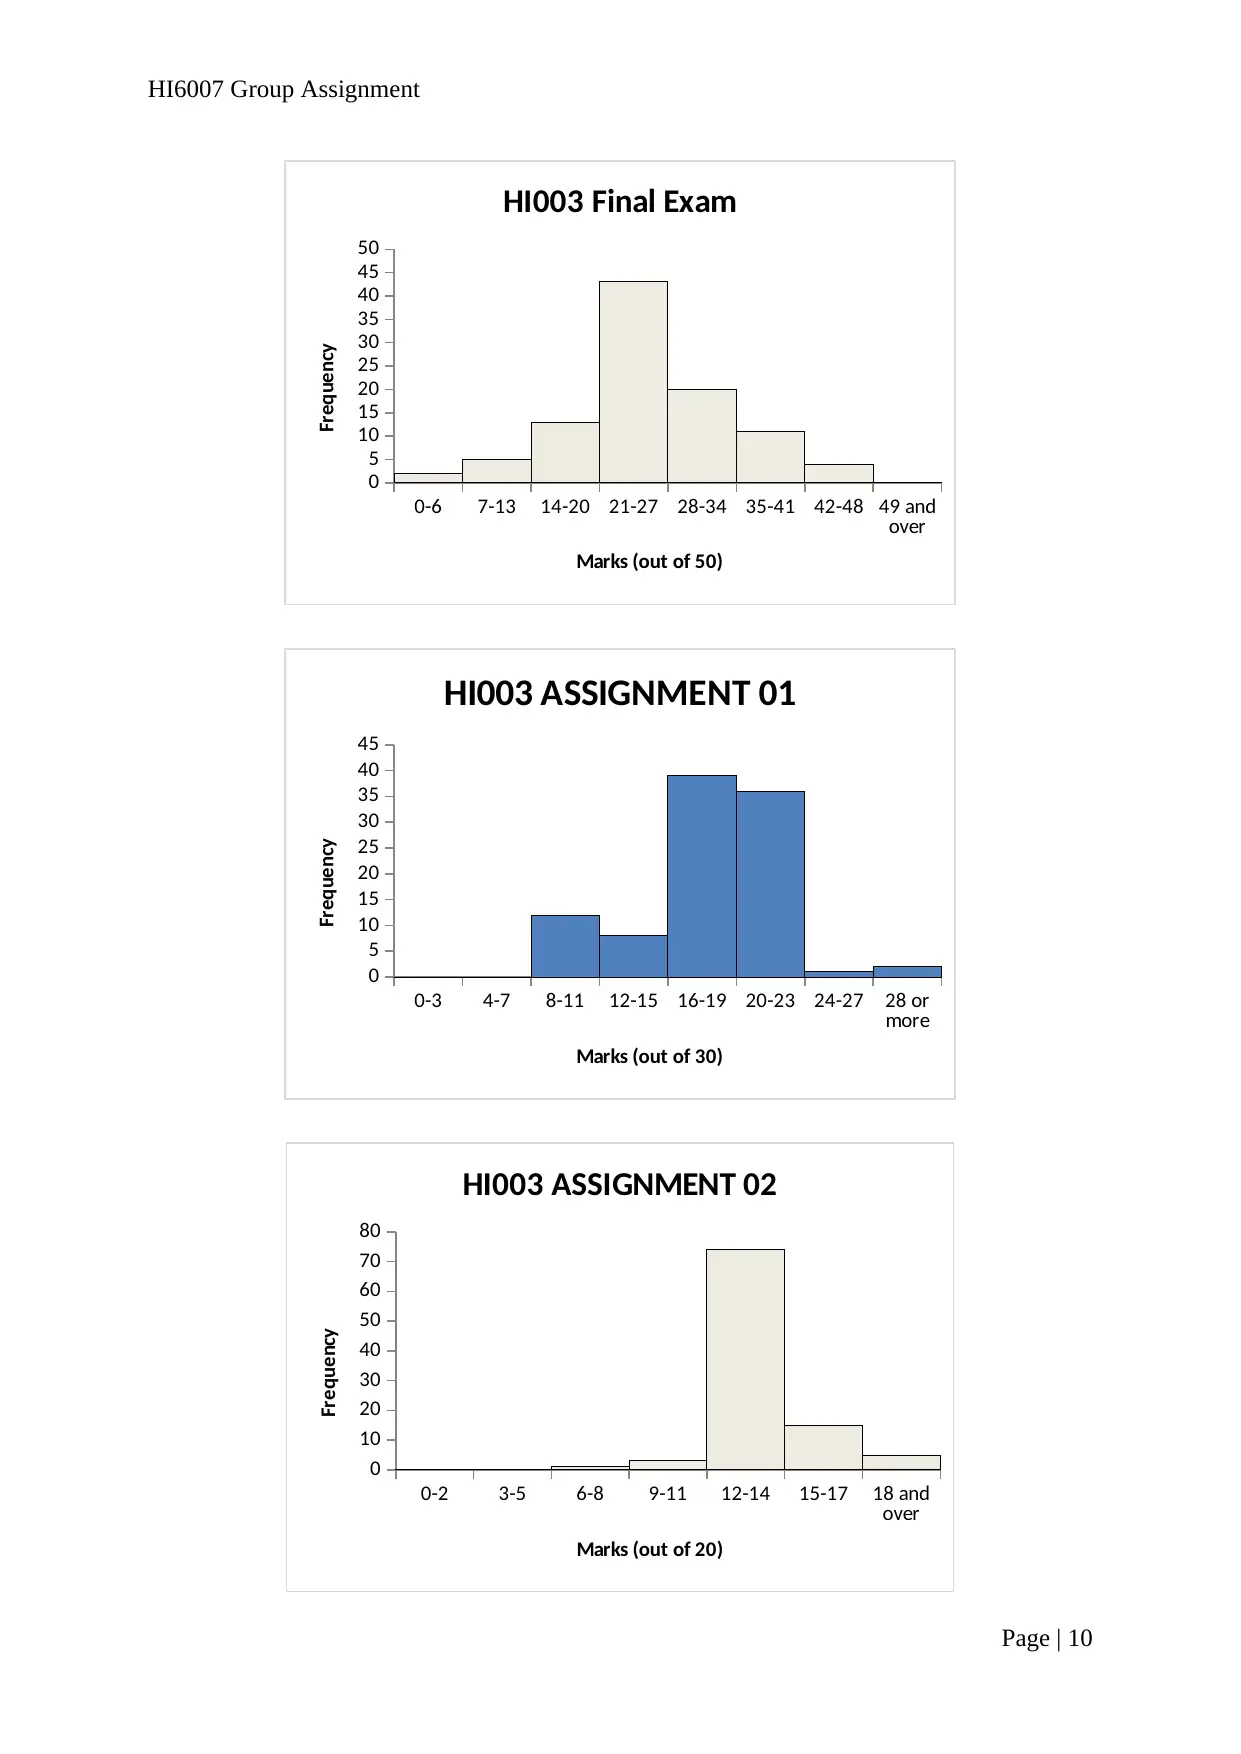
0-6 7-13 14-20 21-27 28-34 35-41 42-48 49 and
over
0
5
10
15
20
25
30
35
40
45
50
HI003 Final Exam
Marks (out of 50)
Frequency
0-3 4-7 8-11 12-15 16-19 20-23 24-27 28 or
more
0
5
10
15
20
25
30
35
40
45
HI003 ASSIGNMENT 01
Marks (out of 30)
Frequency
0-2 3-5 6-8 9-11 12-14 15-17 18 and
over
0
10
20
30
40
50
60
70
80
HI003 ASSIGNMENT 02
Marks (out of 20)
Frequency
Page | 10
HI6007 Group Assignment
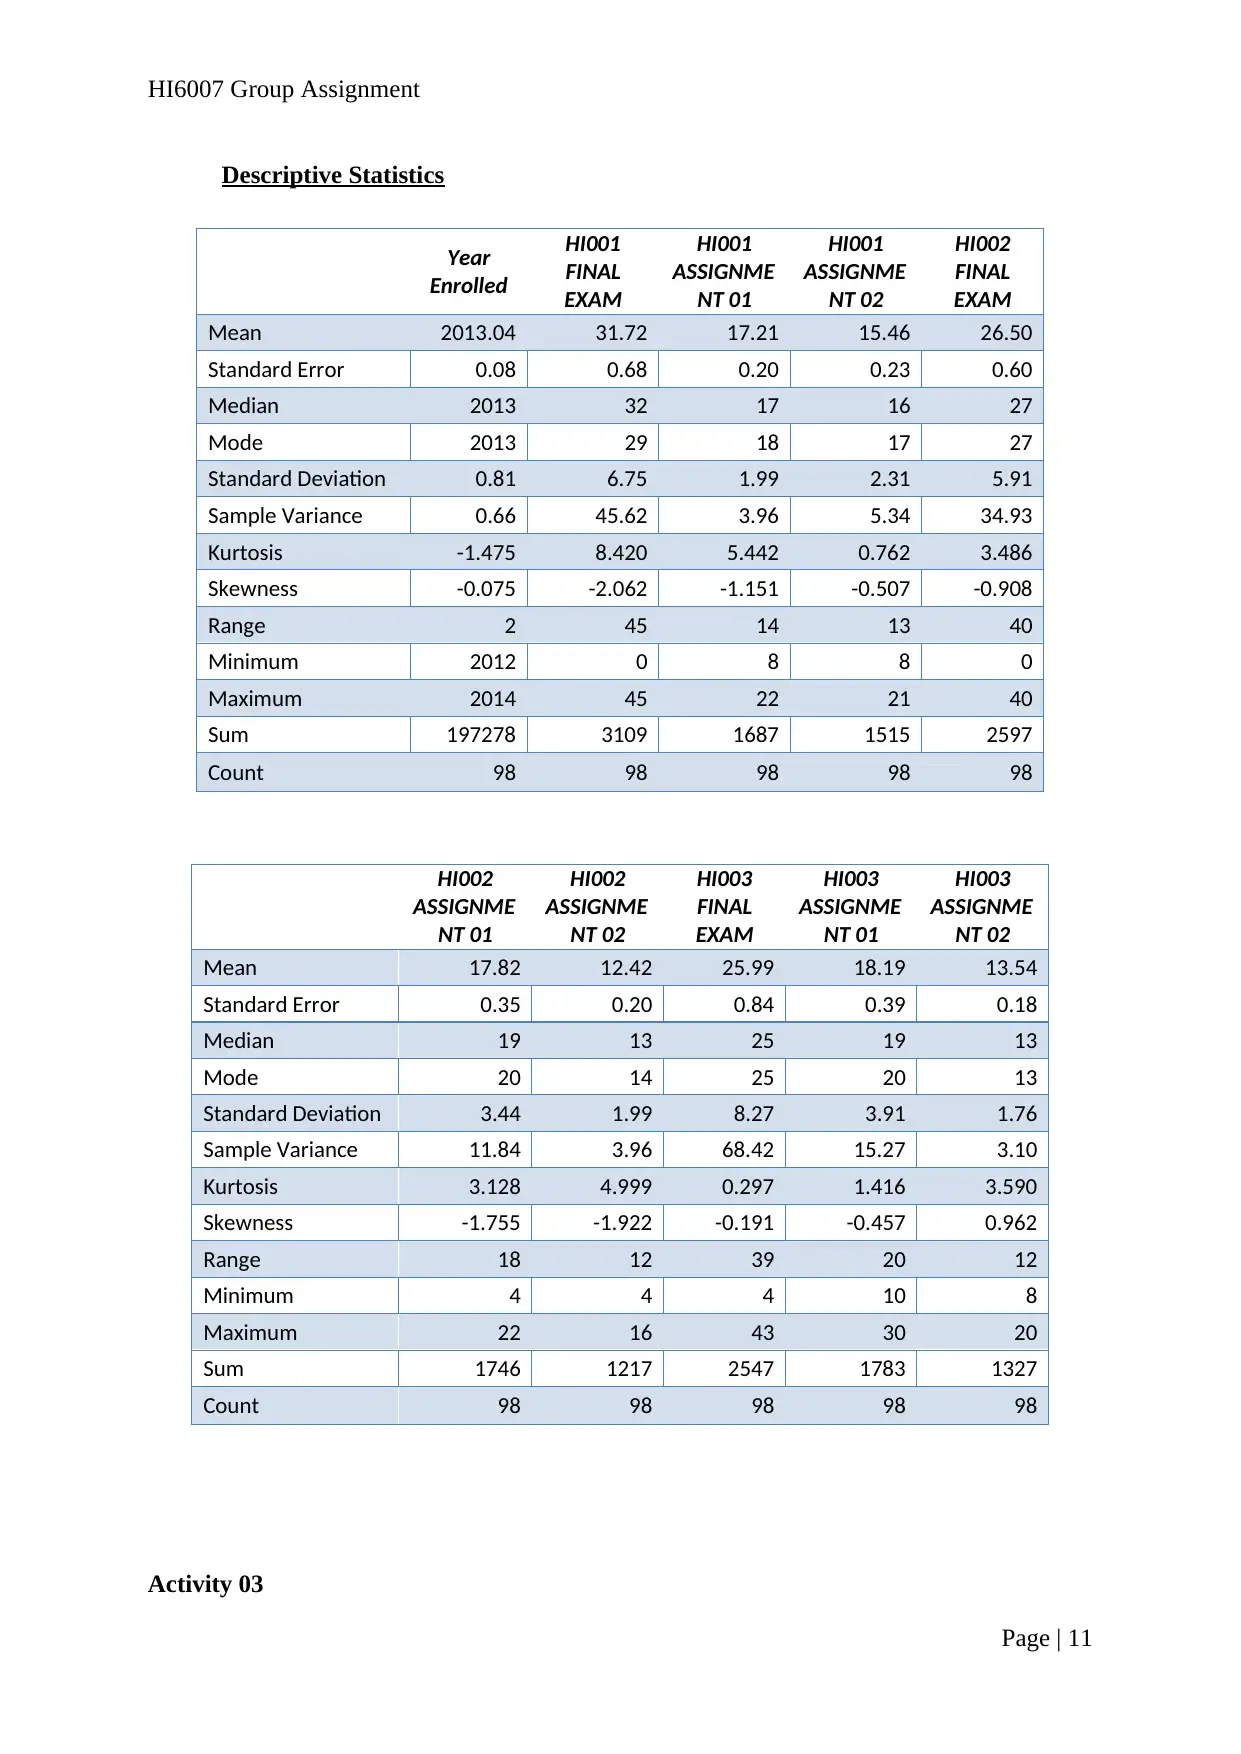
Descriptive Statistics
Year
Enrolled
HI001
FINAL
EXAM
HI001
ASSIGNME
NT 01
HI001
ASSIGNME
NT 02
HI002
FINAL
EXAM
Mean 2013.04 31.72 17.21 15.46 26.50
Standard Error 0.08 0.68 0.20 0.23 0.60
Median 2013 32 17 16 27
Mode 2013 29 18 17 27
Standard Deviation 0.81 6.75 1.99 2.31 5.91
Sample Variance 0.66 45.62 3.96 5.34 34.93
Kurtosis -1.475 8.420 5.442 0.762 3.486
Skewness -0.075 -2.062 -1.151 -0.507 -0.908
Range 2 45 14 13 40
Minimum 2012 0 8 8 0
Maximum 2014 45 22 21 40
Sum 197278 3109 1687 1515 2597
Count 98 98 98 98 98
HI002
ASSIGNME
NT 01
HI002
ASSIGNME
NT 02
HI003
FINAL
EXAM
HI003
ASSIGNME
NT 01
HI003
ASSIGNME
NT 02
Mean 17.82 12.42 25.99 18.19 13.54
Standard Error 0.35 0.20 0.84 0.39 0.18
Median 19 13 25 19 13
Mode 20 14 25 20 13
Standard Deviation 3.44 1.99 8.27 3.91 1.76
Sample Variance 11.84 3.96 68.42 15.27 3.10
Kurtosis 3.128 4.999 0.297 1.416 3.590
Skewness -1.755 -1.922 -0.191 -0.457 0.962
Range 18 12 39 20 12
Minimum 4 4 4 10 8
Maximum 22 16 43 30 20
Sum 1746 1217 2547 1783 1327
Count 98 98 98 98 98
Activity 03
Page | 11
⊘ This is a preview!⊘
Do you want full access?
Subscribe today to unlock all pages.
Trusted by 1+ million students worldwide
1 out of 17
Related Documents


Your All-in-One AI-Powered Toolkit for Academic Success.
+13062052269
info@desklib.com
Available 24*7 on WhatsApp / Email
![[object Object]](/_next/static/media/star-bottom.7253800d.svg)
Unlock your academic potential
Copyright © 2020–2026 A2Z Services. All Rights Reserved. Developed and managed by ZUCOL.