Holmes Institute HA1011 Applied Quantitative Methods Group Assignment
VerifiedAdded on 2023/03/31
|11
|2762
|211
Homework Assignment
AI Summary
This document provides a comprehensive solution to a group assignment for the HA1011 Applied Quantitative Methods course at Holmes Institute. The assignment covers a range of statistical concepts and techniques, including constructing frequency distributions, calculating descriptive statistics (mean, median, mode, standard deviation, IQR), analyzing correlation and regression, determining probabilities using Bayes' Rule and understanding the relationship between variables. The solution includes detailed calculations, interpretations, and explanations for each question, providing a valuable resource for students studying quantitative methods and business research. The assignment also explores real-world business scenarios, such as analyzing passenger numbers at train stations, examining the relationship between student attendance and chocolate bar sales, and evaluating product launch probabilities. This document offers a thorough understanding of the course material and provides a great study resource.

HOLMES INSTITUTE
FACULTY OF
HIGHER EDUCATION
Trimester T1 2019
Unit Code HA1011
Unit Title Applied Quantitative Methods
Assessment Type Assessment 2
Assessment Title Group Assignment
FACULTY OF
HIGHER EDUCATION
Trimester T1 2019
Unit Code HA1011
Unit Title Applied Quantitative Methods
Assessment Type Assessment 2
Assessment Title Group Assignment
Paraphrase This Document
Need a fresh take? Get an instant paraphrase of this document with our AI Paraphraser
Page 2 of 11
Attempt all the questions (8x2.5 = 20 Marks)
Question 1 of 8
HINT: We cover this in Lecture 1 (Summary Statistics and Graphs)
Data were collected on the number of passengers at each train station in Melbourne. The numbers
for the weekday peak time, 7am to 9:29am, are given below.
456 1189 410 318 648 2300 382 248 379 1240 2048 272
267 1134 733 262 682 906 338 1750 530 1584 3045 323
1311 1536 1606 982 878 169 583 548 429 658 344 2450
538 494 1946 268 435 862 866 579 1348 1022 1618 1021
401 1181 1178 637 2745 1000 2900 962 697 401 1442 1115
Tasks:
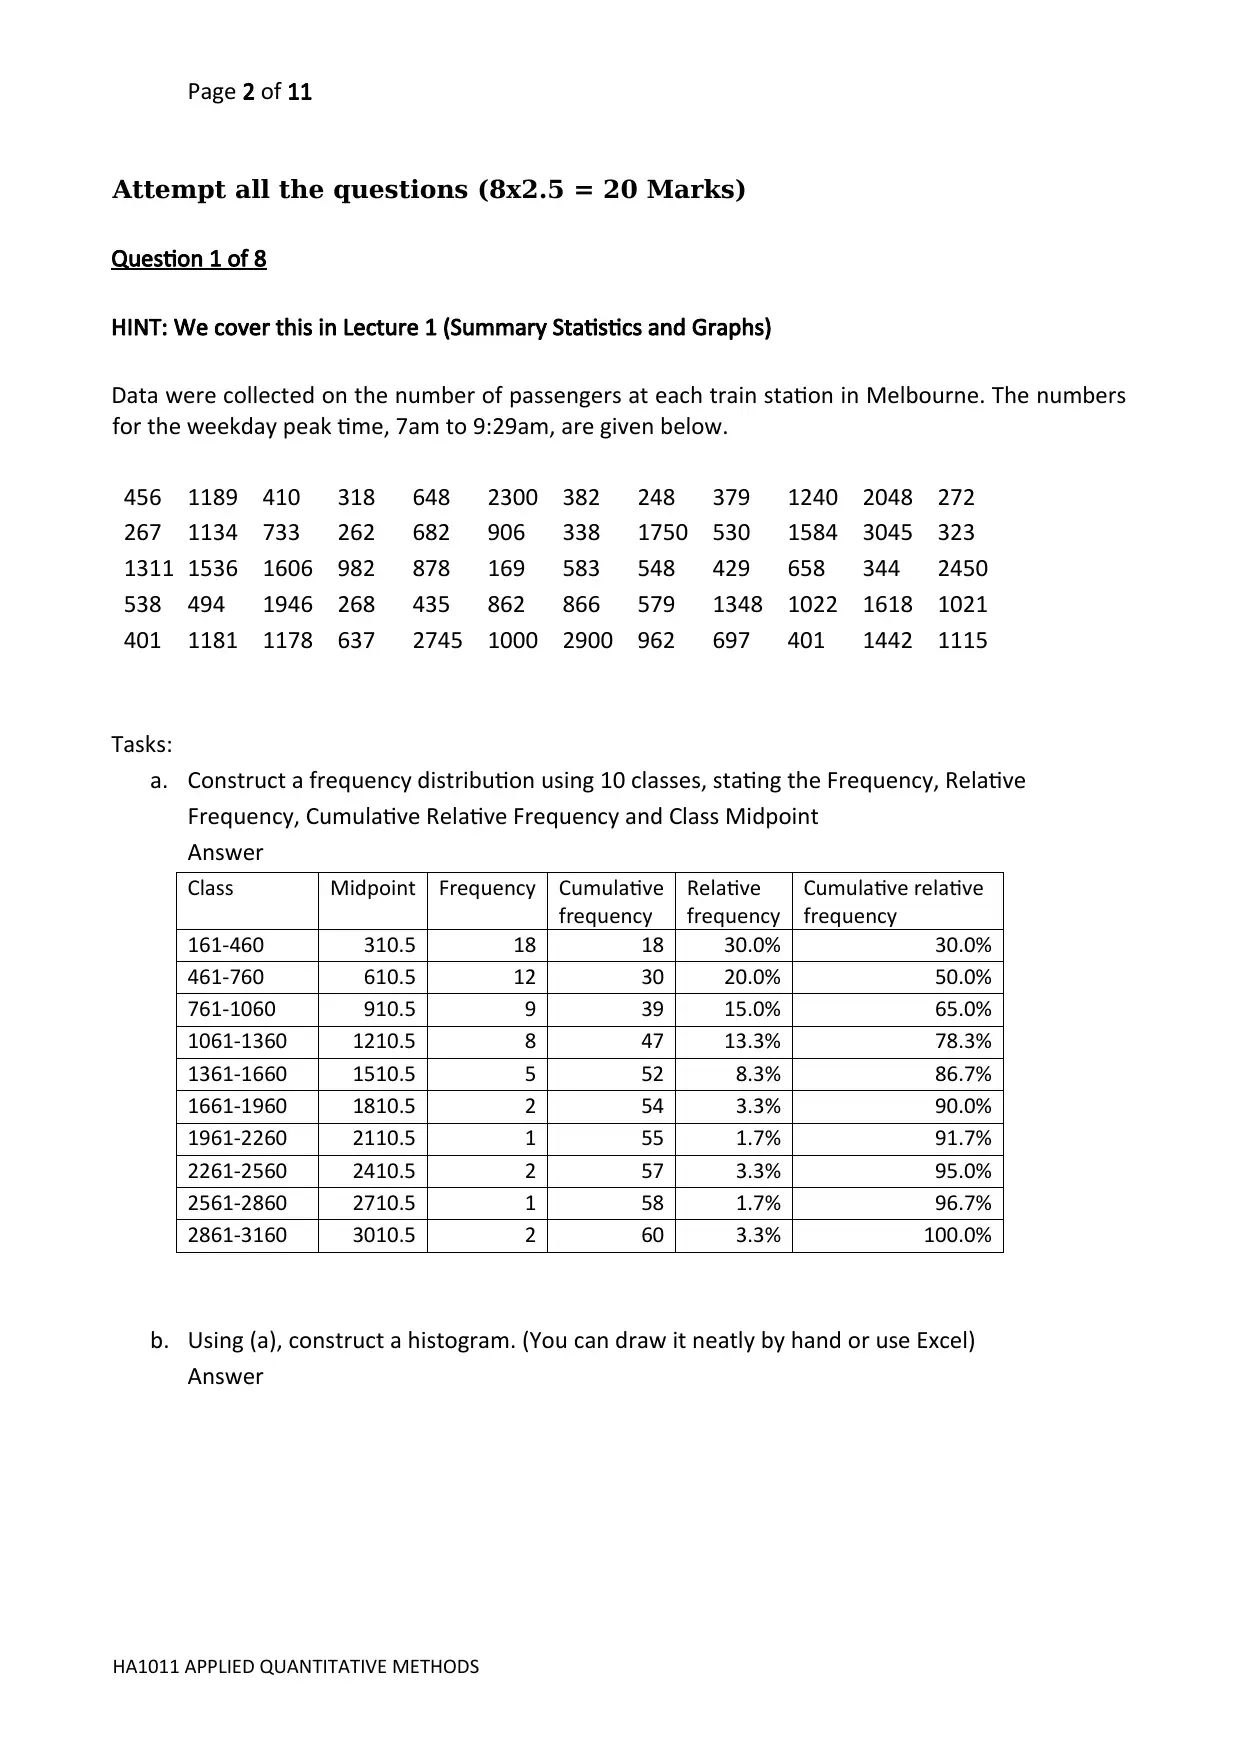
a. Construct a frequency distribution using 10 classes, stating the Frequency, Relative
Frequency, Cumulative Relative Frequency and Class Midpoint
Answer
Class Midpoint Frequency Cumulative
frequency
Relative
frequency
Cumulative relative
frequency
161-460 310.5 18 18 30.0% 30.0%
461-760 610.5 12 30 20.0% 50.0%
761-1060 910.5 9 39 15.0% 65.0%
1061-1360 1210.5 8 47 13.3% 78.3%
1361-1660 1510.5 5 52 8.3% 86.7%
1661-1960 1810.5 2 54 3.3% 90.0%
1961-2260 2110.5 1 55 1.7% 91.7%
2261-2560 2410.5 2 57 3.3% 95.0%
2561-2860 2710.5 1 58 1.7% 96.7%
2861-3160 3010.5 2 60 3.3% 100.0%
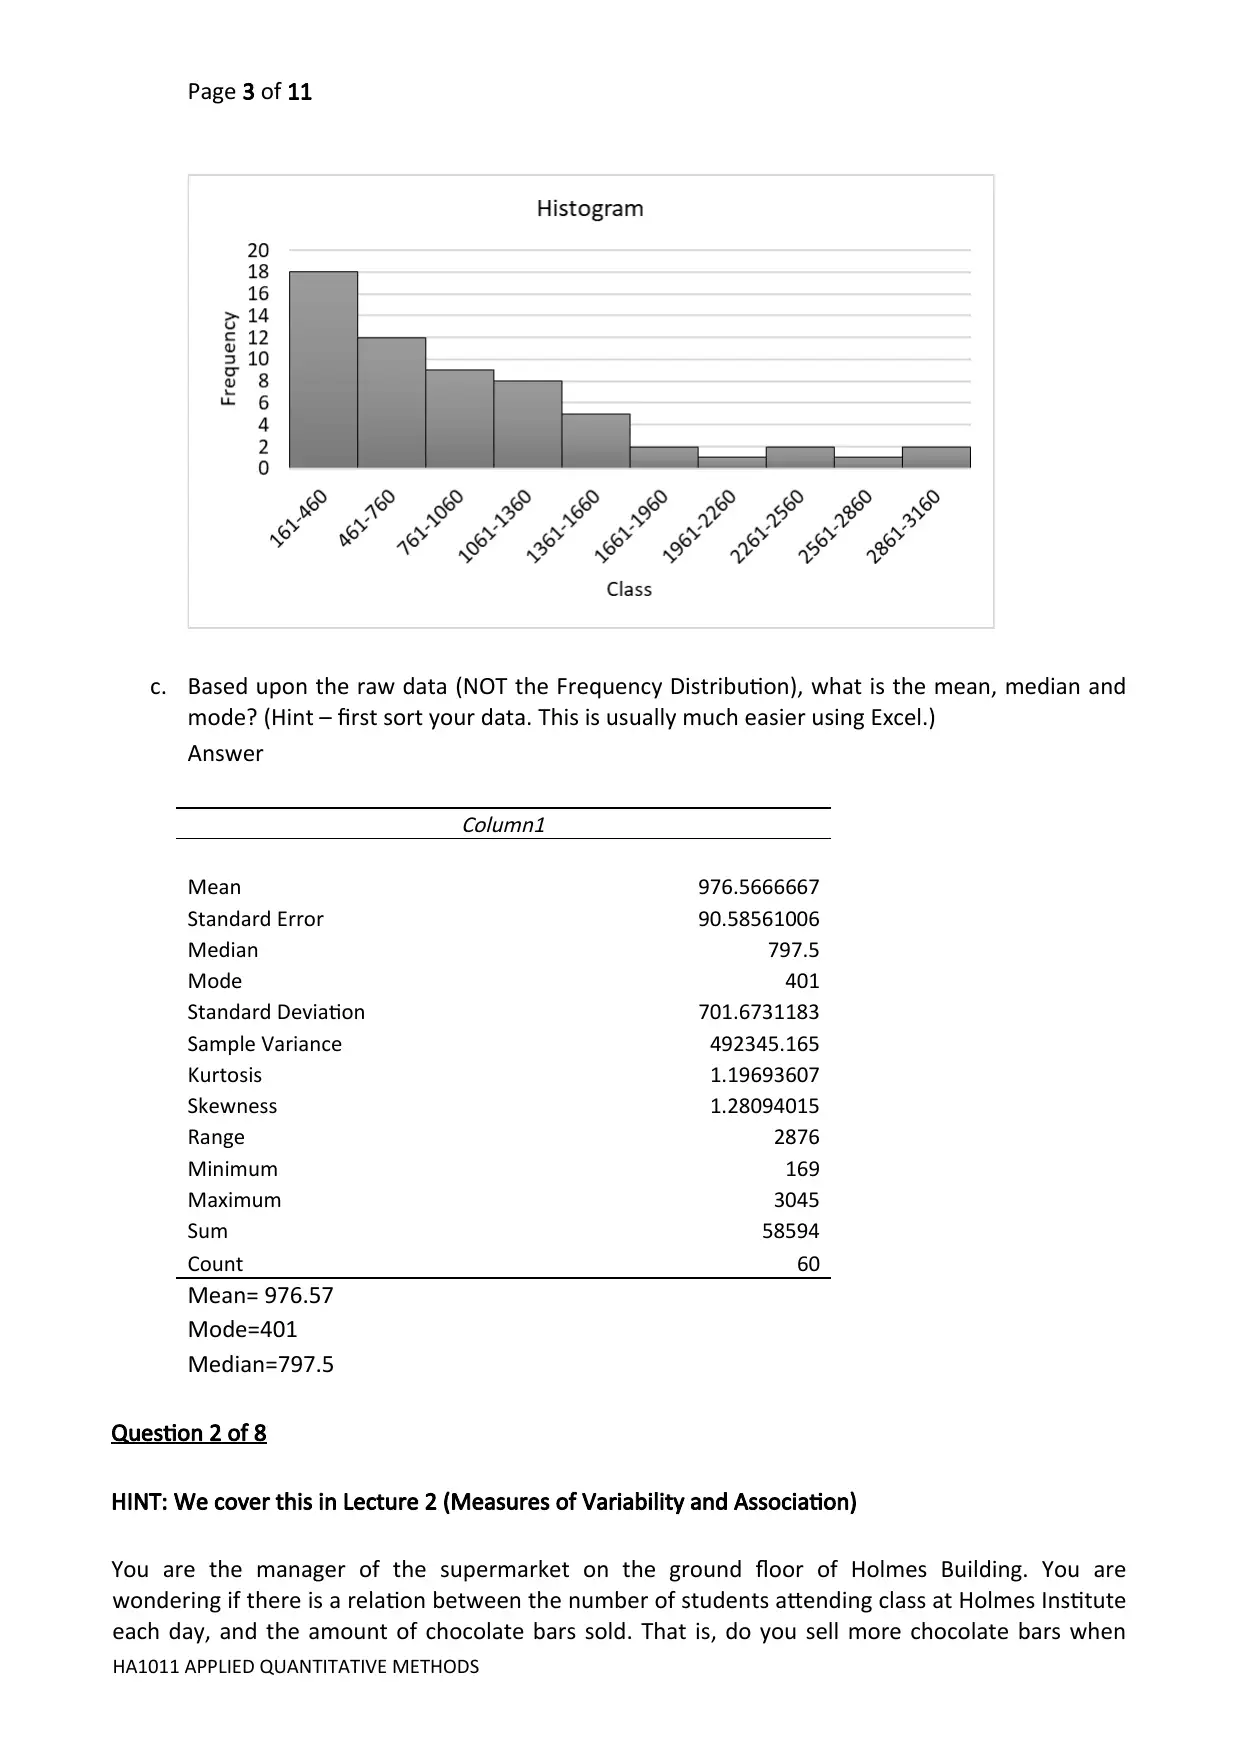
b. Using (a), construct a histogram. (You can draw it neatly by hand or use Excel)
Answer
HA1011 APPLIED QUANTITATIVE METHODS
Attempt all the questions (8x2.5 = 20 Marks)
Question 1 of 8
HINT: We cover this in Lecture 1 (Summary Statistics and Graphs)
Data were collected on the number of passengers at each train station in Melbourne. The numbers
for the weekday peak time, 7am to 9:29am, are given below.
456 1189 410 318 648 2300 382 248 379 1240 2048 272
267 1134 733 262 682 906 338 1750 530 1584 3045 323
1311 1536 1606 982 878 169 583 548 429 658 344 2450
538 494 1946 268 435 862 866 579 1348 1022 1618 1021
401 1181 1178 637 2745 1000 2900 962 697 401 1442 1115
Tasks:
a. Construct a frequency distribution using 10 classes, stating the Frequency, Relative
Frequency, Cumulative Relative Frequency and Class Midpoint
Answer
Class Midpoint Frequency Cumulative
frequency
Relative
frequency
Cumulative relative
frequency
161-460 310.5 18 18 30.0% 30.0%
461-760 610.5 12 30 20.0% 50.0%
761-1060 910.5 9 39 15.0% 65.0%
1061-1360 1210.5 8 47 13.3% 78.3%
1361-1660 1510.5 5 52 8.3% 86.7%
1661-1960 1810.5 2 54 3.3% 90.0%
1961-2260 2110.5 1 55 1.7% 91.7%
2261-2560 2410.5 2 57 3.3% 95.0%
2561-2860 2710.5 1 58 1.7% 96.7%
2861-3160 3010.5 2 60 3.3% 100.0%
b. Using (a), construct a histogram. (You can draw it neatly by hand or use Excel)
Answer
HA1011 APPLIED QUANTITATIVE METHODS
Page 3 of 11
c. Based upon the raw data (NOT the Frequency Distribution), what is the mean, median and
mode? (Hint – first sort your data. This is usually much easier using Excel.)
Answer
Column1
Mean 976.5666667
Standard Error 90.58561006
Median 797.5
Mode 401
Standard Deviation 701.6731183
Sample Variance 492345.165
Kurtosis 1.19693607
Skewness 1.28094015
Range 2876
Minimum 169
Maximum 3045
Sum 58594
Count 60
Mean= 976.57
Mode=401
Median=797.5
Question 2 of 8
HINT: We cover this in Lecture 2 (Measures of Variability and Association)
You are the manager of the supermarket on the ground floor of Holmes Building. You are
wondering if there is a relation between the number of students attending class at Holmes Institute
each day, and the amount of chocolate bars sold. That is, do you sell more chocolate bars when
HA1011 APPLIED QUANTITATIVE METHODS
⊘ This is a preview!⊘
Do you want full access?
Subscribe today to unlock all pages.
Trusted by 1+ million students worldwide
Page 4 of 11
there are a lot of Holmes students around, and less when Holmes is quiet? If there is a relationship,
you might want to keep less chocolate bars in stock when Holmes is closed over the upcoming
holiday. With the help of the campus manager, you have compiled the following list covering 7
weeks:
Weekly attendance Number of chocolate bars sold
472 6 916
413 5 884
503 7 223
612 8 158
399 6 014
538 7 209
455 6 214
Tasks:
a. Is above a population or a sample? Explain the difference.
This is a sample since it contains not all the elements. A population contains the entire
elements
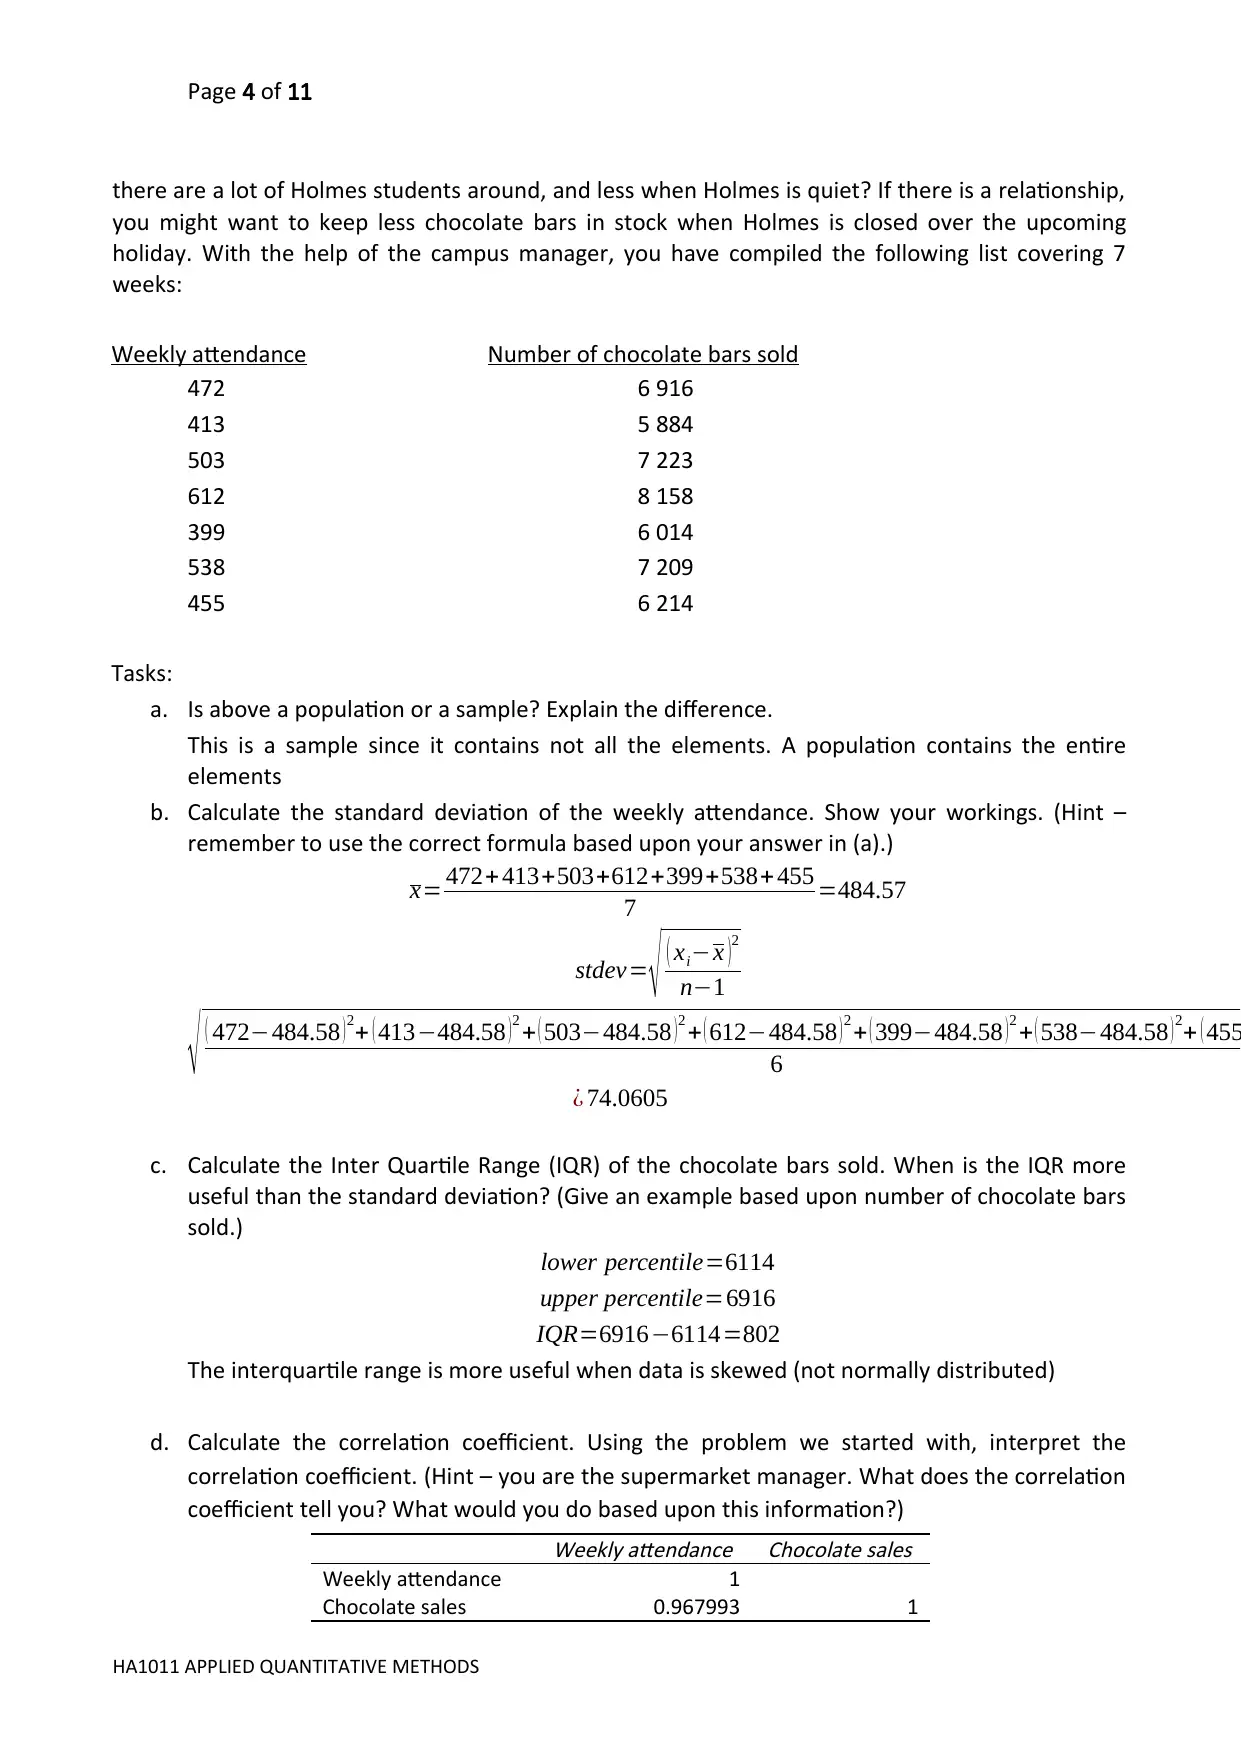
b. Calculate the standard deviation of the weekly attendance. Show your workings. (Hint –
remember to use the correct formula based upon your answer in (a).)
x= 472+ 413+503+612+399+538+ 455
7 =484.57
stdev= √ ( xi−x )2
n−1
√ ( 472−484.58 )2+ ( 413−484.58 )2 + ( 503−484.58 )2 + ( 612−484.58 )2 + ( 399−484.58 )2 + ( 538−484.58 )2+ ( 455
6
¿ 74.0605
c. Calculate the Inter Quartile Range (IQR) of the chocolate bars sold. When is the IQR more
useful than the standard deviation? (Give an example based upon number of chocolate bars
sold.)
lower percentile=6114
upper percentile=6916
IQR=6916−6114=802
The interquartile range is more useful when data is skewed (not normally distributed)
d. Calculate the correlation coefficient. Using the problem we started with, interpret the
correlation coefficient. (Hint – you are the supermarket manager. What does the correlation
coefficient tell you? What would you do based upon this information?)
Weekly attendance Chocolate sales
Weekly attendance 1
Chocolate sales 0.967993 1
HA1011 APPLIED QUANTITATIVE METHODS
there are a lot of Holmes students around, and less when Holmes is quiet? If there is a relationship,
you might want to keep less chocolate bars in stock when Holmes is closed over the upcoming
holiday. With the help of the campus manager, you have compiled the following list covering 7
weeks:
Weekly attendance Number of chocolate bars sold
472 6 916
413 5 884
503 7 223
612 8 158
399 6 014
538 7 209
455 6 214
Tasks:
a. Is above a population or a sample? Explain the difference.
This is a sample since it contains not all the elements. A population contains the entire
elements
b. Calculate the standard deviation of the weekly attendance. Show your workings. (Hint –
remember to use the correct formula based upon your answer in (a).)
x= 472+ 413+503+612+399+538+ 455
7 =484.57
stdev= √ ( xi−x )2
n−1
√ ( 472−484.58 )2+ ( 413−484.58 )2 + ( 503−484.58 )2 + ( 612−484.58 )2 + ( 399−484.58 )2 + ( 538−484.58 )2+ ( 455
6
¿ 74.0605
c. Calculate the Inter Quartile Range (IQR) of the chocolate bars sold. When is the IQR more
useful than the standard deviation? (Give an example based upon number of chocolate bars
sold.)
lower percentile=6114
upper percentile=6916
IQR=6916−6114=802
The interquartile range is more useful when data is skewed (not normally distributed)
d. Calculate the correlation coefficient. Using the problem we started with, interpret the
correlation coefficient. (Hint – you are the supermarket manager. What does the correlation
coefficient tell you? What would you do based upon this information?)
Weekly attendance Chocolate sales
Weekly attendance 1
Chocolate sales 0.967993 1
HA1011 APPLIED QUANTITATIVE METHODS
Paraphrase This Document
Need a fresh take? Get an instant paraphrase of this document with our AI Paraphraser
Page 5 of 11
From the table above, we can see that the Pearson correlation coefficient is given as 0.968; this
indicates a very strong positive relationship between number of sales and number of students. It
further shows that an increase in the number of students results in an increase in the number of
chocolate sales.
Question 3 of 8
HINT: We cover this in Lecture 3 (Linear Regression)
(We are using the same data set we used in Question 2)
You are the manager of the supermarket on the ground floor of Holmes Building. You are
wondering if there is a relation between the number of students attending class at Holmes Institute
each day, and the amount of chocolate bars sold. That is, do you sell more chocolate bars when
there are a lot of Holmes students around, and less when Holmes is quiet? If there is a relationship,
you might want to keep less chocolate bars in stock when Holmes is closed over the upcoming
holiday. With the help of the campus manager, you have compiled the following list covering 7
weeks:
Weekly attendance Number of chocolate bars sold
472 6916
413 5884
503 7223
612 8158
399 6014
538 7209
455 6214
Tasks:
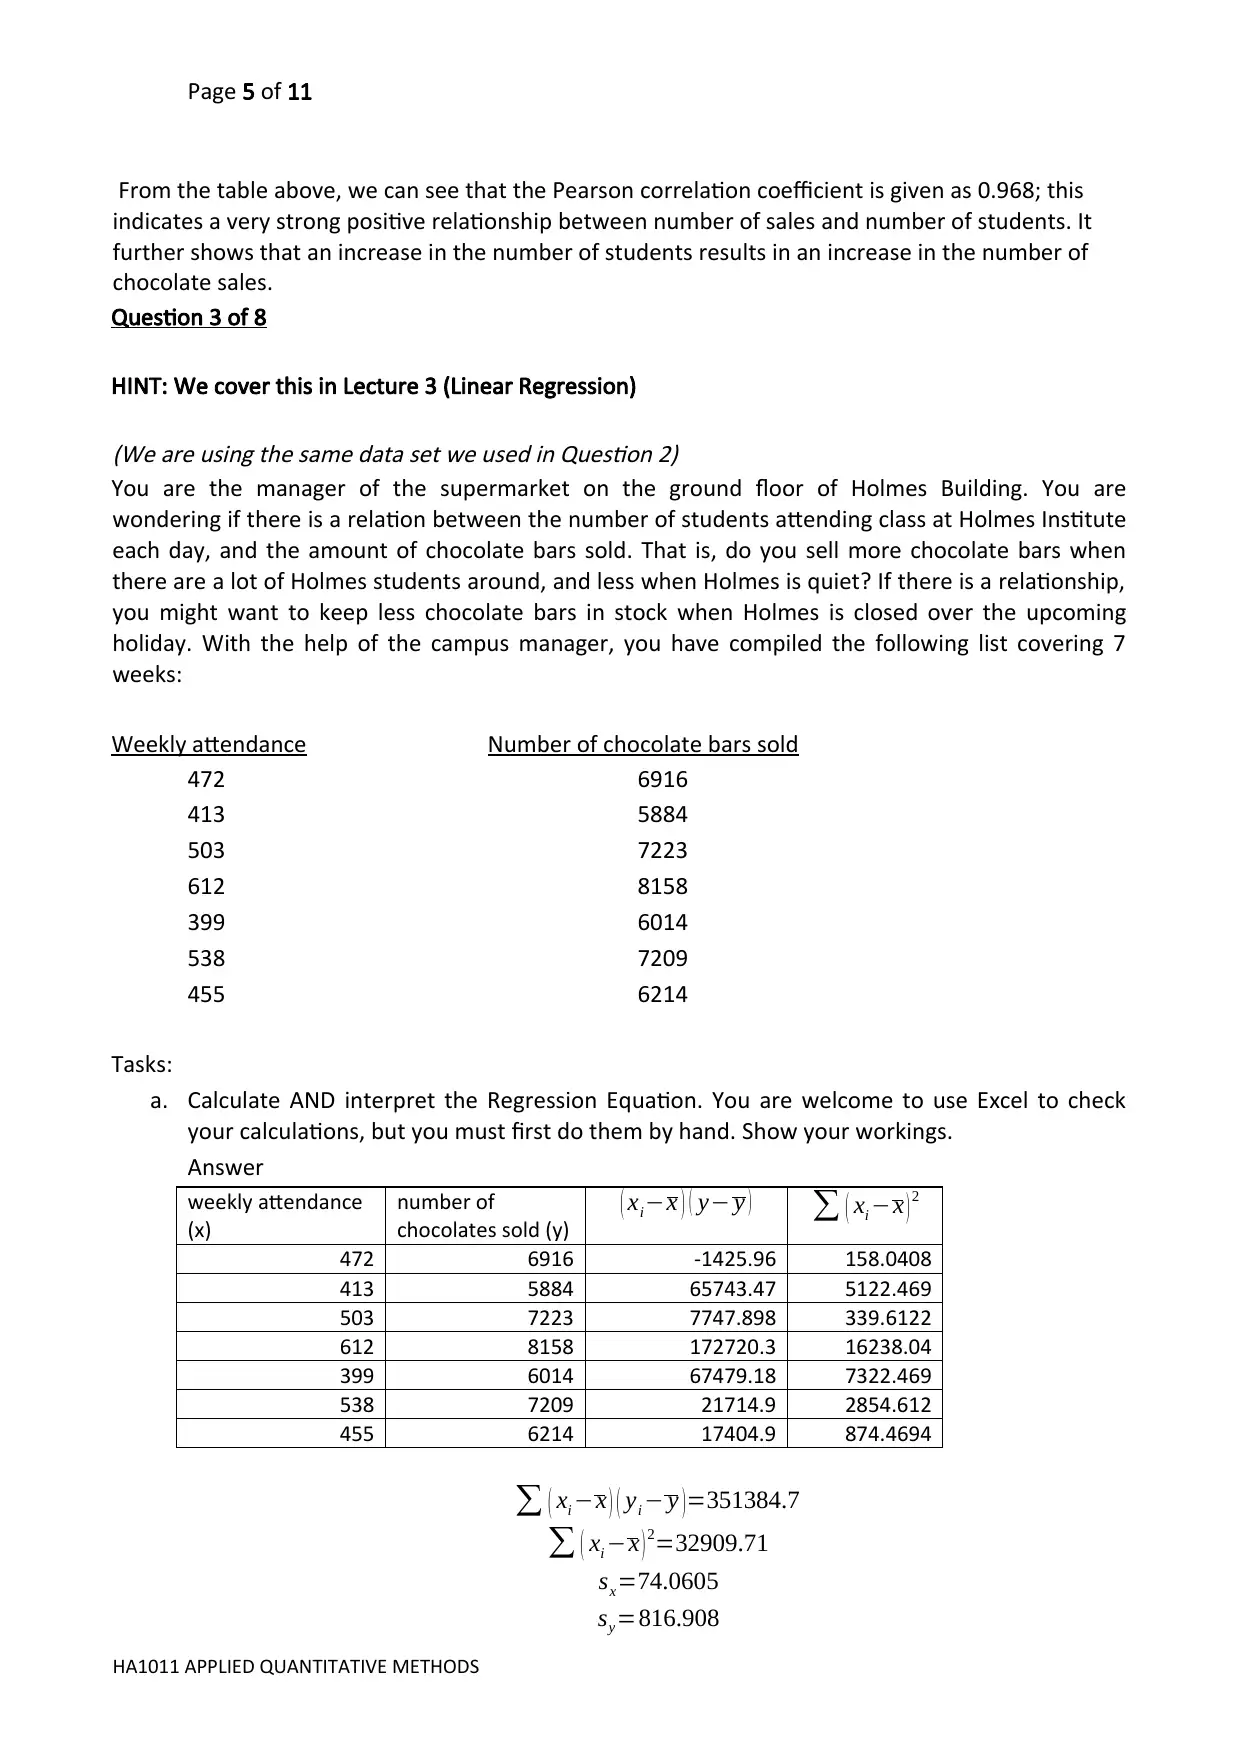
a. Calculate AND interpret the Regression Equation. You are welcome to use Excel to check
your calculations, but you must first do them by hand. Show your workings.
Answer
weekly attendance
(x)
number of
chocolates sold (y)
( xi−x ) ( y− y ) ∑ ( xi −x ) 2
472 6916 -1425.96 158.0408
413 5884 65743.47 5122.469
503 7223 7747.898 339.6122
612 8158 172720.3 16238.04
399 6014 67479.18 7322.469
538 7209 21714.9 2854.612
455 6214 17404.9 874.4694
∑ ( xi −x ) ( yi − y )=351384.7
∑ ( xi −x ) 2=32909.71
sx=74.0605
sy=816.908
HA1011 APPLIED QUANTITATIVE METHODS
From the table above, we can see that the Pearson correlation coefficient is given as 0.968; this
indicates a very strong positive relationship between number of sales and number of students. It
further shows that an increase in the number of students results in an increase in the number of
chocolate sales.
Question 3 of 8
HINT: We cover this in Lecture 3 (Linear Regression)
(We are using the same data set we used in Question 2)
You are the manager of the supermarket on the ground floor of Holmes Building. You are
wondering if there is a relation between the number of students attending class at Holmes Institute
each day, and the amount of chocolate bars sold. That is, do you sell more chocolate bars when
there are a lot of Holmes students around, and less when Holmes is quiet? If there is a relationship,
you might want to keep less chocolate bars in stock when Holmes is closed over the upcoming
holiday. With the help of the campus manager, you have compiled the following list covering 7
weeks:
Weekly attendance Number of chocolate bars sold
472 6916
413 5884
503 7223
612 8158
399 6014
538 7209
455 6214
Tasks:
a. Calculate AND interpret the Regression Equation. You are welcome to use Excel to check
your calculations, but you must first do them by hand. Show your workings.
Answer
weekly attendance
(x)
number of
chocolates sold (y)
( xi−x ) ( y− y ) ∑ ( xi −x ) 2
472 6916 -1425.96 158.0408
413 5884 65743.47 5122.469
503 7223 7747.898 339.6122
612 8158 172720.3 16238.04
399 6014 67479.18 7322.469
538 7209 21714.9 2854.612
455 6214 17404.9 874.4694
∑ ( xi −x ) ( yi − y )=351384.7
∑ ( xi −x ) 2=32909.71
sx=74.0605
sy=816.908
HA1011 APPLIED QUANTITATIVE METHODS
Page 6 of 11
r =∑ ( xi− x ) ( yi − y )
( n−1 ) sx s y
= 351384.7
(7−1 )∗74.0605∗816.908 =0.967992
b1=r∗sy
sx
= 0.967992∗816.908
74.0605 =10.6772
b0= y−b1 x
x=484.5714
y=6802.571
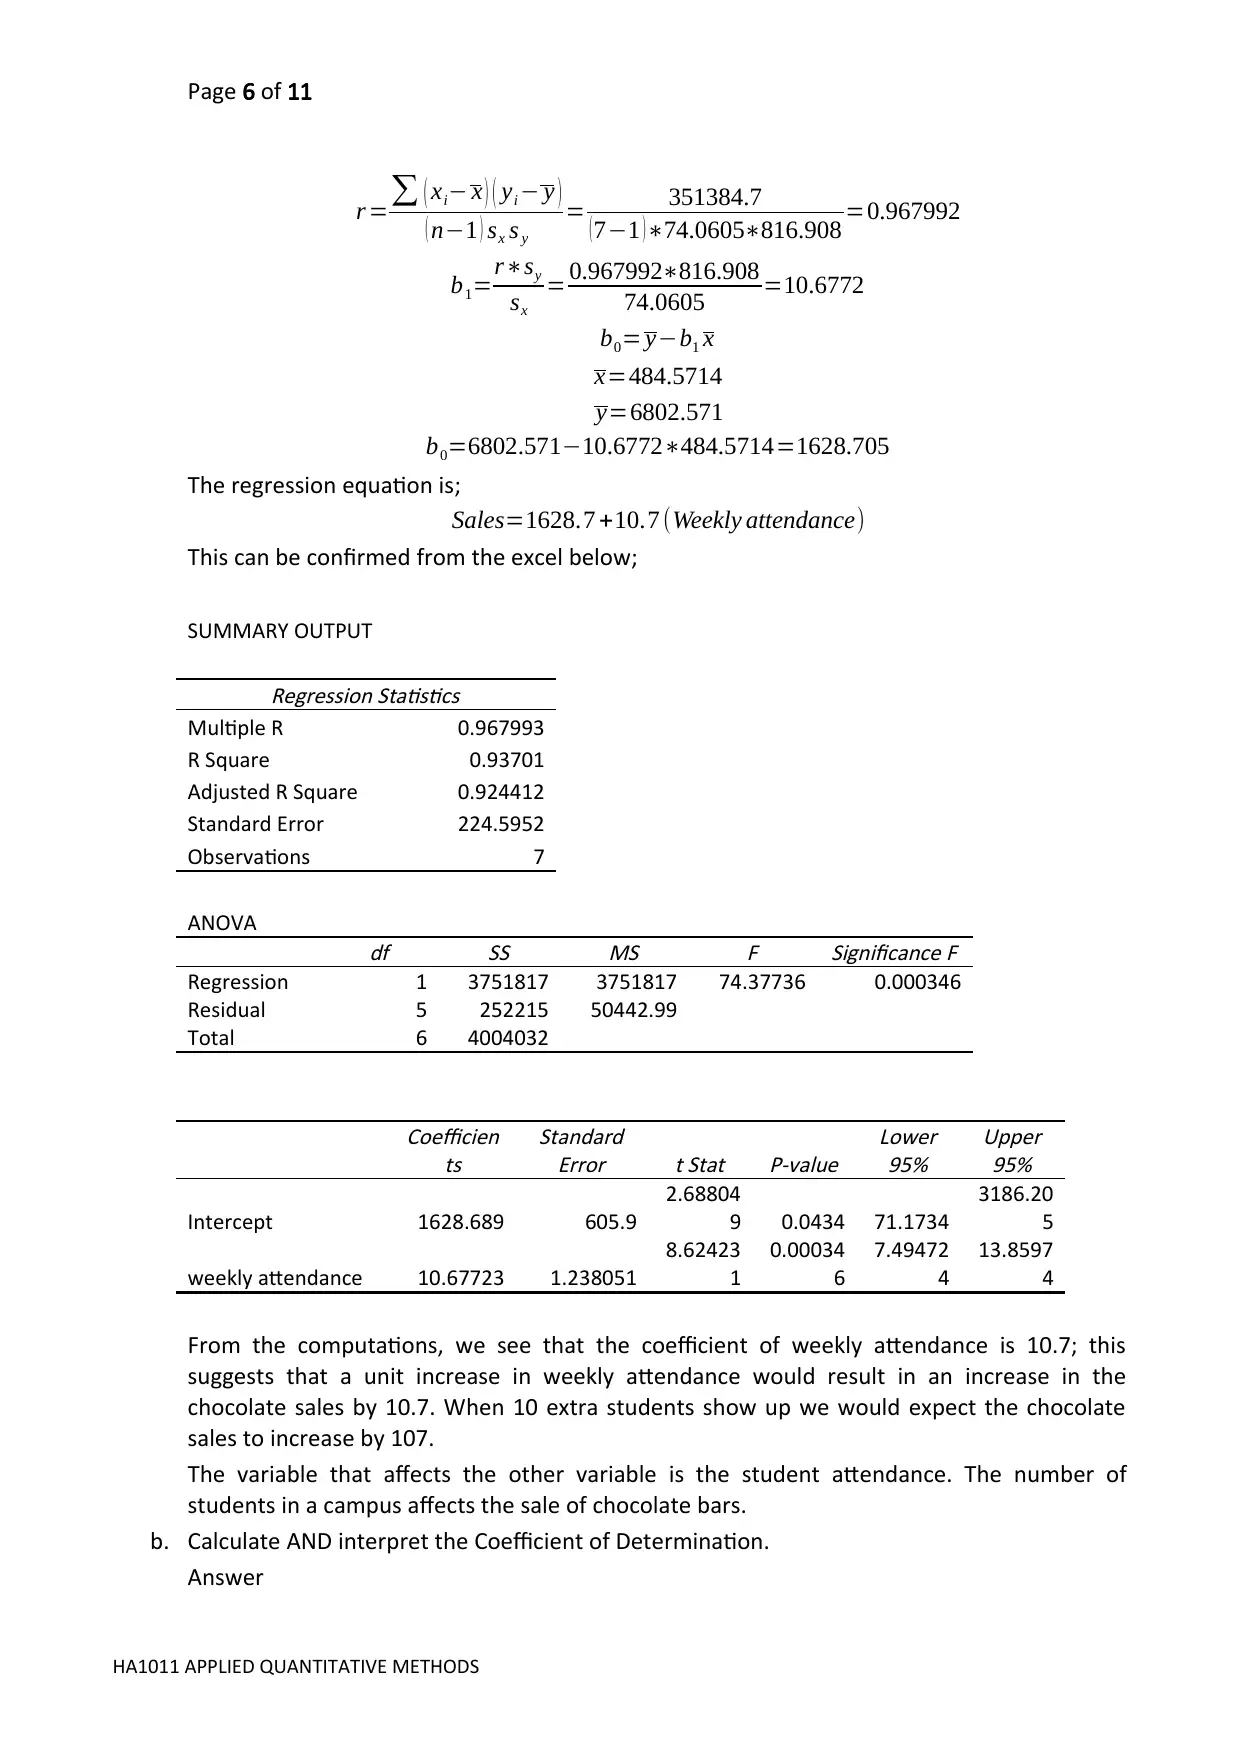
b0=6802.571−10.6772∗484.5714=1628.705
The regression equation is;
Sales=1628.7 +10.7 (Weekly attendance)
This can be confirmed from the excel below;
SUMMARY OUTPUTRegression Statistics
Multiple R 0.967993
R Square 0.93701
Adjusted R Square 0.924412
Standard Error 224.5952
Observations 7
ANOVA
df
SS
MS
F Significance F
Regression 1 3751817 3751817 74.37736 0.000346
Residual 5 252215 50442.99
Total 6 4004032Coefficien
ts
Standard
Error t Stat P-value
Lower
95%
Upper
95%
Intercept 1628.689 605.9
2.68804
9 0.0434 71.1734
3186.20
5
weekly attendance 10.67723 1.238051
8.62423
1
0.00034
6
7.49472
4
13.8597
4
From the computations, we see that the coefficient of weekly attendance is 10.7; this
suggests that a unit increase in weekly attendance would result in an increase in the
chocolate sales by 10.7. When 10 extra students show up we would expect the chocolate
sales to increase by 107.
The variable that affects the other variable is the student attendance. The number of
students in a campus affects the sale of chocolate bars.
b. Calculate AND interpret the Coefficient of Determination.
Answer
HA1011 APPLIED QUANTITATIVE METHODS
r =∑ ( xi− x ) ( yi − y )
( n−1 ) sx s y
= 351384.7
(7−1 )∗74.0605∗816.908 =0.967992
b1=r∗sy
sx
= 0.967992∗816.908
74.0605 =10.6772
b0= y−b1 x
x=484.5714
y=6802.571
b0=6802.571−10.6772∗484.5714=1628.705
The regression equation is;
Sales=1628.7 +10.7 (Weekly attendance)
This can be confirmed from the excel below;
SUMMARY OUTPUTRegression Statistics
Multiple R 0.967993
R Square 0.93701
Adjusted R Square 0.924412
Standard Error 224.5952
Observations 7
ANOVA
df
SS
MS
F Significance F
Regression 1 3751817 3751817 74.37736 0.000346
Residual 5 252215 50442.99
Total 6 4004032Coefficien
ts
Standard
Error t Stat P-value
Lower
95%
Upper
95%
Intercept 1628.689 605.9
2.68804
9 0.0434 71.1734
3186.20
5
weekly attendance 10.67723 1.238051
8.62423
1
0.00034
6
7.49472
4
13.8597
4
From the computations, we see that the coefficient of weekly attendance is 10.7; this
suggests that a unit increase in weekly attendance would result in an increase in the
chocolate sales by 10.7. When 10 extra students show up we would expect the chocolate
sales to increase by 107.
The variable that affects the other variable is the student attendance. The number of
students in a campus affects the sale of chocolate bars.
b. Calculate AND interpret the Coefficient of Determination.
Answer
HA1011 APPLIED QUANTITATIVE METHODS
⊘ This is a preview!⊘
Do you want full access?
Subscribe today to unlock all pages.
Trusted by 1+ million students worldwide
Page 7 of 11
r =∑ ( xi− x ) ( yi − y )
( n−1 ) sx s y
= 351384.7
(7−1 )∗74.0605∗816.908 =0.967992
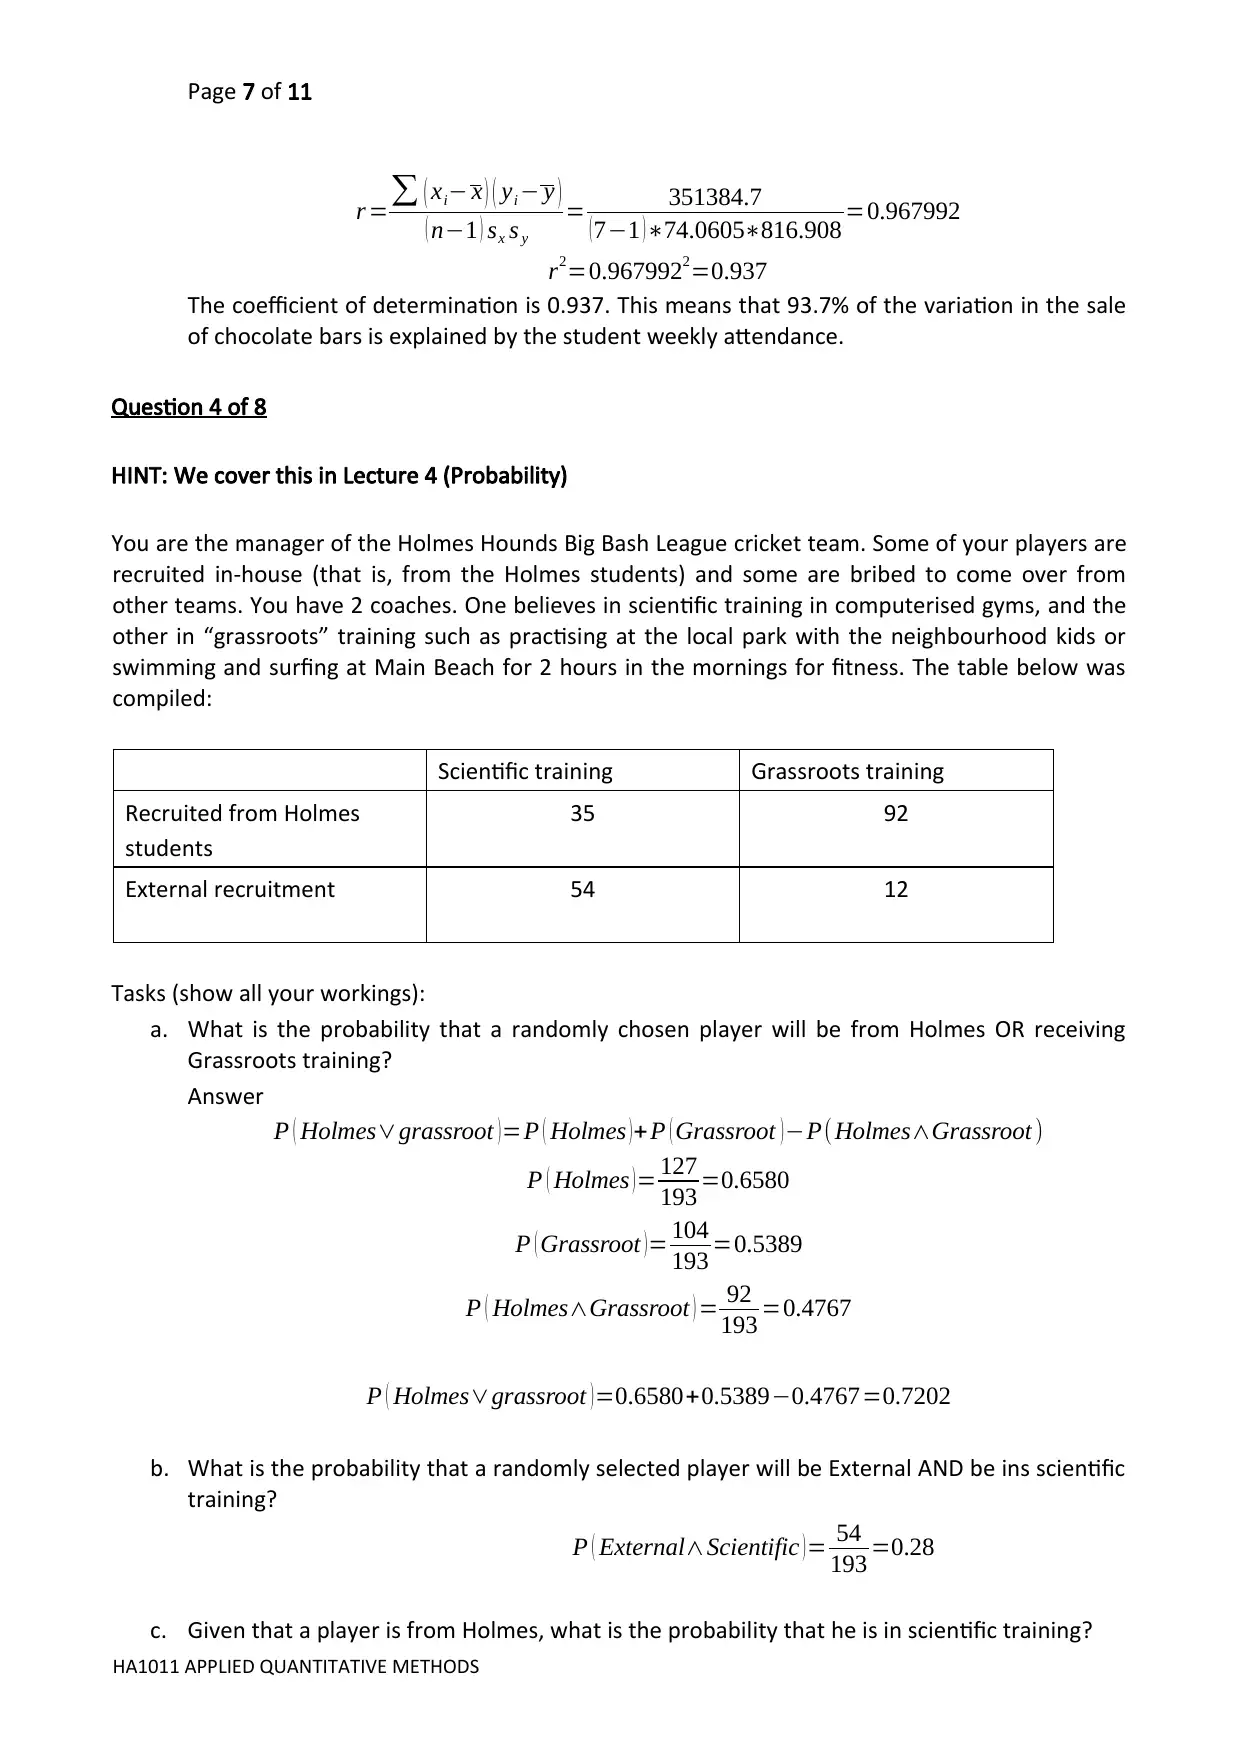
r2=0.9679922=0.937
The coefficient of determination is 0.937. This means that 93.7% of the variation in the sale
of chocolate bars is explained by the student weekly attendance.
Question 4 of 8
HINT: We cover this in Lecture 4 (Probability)
You are the manager of the Holmes Hounds Big Bash League cricket team. Some of your players are
recruited in-house (that is, from the Holmes students) and some are bribed to come over from
other teams. You have 2 coaches. One believes in scientific training in computerised gyms, and the
other in “grassroots” training such as practising at the local park with the neighbourhood kids or
swimming and surfing at Main Beach for 2 hours in the mornings for fitness. The table below was
compiled:
Scientific training Grassroots training
Recruited from Holmes
students
35 92
External recruitment 54 12
Tasks (show all your workings):
a. What is the probability that a randomly chosen player will be from Holmes OR receiving
Grassroots training?
Answer
P ( Holmes∨grassroot )=P ( Holmes )+ P ( Grassroot )−P(Holmes∧Grassroot )
P ( Holmes )= 127
193 =0.6580
P ( Grassroot )= 104
193 =0.5389
P ( Holmes∧Grassroot ) = 92
193 =0.4767
P ( Holmes∨grassroot )=0.6580+0.5389−0.4767=0.7202
b. What is the probability that a randomly selected player will be External AND be ins scientific
training?
P ( External∧Scientific ) = 54
193 =0.28
c. Given that a player is from Holmes, what is the probability that he is in scientific training?
HA1011 APPLIED QUANTITATIVE METHODS
r =∑ ( xi− x ) ( yi − y )
( n−1 ) sx s y
= 351384.7
(7−1 )∗74.0605∗816.908 =0.967992
r2=0.9679922=0.937
The coefficient of determination is 0.937. This means that 93.7% of the variation in the sale
of chocolate bars is explained by the student weekly attendance.
Question 4 of 8
HINT: We cover this in Lecture 4 (Probability)
You are the manager of the Holmes Hounds Big Bash League cricket team. Some of your players are
recruited in-house (that is, from the Holmes students) and some are bribed to come over from
other teams. You have 2 coaches. One believes in scientific training in computerised gyms, and the
other in “grassroots” training such as practising at the local park with the neighbourhood kids or
swimming and surfing at Main Beach for 2 hours in the mornings for fitness. The table below was
compiled:
Scientific training Grassroots training
Recruited from Holmes
students
35 92
External recruitment 54 12
Tasks (show all your workings):
a. What is the probability that a randomly chosen player will be from Holmes OR receiving
Grassroots training?
Answer
P ( Holmes∨grassroot )=P ( Holmes )+ P ( Grassroot )−P(Holmes∧Grassroot )
P ( Holmes )= 127
193 =0.6580
P ( Grassroot )= 104
193 =0.5389
P ( Holmes∧Grassroot ) = 92
193 =0.4767
P ( Holmes∨grassroot )=0.6580+0.5389−0.4767=0.7202
b. What is the probability that a randomly selected player will be External AND be ins scientific
training?
P ( External∧Scientific ) = 54
193 =0.28
c. Given that a player is from Holmes, what is the probability that he is in scientific training?
HA1011 APPLIED QUANTITATIVE METHODS
Paraphrase This Document
Need a fresh take? Get an instant paraphrase of this document with our AI Paraphraser
Page 8 of 11
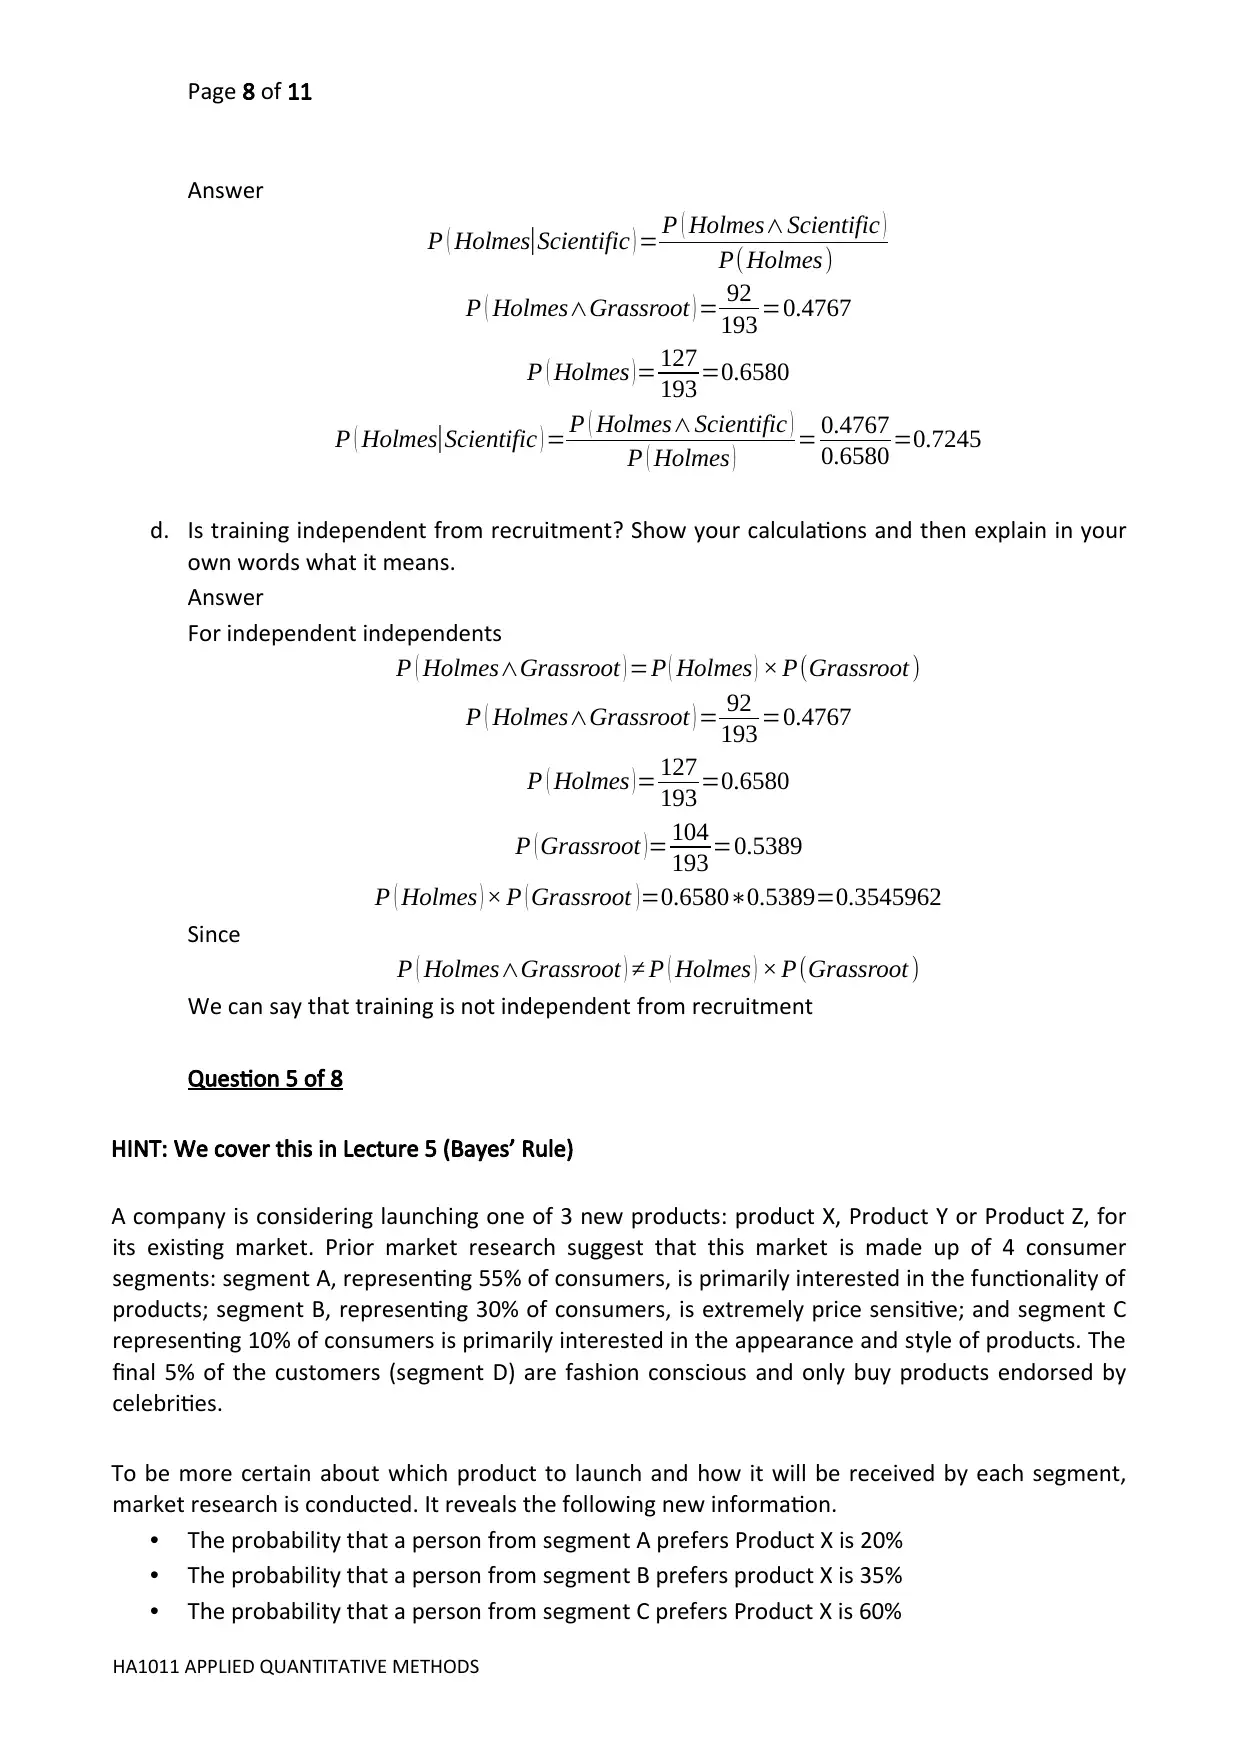
Answer
P ( Holmes|Scientific ) = P ( Holmes∧Scientific )
P( Holmes)
P ( Holmes∧Grassroot ) = 92
193 =0.4767
P ( Holmes )= 127
193 =0.6580
P ( Holmes|Scientific ) = P ( Holmes∧Scientific )
P ( Holmes ) = 0.4767
0.6580 =0.7245
d. Is training independent from recruitment? Show your calculations and then explain in your
own words what it means.
Answer
For independent independents
P ( Holmes∧Grassroot ) =P ( Holmes ) × P(Grassroot )
P ( Holmes∧Grassroot ) = 92
193 =0.4767
P ( Holmes )= 127
193 =0.6580
P ( Grassroot )= 104
193 =0.5389
P ( Holmes ) × P ( Grassroot )=0.6580∗0.5389=0.3545962
Since
P ( Holmes∧Grassroot ) ≠ P ( Holmes ) × P(Grassroot )
We can say that training is not independent from recruitment
Question 5 of 8
HINT: We cover this in Lecture 5 (Bayes’ Rule)
A company is considering launching one of 3 new products: product X, Product Y or Product Z, for
its existing market. Prior market research suggest that this market is made up of 4 consumer
segments: segment A, representing 55% of consumers, is primarily interested in the functionality of
products; segment B, representing 30% of consumers, is extremely price sensitive; and segment C
representing 10% of consumers is primarily interested in the appearance and style of products. The
final 5% of the customers (segment D) are fashion conscious and only buy products endorsed by
celebrities.
To be more certain about which product to launch and how it will be received by each segment,
market research is conducted. It reveals the following new information.
• The probability that a person from segment A prefers Product X is 20%
• The probability that a person from segment B prefers product X is 35%
• The probability that a person from segment C prefers Product X is 60%
HA1011 APPLIED QUANTITATIVE METHODS
Answer
P ( Holmes|Scientific ) = P ( Holmes∧Scientific )
P( Holmes)
P ( Holmes∧Grassroot ) = 92
193 =0.4767
P ( Holmes )= 127
193 =0.6580
P ( Holmes|Scientific ) = P ( Holmes∧Scientific )
P ( Holmes ) = 0.4767
0.6580 =0.7245
d. Is training independent from recruitment? Show your calculations and then explain in your
own words what it means.
Answer
For independent independents
P ( Holmes∧Grassroot ) =P ( Holmes ) × P(Grassroot )
P ( Holmes∧Grassroot ) = 92
193 =0.4767
P ( Holmes )= 127
193 =0.6580
P ( Grassroot )= 104
193 =0.5389
P ( Holmes ) × P ( Grassroot )=0.6580∗0.5389=0.3545962
Since
P ( Holmes∧Grassroot ) ≠ P ( Holmes ) × P(Grassroot )
We can say that training is not independent from recruitment
Question 5 of 8
HINT: We cover this in Lecture 5 (Bayes’ Rule)
A company is considering launching one of 3 new products: product X, Product Y or Product Z, for
its existing market. Prior market research suggest that this market is made up of 4 consumer
segments: segment A, representing 55% of consumers, is primarily interested in the functionality of
products; segment B, representing 30% of consumers, is extremely price sensitive; and segment C
representing 10% of consumers is primarily interested in the appearance and style of products. The
final 5% of the customers (segment D) are fashion conscious and only buy products endorsed by
celebrities.
To be more certain about which product to launch and how it will be received by each segment,
market research is conducted. It reveals the following new information.
• The probability that a person from segment A prefers Product X is 20%
• The probability that a person from segment B prefers product X is 35%
• The probability that a person from segment C prefers Product X is 60%
HA1011 APPLIED QUANTITATIVE METHODS
Page 9 of 11
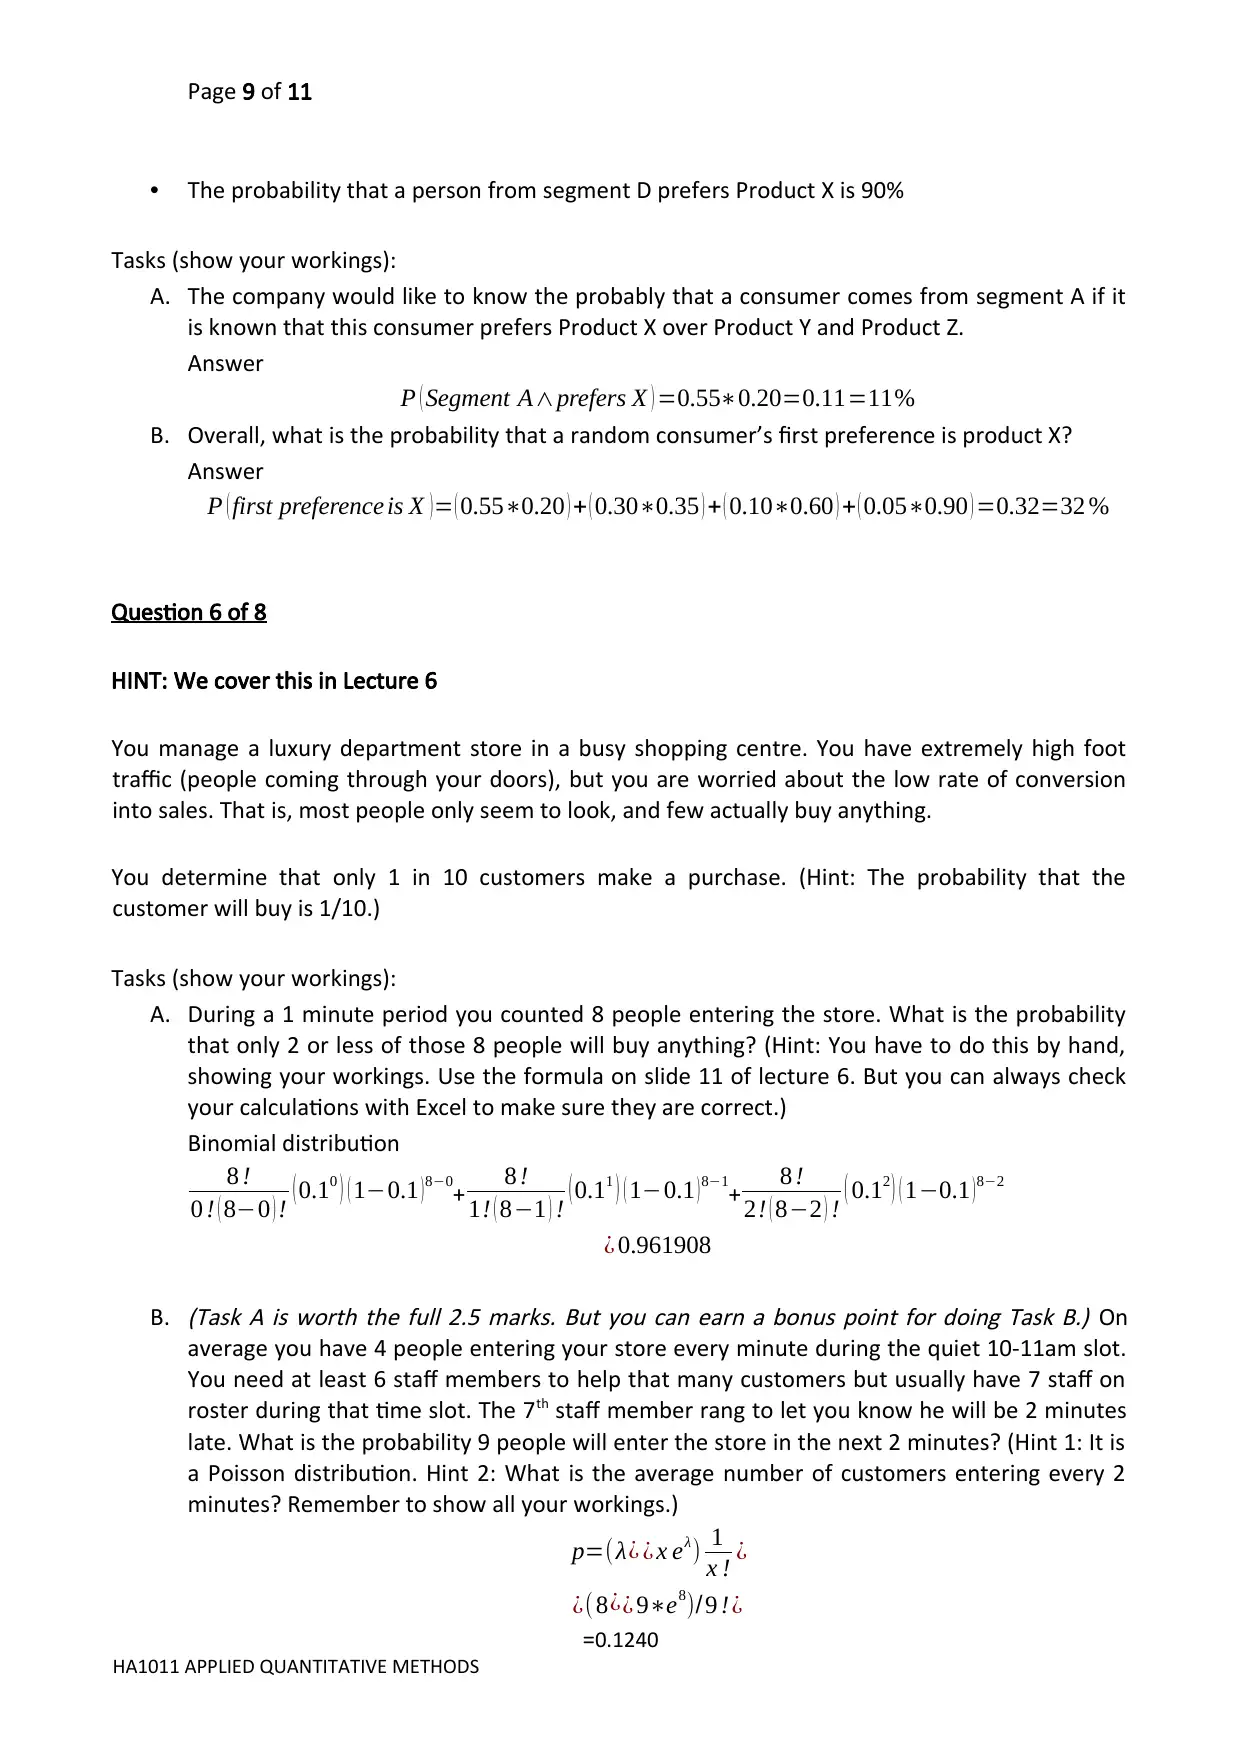
• The probability that a person from segment D prefers Product X is 90%
Tasks (show your workings):
A. The company would like to know the probably that a consumer comes from segment A if it
is known that this consumer prefers Product X over Product Y and Product Z.
Answer
P ( Segment A∧prefers X ) =0.55∗0.20=0.11=11%
B. Overall, what is the probability that a random consumer’s first preference is product X?
Answer
P ( first preference is X )= ( 0.55∗0.20 ) + ( 0.30∗0.35 ) + ( 0.10∗0.60 ) + ( 0.05∗0.90 ) =0.32=32 %
Question 6 of 8
HINT: We cover this in Lecture 6
You manage a luxury department store in a busy shopping centre. You have extremely high foot
traffic (people coming through your doors), but you are worried about the low rate of conversion
into sales. That is, most people only seem to look, and few actually buy anything.
You determine that only 1 in 10 customers make a purchase. (Hint: The probability that the
customer will buy is 1/10.)
Tasks (show your workings):
A. During a 1 minute period you counted 8 people entering the store. What is the probability
that only 2 or less of those 8 people will buy anything? (Hint: You have to do this by hand,
showing your workings. Use the formula on slide 11 of lecture 6. But you can always check
your calculations with Excel to make sure they are correct.)
Binomial distribution
8 !
0 ! ( 8−0 ) ! ( 0.10 ) ( 1−0.1 ) 8−0
+ 8 !
1! ( 8−1 ) ! ( 0.11 ) ( 1−0.1 )8−1
+ 8 !
2! ( 8−2 ) ! ( 0.12 ) ( 1−0.1 ) 8−2
¿ 0.961908
B.
(Task A is worth the full 2.5 marks. But you can earn a bonus point for doing Task B.) On
average you have 4 people entering your store every minute during the quiet 10-11am slot.
You need at least 6 staff members to help that many customers but usually have 7 staff on
roster during that time slot. The 7th staff member rang to let you know he will be 2 minutes
late. What is the probability 9 people will enter the store in the next 2 minutes? (Hint 1: It is
a Poisson distribution. Hint 2: What is the average number of customers entering every 2
minutes? Remember to show all your workings.)
p=(λ¿ ¿ x eλ) 1
x ! ¿
¿( 8¿¿ 9∗e8)/ 9 !¿
=0.1240
HA1011 APPLIED QUANTITATIVE METHODS
⊘ This is a preview!⊘
Do you want full access?
Subscribe today to unlock all pages.
Trusted by 1+ million students worldwide
Page 10 of 11
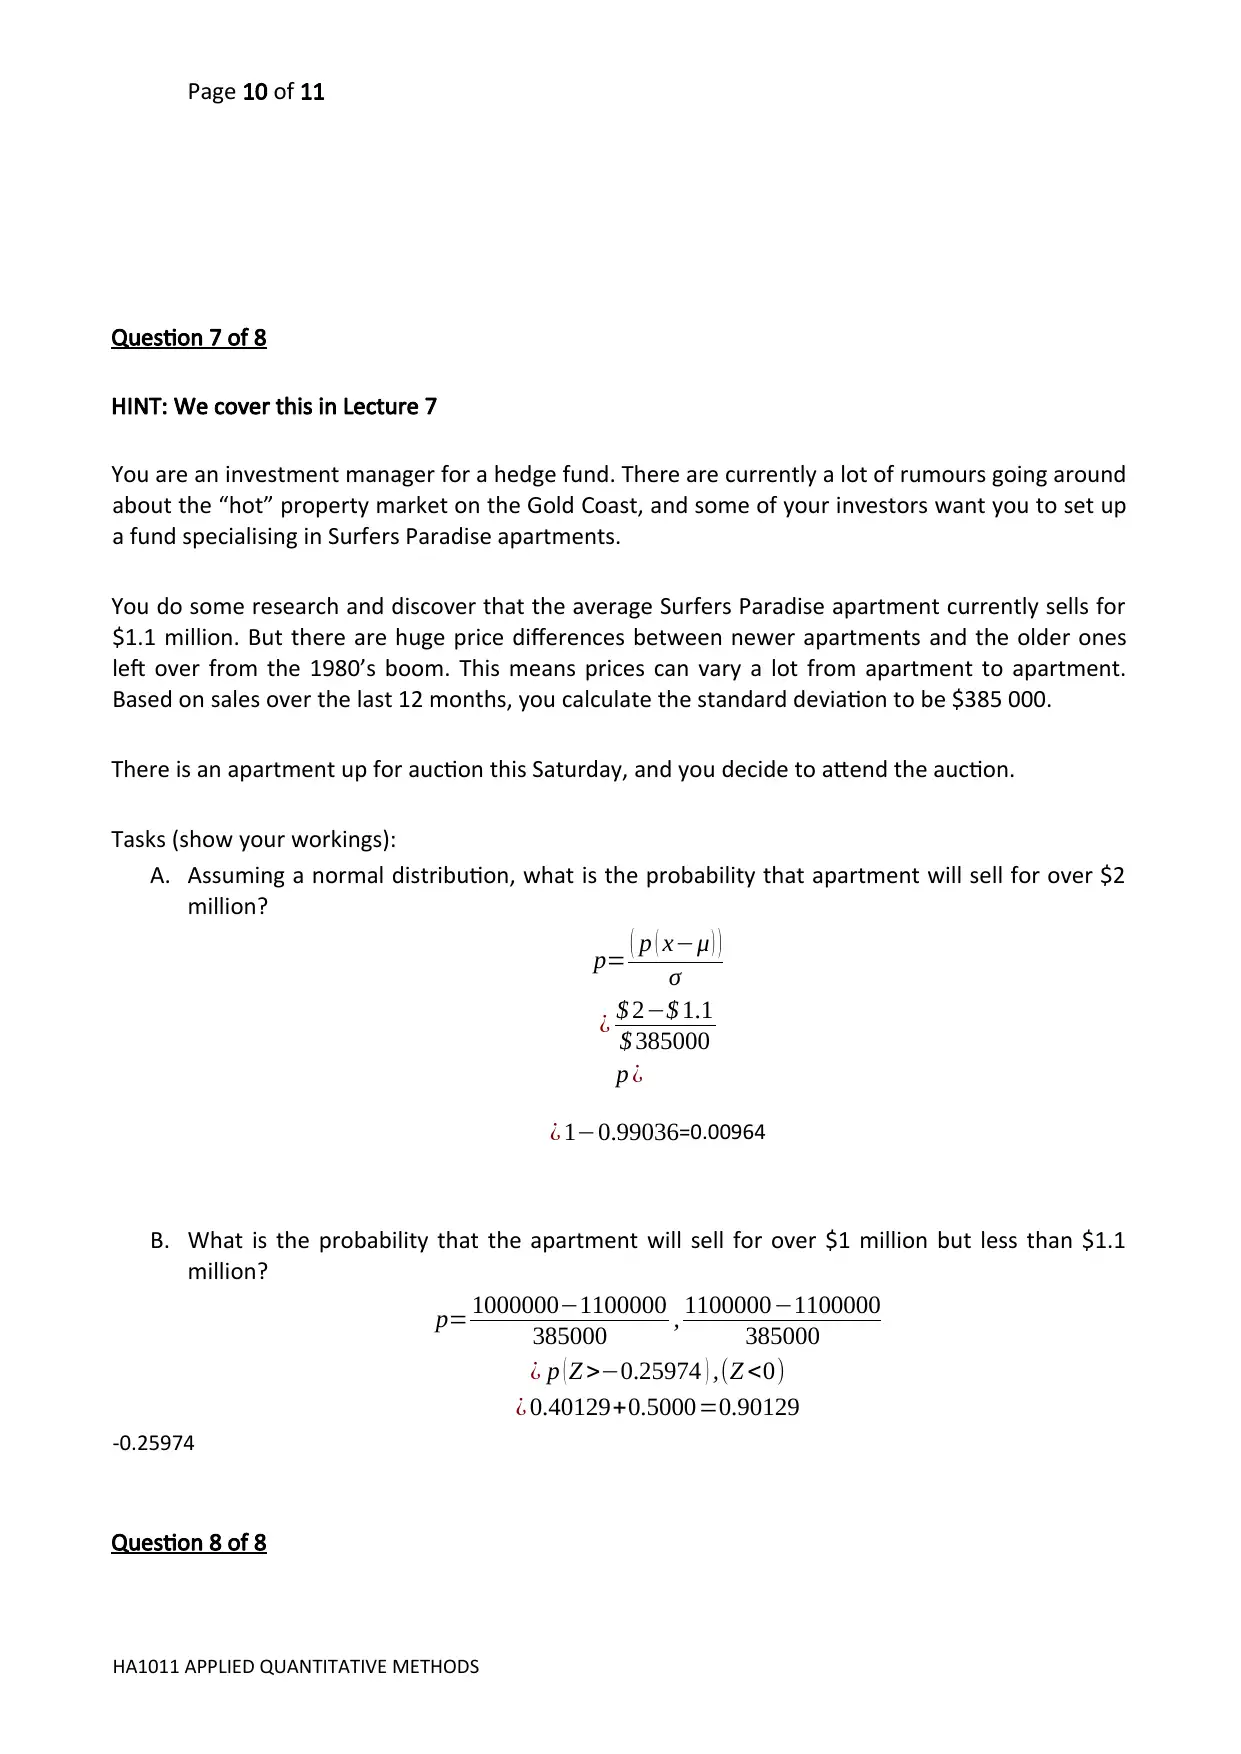
Question 7 of 8
HINT: We cover this in Lecture 7
You are an investment manager for a hedge fund. There are currently a lot of rumours going around
about the “hot” property market on the Gold Coast, and some of your investors want you to set up
a fund specialising in Surfers Paradise apartments.
You do some research and discover that the average Surfers Paradise apartment currently sells for
$1.1 million. But there are huge price differences between newer apartments and the older ones
left over from the 1980’s boom. This means prices can vary a lot from apartment to apartment.
Based on sales over the last 12 months, you calculate the standard deviation to be $385 000.
There is an apartment up for auction this Saturday, and you decide to attend the auction.
Tasks (show your workings):
A. Assuming a normal distribution, what is the probability that apartment will sell for over $2
million?
p= ( p ( x−μ ) )
σ
¿ $ 2−$ 1.1
$ 385000
p ¿
¿ 1−0.99036=0.00964
B. What is the probability that the apartment will sell for over $1 million but less than $1.1
million?
p= 1000000−1100000
385000 , 1100000−1100000
385000
¿ p ( Z >−0.25974 ) ,(Z <0)
¿ 0.40129+0.5000=0.90129
-0.25974
Question 8 of 8
HA1011 APPLIED QUANTITATIVE METHODS
Paraphrase This Document
Need a fresh take? Get an instant paraphrase of this document with our AI Paraphraser
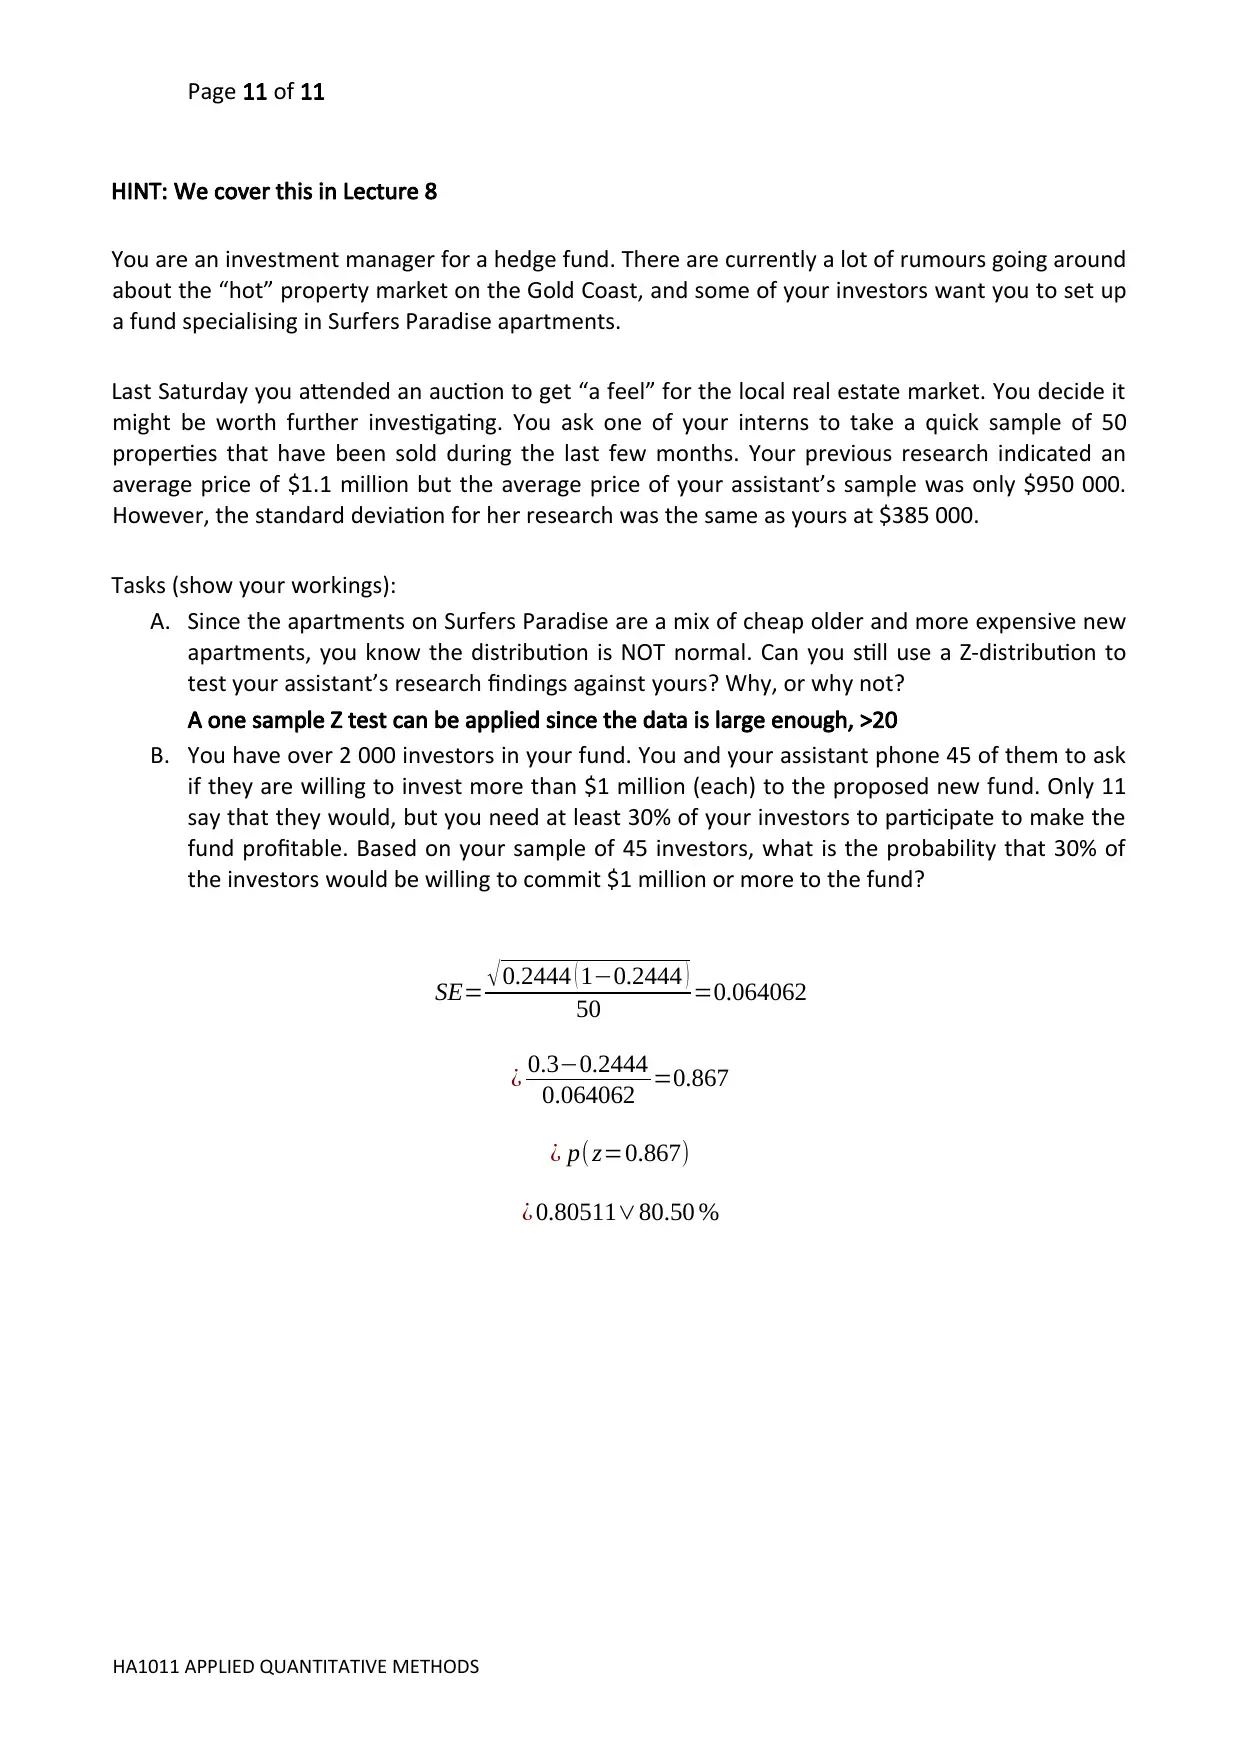
Page 11 of 11
HINT: We cover this in Lecture 8
You are an investment manager for a hedge fund. There are currently a lot of rumours going around
about the “hot” property market on the Gold Coast, and some of your investors want you to set up
a fund specialising in Surfers Paradise apartments.
Last Saturday you attended an auction to get “a feel” for the local real estate market. You decide it
might be worth further investigating. You ask one of your interns to take a quick sample of 50
properties that have been sold during the last few months. Your previous research indicated an
average price of $1.1 million but the average price of your assistant’s sample was only $950 000.
However, the standard deviation for her research was the same as yours at $385 000.
Tasks (show your workings):
A. Since the apartments on Surfers Paradise are a mix of cheap older and more expensive new
apartments, you know the distribution is NOT normal. Can you still use a Z-distribution to
test your assistant’s research findings against yours? Why, or why not?
A one sample Z test can be applied since the data is large enough, >20
B. You have over 2 000 investors in your fund. You and your assistant phone 45 of them to ask
if they are willing to invest more than $1 million (each) to the proposed new fund. Only 11
say that they would, but you need at least 30% of your investors to participate to make the
fund profitable. Based on your sample of 45 investors, what is the probability that 30% of
the investors would be willing to commit $1 million or more to the fund?
SE= √0.2444 ( 1−0.2444 )
50 =0.064062
¿ 0.3−0.2444
0.064062 =0.867
¿ p(z=0.867)
¿ 0.80511∨80.50 %
HA1011 APPLIED QUANTITATIVE METHODS
1 out of 11
Related Documents


Your All-in-One AI-Powered Toolkit for Academic Success.
+13062052269
info@desklib.com
Available 24*7 on WhatsApp / Email
![[object Object]](/_next/static/media/star-bottom.7253800d.svg)
Unlock your academic potential
Copyright © 2020–2026 A2Z Services. All Rights Reserved. Developed and managed by ZUCOL.