Hotel Finance and Revenue: A Financial Analysis Report
VerifiedAdded on 2023/06/12
|24
|5308
|409
AI Summary
This report conducts a financial analysis of British Airways, evaluating its profitability, efficiency, liquidity, capital structure, and investor ratios. The report provides insights into the company's financial performance and position.
Contribute Materials
Your contribution can guide someone’s learning journey. Share your
documents today.
Running Head: Hotel Finance and revenue
1
Project Report: Hotel Finance and revenue
1
Project Report: Hotel Finance and revenue
Secure Best Marks with AI Grader
Need help grading? Try our AI Grader for instant feedback on your assignments.
Hotel Finance and revenue
2
Contents
Introduction.......................................................................................................................3
Company overview...........................................................................................................3
Findings............................................................................................................................3
Profitability ratios.........................................................................................................4
Efficiency ratios............................................................................................................5
Liquidity ratios..............................................................................................................7
Capital structure ratios..................................................................................................9
Investor’s ratios..........................................................................................................10
Discussion.......................................................................................................................11
Conclusion and recommendation...................................................................................12
References.......................................................................................................................14
Appendix.........................................................................................................................16
Hotel Finance and revenue
3
Introduction:
Financial evaluation and analysis is a process which is used by the companies and the
investors and financial analyse of the company to analyze the performance of the company in
context with the finance. This process evaluates the budgets, projects, financial related
entities etc of an organization to identify the suitability and the performance of the company.
Normally, financial analysis process is used by the related parties to identify that whether the
organization is stable, liquid, solvent and profitable enough to manage the performance and
the position in the industry. Financial analyst and the financial manager of a company
evaluate the financial statement and the financial transaction of a company to generate the
idea about the performance of the company.
There are various tools to evaluate the financial performance of the company. All the
tools are used by the companies to generate a basic idea about the different business
transactions and the decisions of the company. In the report, British airways has been taken
into the concern and the ratio analysis study has been conducted on the company to generate
an idea about the stable, liquid, solvent and profitable position of the company.
Company overview:
“British airways” is the largest airline on the basis of fleet size in United Kingdom.
The company has been founded in 1974. The head office of the company has based in
Waterside at London Heathrow Airport. The company has been merged with a company,
Iberia to diversify the market. The British airways are offering its services at many
destinations in Australia as well as at international level. Currently, company is serving into
183 destinations. Company is registered in London stock exchange by the name of Boeing
Company (Home, 2018). The financial evaluation explains that the last few decades was not
that much good for the company. Various up and down has been faced by the company in last
few decades.
Findings:
The financial statement of the company has been evaluated to identify the
performance of the company. The ratio analysis study has been conducted on the company to
generate an idea about the stable, liquid, solvent and profitable position of the company as
well as the changes into the financial statement of the company has also been evaluated on
Hotel Finance and revenue
4
the basis of year 2013 to analyze that how much changes have occurred into the financial
performance of the company in last five years.
Ratio analysis is a quantitative analysis which evaluates information that is combined
in the financial statement of a company. Ratio analysis study is used by the companies to
evaluate the various financial aspect of an organization. It explains about the stable, liquid,
solvent and profitable position of the company. The ratio analysis study of the company is as
follows:
Profitability ratios:
Profitability ratios express about the ability of a business that is used to generate the
earnings of an organization in comparison with the expenses and other related cost of the
company in a particular time period. Profitability ratios make it easier for the investors and
the analyst of the company to evaluate about the profitability level of the company. There are
various ratios on the basis of that profitability position of an organization could be evaluated
such as net profit margin, return on equity, return on assets etc. (Dewachter et al, 2015)
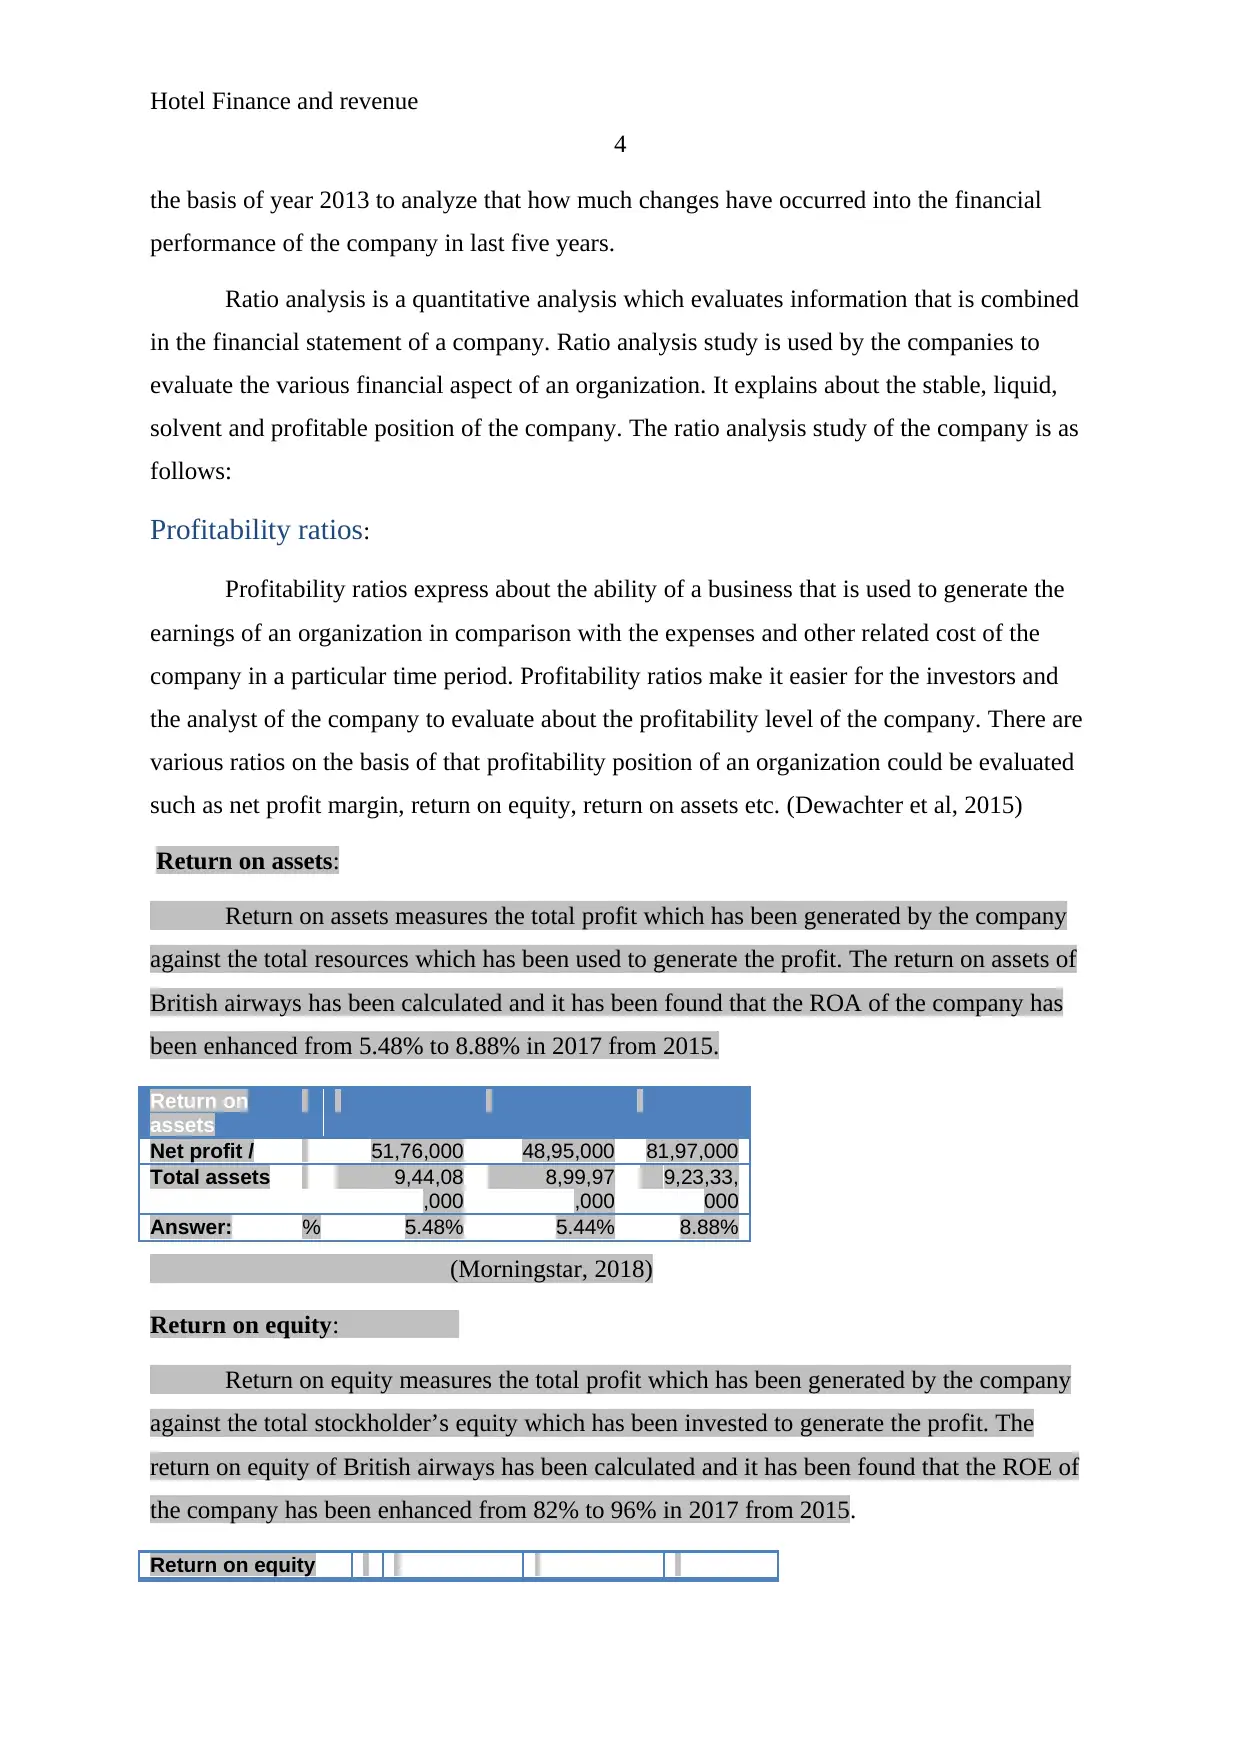
Return on assets:
Return on assets measures the total profit which has been generated by the company
against the total resources which has been used to generate the profit. The return on assets of
British airways has been calculated and it has been found that the ROA of the company has
been enhanced from 5.48% to 8.88% in 2017 from 2015.
Return on
assets
Net profit / 51,76,000 48,95,000 81,97,000
Total assets 9,44,08
,000
8,99,97
,000
9,23,33,
000
Answer: % 5.48% 5.44% 8.88%
(Morningstar, 2018)
Return on equity:
Return on equity measures the total profit which has been generated by the company
against the total stockholder’s equity which has been invested to generate the profit. The
return on equity of British airways has been calculated and it has been found that the ROE of
the company has been enhanced from 82% to 96% in 2017 from 2015.
Return on equity
4
the basis of year 2013 to analyze that how much changes have occurred into the financial
performance of the company in last five years.
Ratio analysis is a quantitative analysis which evaluates information that is combined
in the financial statement of a company. Ratio analysis study is used by the companies to
evaluate the various financial aspect of an organization. It explains about the stable, liquid,
solvent and profitable position of the company. The ratio analysis study of the company is as
follows:
Profitability ratios:
Profitability ratios express about the ability of a business that is used to generate the
earnings of an organization in comparison with the expenses and other related cost of the
company in a particular time period. Profitability ratios make it easier for the investors and
the analyst of the company to evaluate about the profitability level of the company. There are
various ratios on the basis of that profitability position of an organization could be evaluated
such as net profit margin, return on equity, return on assets etc. (Dewachter et al, 2015)
Return on assets:
Return on assets measures the total profit which has been generated by the company
against the total resources which has been used to generate the profit. The return on assets of
British airways has been calculated and it has been found that the ROA of the company has
been enhanced from 5.48% to 8.88% in 2017 from 2015.
Return on
assets
Net profit / 51,76,000 48,95,000 81,97,000
Total assets 9,44,08
,000
8,99,97
,000
9,23,33,
000
Answer: % 5.48% 5.44% 8.88%
(Morningstar, 2018)
Return on equity:
Return on equity measures the total profit which has been generated by the company
against the total stockholder’s equity which has been invested to generate the profit. The
return on equity of British airways has been calculated and it has been found that the ROE of
the company has been enhanced from 82% to 96% in 2017 from 2015.
Return on equity
Secure Best Marks with AI Grader
Need help grading? Try our AI Grader for instant feedback on your assignments.
Hotel Finance and revenue
5
Net profit /
51,76,000 48,95,000 81,97,00
0
Total stockholder's
equity 63,35,000 81,70,000 85,50,00
0
Answer: % 82% 60% 96%
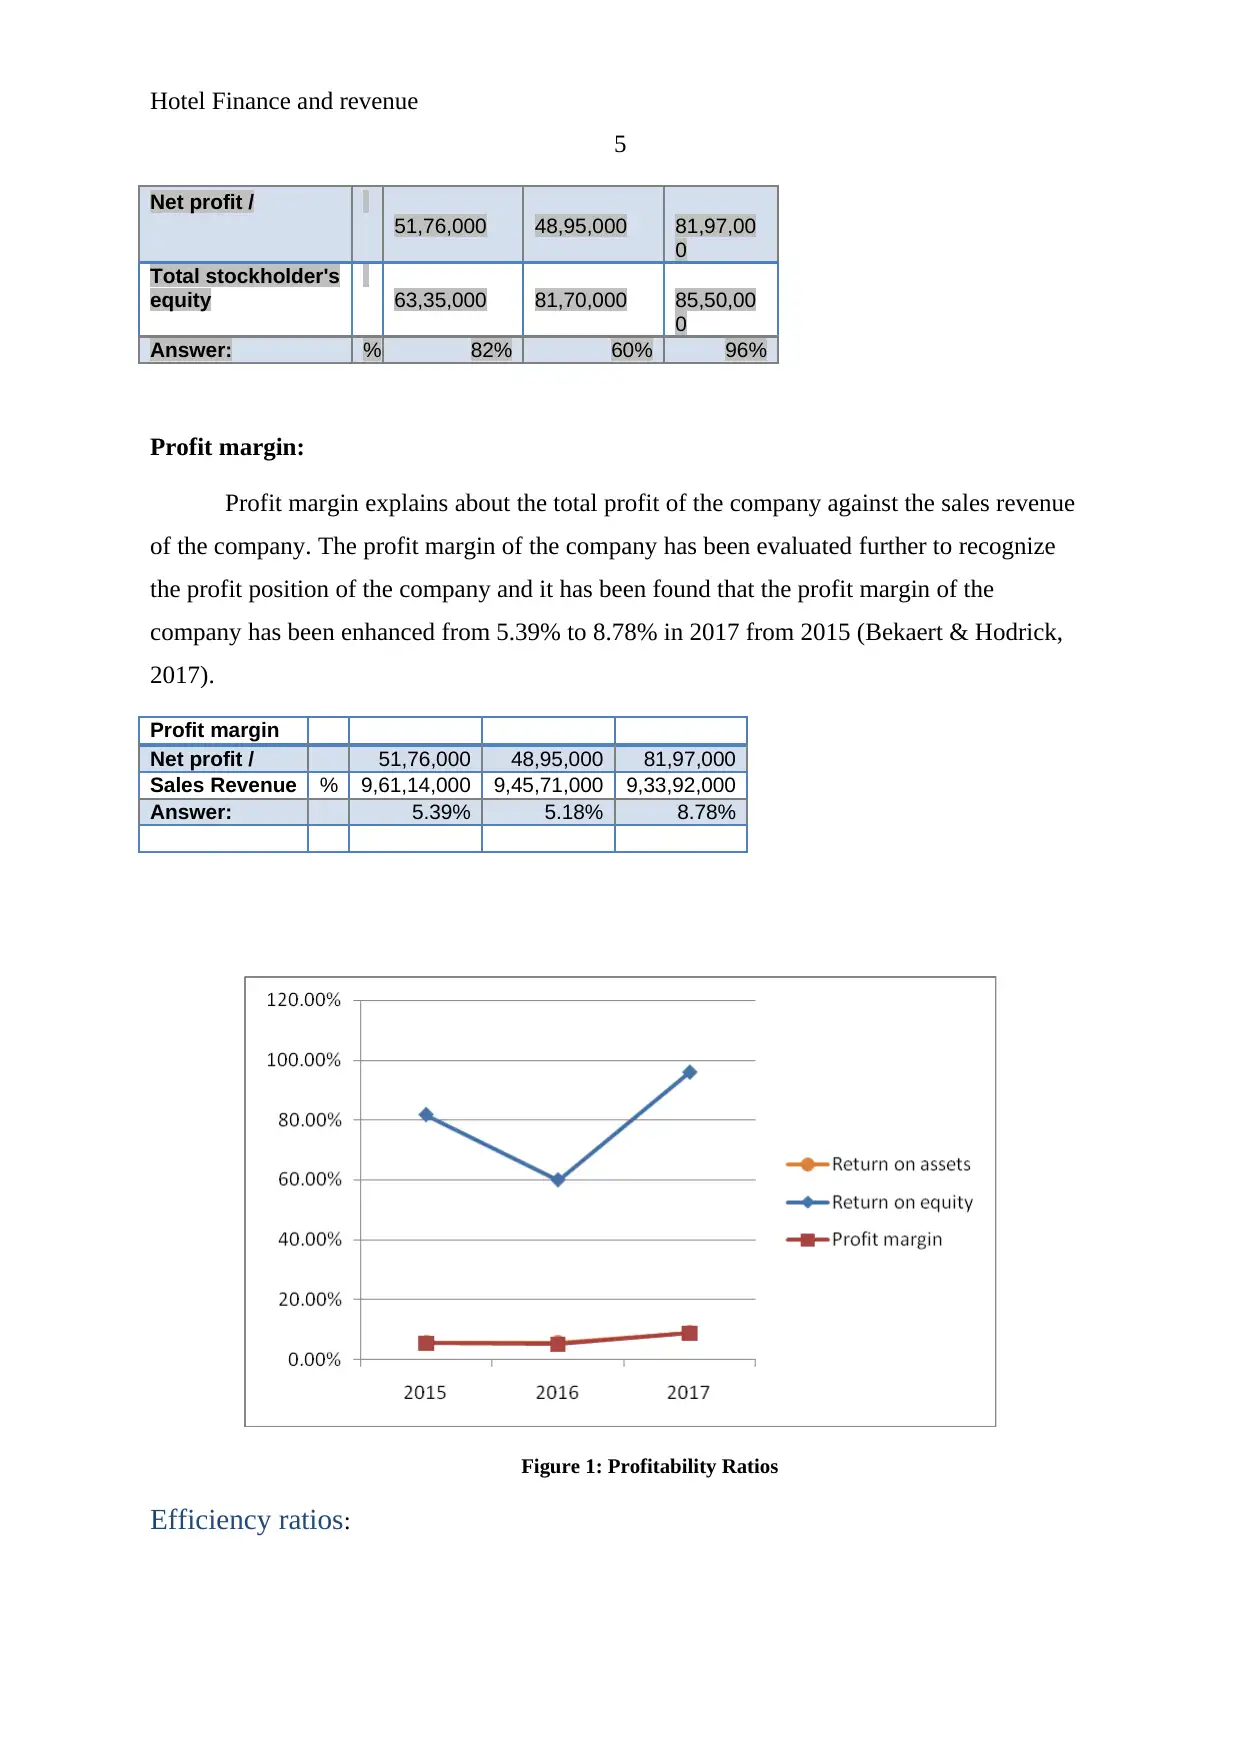
Profit margin:
Profit margin explains about the total profit of the company against the sales revenue
of the company. The profit margin of the company has been evaluated further to recognize
the profit position of the company and it has been found that the profit margin of the
company has been enhanced from 5.39% to 8.78% in 2017 from 2015 (Bekaert & Hodrick,
2017).
Profit margin
Net profit / 51,76,000 48,95,000 81,97,000
Sales Revenue % 9,61,14,000 9,45,71,000 9,33,92,000
Answer: 5.39% 5.18% 8.78%
Figure 1: Profitability Ratios
Efficiency ratios:
5
Net profit /
51,76,000 48,95,000 81,97,00
0
Total stockholder's
equity 63,35,000 81,70,000 85,50,00
0
Answer: % 82% 60% 96%
Profit margin:
Profit margin explains about the total profit of the company against the sales revenue
of the company. The profit margin of the company has been evaluated further to recognize
the profit position of the company and it has been found that the profit margin of the
company has been enhanced from 5.39% to 8.78% in 2017 from 2015 (Bekaert & Hodrick,
2017).
Profit margin
Net profit / 51,76,000 48,95,000 81,97,000
Sales Revenue % 9,61,14,000 9,45,71,000 9,33,92,000
Answer: 5.39% 5.18% 8.78%
Figure 1: Profitability Ratios
Efficiency ratios:
Hotel Finance and revenue
6
Asset efficiency ratios express about the combination of assets and liabilities of the
company and evaluates about the performance of the company. Efficiency ratios are used by
the companies and the financial analyst to evaluate the commercial performance of the
company. It measure the total time period in which the cash conversion cycle of an
organization competes. There are various ratios on the basis of that efficiency position of an
organization could be evaluated such as receivable turnover ratio, inventory turnover ratio,
payable turnover ratio etc.
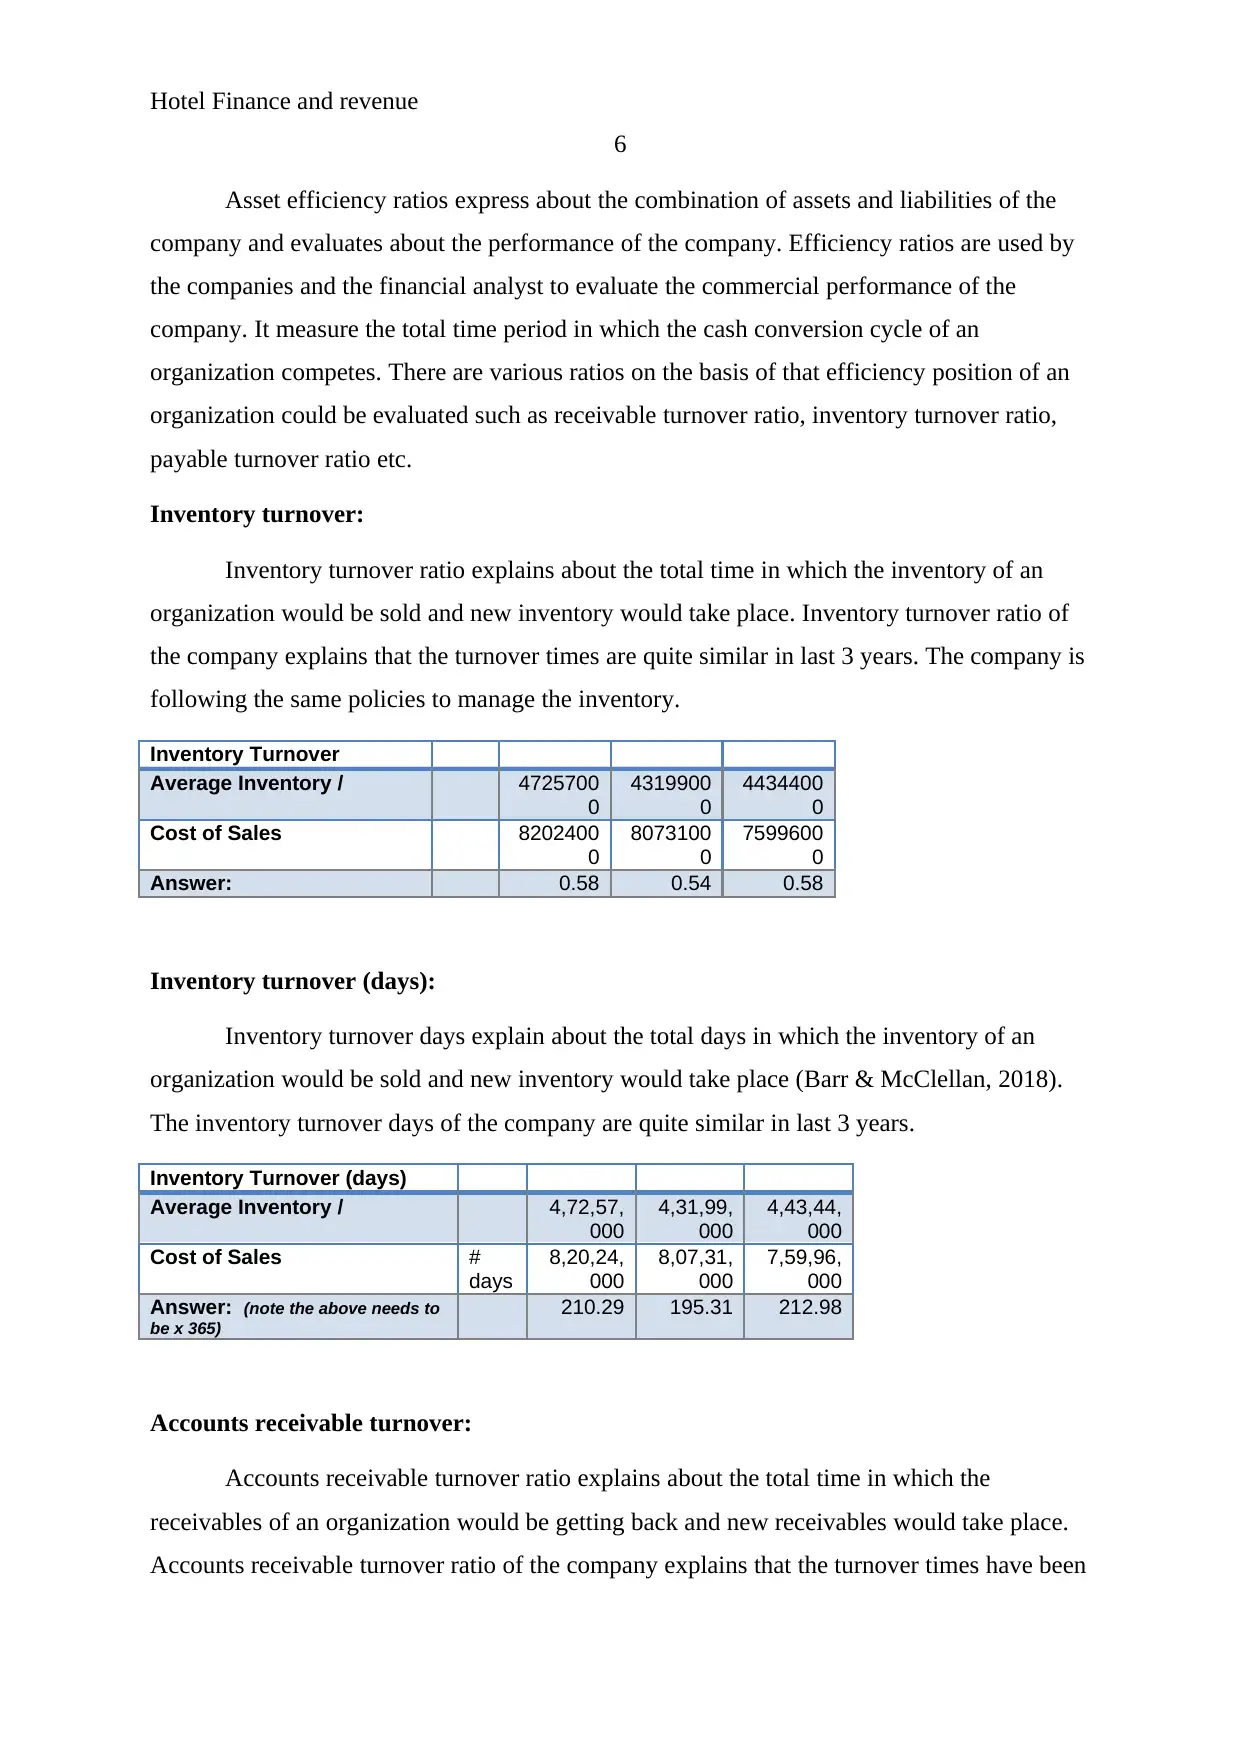
Inventory turnover:
Inventory turnover ratio explains about the total time in which the inventory of an
organization would be sold and new inventory would take place. Inventory turnover ratio of
the company explains that the turnover times are quite similar in last 3 years. The company is
following the same policies to manage the inventory.
Inventory Turnover
Average Inventory / 4725700
0
4319900
0
4434400
0
Cost of Sales 8202400
0
8073100
0
7599600
0
Answer: 0.58 0.54 0.58
Inventory turnover (days):
Inventory turnover days explain about the total days in which the inventory of an
organization would be sold and new inventory would take place (Barr & McClellan, 2018).
The inventory turnover days of the company are quite similar in last 3 years.
Inventory Turnover (days)
Average Inventory / 4,72,57,
000
4,31,99,
000
4,43,44,
000
Cost of Sales #
days
8,20,24,
000
8,07,31,
000
7,59,96,
000
Answer: (note the above needs to
be x 365)
210.29 195.31 212.98
Accounts receivable turnover:
Accounts receivable turnover ratio explains about the total time in which the
receivables of an organization would be getting back and new receivables would take place.
Accounts receivable turnover ratio of the company explains that the turnover times have been
6
Asset efficiency ratios express about the combination of assets and liabilities of the
company and evaluates about the performance of the company. Efficiency ratios are used by
the companies and the financial analyst to evaluate the commercial performance of the
company. It measure the total time period in which the cash conversion cycle of an
organization competes. There are various ratios on the basis of that efficiency position of an
organization could be evaluated such as receivable turnover ratio, inventory turnover ratio,
payable turnover ratio etc.
Inventory turnover:
Inventory turnover ratio explains about the total time in which the inventory of an
organization would be sold and new inventory would take place. Inventory turnover ratio of
the company explains that the turnover times are quite similar in last 3 years. The company is
following the same policies to manage the inventory.
Inventory Turnover
Average Inventory / 4725700
0
4319900
0
4434400
0
Cost of Sales 8202400
0
8073100
0
7599600
0
Answer: 0.58 0.54 0.58
Inventory turnover (days):
Inventory turnover days explain about the total days in which the inventory of an
organization would be sold and new inventory would take place (Barr & McClellan, 2018).
The inventory turnover days of the company are quite similar in last 3 years.
Inventory Turnover (days)
Average Inventory / 4,72,57,
000
4,31,99,
000
4,43,44,
000
Cost of Sales #
days
8,20,24,
000
8,07,31,
000
7,59,96,
000
Answer: (note the above needs to
be x 365)
210.29 195.31 212.98
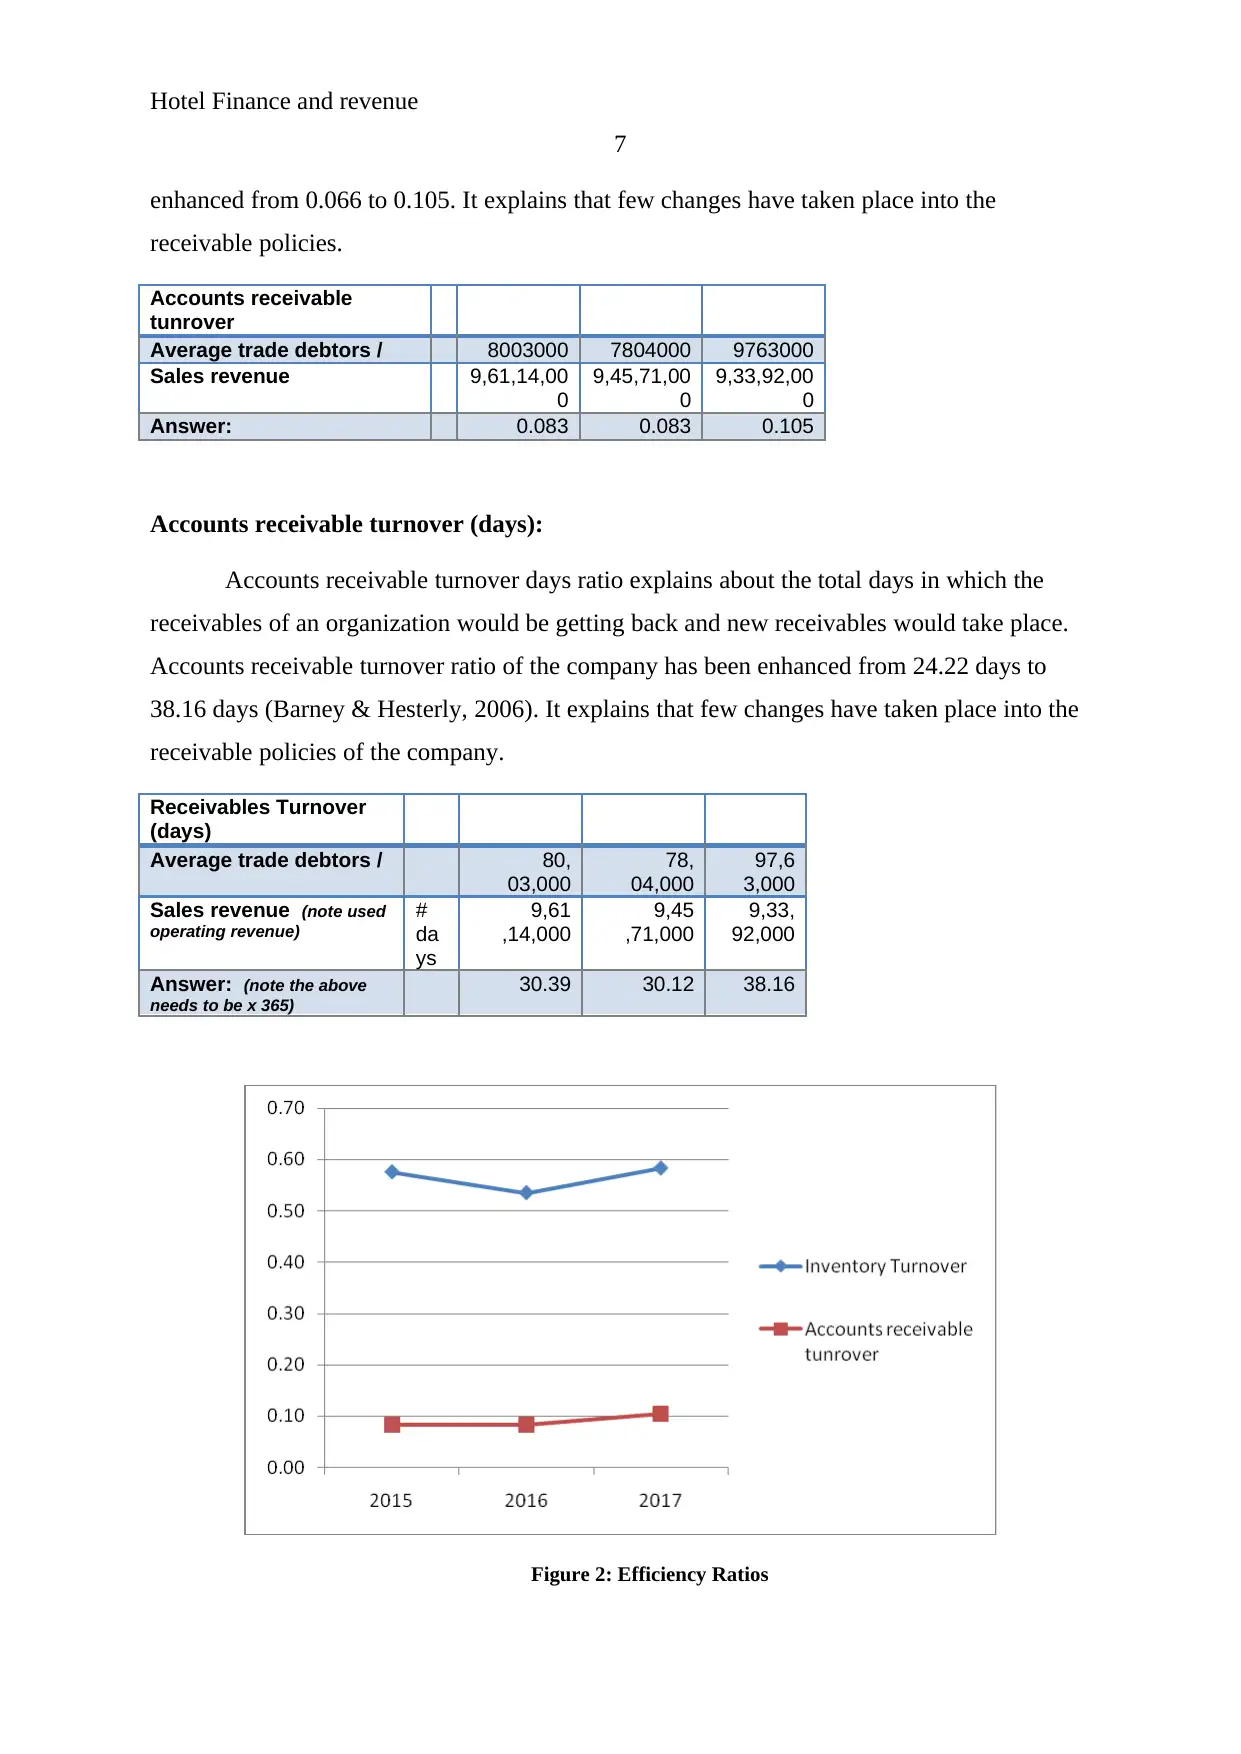
Accounts receivable turnover:
Accounts receivable turnover ratio explains about the total time in which the
receivables of an organization would be getting back and new receivables would take place.
Accounts receivable turnover ratio of the company explains that the turnover times have been
Hotel Finance and revenue
7
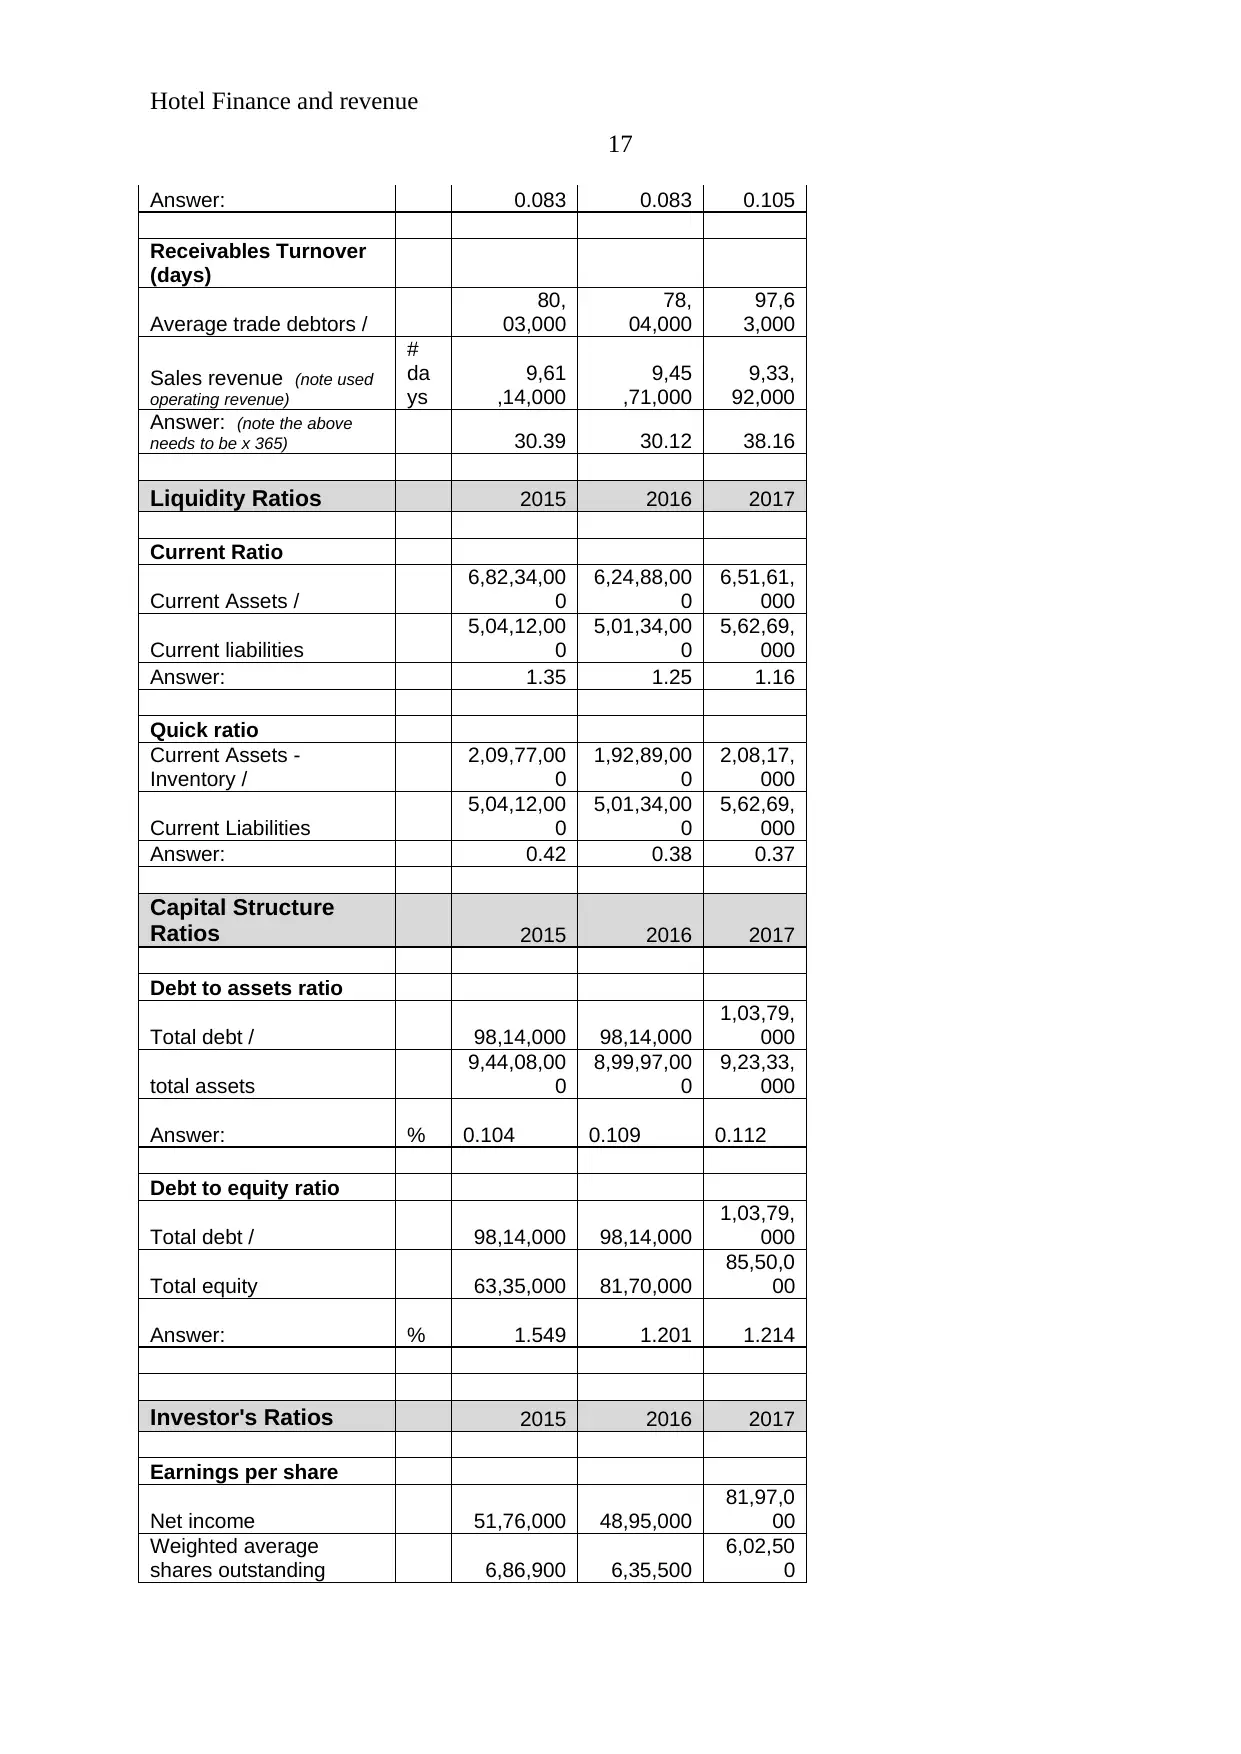
enhanced from 0.066 to 0.105. It explains that few changes have taken place into the
receivable policies.
Accounts receivable
tunrover
Average trade debtors / 8003000 7804000 9763000
Sales revenue 9,61,14,00
0
9,45,71,00
0
9,33,92,00
0
Answer: 0.083 0.083 0.105
Accounts receivable turnover (days):
Accounts receivable turnover days ratio explains about the total days in which the
receivables of an organization would be getting back and new receivables would take place.
Accounts receivable turnover ratio of the company has been enhanced from 24.22 days to
38.16 days (Barney & Hesterly, 2006). It explains that few changes have taken place into the
receivable policies of the company.
Receivables Turnover
(days)
Average trade debtors / 80,
03,000
78,
04,000
97,6
3,000
Sales revenue (note used
operating revenue)
#
da
ys
9,61
,14,000
9,45
,71,000
9,33,
92,000
Answer: (note the above
needs to be x 365)
30.39 30.12 38.16
Figure 2: Efficiency Ratios
7
enhanced from 0.066 to 0.105. It explains that few changes have taken place into the
receivable policies.
Accounts receivable
tunrover
Average trade debtors / 8003000 7804000 9763000
Sales revenue 9,61,14,00
0
9,45,71,00
0
9,33,92,00
0
Answer: 0.083 0.083 0.105
Accounts receivable turnover (days):
Accounts receivable turnover days ratio explains about the total days in which the
receivables of an organization would be getting back and new receivables would take place.
Accounts receivable turnover ratio of the company has been enhanced from 24.22 days to
38.16 days (Barney & Hesterly, 2006). It explains that few changes have taken place into the
receivable policies of the company.
Receivables Turnover
(days)
Average trade debtors / 80,
03,000
78,
04,000
97,6
3,000
Sales revenue (note used
operating revenue)
#
da
ys
9,61
,14,000
9,45
,71,000
9,33,
92,000
Answer: (note the above
needs to be x 365)
30.39 30.12 38.16
Figure 2: Efficiency Ratios
Paraphrase This Document
Need a fresh take? Get an instant paraphrase of this document with our AI Paraphraser
Hotel Finance and revenue
8
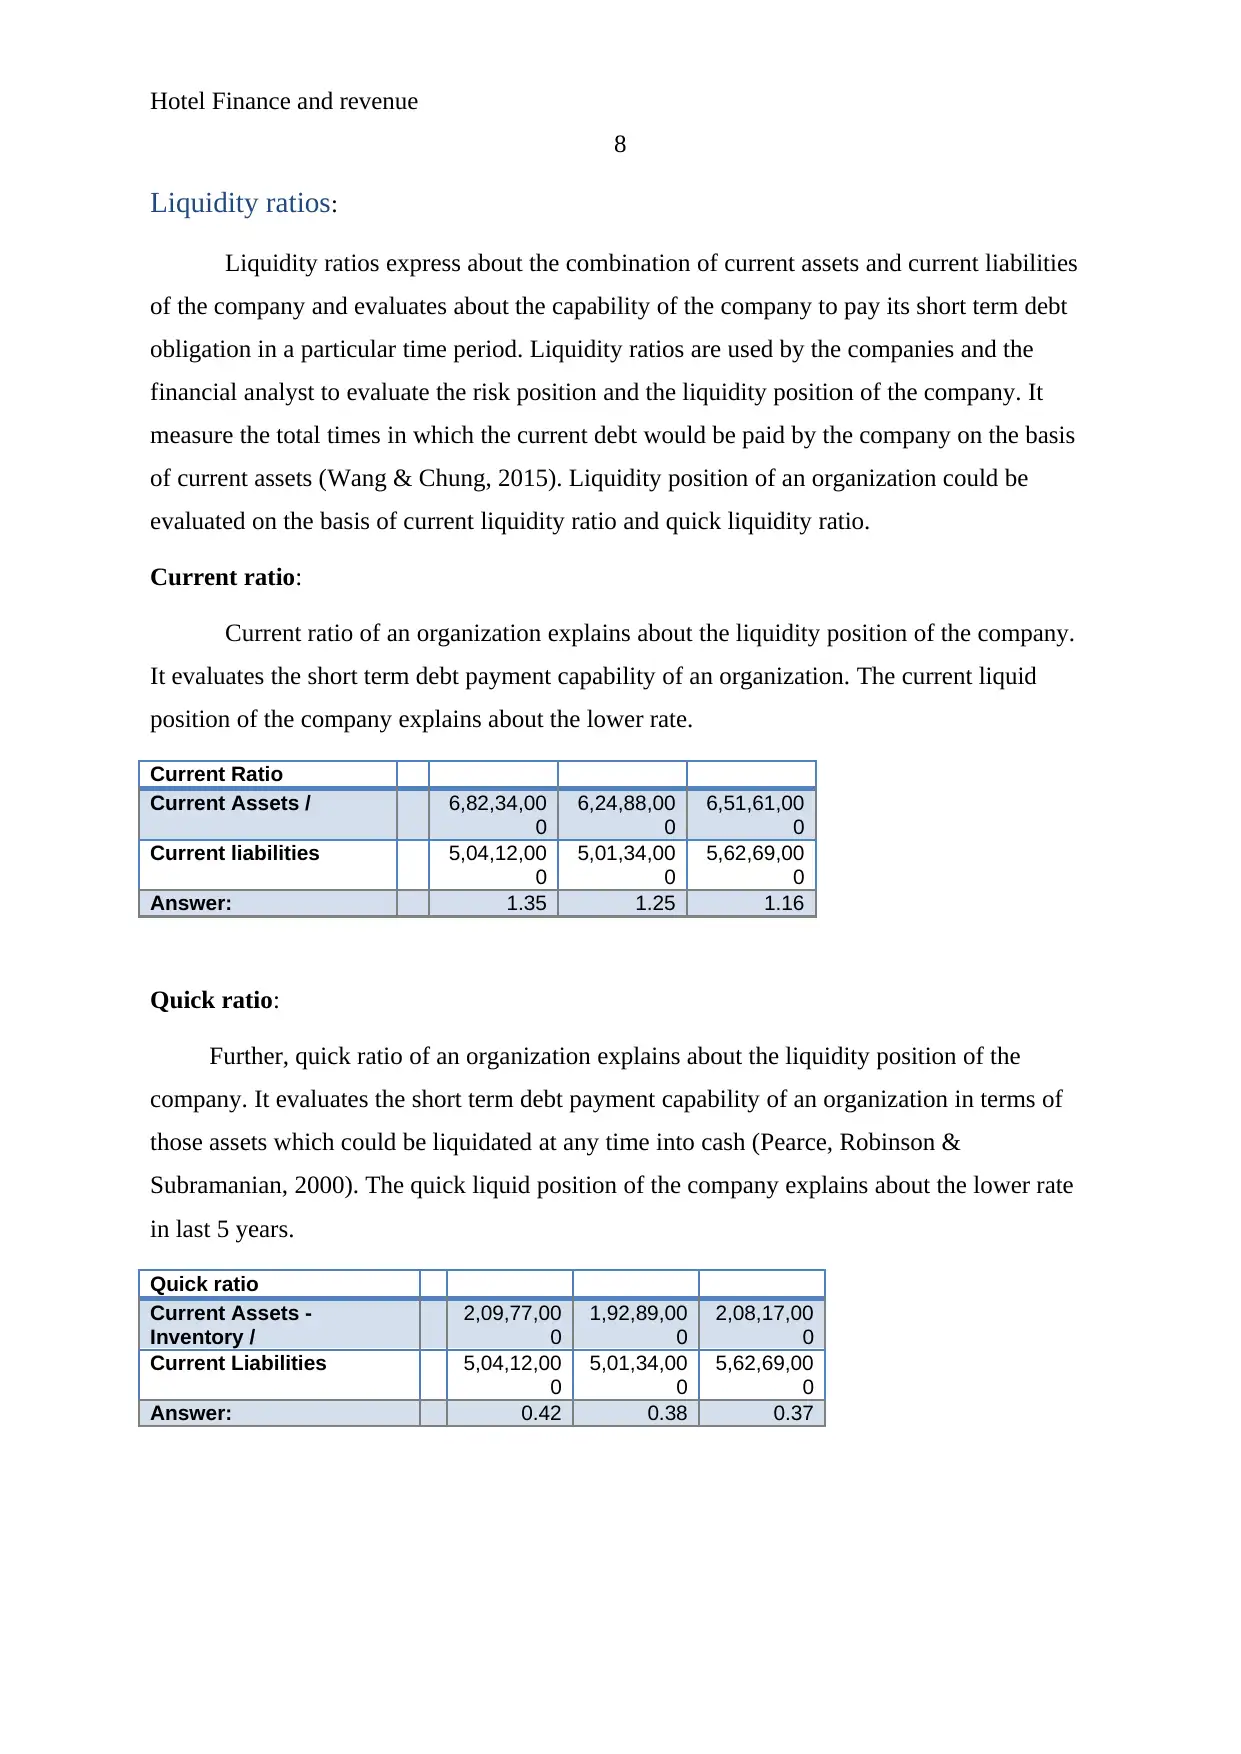
Liquidity ratios:
Liquidity ratios express about the combination of current assets and current liabilities
of the company and evaluates about the capability of the company to pay its short term debt
obligation in a particular time period. Liquidity ratios are used by the companies and the
financial analyst to evaluate the risk position and the liquidity position of the company. It
measure the total times in which the current debt would be paid by the company on the basis
of current assets (Wang & Chung, 2015). Liquidity position of an organization could be
evaluated on the basis of current liquidity ratio and quick liquidity ratio.
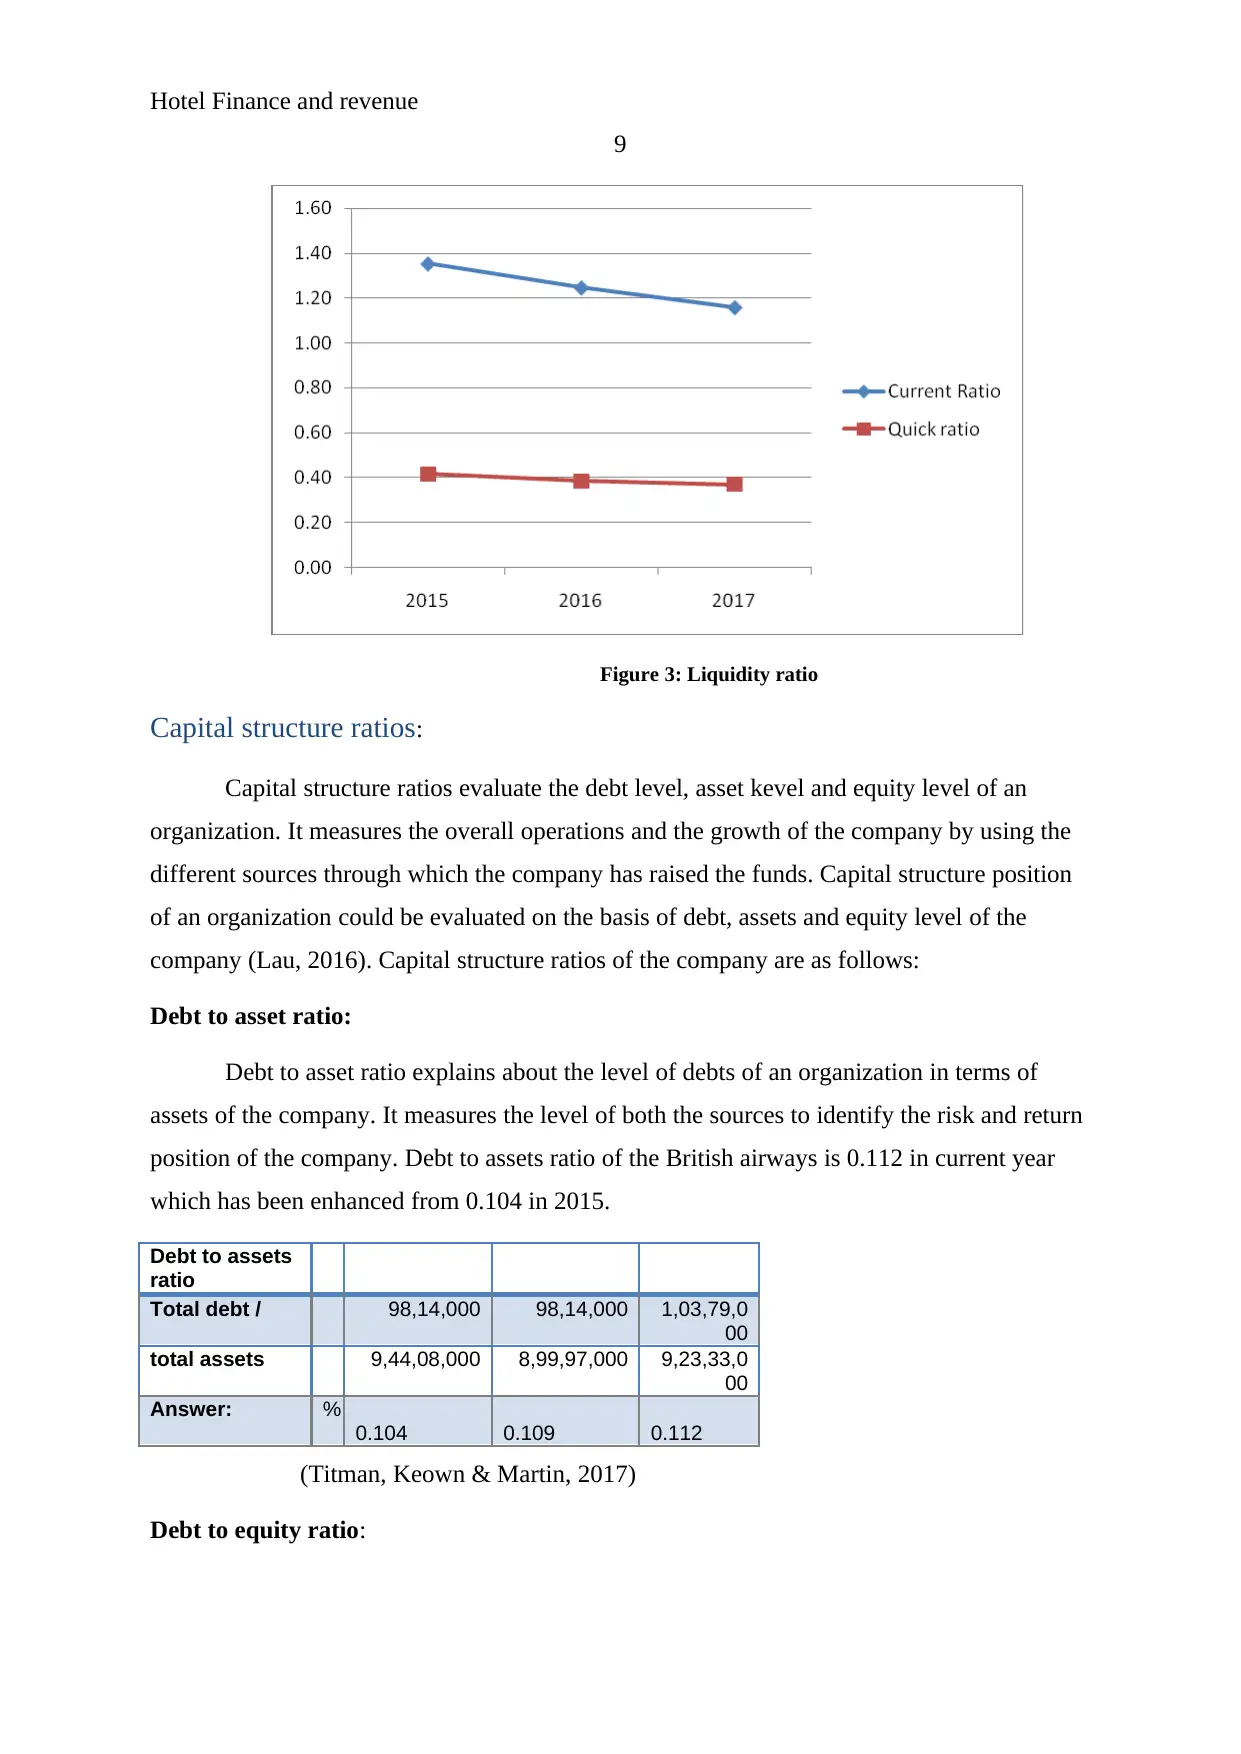
Current ratio:
Current ratio of an organization explains about the liquidity position of the company.
It evaluates the short term debt payment capability of an organization. The current liquid
position of the company explains about the lower rate.
Current Ratio
Current Assets / 6,82,34,00
0
6,24,88,00
0
6,51,61,00
0
Current liabilities 5,04,12,00
0
5,01,34,00
0
5,62,69,00
0
Answer: 1.35 1.25 1.16
Quick ratio:
Further, quick ratio of an organization explains about the liquidity position of the
company. It evaluates the short term debt payment capability of an organization in terms of
those assets which could be liquidated at any time into cash (Pearce, Robinson &
Subramanian, 2000). The quick liquid position of the company explains about the lower rate
in last 5 years.
Quick ratio
Current Assets -
Inventory /
2,09,77,00
0
1,92,89,00
0
2,08,17,00
0
Current Liabilities 5,04,12,00
0
5,01,34,00
0
5,62,69,00
0
Answer: 0.42 0.38 0.37
8
Liquidity ratios:
Liquidity ratios express about the combination of current assets and current liabilities
of the company and evaluates about the capability of the company to pay its short term debt
obligation in a particular time period. Liquidity ratios are used by the companies and the
financial analyst to evaluate the risk position and the liquidity position of the company. It
measure the total times in which the current debt would be paid by the company on the basis
of current assets (Wang & Chung, 2015). Liquidity position of an organization could be
evaluated on the basis of current liquidity ratio and quick liquidity ratio.
Current ratio:
Current ratio of an organization explains about the liquidity position of the company.
It evaluates the short term debt payment capability of an organization. The current liquid
position of the company explains about the lower rate.
Current Ratio
Current Assets / 6,82,34,00
0
6,24,88,00
0
6,51,61,00
0
Current liabilities 5,04,12,00
0
5,01,34,00
0
5,62,69,00
0
Answer: 1.35 1.25 1.16
Quick ratio:
Further, quick ratio of an organization explains about the liquidity position of the
company. It evaluates the short term debt payment capability of an organization in terms of
those assets which could be liquidated at any time into cash (Pearce, Robinson &
Subramanian, 2000). The quick liquid position of the company explains about the lower rate
in last 5 years.
Quick ratio
Current Assets -
Inventory /
2,09,77,00
0
1,92,89,00
0
2,08,17,00
0
Current Liabilities 5,04,12,00
0
5,01,34,00
0
5,62,69,00
0
Answer: 0.42 0.38 0.37
Hotel Finance and revenue
9
Figure 3: Liquidity ratio
Capital structure ratios:
Capital structure ratios evaluate the debt level, asset kevel and equity level of an
organization. It measures the overall operations and the growth of the company by using the
different sources through which the company has raised the funds. Capital structure position
of an organization could be evaluated on the basis of debt, assets and equity level of the
company (Lau, 2016). Capital structure ratios of the company are as follows:
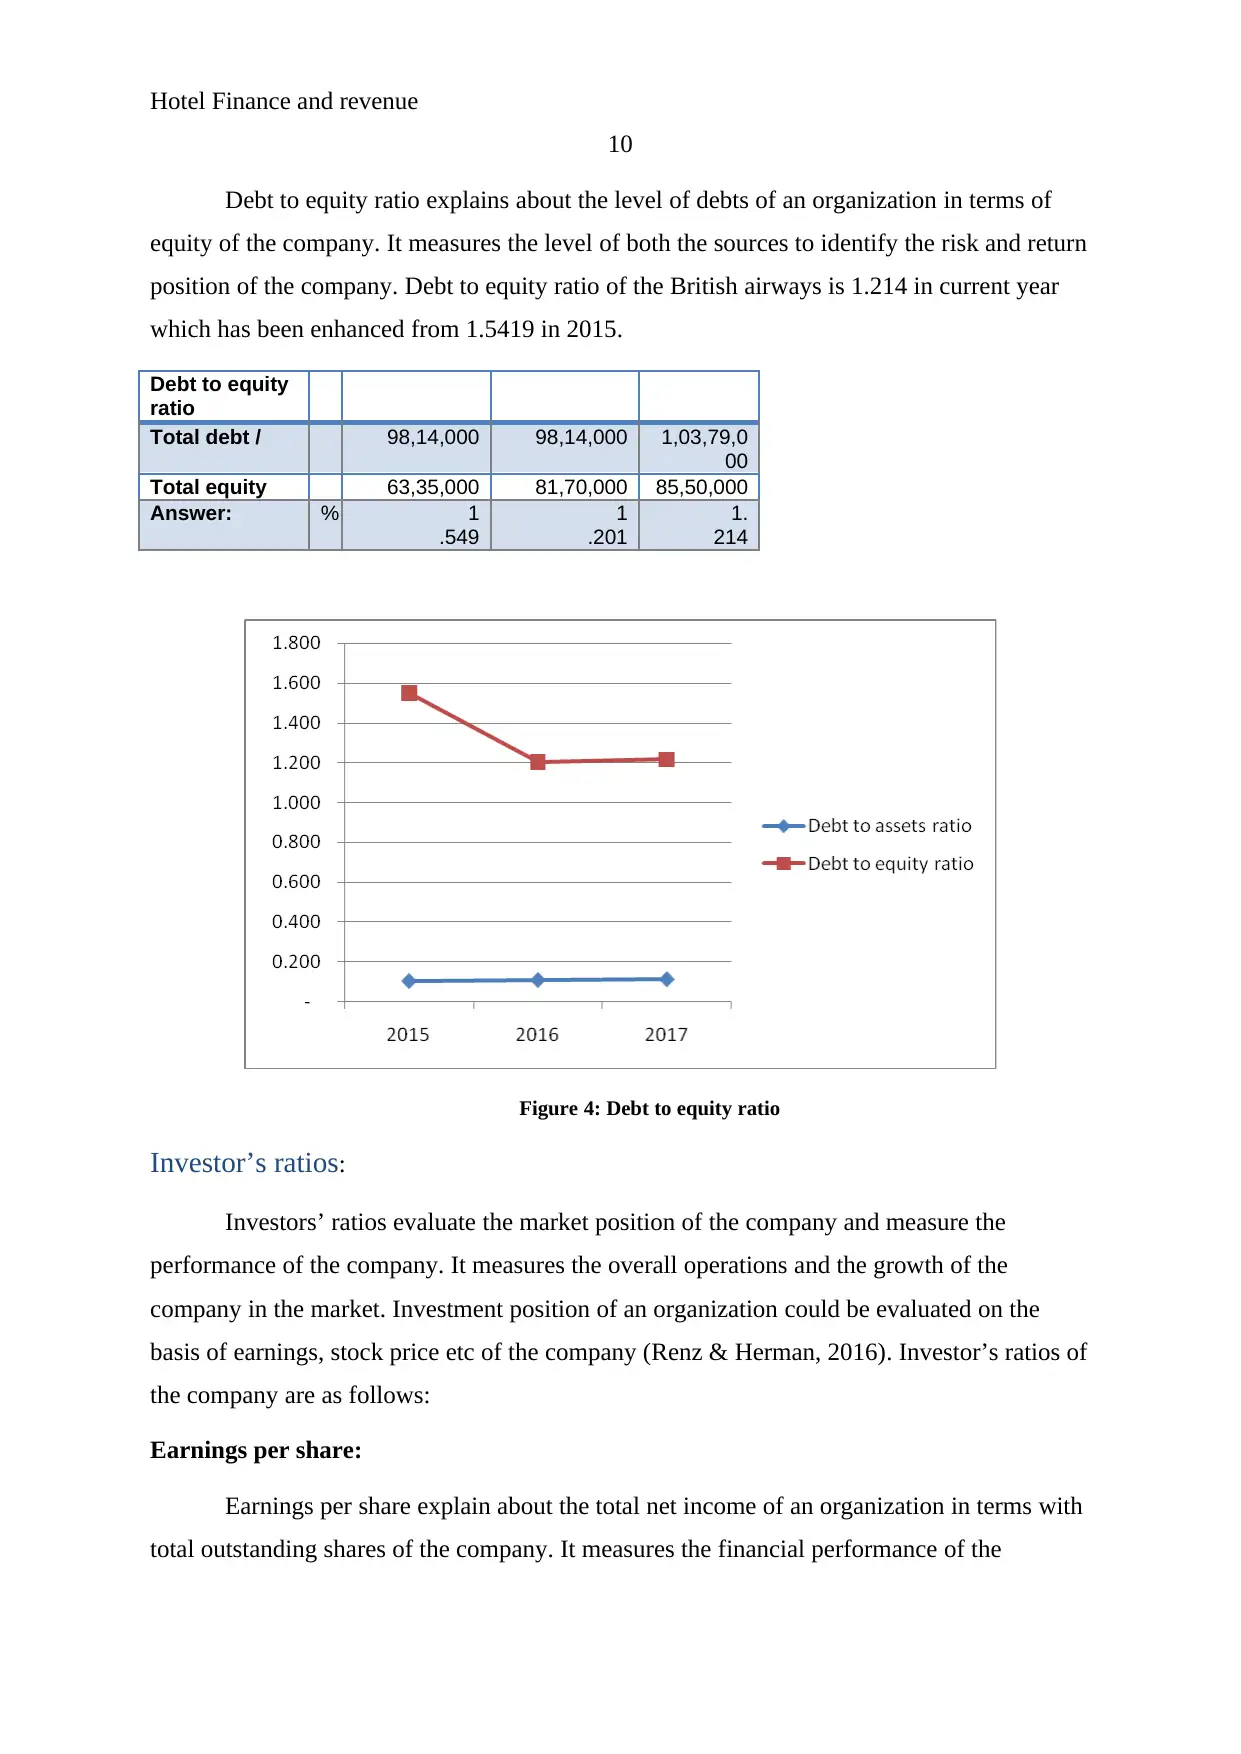
Debt to asset ratio:
Debt to asset ratio explains about the level of debts of an organization in terms of
assets of the company. It measures the level of both the sources to identify the risk and return
position of the company. Debt to assets ratio of the British airways is 0.112 in current year
which has been enhanced from 0.104 in 2015.
Debt to assets
ratio
Total debt / 98,14,000 98,14,000 1,03,79,0
00
total assets 9,44,08,000 8,99,97,000 9,23,33,0
00
Answer: %
0.104 0.109 0.112
(Titman, Keown & Martin, 2017)
Debt to equity ratio:
9
Figure 3: Liquidity ratio
Capital structure ratios:
Capital structure ratios evaluate the debt level, asset kevel and equity level of an
organization. It measures the overall operations and the growth of the company by using the
different sources through which the company has raised the funds. Capital structure position
of an organization could be evaluated on the basis of debt, assets and equity level of the
company (Lau, 2016). Capital structure ratios of the company are as follows:
Debt to asset ratio:
Debt to asset ratio explains about the level of debts of an organization in terms of
assets of the company. It measures the level of both the sources to identify the risk and return
position of the company. Debt to assets ratio of the British airways is 0.112 in current year
which has been enhanced from 0.104 in 2015.
Debt to assets
ratio
Total debt / 98,14,000 98,14,000 1,03,79,0
00
total assets 9,44,08,000 8,99,97,000 9,23,33,0
00
Answer: %
0.104 0.109 0.112
(Titman, Keown & Martin, 2017)
Debt to equity ratio:
Hotel Finance and revenue
10
Debt to equity ratio explains about the level of debts of an organization in terms of
equity of the company. It measures the level of both the sources to identify the risk and return
position of the company. Debt to equity ratio of the British airways is 1.214 in current year
which has been enhanced from 1.5419 in 2015.
Debt to equity
ratio
Total debt / 98,14,000 98,14,000 1,03,79,0
00
Total equity 63,35,000 81,70,000 85,50,000
Answer: % 1
.549
1
.201
1.
214
Figure 4: Debt to equity ratio
Investor’s ratios:
Investors’ ratios evaluate the market position of the company and measure the
performance of the company. It measures the overall operations and the growth of the
company in the market. Investment position of an organization could be evaluated on the
basis of earnings, stock price etc of the company (Renz & Herman, 2016). Investor’s ratios of
the company are as follows:
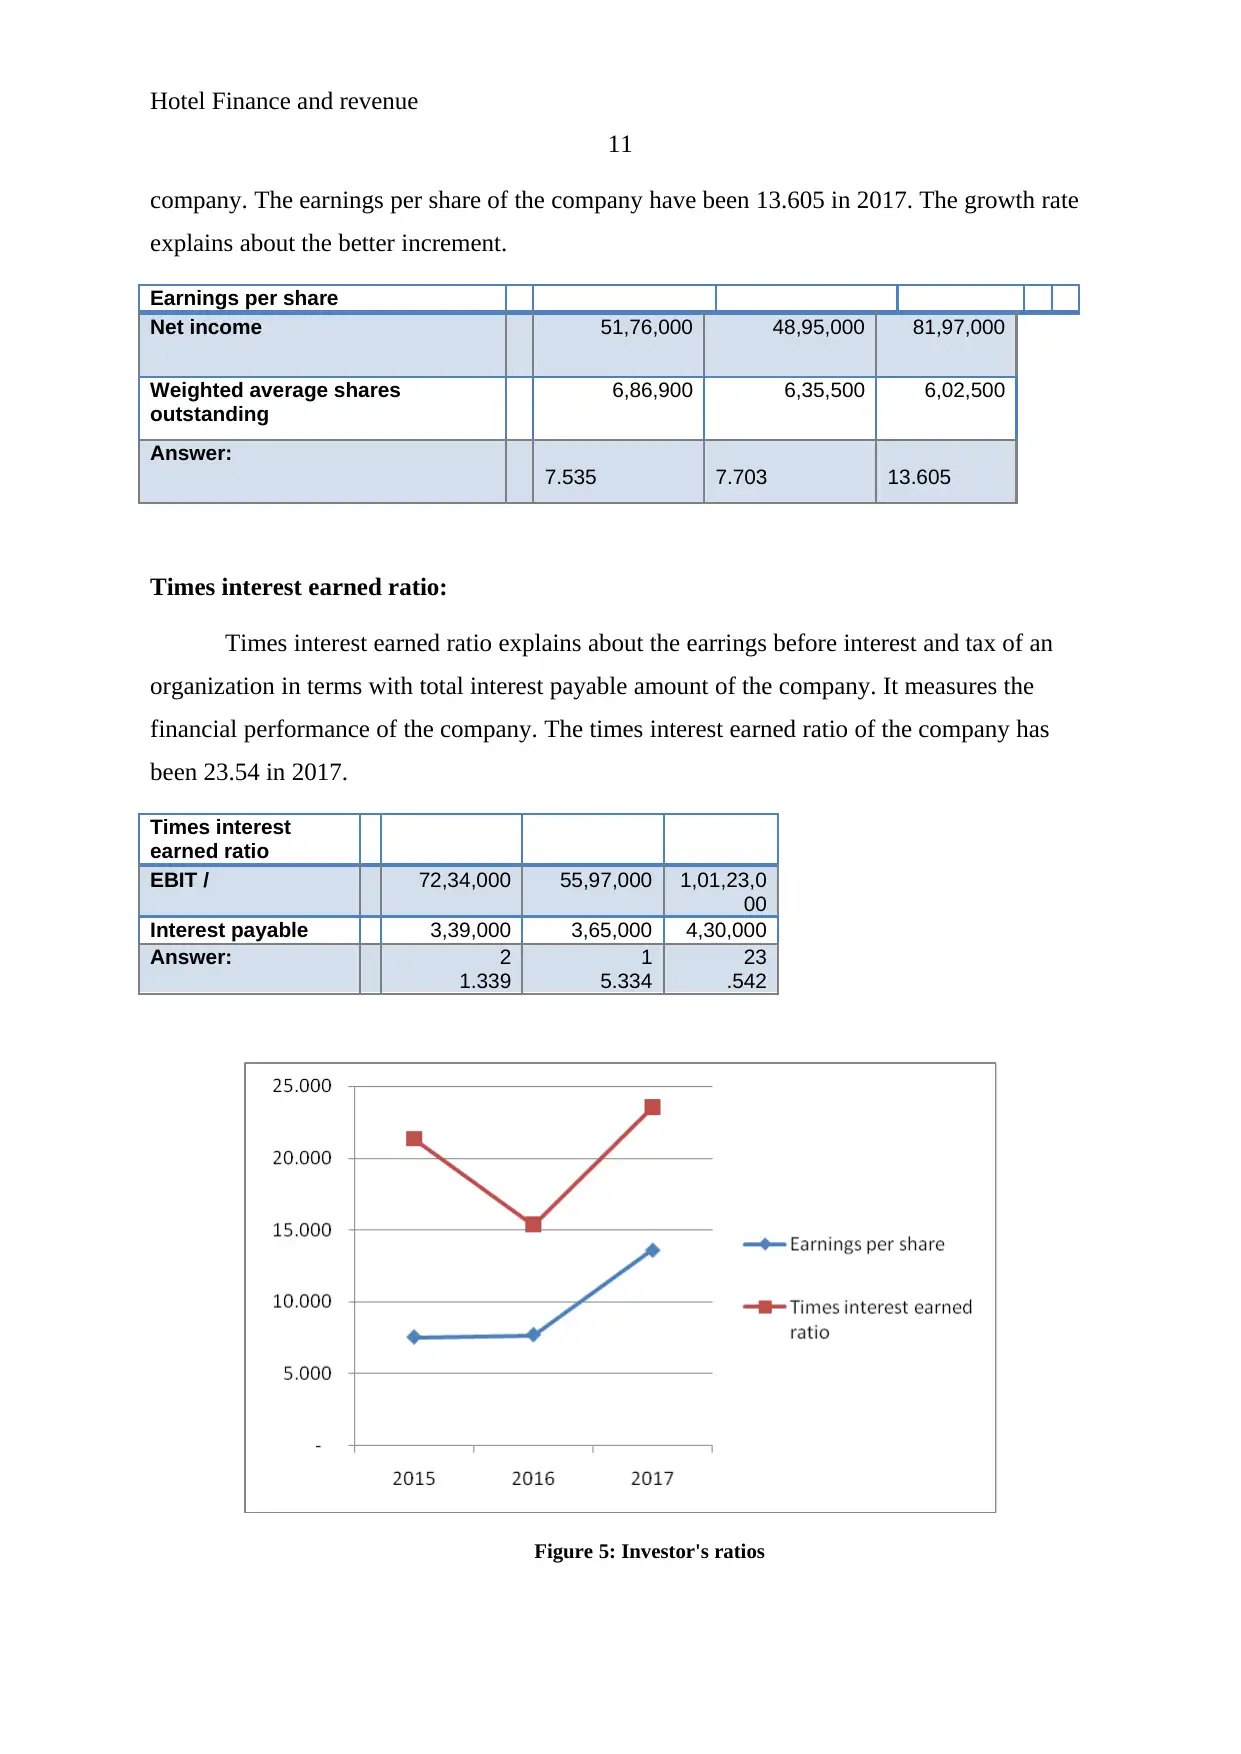
Earnings per share:
Earnings per share explain about the total net income of an organization in terms with
total outstanding shares of the company. It measures the financial performance of the
10
Debt to equity ratio explains about the level of debts of an organization in terms of
equity of the company. It measures the level of both the sources to identify the risk and return
position of the company. Debt to equity ratio of the British airways is 1.214 in current year
which has been enhanced from 1.5419 in 2015.
Debt to equity
ratio
Total debt / 98,14,000 98,14,000 1,03,79,0
00
Total equity 63,35,000 81,70,000 85,50,000
Answer: % 1
.549
1
.201
1.
214
Figure 4: Debt to equity ratio
Investor’s ratios:
Investors’ ratios evaluate the market position of the company and measure the
performance of the company. It measures the overall operations and the growth of the
company in the market. Investment position of an organization could be evaluated on the
basis of earnings, stock price etc of the company (Renz & Herman, 2016). Investor’s ratios of
the company are as follows:
Earnings per share:
Earnings per share explain about the total net income of an organization in terms with
total outstanding shares of the company. It measures the financial performance of the
Secure Best Marks with AI Grader
Need help grading? Try our AI Grader for instant feedback on your assignments.
Hotel Finance and revenue
11
company. The earnings per share of the company have been 13.605 in 2017. The growth rate
explains about the better increment.
Earnings per share
Net income 51,76,000 48,95,000 81,97,000
Weighted average shares
outstanding
6,86,900 6,35,500 6,02,500
Answer:
7.535 7.703 13.605
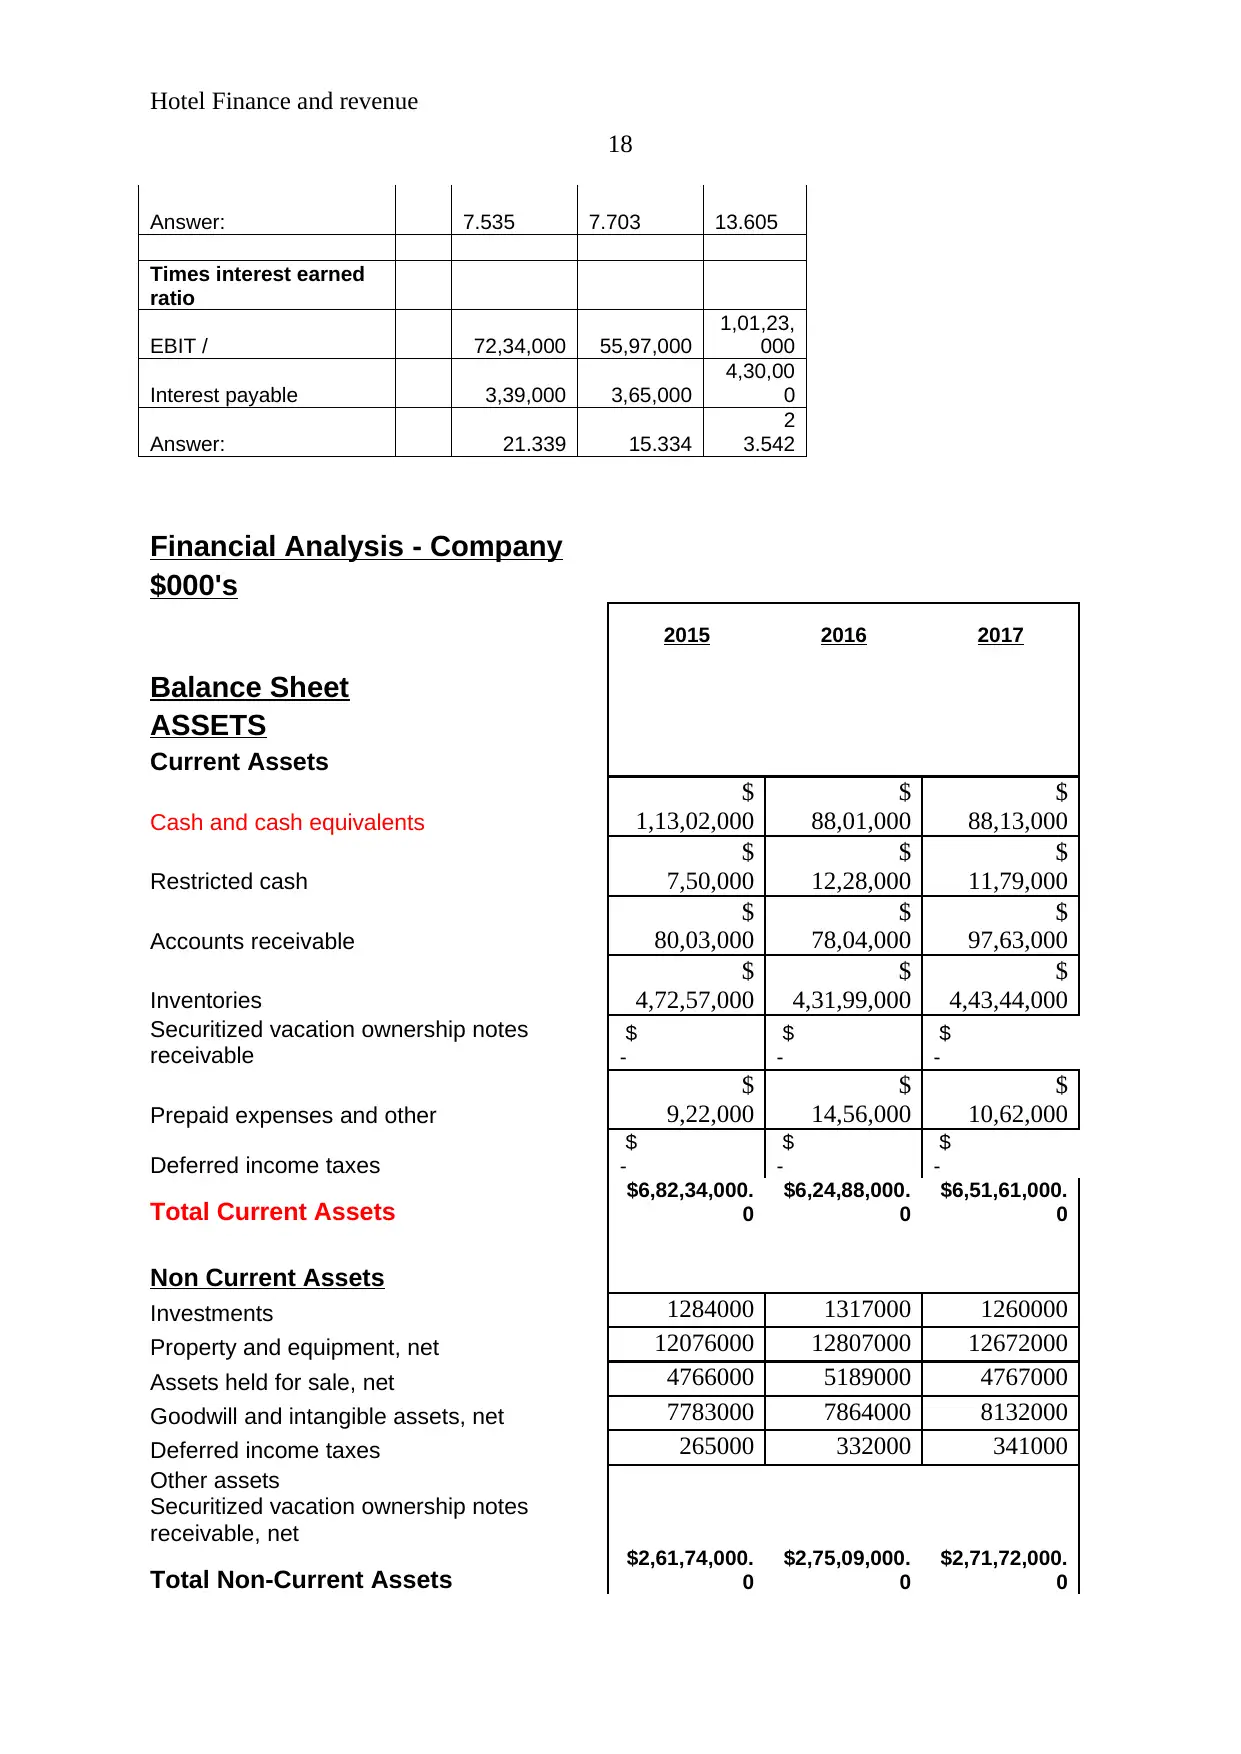
Times interest earned ratio:
Times interest earned ratio explains about the earrings before interest and tax of an
organization in terms with total interest payable amount of the company. It measures the
financial performance of the company. The times interest earned ratio of the company has
been 23.54 in 2017.
Times interest
earned ratio
EBIT / 72,34,000 55,97,000 1,01,23,0
00
Interest payable 3,39,000 3,65,000 4,30,000
Answer: 2
1.339
1
5.334
23
.542
Figure 5: Investor's ratios
11
company. The earnings per share of the company have been 13.605 in 2017. The growth rate
explains about the better increment.
Earnings per share
Net income 51,76,000 48,95,000 81,97,000
Weighted average shares
outstanding
6,86,900 6,35,500 6,02,500
Answer:
7.535 7.703 13.605
Times interest earned ratio:
Times interest earned ratio explains about the earrings before interest and tax of an
organization in terms with total interest payable amount of the company. It measures the
financial performance of the company. The times interest earned ratio of the company has
been 23.54 in 2017.
Times interest
earned ratio
EBIT / 72,34,000 55,97,000 1,01,23,0
00
Interest payable 3,39,000 3,65,000 4,30,000
Answer: 2
1.339
1
5.334
23
.542
Figure 5: Investor's ratios
Hotel Finance and revenue
12
Discussion:
On the basis of the above calculation and evaluation, it has been found that various
changes have occurred into the financial performance and position of the company in last 5
years. The profitability level of the company has been studied firstly and it has been found
that the enough profits are generated by the company. The level of the profits has also been
enhanced from last years in the current financial year of the company. Though, it has been
found that the company should focus on the operating expenses of the company which is
quite higher (Finkler et al, 2016). These changes would help the company to earn more. The
return on equity and return on asset ratio of the comapny explains that the equity level of the
company is quite lower and thus the return on equity of the company is quite higher than the
return on assets of the company.
Further, the efficiency ratios of the company have been evaluated which explains
about the efficient operations and position of the company. On the basis of calculations, it has
been found that the inventory turnover ratio of the company is quite higher which explains
about more working capital involvement of the company. So, the company should make few
changes into inventory policies so that the working capital involvement could be lower and
capital requirement could also be lower (Bekaert & Hodrick, 2017). In addition, the accounts
receivable turnover days of the company are quite competitive and it explains about
competitive position of the company.
In addition, the liquidity ratios of the company have been evaluated which explains
about the liquid position of the company. On the basis of calculations, it has been found that
the current liquidity ratio and quick ratios of the company has been lower form 2015 in 2017.
These changes are quite competitive and explain about the better position of the company.
Currently, the debt payment capability of the company is quite better in terms of industry.
Capital structure ratios have been discussed further. The capitals structure ratio of the
company has been evaluated which explains about the risk and return of the company. On the
basis of calculations, it has been found that the debt to equity level of the company is quite
higher which explains that the level of debt is more than equity level. These changes are quite
risky for the company. Though, the debt to asset level of the company is quite better and
explains about the competitive position (Vogel, 2014).
Hotel Finance and revenue
13
Lastly, the investor ratios have been discussed further. The investor ratio of the
company has been evaluated which explains about market position of the company. On the
basis of calculations, it has been found that the market position of the company is quite better
which explains that the investment opportunity of the company is quite attractive. The
company is offering good returns to its stockholders.
Conclusion and recommendation:
On the basis of the above findings and discussion, it has been found that the few
changes rare required to be done in the organization for the better performance of the
company. The company should maintain the performance and the position according to the
industry. Company is required t make the changes into its quite level. The equity level should
be improved by the company for the better position of the company. On the other hand,
inventory management policies are also required to be change to manage the working capital
of the company.
To conclude, the current financial performance of the company is quite competitive,
various positive changes have taken place into the performance of the company in last 5 years
which has made the position of the company more attractive. The investors are recommended
to make investment into the company for the great returns.
Paraphrase This Document
Need a fresh take? Get an instant paraphrase of this document with our AI Paraphraser
Hotel Finance and revenue
14
References:
Barney, J. B., &Hesterly, W. S. (2006). Strategic management and competitive advantage.
Upper Saddle River, NJ: Pearson Prentice Hall.
Barr, M. J., & McClellan, G. S. (2018). Budgets and financial management in higher
education. John Wiley & Sons.
Bekaert, G., & Hodrick, R. (2017). International financial management. Cambridge
University Press.
Bekaert, G., & Hodrick, R. (2017). International financial management. Cambridge
University Press.
Dewachter, H., Iania, L., Lyrio, M., & de Sola Perea, M. (2015). A macro-financial analysis
of the euro area sovereign bond market. Journal of Banking & Finance, 50, 308-325.
Finkler, S. A., Smith, D. L., Calabrese, T. D., & Purtell, R. M. (2016). Financial management
for public, health, and not-for-profit organizations. CQ Press.
Home. (2018). British Airways limited. (online). Reterived as on 27th April 2018 from
https://www.britishairways.com/travel/home/public/en_us
Inventors. (2018). Boeing co. (online). Reterived as on 27th April 2018 from
http://investors.boeing.com/investors/financial-reports/default.aspx.
Lau, C. (2016). Financial Management. Pearson.
Morningstar. (2018). Boeing co. (online). Reterived as on 27th April 2018 from
http://financials.morningstar.com/ratios/r.html?t=BA
Pearce, J. A., Robinson, R. B., & Subramanian, R. (2000). Strategic management:
Formulation, implementation, and control. Columbus, OH: Irwin/McGraw-Hill.
Renz, D. O., & Herman, R. D. 2016). The Jossey-Bass handbook of nonprofit leadership and
management. John Wiley & Sons.
Hotel Finance and revenue
15
Titman, S., Keown, A. J., & Martin, J. D. (2017). Financial management: Principles and
applications. Pearson.
Vogel, H. L. (2014). Entertainment industry economics: A guide for financial analysis.
Cambridge University Press.
Wang. Y, & Chung, Y. (2015). Hotel brand portfolio strategy. International Journal of
Contemporary Hospitality Management. 27(4). 561 – 584.
Yahoo finance. (2018). Boeing co. (online). Reterived as on 27th April 2018 from
https://finance.yahoo.com/quote/BA/
Hotel Finance and revenue
16
Appendix:
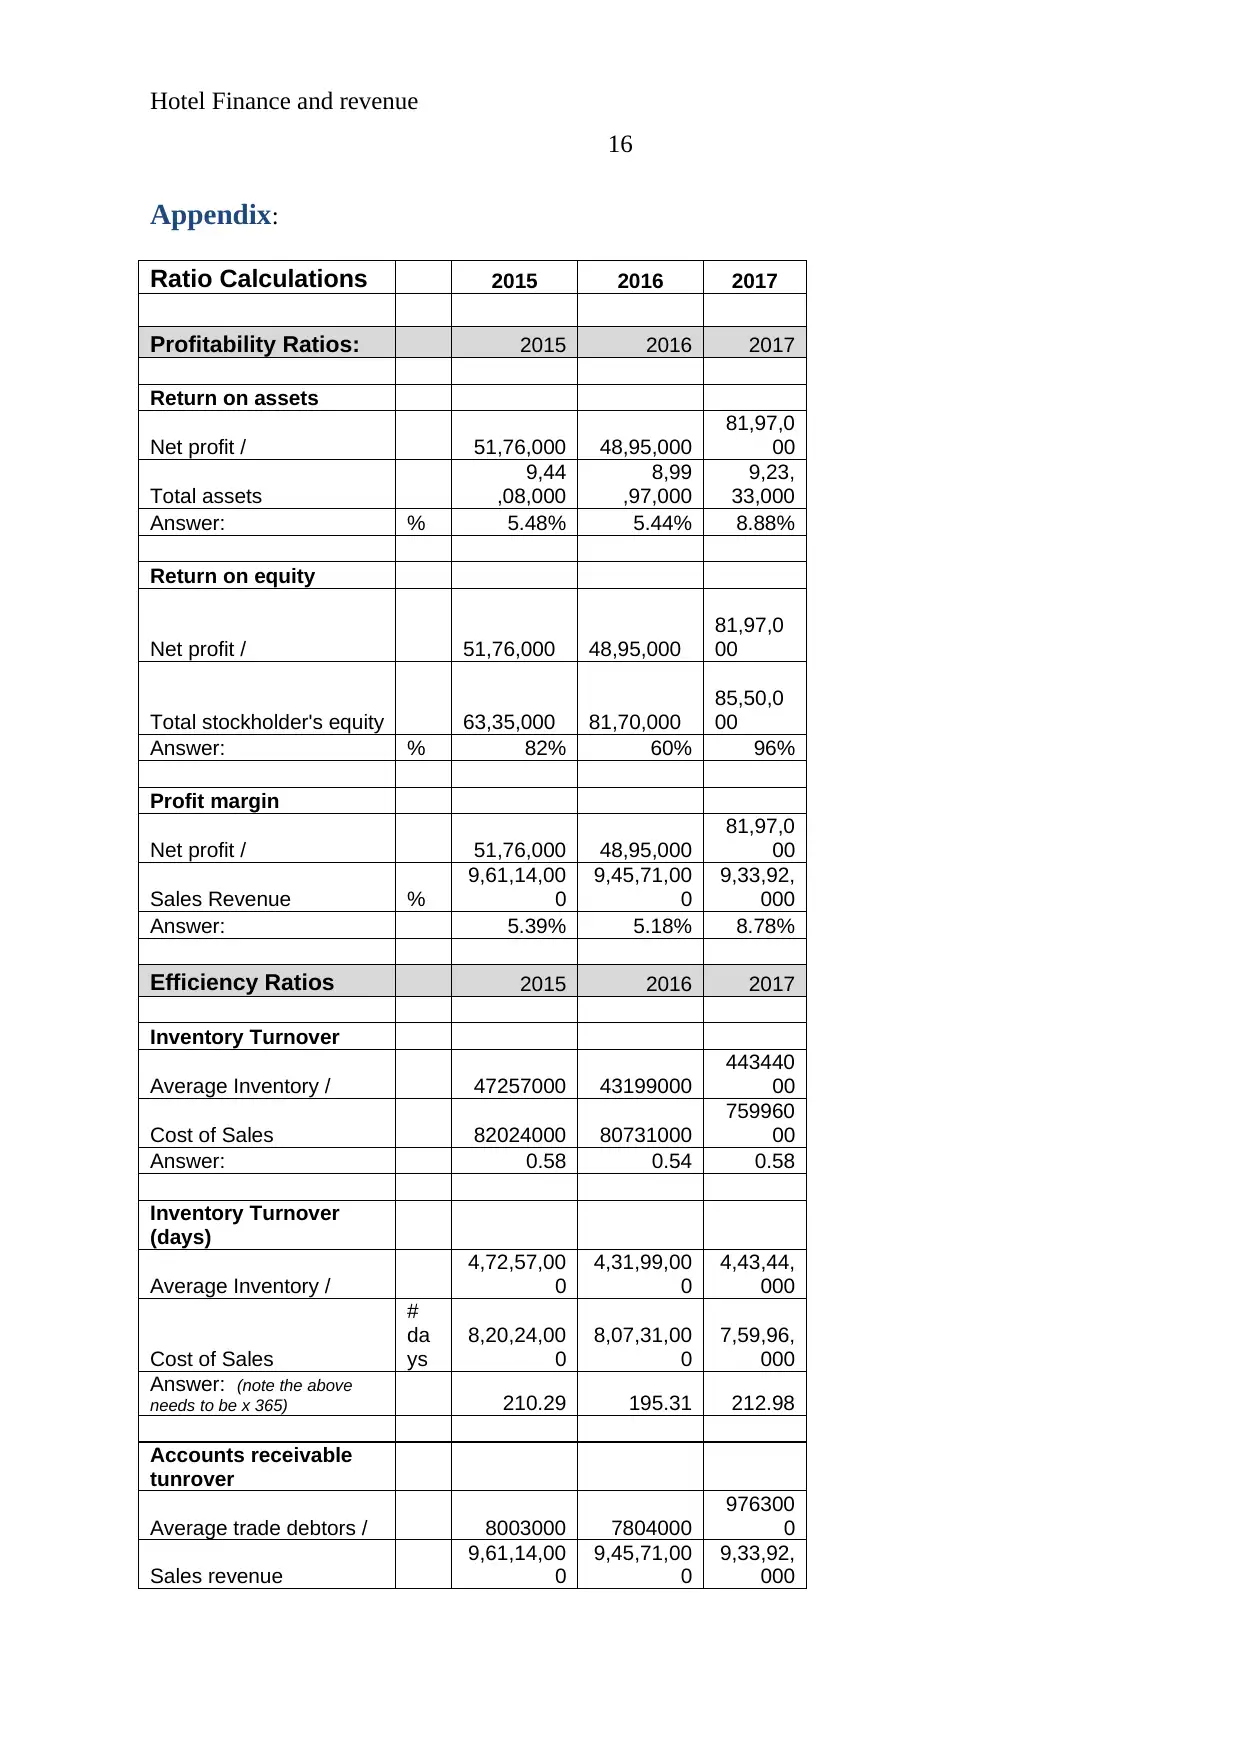
Ratio Calculations 2015 2016 2017
Profitability Ratios: 2015 2016 2017
Return on assets
Net profit / 51,76,000 48,95,000
81,97,0
00
Total assets
9,44
,08,000
8,99
,97,000
9,23,
33,000
Answer: % 5.48% 5.44% 8.88%
Return on equity
Net profit / 51,76,000 48,95,000
81,97,0
00
Total stockholder's equity 63,35,000 81,70,000
85,50,0
00
Answer: % 82% 60% 96%
Profit margin
Net profit / 51,76,000 48,95,000
81,97,0
00
Sales Revenue %
9,61,14,00
0
9,45,71,00
0
9,33,92,
000
Answer: 5.39% 5.18% 8.78%
Efficiency Ratios 2015 2016 2017
Inventory Turnover
Average Inventory / 47257000 43199000
443440
00
Cost of Sales 82024000 80731000
759960
00
Answer: 0.58 0.54 0.58
Inventory Turnover
(days)
Average Inventory /
4,72,57,00
0
4,31,99,00
0
4,43,44,
000
Cost of Sales
#
da
ys
8,20,24,00
0
8,07,31,00
0
7,59,96,
000
Answer: (note the above
needs to be x 365) 210.29 195.31 212.98
Accounts receivable
tunrover
Average trade debtors / 8003000 7804000
976300
0
Sales revenue
9,61,14,00
0
9,45,71,00
0
9,33,92,
000
16
Appendix:
Ratio Calculations 2015 2016 2017
Profitability Ratios: 2015 2016 2017
Return on assets
Net profit / 51,76,000 48,95,000
81,97,0
00
Total assets
9,44
,08,000
8,99
,97,000
9,23,
33,000
Answer: % 5.48% 5.44% 8.88%
Return on equity
Net profit / 51,76,000 48,95,000
81,97,0
00
Total stockholder's equity 63,35,000 81,70,000
85,50,0
00
Answer: % 82% 60% 96%
Profit margin
Net profit / 51,76,000 48,95,000
81,97,0
00
Sales Revenue %
9,61,14,00
0
9,45,71,00
0
9,33,92,
000
Answer: 5.39% 5.18% 8.78%
Efficiency Ratios 2015 2016 2017
Inventory Turnover
Average Inventory / 47257000 43199000
443440
00
Cost of Sales 82024000 80731000
759960
00
Answer: 0.58 0.54 0.58
Inventory Turnover
(days)
Average Inventory /
4,72,57,00
0
4,31,99,00
0
4,43,44,
000
Cost of Sales
#
da
ys
8,20,24,00
0
8,07,31,00
0
7,59,96,
000
Answer: (note the above
needs to be x 365) 210.29 195.31 212.98
Accounts receivable
tunrover
Average trade debtors / 8003000 7804000
976300
0
Sales revenue
9,61,14,00
0
9,45,71,00
0
9,33,92,
000
Secure Best Marks with AI Grader
Need help grading? Try our AI Grader for instant feedback on your assignments.
Hotel Finance and revenue
17
Answer: 0.083 0.083 0.105
Receivables Turnover
(days)
Average trade debtors /
80,
03,000
78,
04,000
97,6
3,000
Sales revenue (note used
operating revenue)
#
da
ys
9,61
,14,000
9,45
,71,000
9,33,
92,000
Answer: (note the above
needs to be x 365) 30.39 30.12 38.16
Liquidity Ratios 2015 2016 2017
Current Ratio
Current Assets /
6,82,34,00
0
6,24,88,00
0
6,51,61,
000
Current liabilities
5,04,12,00
0
5,01,34,00
0
5,62,69,
000
Answer: 1.35 1.25 1.16
Quick ratio
Current Assets -
Inventory /
2,09,77,00
0
1,92,89,00
0
2,08,17,
000
Current Liabilities
5,04,12,00
0
5,01,34,00
0
5,62,69,
000
Answer: 0.42 0.38 0.37
Capital Structure
Ratios 2015 2016 2017
Debt to assets ratio
Total debt / 98,14,000 98,14,000
1,03,79,
000
total assets
9,44,08,00
0
8,99,97,00
0
9,23,33,
000
Answer: % 0.104 0.109 0.112
Debt to equity ratio
Total debt / 98,14,000 98,14,000
1,03,79,
000
Total equity 63,35,000 81,70,000
85,50,0
00
Answer: % 1.549 1.201 1.214
Investor's Ratios 2015 2016 2017
Earnings per share
Net income 51,76,000 48,95,000
81,97,0
00
Weighted average
shares outstanding 6,86,900 6,35,500
6,02,50
0
Hotel Finance and revenue
18
Answer: 7.535 7.703 13.605
Times interest earned
ratio
EBIT / 72,34,000 55,97,000
1,01,23,
000
Interest payable 3,39,000 3,65,000
4,30,00
0
Answer: 21.339 15.334
2
3.542
Financial Analysis - Company
$000's
2015 2016 2017
Balance Sheet
ASSETS
Current Assets
Cash and cash equivalents
$
1,13,02,000
$
88,01,000
$
88,13,000
Restricted cash
$
7,50,000
$
12,28,000
$
11,79,000
Accounts receivable
$
80,03,000
$
78,04,000
$
97,63,000
Inventories
$
4,72,57,000
$
4,31,99,000
$
4,43,44,000
Securitized vacation ownership notes
receivable
$
-
$
-
$
-
Prepaid expenses and other
$
9,22,000
$
14,56,000
$
10,62,000
Deferred income taxes
$
-
$
-
$
-
Total Current Assets $6,82,34,000.
0
$6,24,88,000.
0
$6,51,61,000.
0
Non Current Assets
Investments 1284000 1317000 1260000
Property and equipment, net 12076000 12807000 12672000
Assets held for sale, net 4766000 5189000 4767000
Goodwill and intangible assets, net 7783000 7864000 8132000
Deferred income taxes 265000 332000 341000
Other assets
Securitized vacation ownership notes
receivable, net
Total Non-Current Assets $2,61,74,000.
0
$2,75,09,000.
0
$2,71,72,000.
0
Hotel Finance and revenue
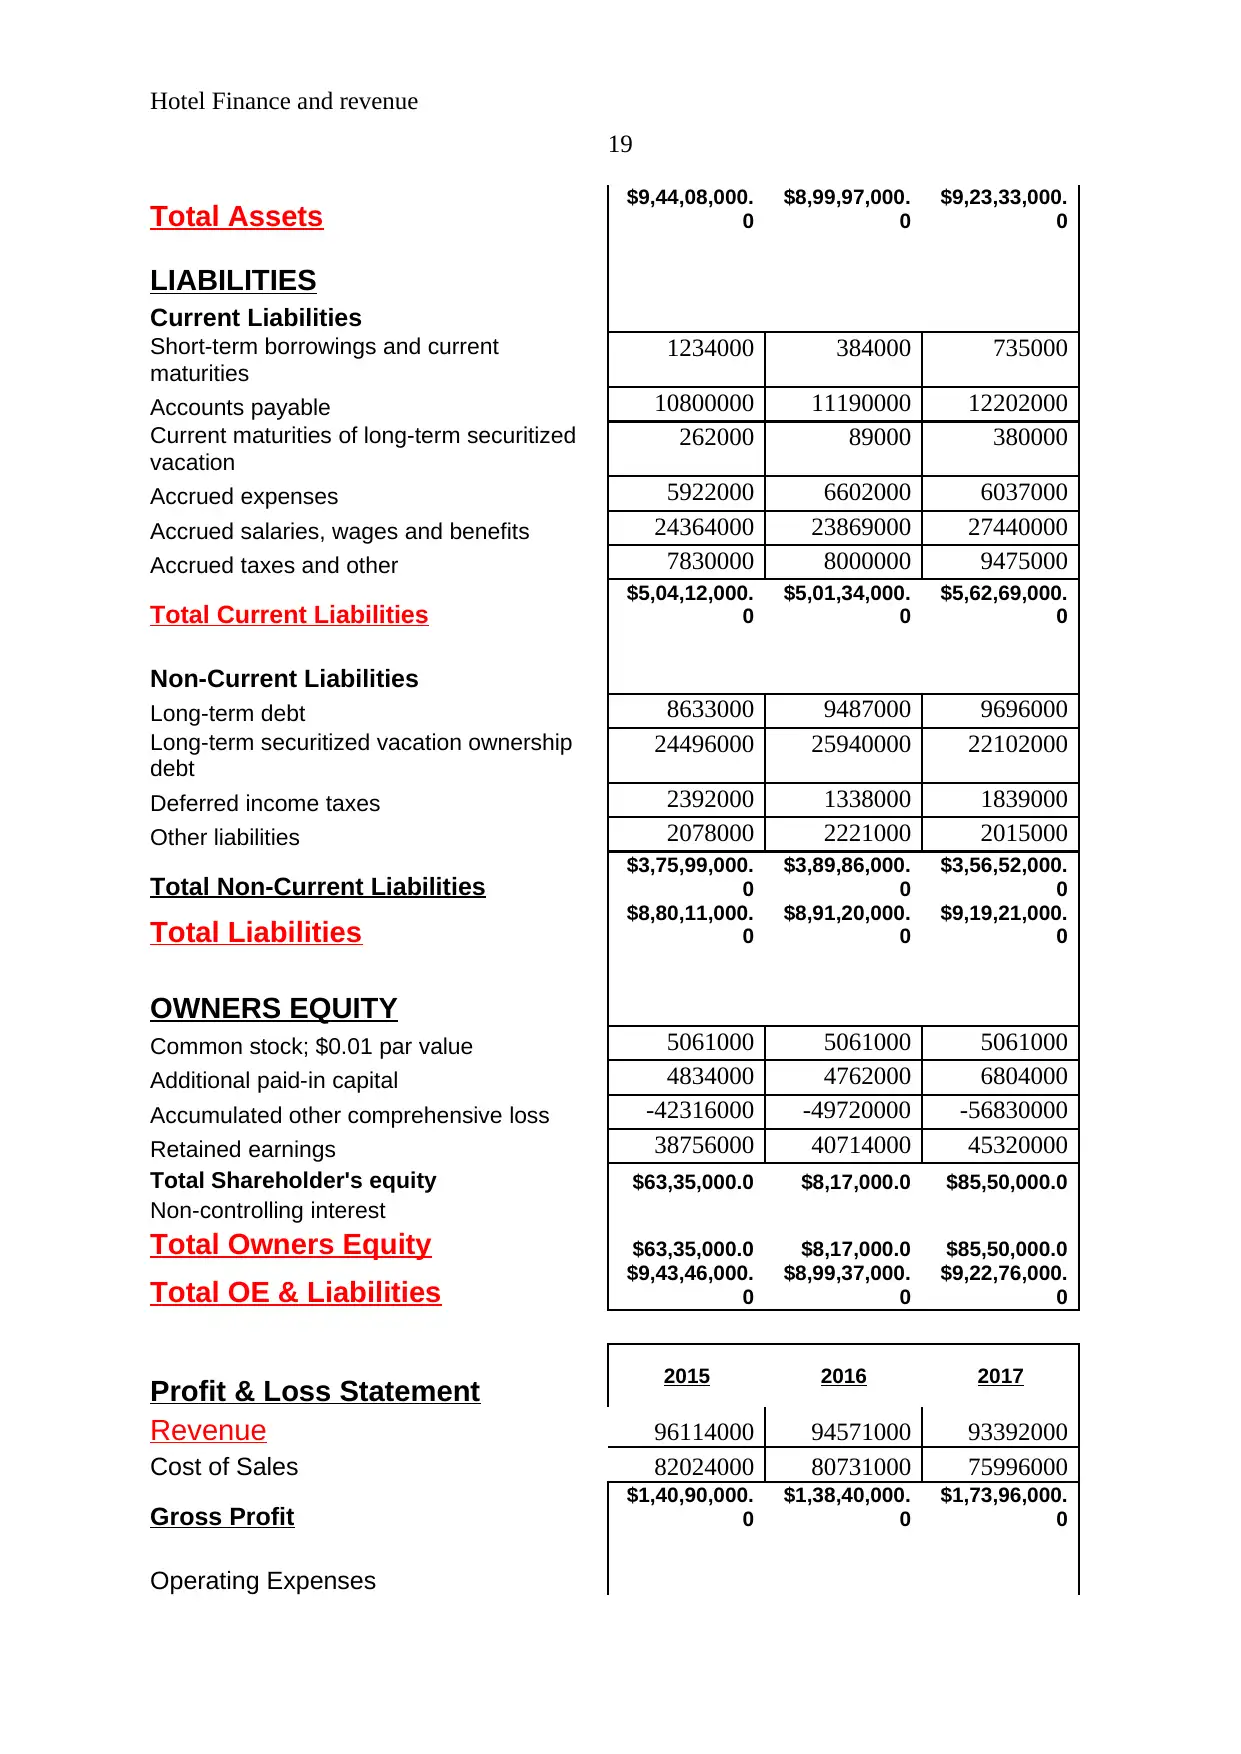
19
Total Assets $9,44,08,000.
0
$8,99,97,000.
0
$9,23,33,000.
0
LIABILITIES
Current Liabilities
Short-term borrowings and current
maturities
1234000 384000 735000
Accounts payable 10800000 11190000 12202000
Current maturities of long-term securitized
vacation
262000 89000 380000
Accrued expenses 5922000 6602000 6037000
Accrued salaries, wages and benefits 24364000 23869000 27440000
Accrued taxes and other 7830000 8000000 9475000
Total Current Liabilities $5,04,12,000.
0
$5,01,34,000.
0
$5,62,69,000.
0
Non-Current Liabilities
Long-term debt 8633000 9487000 9696000
Long-term securitized vacation ownership
debt
24496000 25940000 22102000
Deferred income taxes 2392000 1338000 1839000
Other liabilities 2078000 2221000 2015000
Total Non-Current Liabilities $3,75,99,000.
0
$3,89,86,000.
0
$3,56,52,000.
0
Total Liabilities $8,80,11,000.
0
$8,91,20,000.
0
$9,19,21,000.
0
OWNERS EQUITY
Common stock; $0.01 par value 5061000 5061000 5061000
Additional paid-in capital 4834000 4762000 6804000
Accumulated other comprehensive loss -42316000 -49720000 -56830000
Retained earnings 38756000 40714000 45320000
Total Shareholder's equity $63,35,000.0 $8,17,000.0 $85,50,000.0
Non-controlling interest
Total Owners Equity $63,35,000.0 $8,17,000.0 $85,50,000.0
Total OE & Liabilities $9,43,46,000.
0
$8,99,37,000.
0
$9,22,76,000.
0
2015 2016 2017
Profit & Loss Statement
Revenue 96114000 94571000 93392000
Cost of Sales 82024000 80731000 75996000
Gross Profit $1,40,90,000.
0
$1,38,40,000.
0
$1,73,96,000.
0
Operating Expenses
Paraphrase This Document
Need a fresh take? Get an instant paraphrase of this document with our AI Paraphraser
Hotel Finance and revenue
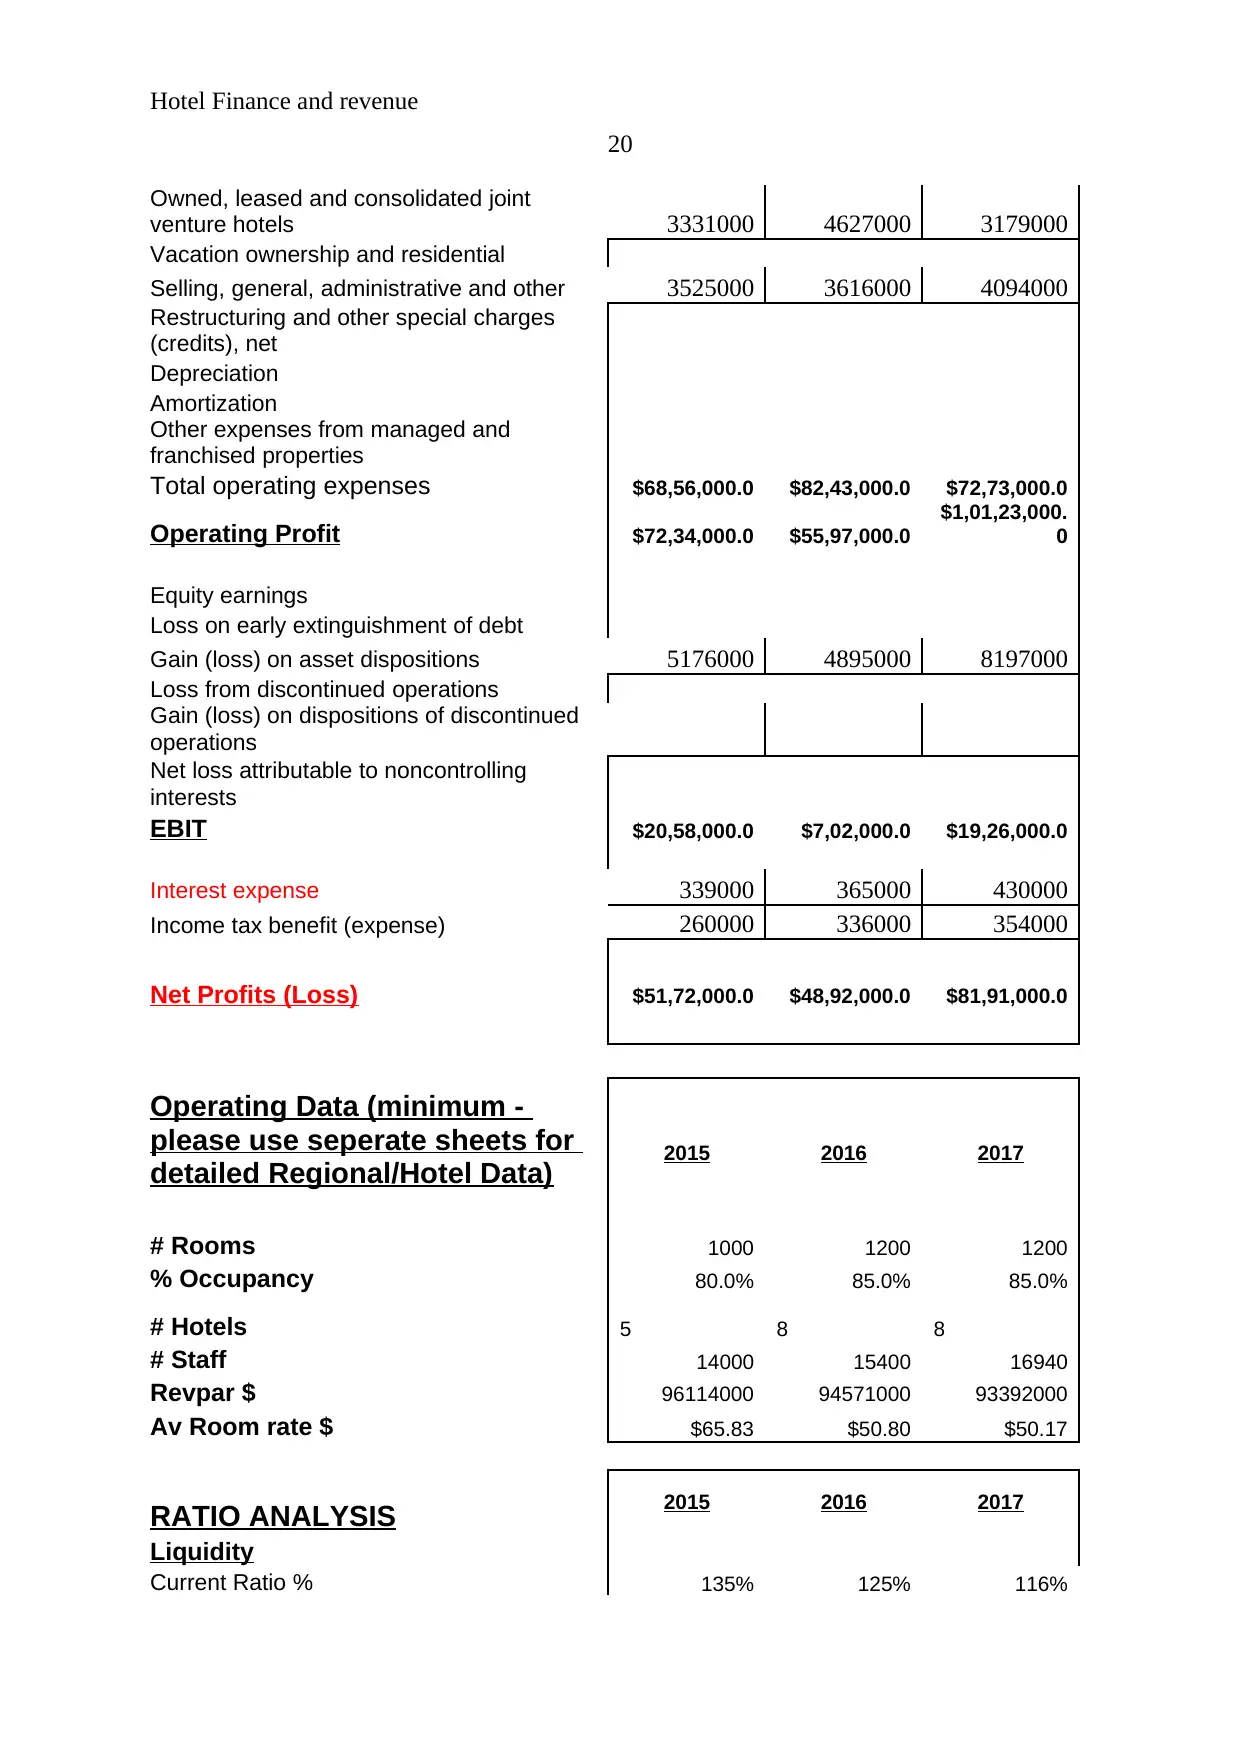
20
Owned, leased and consolidated joint
venture hotels 3331000 4627000 3179000
Vacation ownership and residential
Selling, general, administrative and other 3525000 3616000 4094000
Restructuring and other special charges
(credits), net
Depreciation
Amortization
Other expenses from managed and
franchised properties
Total operating expenses $68,56,000.0 $82,43,000.0 $72,73,000.0
Operating Profit $72,34,000.0 $55,97,000.0
$1,01,23,000.
0
Equity earnings
Loss on early extinguishment of debt
Gain (loss) on asset dispositions 5176000 4895000 8197000
Loss from discontinued operations
Gain (loss) on dispositions of discontinued
operations
Net loss attributable to noncontrolling
interests
EBIT $20,58,000.0 $7,02,000.0 $19,26,000.0
Interest expense 339000 365000 430000
Income tax benefit (expense) 260000 336000 354000
Net Profits (Loss) $51,72,000.0 $48,92,000.0 $81,91,000.0
Operating Data (minimum -
please use seperate sheets for
detailed Regional/Hotel Data) 2015 2016 2017
# Rooms 1000 1200 1200
% Occupancy 80.0% 85.0% 85.0%
# Hotels 5 8 8
# Staff 14000 15400 16940
Revpar $ 96114000 94571000 93392000
Av Room rate $ $65.83 $50.80 $50.17
2015 2016 2017
RATIO ANALYSIS
Liquidity
Current Ratio % 135% 125% 116%
Hotel Finance and revenue
21
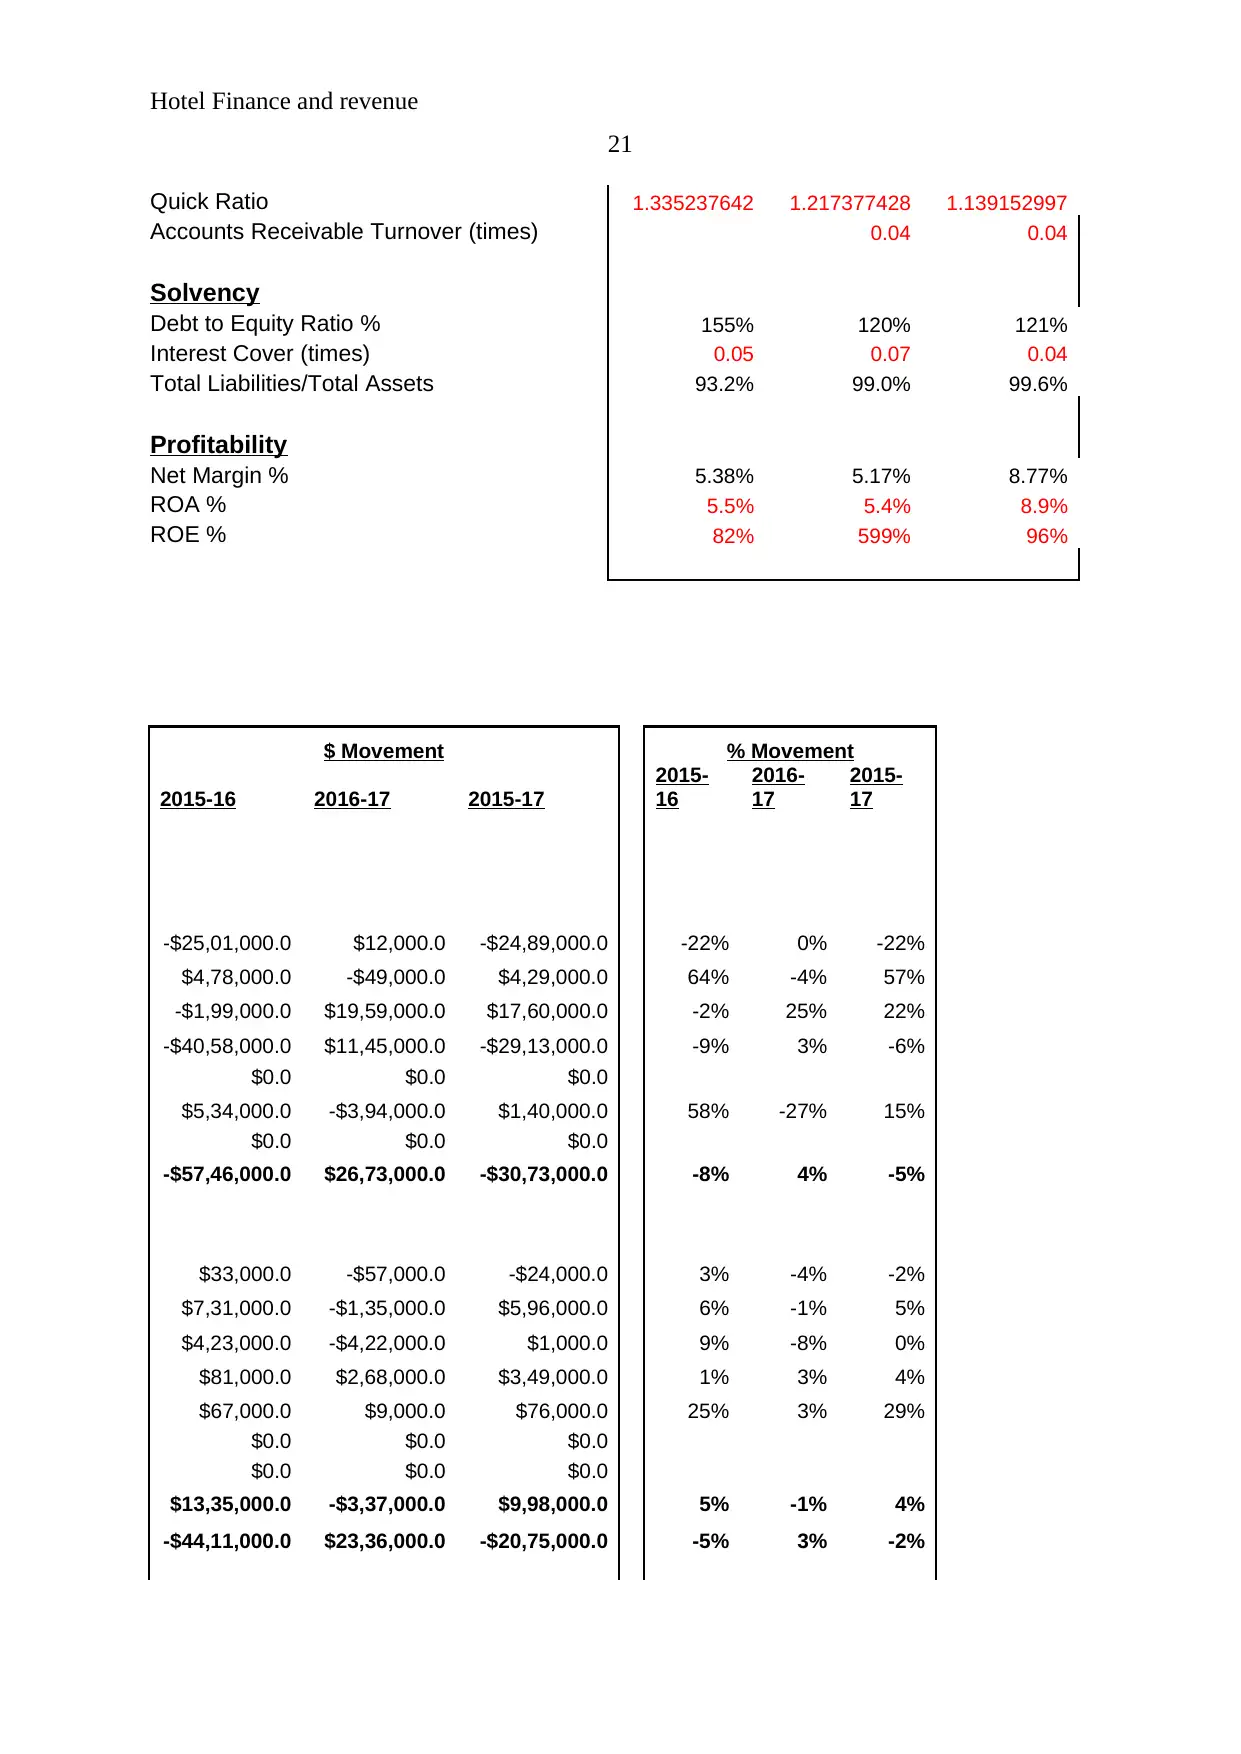
Quick Ratio 1.335237642 1.217377428 1.139152997
Accounts Receivable Turnover (times) 0.04 0.04
Solvency
Debt to Equity Ratio % 155% 120% 121%
Interest Cover (times) 0.05 0.07 0.04
Total Liabilities/Total Assets 93.2% 99.0% 99.6%
Profitability
Net Margin % 5.38% 5.17% 8.77%
ROA % 5.5% 5.4% 8.9%
ROE % 82% 599% 96%
$ Movement % Movement
2015-16 2016-17 2015-17
2015-
16
2016-
17
2015-
17
-$25,01,000.0 $12,000.0 -$24,89,000.0 -22% 0% -22%
$4,78,000.0 -$49,000.0 $4,29,000.0 64% -4% 57%
-$1,99,000.0 $19,59,000.0 $17,60,000.0 -2% 25% 22%
-$40,58,000.0 $11,45,000.0 -$29,13,000.0 -9% 3% -6%
$0.0 $0.0 $0.0
$5,34,000.0 -$3,94,000.0 $1,40,000.0 58% -27% 15%
$0.0 $0.0 $0.0
-$57,46,000.0 $26,73,000.0 -$30,73,000.0 -8% 4% -5%
$33,000.0 -$57,000.0 -$24,000.0 3% -4% -2%
$7,31,000.0 -$1,35,000.0 $5,96,000.0 6% -1% 5%
$4,23,000.0 -$4,22,000.0 $1,000.0 9% -8% 0%
$81,000.0 $2,68,000.0 $3,49,000.0 1% 3% 4%
$67,000.0 $9,000.0 $76,000.0 25% 3% 29%
$0.0 $0.0 $0.0
$0.0 $0.0 $0.0
$13,35,000.0 -$3,37,000.0 $9,98,000.0 5% -1% 4%
-$44,11,000.0 $23,36,000.0 -$20,75,000.0 -5% 3% -2%
21
Quick Ratio 1.335237642 1.217377428 1.139152997
Accounts Receivable Turnover (times) 0.04 0.04
Solvency
Debt to Equity Ratio % 155% 120% 121%
Interest Cover (times) 0.05 0.07 0.04
Total Liabilities/Total Assets 93.2% 99.0% 99.6%
Profitability
Net Margin % 5.38% 5.17% 8.77%
ROA % 5.5% 5.4% 8.9%
ROE % 82% 599% 96%
$ Movement % Movement
2015-16 2016-17 2015-17
2015-
16
2016-
17
2015-
17
-$25,01,000.0 $12,000.0 -$24,89,000.0 -22% 0% -22%
$4,78,000.0 -$49,000.0 $4,29,000.0 64% -4% 57%
-$1,99,000.0 $19,59,000.0 $17,60,000.0 -2% 25% 22%
-$40,58,000.0 $11,45,000.0 -$29,13,000.0 -9% 3% -6%
$0.0 $0.0 $0.0
$5,34,000.0 -$3,94,000.0 $1,40,000.0 58% -27% 15%
$0.0 $0.0 $0.0
-$57,46,000.0 $26,73,000.0 -$30,73,000.0 -8% 4% -5%
$33,000.0 -$57,000.0 -$24,000.0 3% -4% -2%
$7,31,000.0 -$1,35,000.0 $5,96,000.0 6% -1% 5%
$4,23,000.0 -$4,22,000.0 $1,000.0 9% -8% 0%
$81,000.0 $2,68,000.0 $3,49,000.0 1% 3% 4%
$67,000.0 $9,000.0 $76,000.0 25% 3% 29%
$0.0 $0.0 $0.0
$0.0 $0.0 $0.0
$13,35,000.0 -$3,37,000.0 $9,98,000.0 5% -1% 4%
-$44,11,000.0 $23,36,000.0 -$20,75,000.0 -5% 3% -2%
Hotel Finance and revenue
22
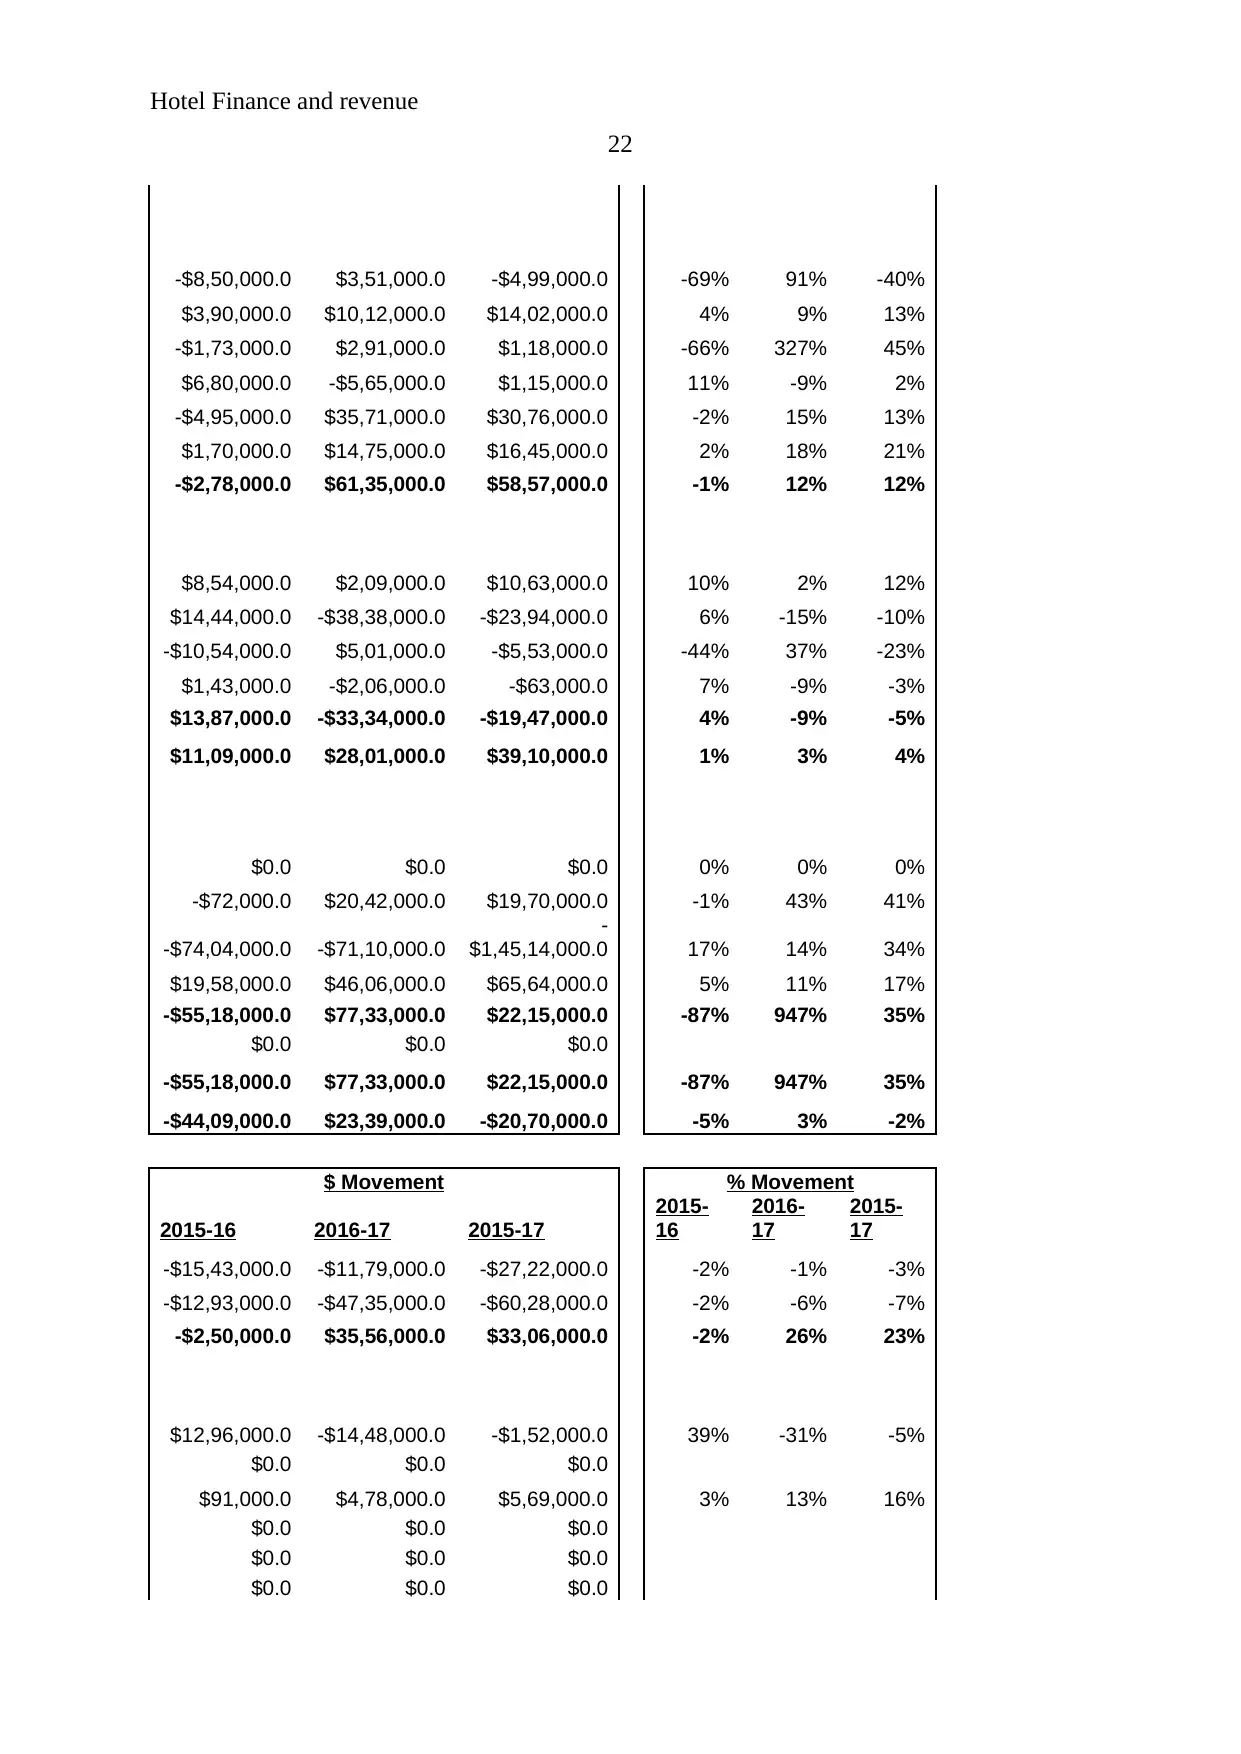
-$8,50,000.0 $3,51,000.0 -$4,99,000.0 -69% 91% -40%
$3,90,000.0 $10,12,000.0 $14,02,000.0 4% 9% 13%
-$1,73,000.0 $2,91,000.0 $1,18,000.0 -66% 327% 45%
$6,80,000.0 -$5,65,000.0 $1,15,000.0 11% -9% 2%
-$4,95,000.0 $35,71,000.0 $30,76,000.0 -2% 15% 13%
$1,70,000.0 $14,75,000.0 $16,45,000.0 2% 18% 21%
-$2,78,000.0 $61,35,000.0 $58,57,000.0 -1% 12% 12%
$8,54,000.0 $2,09,000.0 $10,63,000.0 10% 2% 12%
$14,44,000.0 -$38,38,000.0 -$23,94,000.0 6% -15% -10%
-$10,54,000.0 $5,01,000.0 -$5,53,000.0 -44% 37% -23%
$1,43,000.0 -$2,06,000.0 -$63,000.0 7% -9% -3%
$13,87,000.0 -$33,34,000.0 -$19,47,000.0 4% -9% -5%
$11,09,000.0 $28,01,000.0 $39,10,000.0 1% 3% 4%
$0.0 $0.0 $0.0 0% 0% 0%
-$72,000.0 $20,42,000.0 $19,70,000.0 -1% 43% 41%
-$74,04,000.0 -$71,10,000.0
-
$1,45,14,000.0 17% 14% 34%
$19,58,000.0 $46,06,000.0 $65,64,000.0 5% 11% 17%
-$55,18,000.0 $77,33,000.0 $22,15,000.0 -87% 947% 35%
$0.0 $0.0 $0.0
-$55,18,000.0 $77,33,000.0 $22,15,000.0 -87% 947% 35%
-$44,09,000.0 $23,39,000.0 -$20,70,000.0 -5% 3% -2%
$ Movement % Movement
2015-16 2016-17 2015-17
2015-
16
2016-
17
2015-
17
-$15,43,000.0 -$11,79,000.0 -$27,22,000.0 -2% -1% -3%
-$12,93,000.0 -$47,35,000.0 -$60,28,000.0 -2% -6% -7%
-$2,50,000.0 $35,56,000.0 $33,06,000.0 -2% 26% 23%
$12,96,000.0 -$14,48,000.0 -$1,52,000.0 39% -31% -5%
$0.0 $0.0 $0.0
$91,000.0 $4,78,000.0 $5,69,000.0 3% 13% 16%
$0.0 $0.0 $0.0
$0.0 $0.0 $0.0
$0.0 $0.0 $0.0
22
-$8,50,000.0 $3,51,000.0 -$4,99,000.0 -69% 91% -40%
$3,90,000.0 $10,12,000.0 $14,02,000.0 4% 9% 13%
-$1,73,000.0 $2,91,000.0 $1,18,000.0 -66% 327% 45%
$6,80,000.0 -$5,65,000.0 $1,15,000.0 11% -9% 2%
-$4,95,000.0 $35,71,000.0 $30,76,000.0 -2% 15% 13%
$1,70,000.0 $14,75,000.0 $16,45,000.0 2% 18% 21%
-$2,78,000.0 $61,35,000.0 $58,57,000.0 -1% 12% 12%
$8,54,000.0 $2,09,000.0 $10,63,000.0 10% 2% 12%
$14,44,000.0 -$38,38,000.0 -$23,94,000.0 6% -15% -10%
-$10,54,000.0 $5,01,000.0 -$5,53,000.0 -44% 37% -23%
$1,43,000.0 -$2,06,000.0 -$63,000.0 7% -9% -3%
$13,87,000.0 -$33,34,000.0 -$19,47,000.0 4% -9% -5%
$11,09,000.0 $28,01,000.0 $39,10,000.0 1% 3% 4%
$0.0 $0.0 $0.0 0% 0% 0%
-$72,000.0 $20,42,000.0 $19,70,000.0 -1% 43% 41%
-$74,04,000.0 -$71,10,000.0
-
$1,45,14,000.0 17% 14% 34%
$19,58,000.0 $46,06,000.0 $65,64,000.0 5% 11% 17%
-$55,18,000.0 $77,33,000.0 $22,15,000.0 -87% 947% 35%
$0.0 $0.0 $0.0
-$55,18,000.0 $77,33,000.0 $22,15,000.0 -87% 947% 35%
-$44,09,000.0 $23,39,000.0 -$20,70,000.0 -5% 3% -2%
$ Movement % Movement
2015-16 2016-17 2015-17
2015-
16
2016-
17
2015-
17
-$15,43,000.0 -$11,79,000.0 -$27,22,000.0 -2% -1% -3%
-$12,93,000.0 -$47,35,000.0 -$60,28,000.0 -2% -6% -7%
-$2,50,000.0 $35,56,000.0 $33,06,000.0 -2% 26% 23%
$12,96,000.0 -$14,48,000.0 -$1,52,000.0 39% -31% -5%
$0.0 $0.0 $0.0
$91,000.0 $4,78,000.0 $5,69,000.0 3% 13% 16%
$0.0 $0.0 $0.0
$0.0 $0.0 $0.0
$0.0 $0.0 $0.0
Secure Best Marks with AI Grader
Need help grading? Try our AI Grader for instant feedback on your assignments.
Hotel Finance and revenue
23
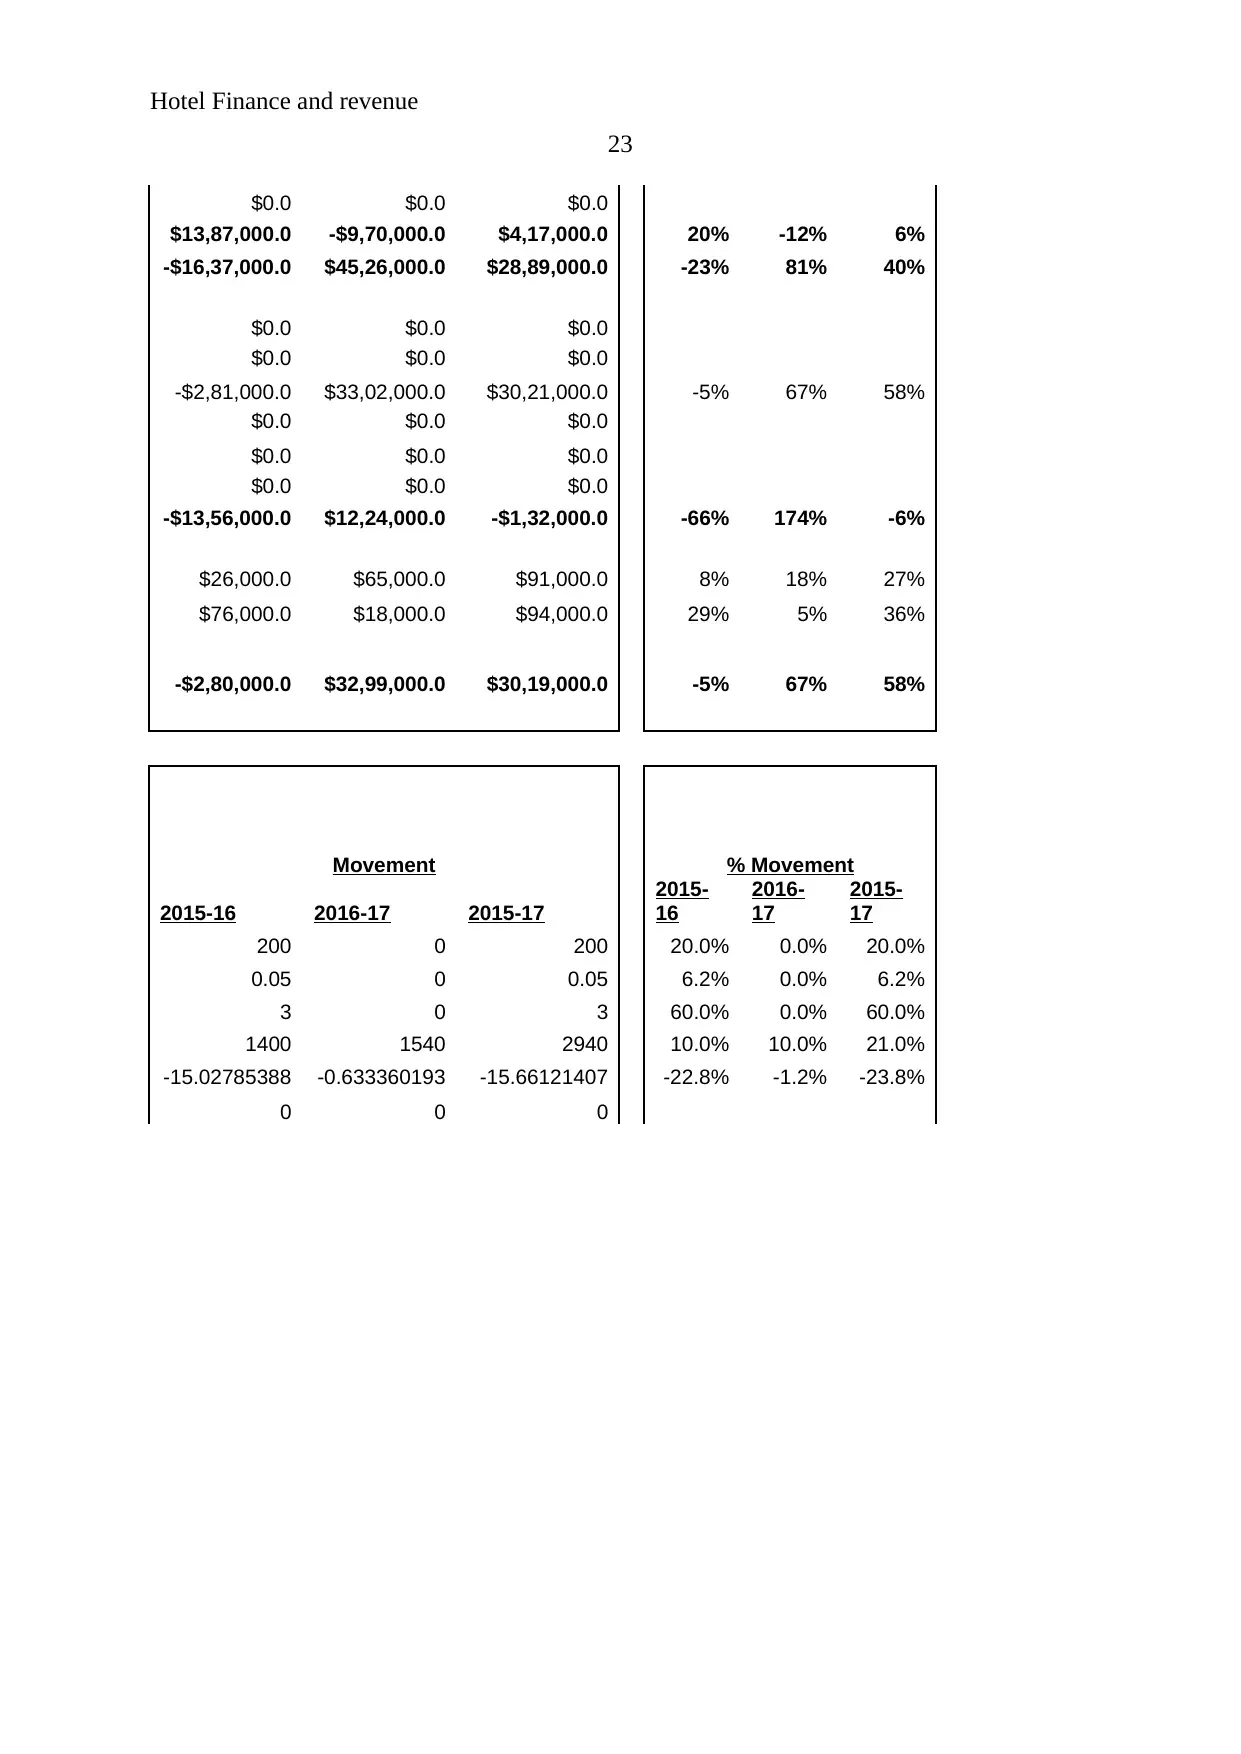
$0.0 $0.0 $0.0
$13,87,000.0 -$9,70,000.0 $4,17,000.0 20% -12% 6%
-$16,37,000.0 $45,26,000.0 $28,89,000.0 -23% 81% 40%
$0.0 $0.0 $0.0
$0.0 $0.0 $0.0
-$2,81,000.0 $33,02,000.0 $30,21,000.0 -5% 67% 58%
$0.0 $0.0 $0.0
$0.0 $0.0 $0.0
$0.0 $0.0 $0.0
-$13,56,000.0 $12,24,000.0 -$1,32,000.0 -66% 174% -6%
$26,000.0 $65,000.0 $91,000.0 8% 18% 27%
$76,000.0 $18,000.0 $94,000.0 29% 5% 36%
-$2,80,000.0 $32,99,000.0 $30,19,000.0 -5% 67% 58%
Movement % Movement
2015-16 2016-17 2015-17
2015-
16
2016-
17
2015-
17
200 0 200 20.0% 0.0% 20.0%
0.05 0 0.05 6.2% 0.0% 6.2%
3 0 3 60.0% 0.0% 60.0%
1400 1540 2940 10.0% 10.0% 21.0%
-15.02785388 -0.633360193 -15.66121407 -22.8% -1.2% -23.8%
0 0 0
23
$0.0 $0.0 $0.0
$13,87,000.0 -$9,70,000.0 $4,17,000.0 20% -12% 6%
-$16,37,000.0 $45,26,000.0 $28,89,000.0 -23% 81% 40%
$0.0 $0.0 $0.0
$0.0 $0.0 $0.0
-$2,81,000.0 $33,02,000.0 $30,21,000.0 -5% 67% 58%
$0.0 $0.0 $0.0
$0.0 $0.0 $0.0
$0.0 $0.0 $0.0
-$13,56,000.0 $12,24,000.0 -$1,32,000.0 -66% 174% -6%
$26,000.0 $65,000.0 $91,000.0 8% 18% 27%
$76,000.0 $18,000.0 $94,000.0 29% 5% 36%
-$2,80,000.0 $32,99,000.0 $30,19,000.0 -5% 67% 58%
Movement % Movement
2015-16 2016-17 2015-17
2015-
16
2016-
17
2015-
17
200 0 200 20.0% 0.0% 20.0%
0.05 0 0.05 6.2% 0.0% 6.2%
3 0 3 60.0% 0.0% 60.0%
1400 1540 2940 10.0% 10.0% 21.0%
-15.02785388 -0.633360193 -15.66121407 -22.8% -1.2% -23.8%
0 0 0

Hotel Finance and revenue
24
24
1 out of 24
Related Documents

![[FINANCIAL ANALYSIS] Ratio Analysis of AA, BA, and CA Companies](/_next/image/?url=https%3A%2F%2Fdesklib.com%2Fmedia%2Fimages%2Fme%2F7ec77c9779a64d0faedda6aed8107017.jpg&w=256&q=75)


Your All-in-One AI-Powered Toolkit for Academic Success.
+13062052269
info@desklib.com
Available 24*7 on WhatsApp / Email
![[object Object]](/_next/static/media/star-bottom.7253800d.svg)
Unlock your academic potential
© 2024 | Zucol Services PVT LTD | All rights reserved.