Investigating Correlations: Spirituality, Success, and Wellbeing
VerifiedAdded on 2023/01/12
|32
|2666
|96
Report
AI Summary
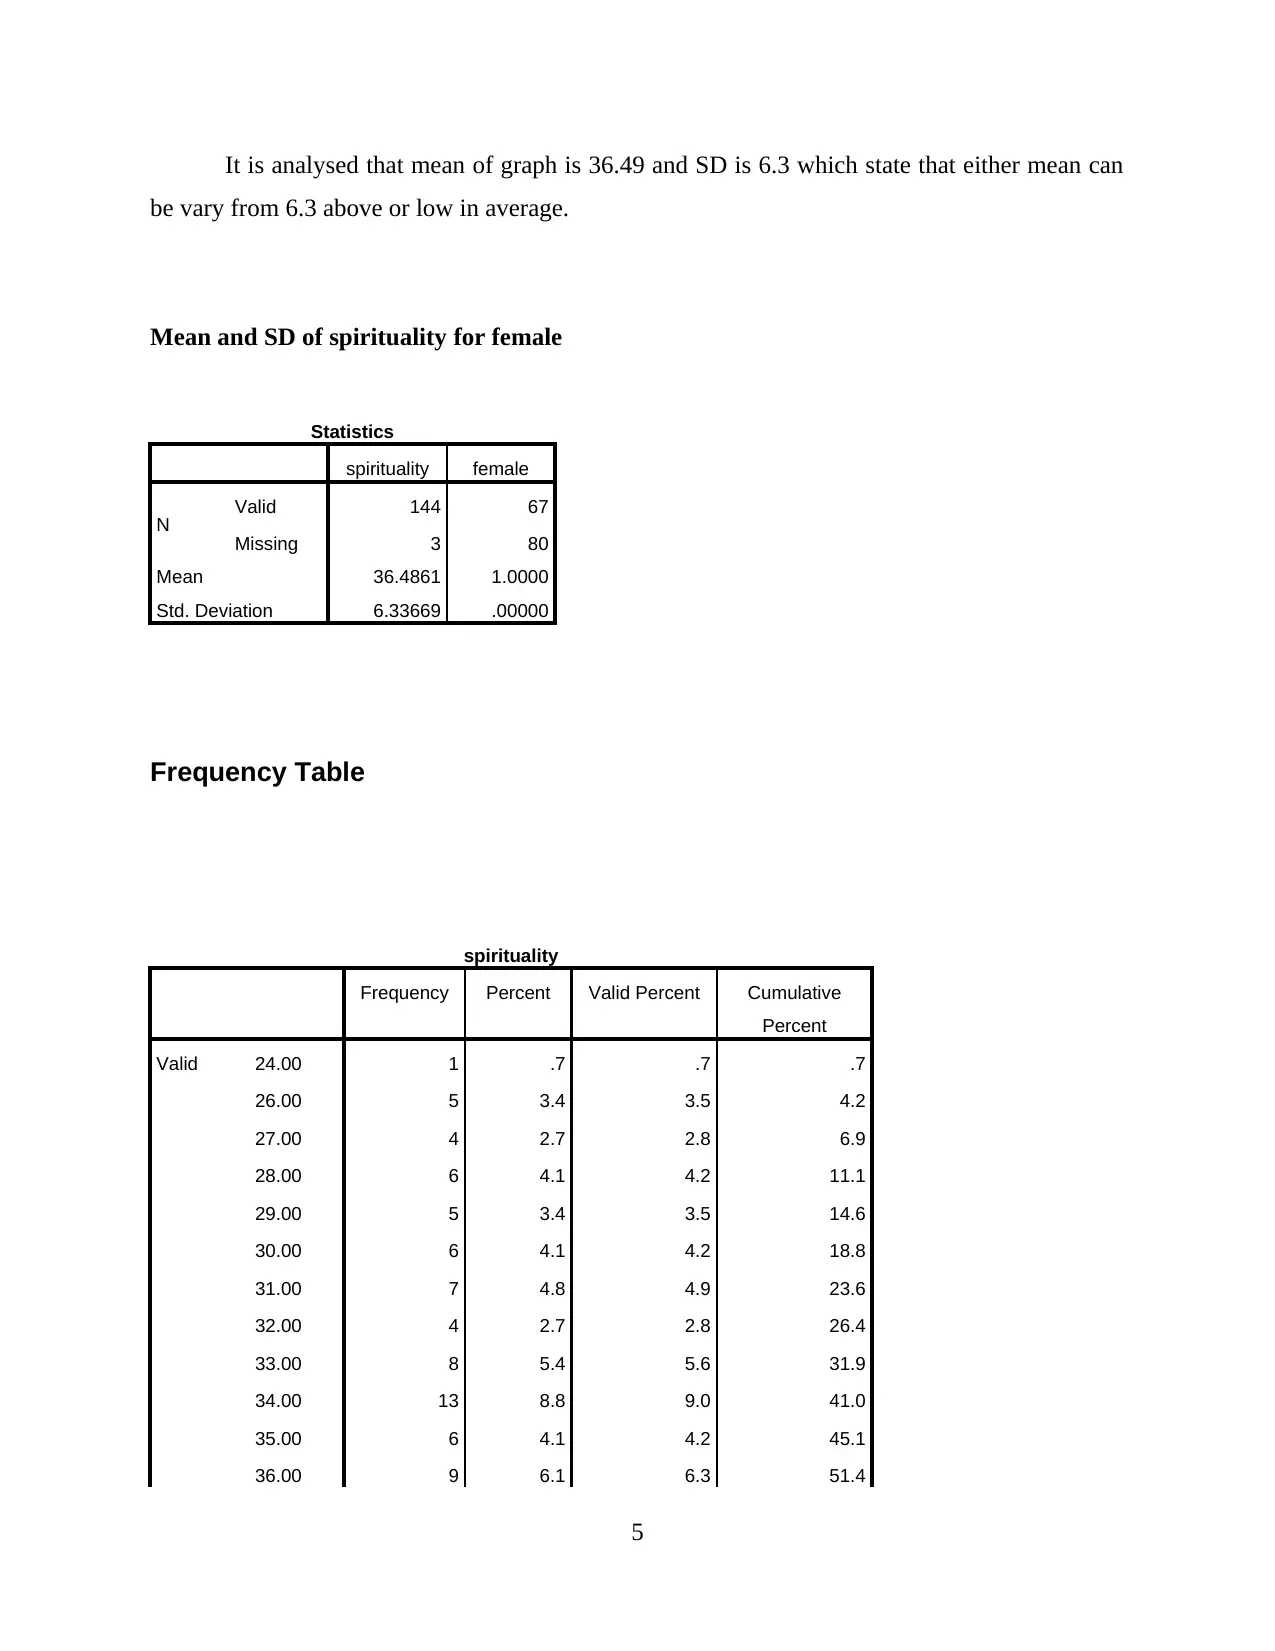
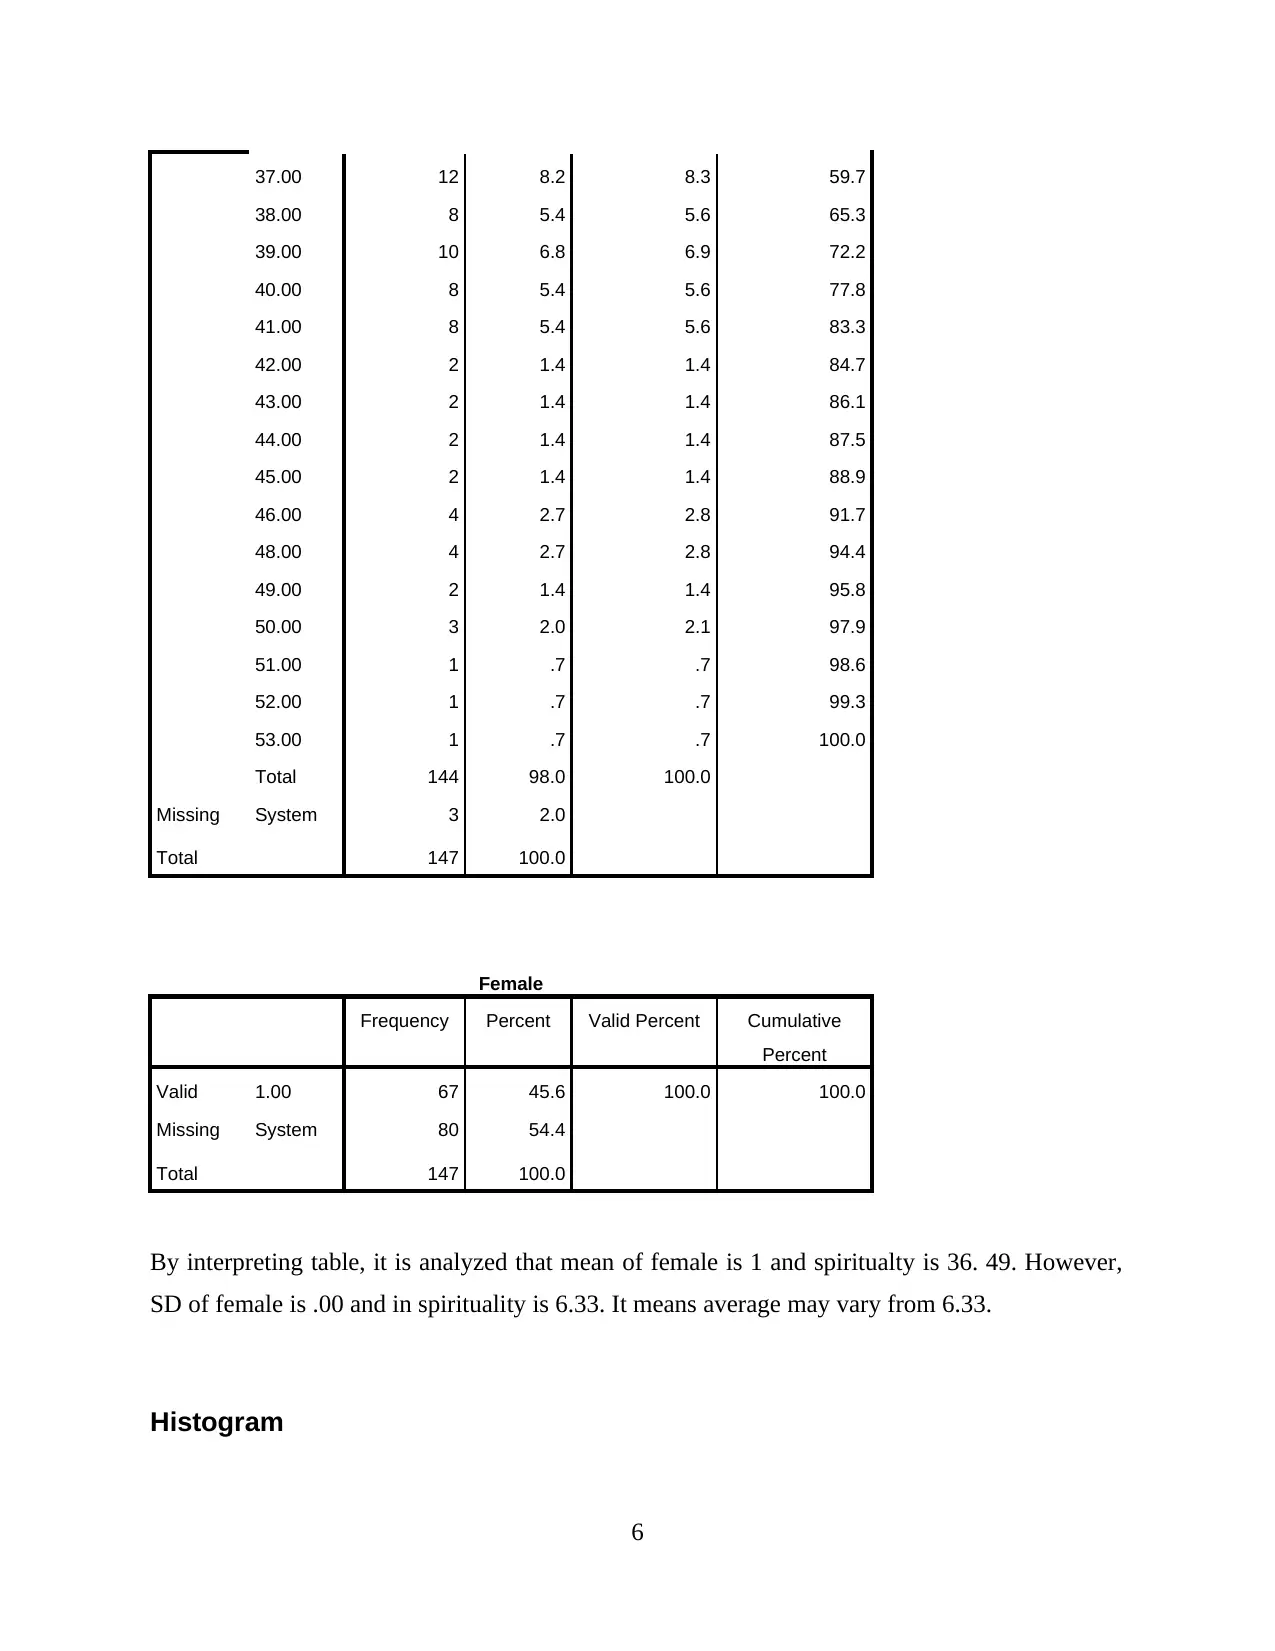
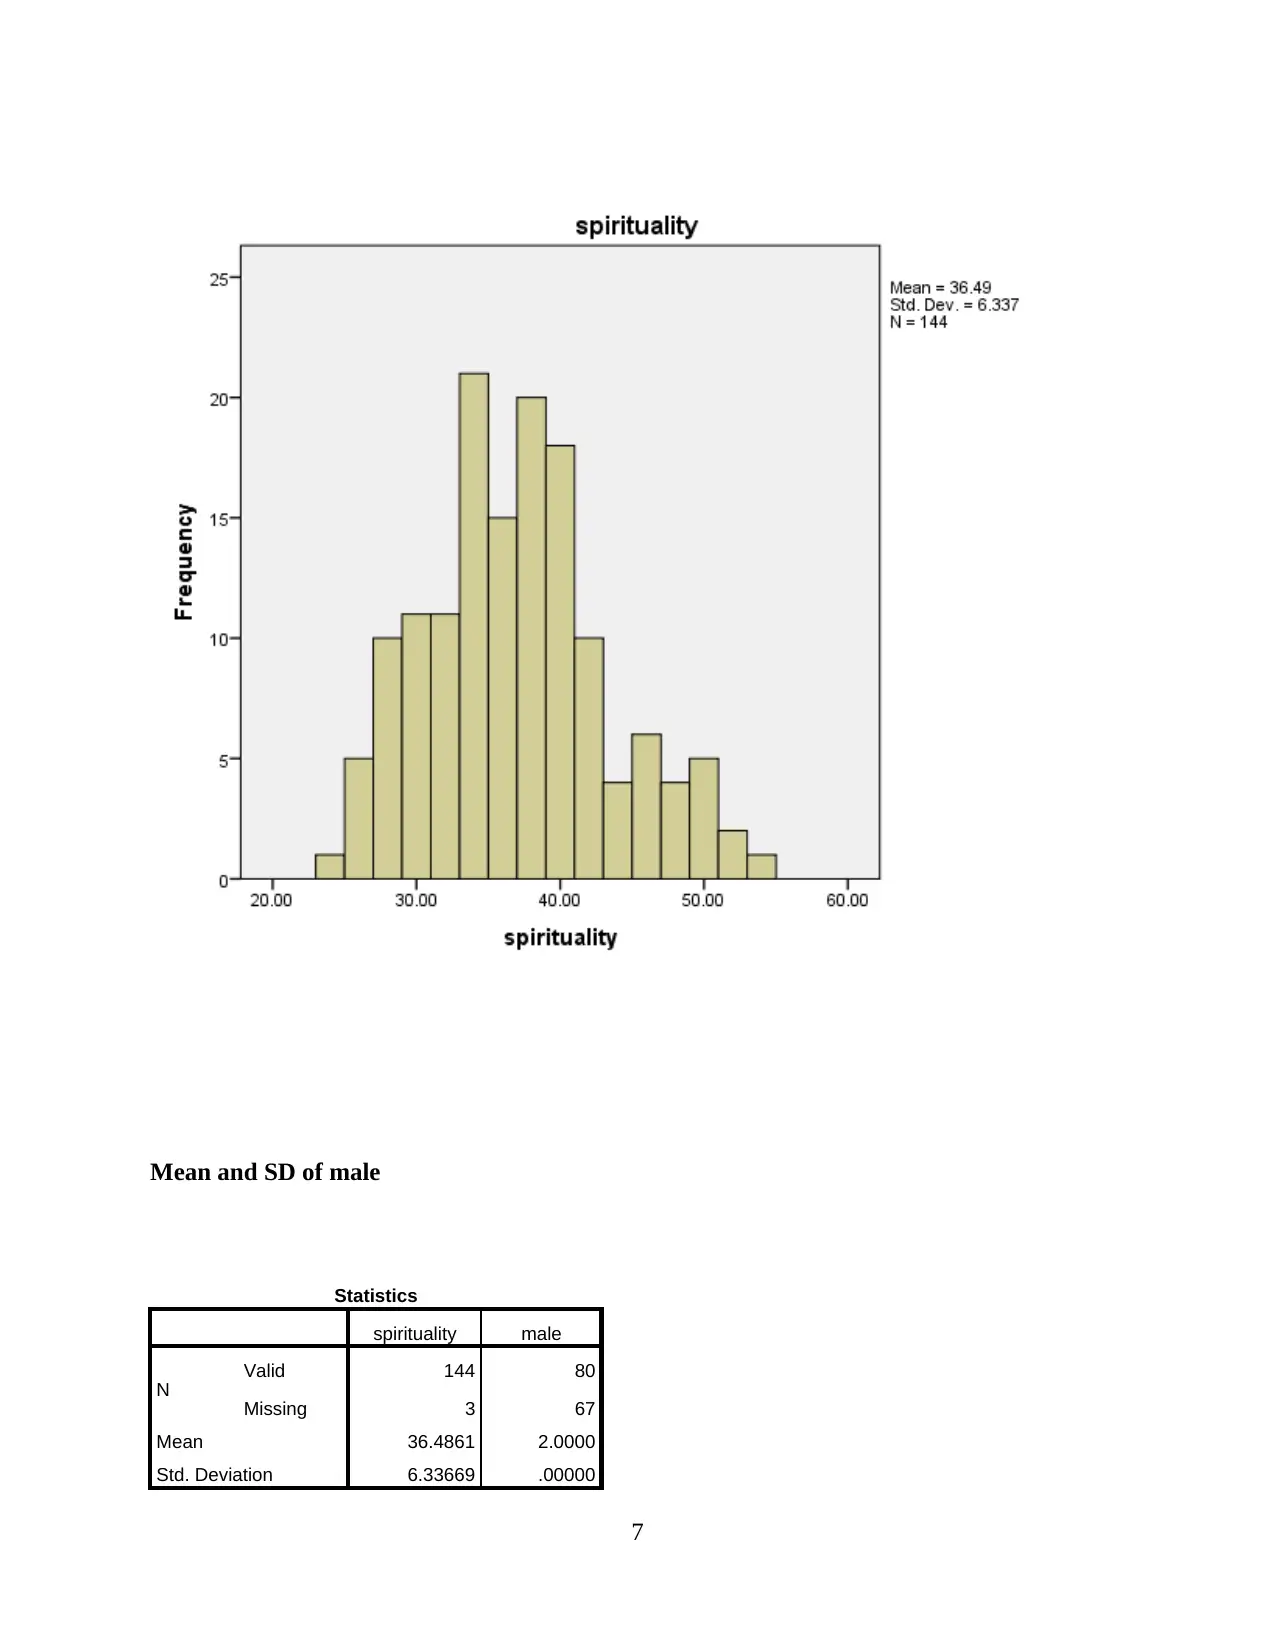
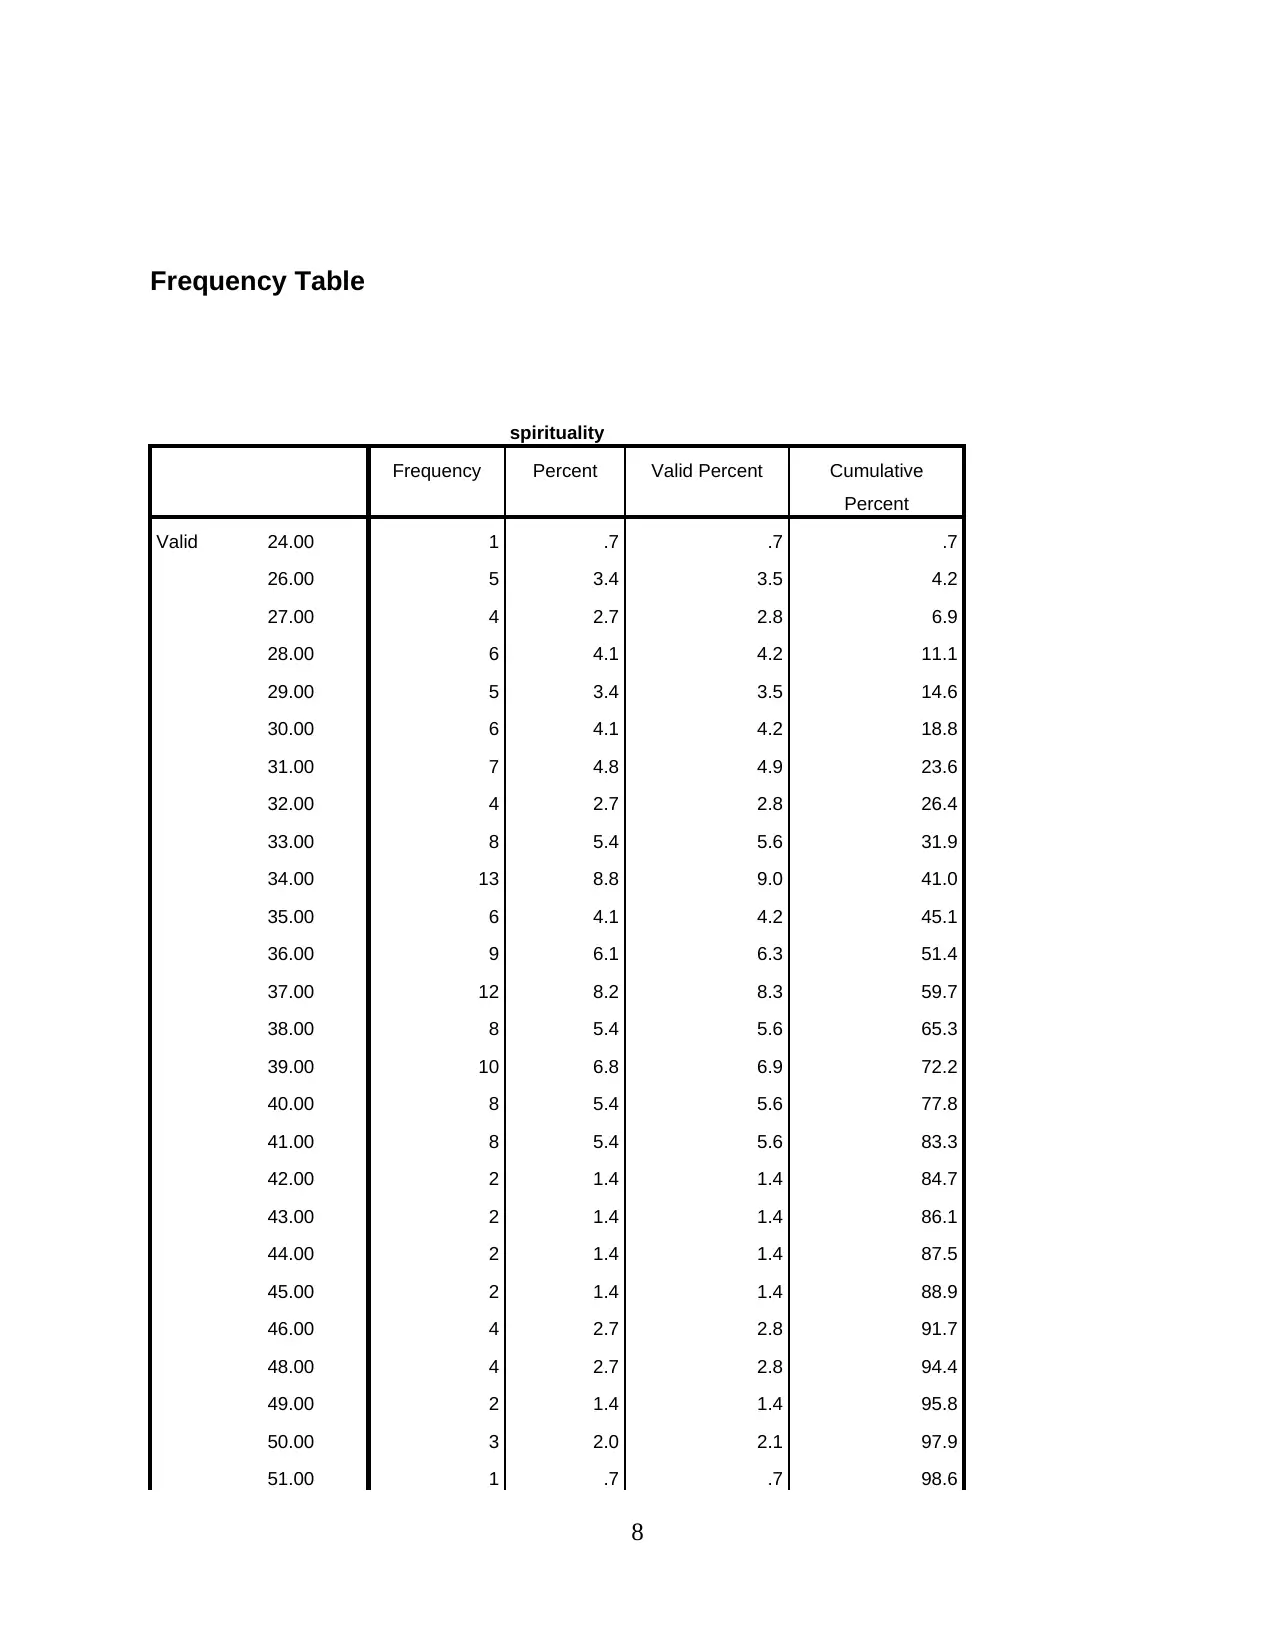
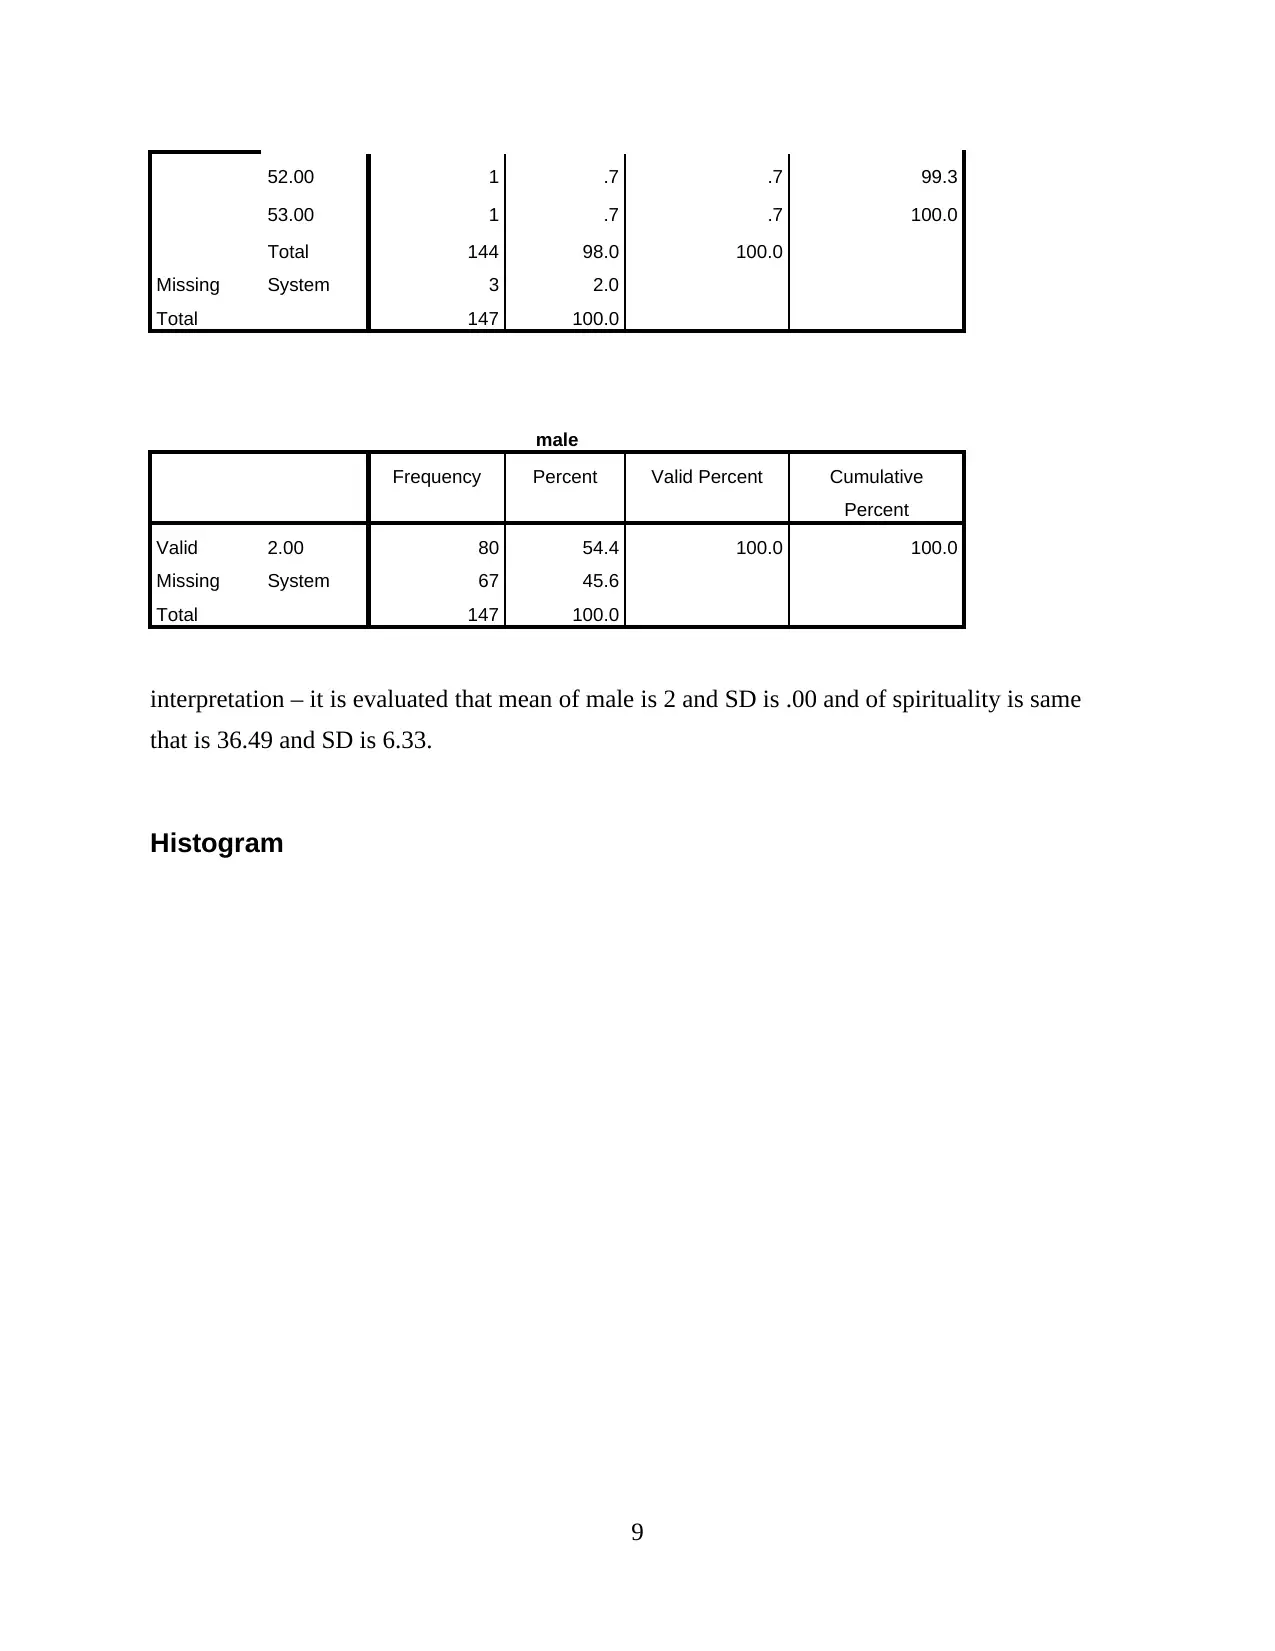
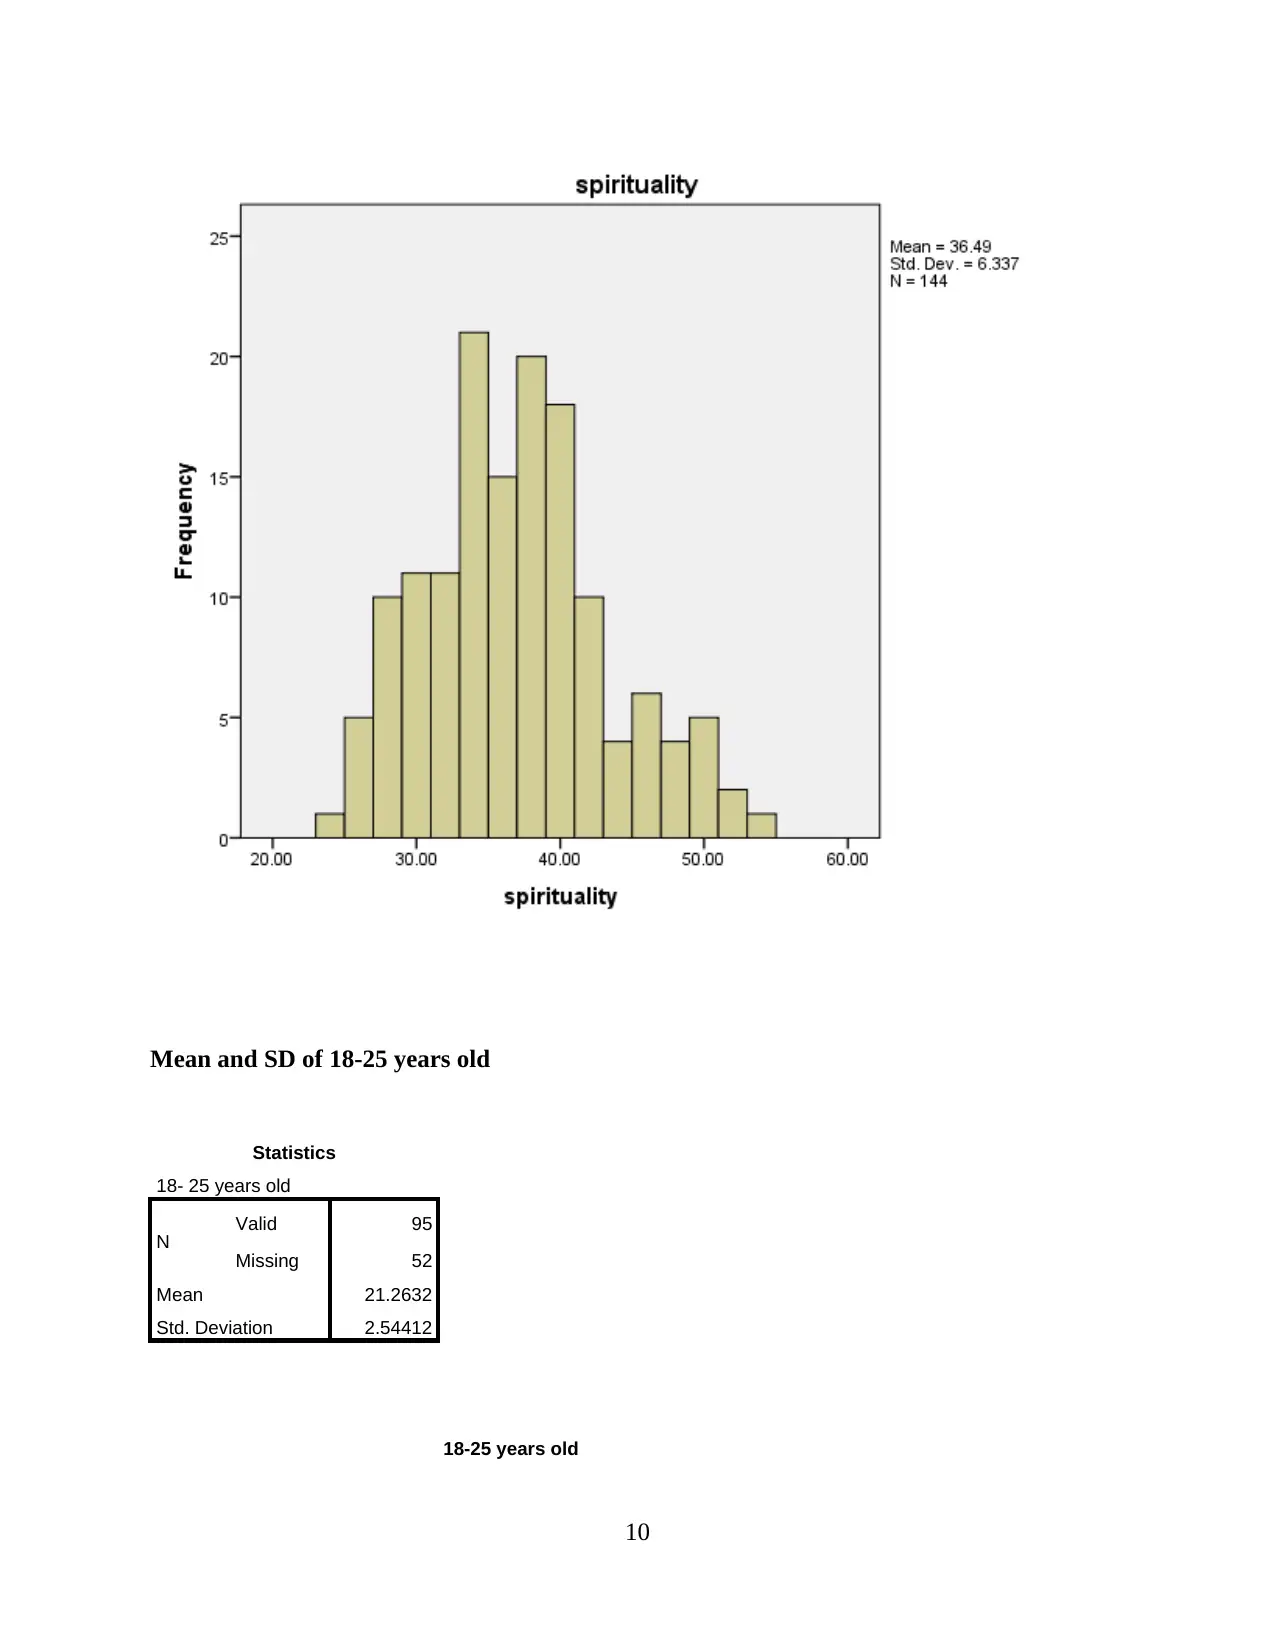
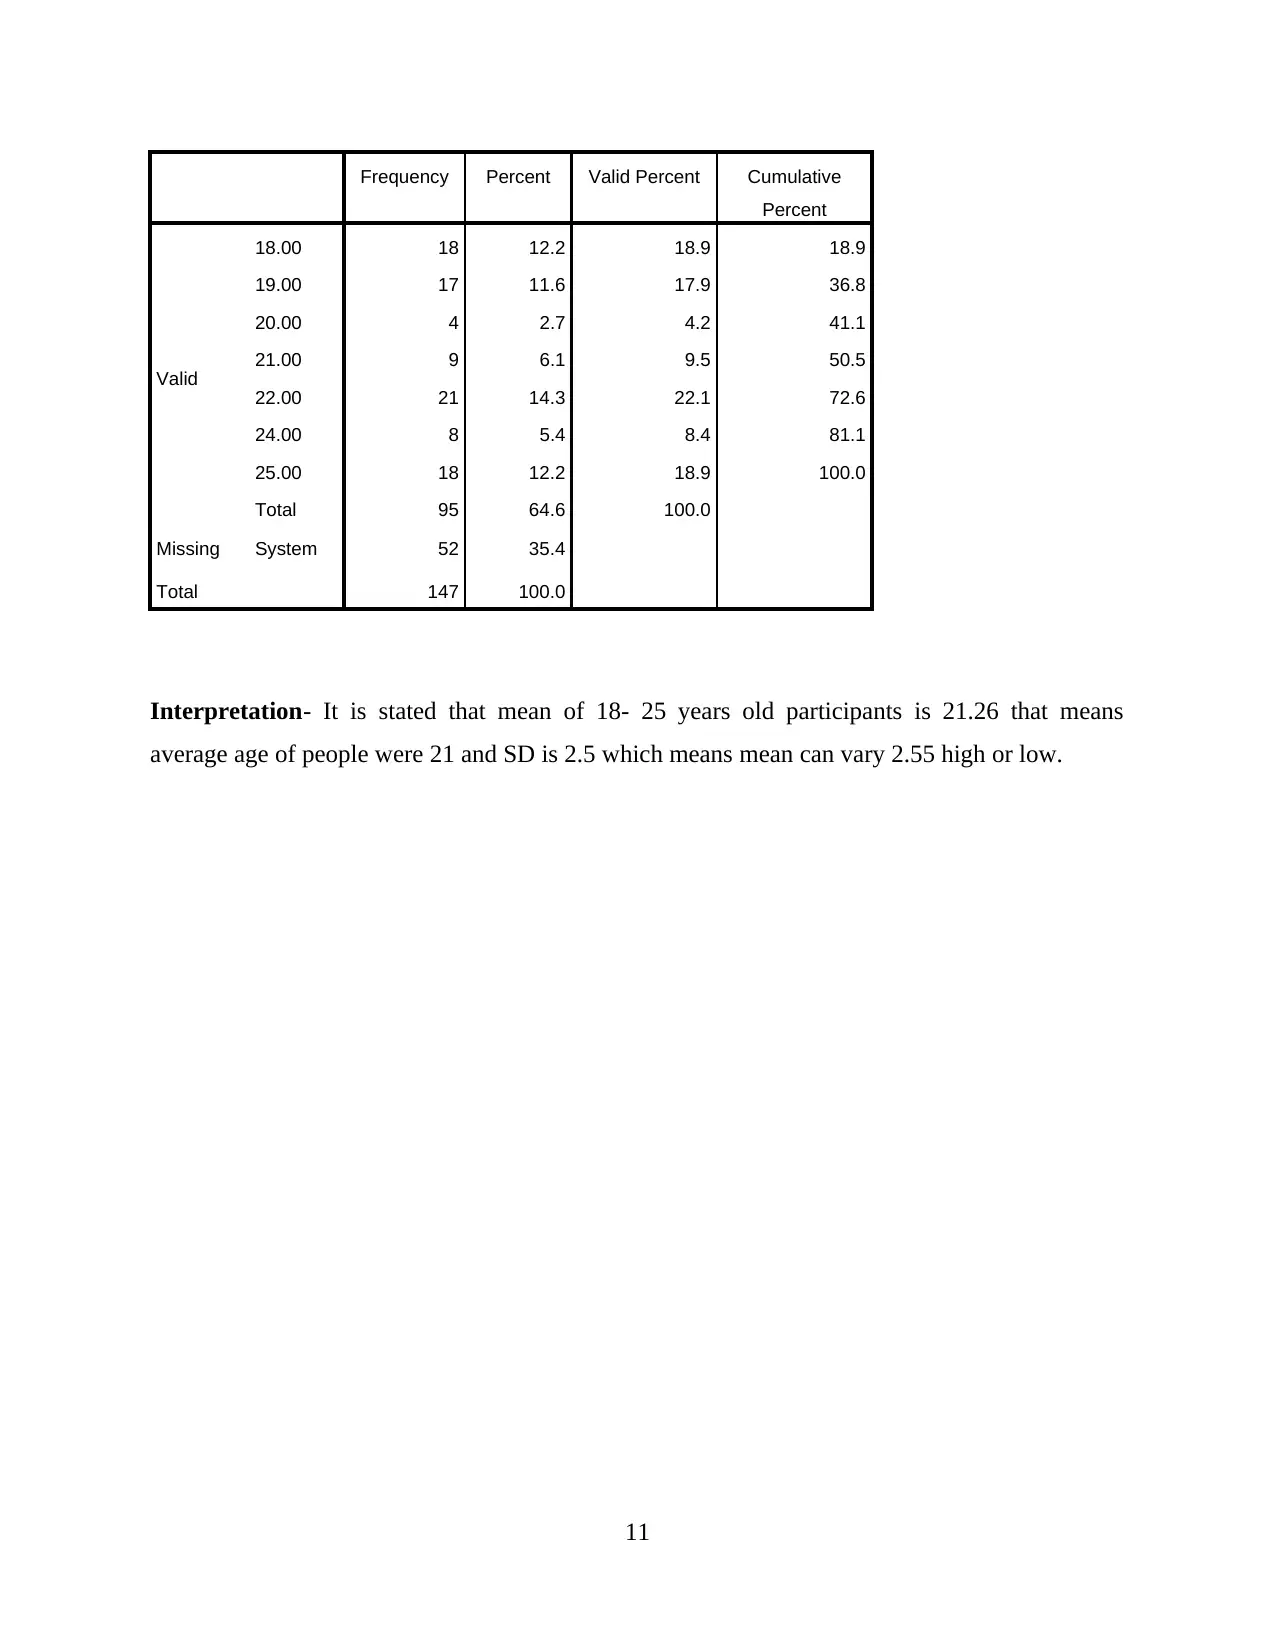
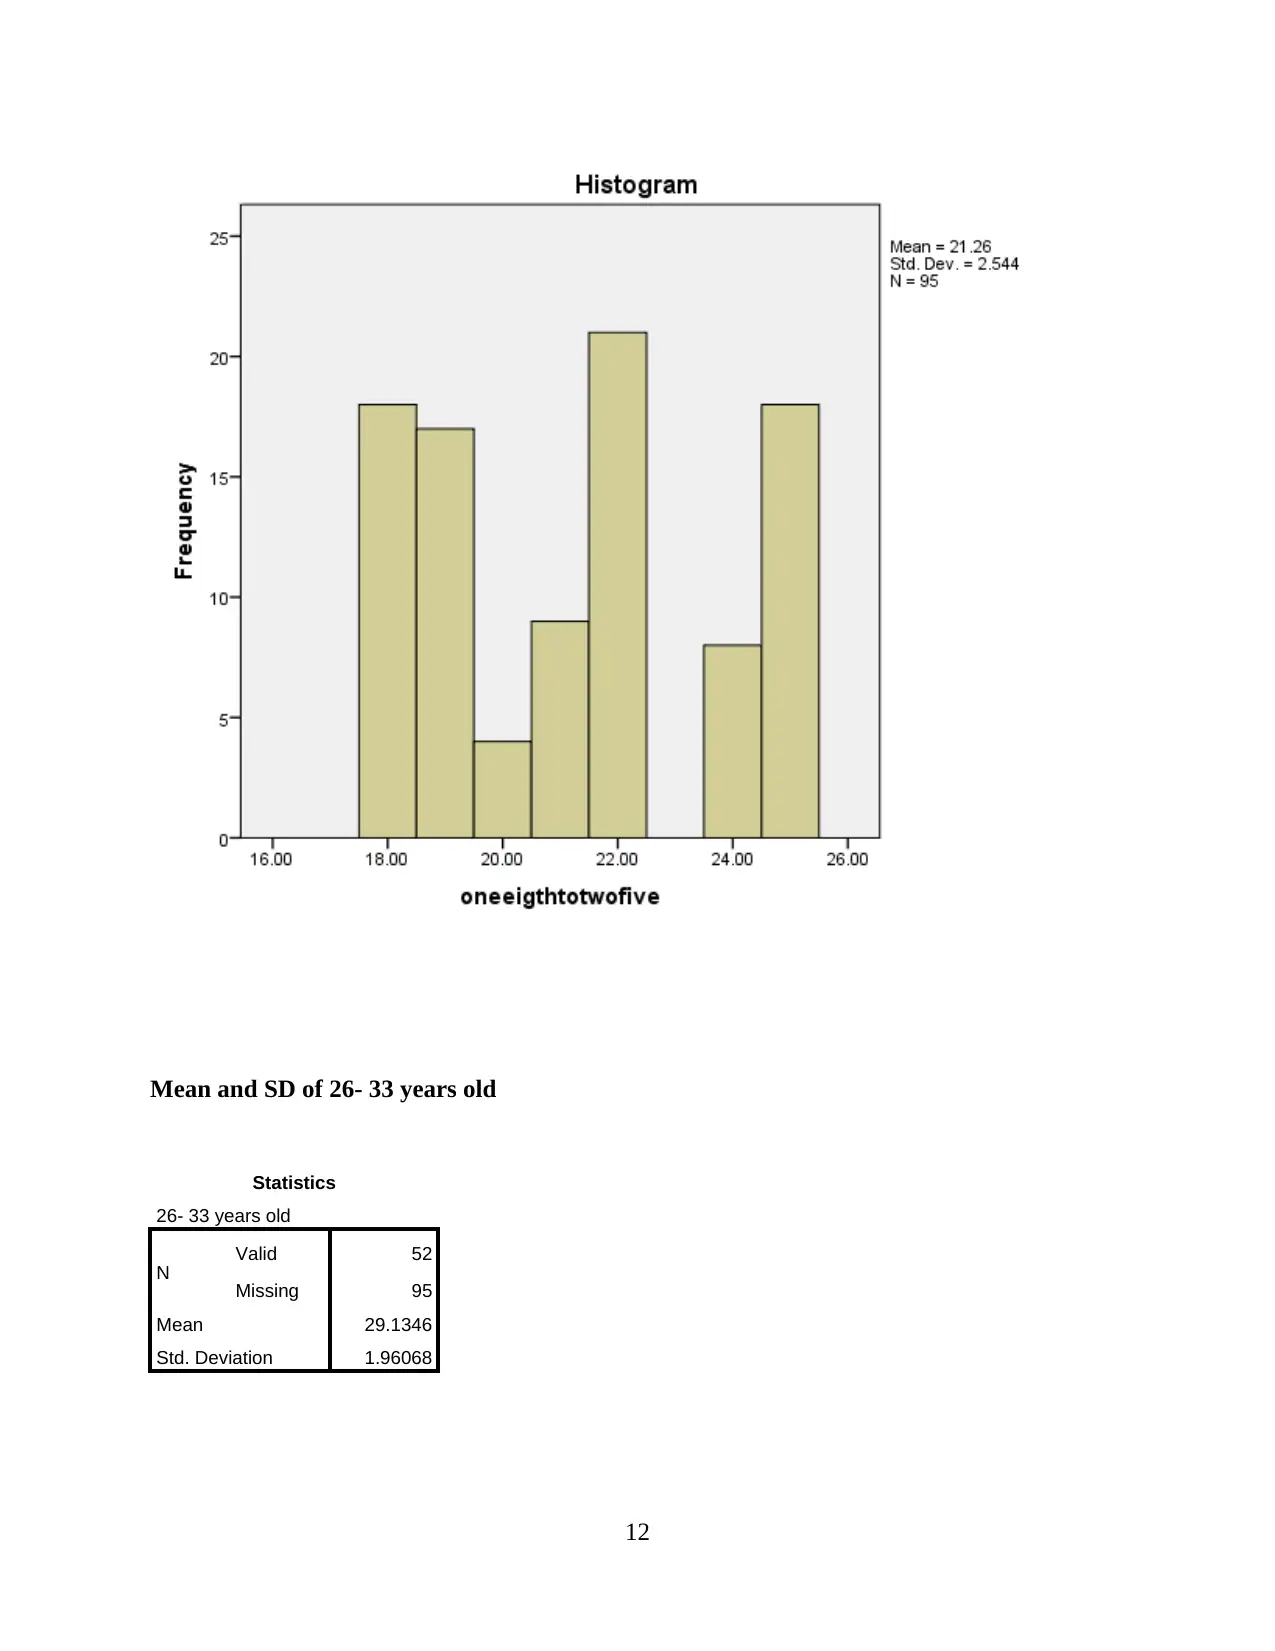
This report presents a descriptive and regression analysis exploring the relationships between spirituality, success, and wellbeing. The analysis includes frequency tables, mean, and standard deviation calculations for each variable, as well as breakdowns by gender and age groups. The findings suggest potential correlations between these factors, with interpretations provided for each statistical measure. The study utilizes data from a survey to examine how spirituality might influence both success and overall wellbeing, aiming to identify significant relationships and potential causal links. The report concludes with a discussion of the observed patterns and their implications.
1 out of 32
Your All-in-One AI-Powered Toolkit for Academic Success.
+13062052269
info@desklib.com
Available 24*7 on WhatsApp / Email
![[object Object]](/_next/static/media/star-bottom.7253800d.svg)
Copyright © 2020–2026 A2Z Services. All Rights Reserved. Developed and managed by ZUCOL.