HYDRAULIC PARAMETERS DETERMINATION IN MINE WATER OF THE ABANDONED EDENDALE LEAD MINE USING TRACER TESTS
Verified
Added on 2023/04/22
|135
|26476
|261
AI Summary
Contribute Materials
Your contribution can guide someone’s learning journey. Share your
documents today.
DETERMINATION OF HYDRAULIC PARAMETERS IN MINE WATER OF THE ABANDONED EDENDALE LEAD MINE USING TRACER TESTS by Mpho Penelope Mokone Submitted in partial fulfilment of the requirements for the degree MAGISTER TECHNOLOGIAE: ENVIRONMENTAL MANAGEMENT Department of Environmental, Water and Earth Sciences FACULTY OF SCIENCE TSHWANE UNIVERSITY OF TECHNOLOGY SARChl Chair for Mine Water Management Supervisor: Prof. Dr habil. Ch. Wolkersdorfer May 2017
Secure Best Marks with AI Grader
Need help grading? Try our AI Grader for instant feedback on your assignments.
DECLARATION IherebydeclarethatthisdissertationsubmittedforthedegreeMTech: EnvironmentalManagementattheTshwaneUniversityofTechnologyismy original work and has not previously been submitted to any other institution of higher education. I further declare that all sources cited or quoted are indicated and acknowledged by means of a comprehensive list of references. Mokone Mpho Penelope 208003879 i
ACKNOWLEDGMENTS IwouldliketoexpressmygratitudetomysupervisorProfessorChristian Wolkersdorfer, for granting me the opportunity to study my MTech degree under hissupervisionandguidance.Iwouldliketothankhimforhisendless encouragement and assistance in the field, for his valuable time that he gave for all our discussions and all the lessons he gave for presentations and tips and tricks of writing. I am thankful for his patience and for believing in me. It was indeed a great privilege to work with him and I am thankful for all the time he spent with me through to the completion of this dissertation. It would certainly be an honour to work with him in the future. SpecialthankstoMrThandoMajodina,GeologyLecturerattheTshwane University of Technology for his assistance and time. To my fellow M-tech mates who have become my second family, Lwazi, Busisiwe, and Kagiso; I appreciate their assistance in the field and encouragement in the office all their support. iii
Secure Best Marks with AI Grader
Need help grading? Try our AI Grader for instant feedback on your assignments.
PRESENTATIONS AND PUBLICATIONS The work contained in this thesis has previously been presented at conferences as indicated below. Conference Presentations Mokone,M.P.&Wolkersdorfer,C.TheDeterminationofHydrodynamic Processes and Mine Water Quality at the Abandoned Edendale Lead Mine By Stratification.Poster presentation. Tshwane University of Technology, Faculty Research Day. 9 September 2016, Pretoria, South Africa. Mokone, M. P. & Wolkersdorfer, C. Tracer Test in Mine Water of the Abandoned Edendale Lead Mine, South Africa.Oral presentation. 13thInternational Mine Water Association Congress. 25 – 30 June 2017, Rauha, Lappeenranta, Finland. Publications Mokone, M. P. & Wolkersdorfer, C. Tracer Test in Mine Water of the Abandoned Edendale Lead Mine, South Africa. IMWA 2017 – Mine Water & Circular Economy (Vol I), proceedings: 342-350. iv
ACKNOWLEDGEMENT Most of all to my parents I am grateful for them being supportive and encouraging me to further my studies and the faith they have in me. Mrs Zicki Jourbert, in the Department of Environmental, Water and Earth Science, I would like to thank her for ensuring that all things ran smoothly throughout the dissertation, from registration, field transportation including reagents needed for both the laboratory and field all the equipment and software which were required during the study. She has been a blessing. I would like to acknowledge the Water Lab for the laboratory results of the water quality analyses which they always sent on time in an orderly manner. GreatthankstotheTshwaneUniversityofTechnology,theDepartmentof Environmental, Water and Earth Sciences for allowing me to carry out this study. v
ABSTRACT The purpose of this study is to determine hydraulic connectivity by conducting a tracer test and to establish an understanding of the hydrodynamic processes through stratification in the mine water of the abandoned Edendale Lead Mine with the aim of identifying potential mine water pollution and classifying the mine water quality. This study was conducted at the abandoned Edendale Lead Mine which is located on the farm Nooitgedagt 333JR in Silverton, Pretoria east one of the earliest mines in the Transvaal region and operated from 1890 to 1974. Water samples were collected at the shafts, discharge point and Edendalespruit up and downstreamandanalysedformainionsandtraceelementsusingion chromatography and ICP-MS or ICP-OES. In addition, on-site parameters were measuredwithHachinstruments.Adipperwasusedforstratification measurements in the three shafts of Edendale Lead Mine and 21 kg of food quality NaCl were dissolved in 75 L of tap water the solute was then used as a tracer and injected into one shaft. The mine water discharging from the mine and also in the mineshaftswhenmeasuringon-siteparametersindicatedthatthepH6-8, circumneutral pH, with a oxidation-reduction potential electrode between 90 and 500 mV this influences ion exchange in mine water, dissolved oxygen percentage below 90% and dissolved oxygen concentration lower than 20 mg/L this could be because of bacteria which use up the oxygen or the biological oxygen demand by plants in the Edendalespruit stream water and also because of the water warmth. Pb, Ag and Sb were below detection limit, high silicon concentration was detected vi
Paraphrase This Document
Need a fresh take? Get an instant paraphrase of this document with our AI Paraphraser

at all sites but higher at the downstream. Ca and K elevated at the discharge point and Mg and Na found high downstream. SO42-high as 102 mg/L downstream and 55 mg/L upstream. Stratification in the three shafts was not stable, high EC was observed at great deeper water level and at lower temperatures and lower EC watersaboveatsubstantiallyhightemperatures.Duringthetracertest,the electrical conductivity increased in the wet months. Only 17.1% of the injected tracer was recovered. The fact that the mine water is stratified demonstrates that chemical and hydrodynamic processes seem to favour a mine water stratification. Based on the results, it can be concluded that there is mineralisation and possible contamination. However, it can be concluded from the tracer test that the flow is adjective. Yet, the results obtained so far show that there will be not deteriorating contamination of the receiving watercourses. vii
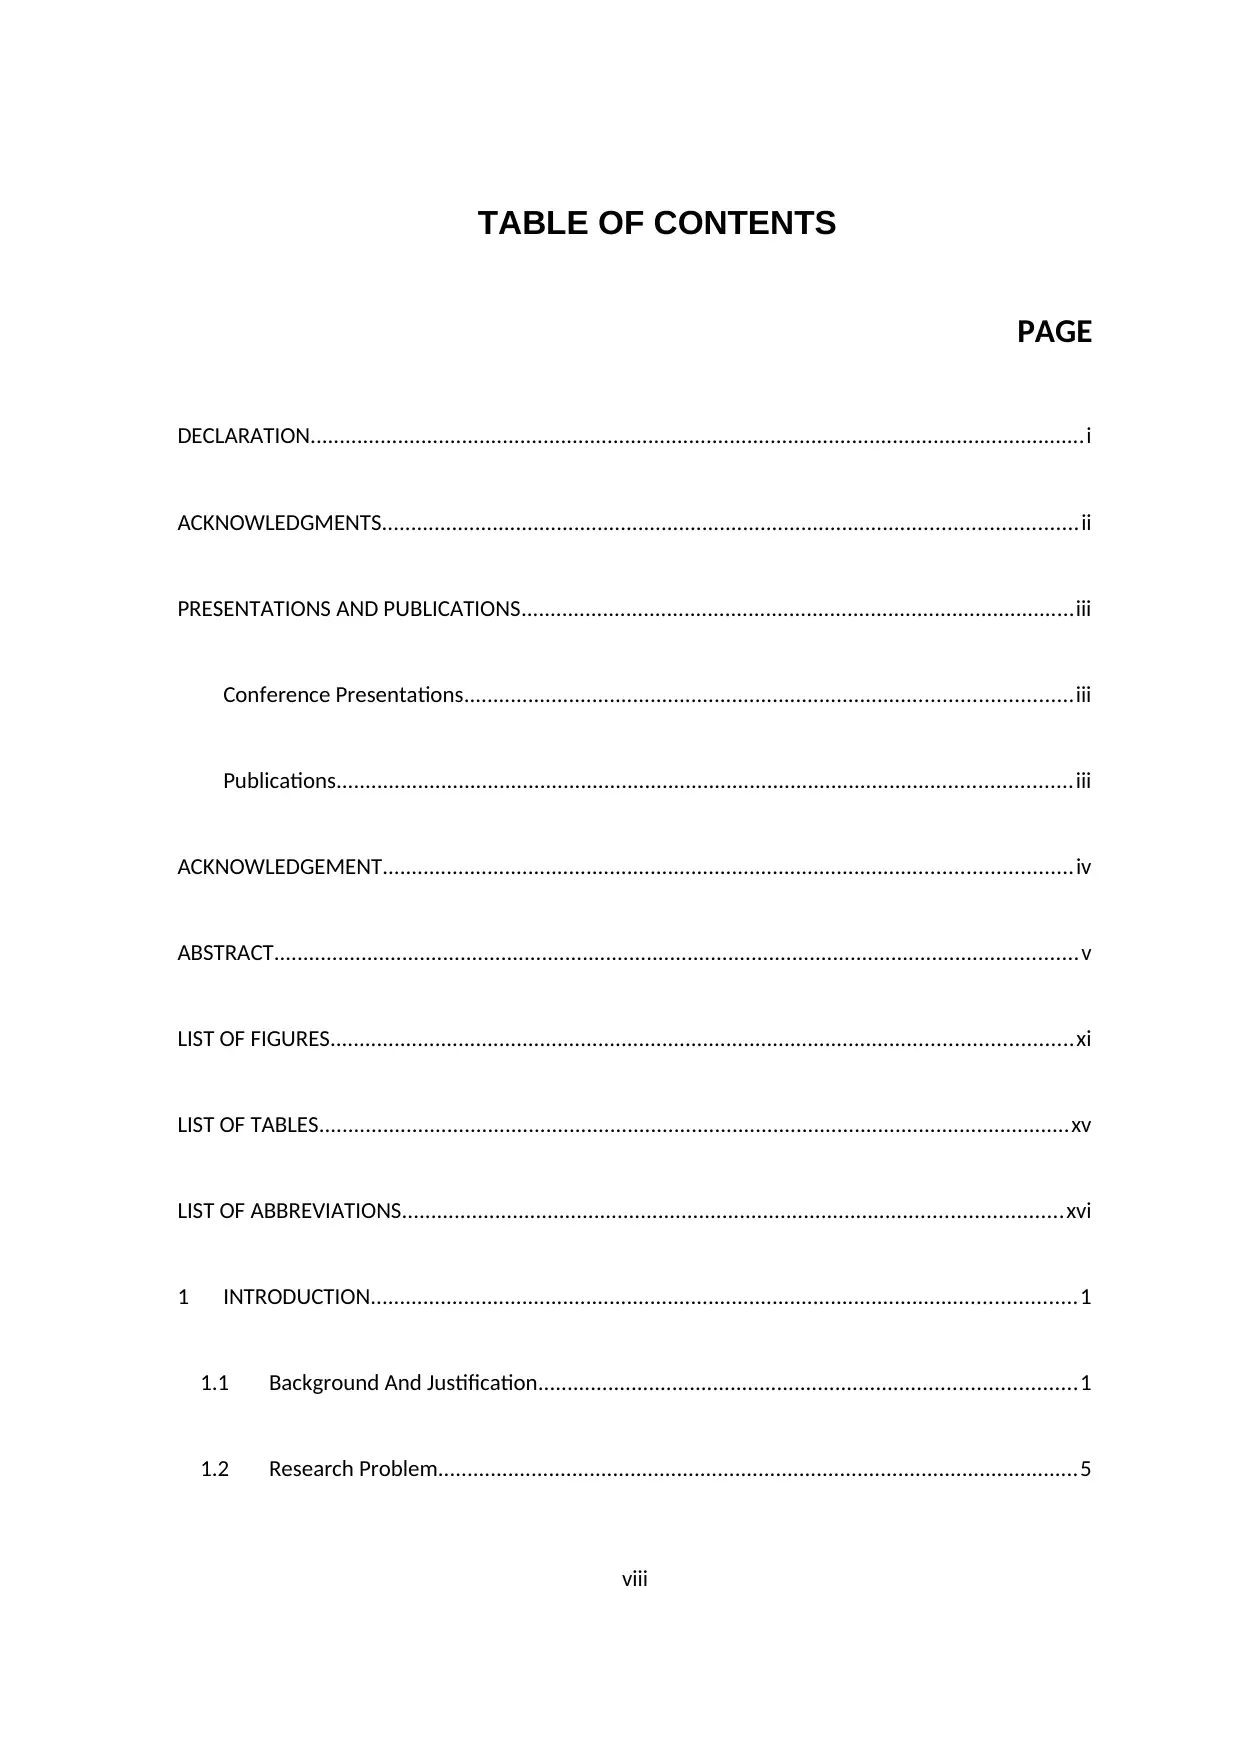
TABLE OF CONTENTS PAGE DECLARATION.....................................................................................................................................i ACKNOWLEDGMENTS.......................................................................................................................ii PRESENTATIONS AND PUBLICATIONS...............................................................................................iii Conference Presentations........................................................................................................iii Publications..............................................................................................................................iii ACKNOWLEDGEMENT......................................................................................................................iv ABSTRACT..........................................................................................................................................v LIST OF FIGURES...............................................................................................................................xi LIST OF TABLES.................................................................................................................................xv LIST OF ABBREVIATIONS.................................................................................................................xvi 1INTRODUCTION.........................................................................................................................1 1.1Background And Justification............................................................................................1 1.2Research Problem..............................................................................................................5 viii
1.3General Aims and Objectives.............................................................................................6 2LITERATURE REVIEW.................................................................................................................8 2.1CHEMISTRY OF MINE WATER............................................................................................8 2.1.1Mineral dissolution as a source of contamination.....................................................8 2.1.2Mobility of contaminants - effects of pH.................................................................14 2.1.3Pyrite and sulphide mineral weathering..................................................................20 2.2STRATIFICATION..............................................................................................................29 2.2.1Stratification of lakes...............................................................................................29 2.2.2Stratification of underground mines........................................................................32 2.3MINE WATER AND GROUNDWATER AQUIFER.................................................................36 2.3.1Characteristics of mine water aquifers and mine pools...........................................36 2.3.2Aquifer parameters..................................................................................................39 2.3.3Interaction of mine water and groundwater...........................................................42 2.4TRACERS AND TRACER TESTS IN UNDERGROUND MINES................................................44 2.4.1Types of tracers.......................................................................................................44 2.4.2Applications of tracing tests....................................................................................46 ix
Secure Best Marks with AI Grader
Need help grading? Try our AI Grader for instant feedback on your assignments.
2.4.3Assessment and simplification of tracer tests..........................................................49 2.5ENVIRONMENTAL EFFECTS OF MINE WATER DISCHARGE...............................................51 2.5.1Impacts on human health and aquatic life...............................................................51 2.5.2Impacts on water resources....................................................................................54 3METHODOLOGY......................................................................................................................55 3.1DESCRIPTION OF STUDY AREA.........................................................................................55 3.1.1Geological setting and study area............................................................................56 3.1.2Climate and hydrology.............................................................................................59 3.1.3Mining history..........................................................................................................60 3.2DATA COLLECTION...........................................................................................................65 3.2.1Mine water chemistry..............................................................................................65 3.2.2Sample collection procedures..................................................................................66 3.2.3Stratification............................................................................................................68 3.2.4Mine water tracing..................................................................................................69 3.2.5Analytical methodology...........................................................................................69 4RESULTS AND DISCUSSION......................................................................................................71 x
4.1Introduction.....................................................................................................................71 4.2On-site parameters..........................................................................................................71 4.3Water Chemistry.............................................................................................................79 4.4Statistical Analysis...........................................................................................................83 4.5Stratification....................................................................................................................84 4.6Tracer test.......................................................................................................................92 5CONCLUSION AND RECOMMENDATIONS................................................................................95 6REFERENCES............................................................................................................................96 APPENDIX I....................................................................................................................................117 Water Samples co-ordinates.........................................................................................................118 xi
LISTOFFIGURES PAGE Figure 2.1: Solubility of metals as a function of p H (from Cravotta, 2008)............14 Figure 2.2: Stability diagram for Sb-species in the Sb – S – H2O system (from Filella et al., 2002)...................................................................................................15 Figure 2.3: Eh – pH diagram for zinc ( from Nuttall et al., 2000)............................17 Figure 2.4: Pyrite oxidation simplified diagram showing reaction pathway (from Banks et al., 1997)..................................................................................................21 Figure 2.5: Stratification of lakes (from UFI, 1994).................................................27 Figure 2.6: Temperature and specific conductivity profile of Cueva de la Mora Pit Lake (from España et al., 2009).............................................................................29 Figure 2.7: Development of stratification in mine water in a shaft and how it is lost (from Nuttall et al., 2004)........................................................................................30 Figure 2.8: Conductivity and temperature log of No. 2 Shaft at Frazer's Grove Mine (from Johnson et al., 2002).....................................................................................32 xii
Paraphrase This Document
Need a fresh take? Get an instant paraphrase of this document with our AI Paraphraser
Figure 2.9: Schematic depiction of the vertical zonation of the dolomite in the FWR based on the degree of karstification/ fracturing and storativity (according to Winde et al. (2006).............................................................................................................37 Figure 2.10: Bimodal breakthrough curve for the January 2001 tracer experiment, represented as tracer flux. The curve is decomposed in 2 signals, each corresponding to one impulse injection of tracer (0.5 and 1 kg respectively), showing a linear behaviour of the system with respect to mass transport. (Massei et al 2006)...............................................................................................................46 Figure 2.11: Residence time distribution for each tracer test (peak areas = 1). Residence time distributions ordinates are H(t)=tracer flux/recovered mass. Massei et al 2006....................................................................................................47 Figure 3.1: Overview of three shafts of the abandoned Edendale Lead Mine (Google Earth, 2004 http://earth.google.com; Datum WGS84, geographical coordinates, without scale).....................................................................................52 Figure 3.2: The three main outcrops of Kaapvaal craton, Kanye basin in Botswana, Griqualand West basin and the Transvaal basin (from Eriksson et al., 2012).......55 Figure 3.3: Cross section of the Edendale No 1 Mine 1903 – 1909 (From Reeks, 2012).......................................................................................................................59 xiii
Figure 3.4 Cross section of the Edendale (Union Silver and Lead Ltd) No 2 Mine 1937 (from Reeks, 2012)........................................................................................60 Figure 4.1: pH from the abandoned Edendale Lead Mine.....................................70 Figure 4.2: Redox (mV) from the abandoned Edendale Lead Mine.......................71 Figure 4.3: Electrical Conductivity (μS/cm) from the abandoned Edendale Lead Mine.........................................................................................................................73 Figure 4.4: Temperature (°C) from the abandoned Edendale Lead Mine..............74 Figure 4.5: Dissolved Oxygen (mg/L) from the abandoned Edendale Lead Mine.75 Figure 4.6: Dissolved Oxygen (%) from the abandoned Edendale Lead Mine......75 Figure 4.7 Element concentration...........................................................................79 Figure 4.8: Piper diagram for samples collected at the abandoned Edendale Lead Mine; n = 15, averages of three sampling campaigns............................................79 Figure 4.9: Stratification on shaft E01, E12 and E13 in the abandoned Edendale Lead Mine January 2016........................................................................................83 xiv
Figure 4.10: Stratification on shaft E01, E12 and E13 in the abandoned Edendale Lead Mine in March 2016.......................................................................................84 Figure 4.11: Stratification on shaft E01, E12 and E13 in the abandoned Edendale Lead Mine in April 2016..........................................................................................85 Figure 4.12: Stratification on shaft E01, E12 and E13 in the abandoned Edendale Lead Mine in June 2016..........................................................................................86 Figure 4.13: Stratification on shaft E01, E12 and E13 in the abandoned Edendale Lead Mine in July 2016...........................................................................................87 Figure 4.14 Stratification on shaft E12 and E13 in the abandoned Edendale Lead Mine in August 2016...............................................................................................88 Figure 4.15: Stratification on shaft E12 and E13 in the abandoned Edendale Lead Mine September 2016.............................................................................................88 Figure 4.16: EC measurement in shaft E13 and discharge point of the abandoned Edendale Lead Mine during tracer test...................................................................90 Figure 4.17: Recovery rate of the Edendale tracer test..........................................91 xv
Secure Best Marks with AI Grader
Need help grading? Try our AI Grader for instant feedback on your assignments.
LIST OF TABLES PAGE Table 3.1: Coordinates for each of the sample sites..............................................53 Table 3.2: Names used at the Edendale mine during operation (modified from Reeks, 2012)...........................................................................................................58 Table 3.3: Instruments used to measure on-site parameters in the field...............63 Table 4.1: On-site parameters from the abandoned Edendale Lead Mine. n: on- site parameter; ± is standard deviation of sample population. Average of the pH calculated using the [H+].........................................................................................68 xvi
LIST OF ABBREVIATIONS AMD:Acid Mine Drainage DO:Dissolved Oxygen DWAF:Department of Water Affairs EIA:Environmental Impact Assessment ELM:Edendale Lead Mine EPA:Environmental Protection Agency EU:European Union GDP:Gross Domestic Product GPS:Global Positioning System IC:Ion Chromatography ICP-MS:Inductively Coupled Plasma– Mass Spectrometry ICP-OES:Inductively Coupled Plasma– Optical Emission Spectrometry NEMA:National Environmental Management Act 107 of 1998 NWA:National Water Act 36 of 1998 xvii
ORP:Oxidation Reduction Potential SAC:South African Constitution 108 of 1996 SANS:South African National Standards TDS:Total Dissolved Solids TWQR:Target Water Quality Range WHO:World Health Organisation xviii
Paraphrase This Document
Need a fresh take? Get an instant paraphrase of this document with our AI Paraphraser
1INTRODUCTION 1.1BACKGROUNDANDJUSTIFICATION In many parts of the world, mining is known as one of the major economic contributors as it provides resources used in modern industrial society in both developing and developed countries. In South Africa mining play an important part in the economy contributing 30% to the country’s gross domestic product (GDP) employing millions of people and paying R10.5 billion to tax(Chimhanda, 2010; Van Der Schyff, 2012).However, globally mining is known as one of the main cause of environmental concerns. The quality and quantity of water resources and their surrounding environment are substantiallyinfluencedbyminingactivities.ThecaseinRandfontein, Johannesburg ##(Ciduet al., 2008; Wolkersdorfer, 2008). Moreover, mining can lead to the pollution of soil and water, topographical changes, degraded land and reduced ecological footprint(Yenilmezet al., 2011). Worldwide changes in the miningsector have led to theclosureof many long-established deepmines because of economic and environmental reasons(Adamset al., 2001). In South Africa, legislation and guidelines have been adopted to address mine closure and post-mining water management even so abandoned mines remain a liability(Kgariet al., 2016). The South African Constitution (108 of 1996) is aimed at reducingenvironmentalimpacts associatedwithminingactivities providing 1
sustainabledevelopmentitstatesthepriorityofenvironmentalprotectionfor present and future generation beneficiaries giving everyone a right to a clean and healthy environment. Water resources near mines are preserved by the National Water Act (36 of 1998) that strive for ecosystem sustainability and commands wateruserstopreventorminimizecontaminationofwaterresourcesand authorizeswaterusespromotingthereducedwaterusesandpollutionof resources.Furthermore,theBestPracticeGuidelinesforWaterResource Protectionisaimedtoapplycleanerproductiontechniquestoprotectwater resources and prevent pollution at source. In 2002 the Minerals and Petroleum Resources Development Act No. 28 (MPRDA) was adopted and is used as a policy to govern the exploration of minerals in South Africa pre/post-mining life cycle. It necessitates the procedures of Environmental Impact Assessment (EIA) along with the National Environmental Management Act (No. 107 of 1998) that legislates polluters to take responsibility to minimize and mitigate pollution. Silver mining in South Africa started around 1880 when the “Pretoria Silver Belt” prospected inPretoria, Gauteng Province. Consequently, thedevelopment of mineral mining grew countrywide and as a result, many of the smaller mines were abandoned(Kgariet al., 2016; Reeks, 2012). Whenminesareabandoned,thereboundofthewatertablecanleadto contaminated groundwater to flow into underlying aquifers causing degradation to thequality ofreceivingsurfacewater andgroundwater,eventually makingit unsuitable for further use(Ciduet al., 2007; Wolkersdorfer, 2005; Youngeret al., 2005). Environmental problems associated with abandoned mines are controlled 2
by the type of mining employed (underground or surface mining). Approximation of mine water quality draining from surface mines is well developed but such is more or less absent in abandoned flooded underground mines. The flooding of underground mines might cause the supporting structures to collapse and subside causing inaccessibility to the shafts or adits of the mine. This further increases the permeability and porosity and alters the groundwater flow as the underlying aquifer becomes fractured(Boothet al., 1998; Mhlongoet al., 2016; Younger, 2000b). Hydrodynamics governing the movement and transport of mine water in flooded underground mines is not commonly acknowledged in South Africa. The general focus of most investigations in South Africa has been on contamination treatment and inhibition of water discharge(Kgariet al., 2016). However, planning remediation strategies and the calculation of reactive transport within the mine depend on the understanding of the volume of flooded mines and hydraulic properties(Wolkersdorfer, 2005). Tracer tests have been employed to trace the hydrodynamic conditions of flooded underground mines and interconnections of groundwater flow. The publications of tracer tests results in abandoned underground mines are not commonly known. Therefore,thereislessexperienceinminewater tracing.Tracers areused depending on site conditions and aims(Wolkersdorferet al., 2002). Although, in the past, tracer techniques focused on groundwater flow in karstic aquifers, there has been developed in previous decades for the use of tracers as a hydrologic investigating tool. Tracers are inferred to as any constituent which by design is introduced into the aquifer to determine flow paths, groundwater velocities, mass 3
Secure Best Marks with AI Grader
Need help grading? Try our AI Grader for instant feedback on your assignments.
flow and contamination transport(Divineet al., 2005). Understanding the hydraulic connection between mine workings, surface and groundwater is needed for source determination of water and pollutants at the discharge point as so to support remediation measures(Kgariet al., 2016). 4
1.2RESEARCHPROBLEM Thestudywasconductedtoinvestigatethepotentialminewaterand environmental pollution at the abandoned Edendale Lead Mine which is adjacent toEdendalespruitrivulet.Thewaterqualityresultswerecomparedwiththe international and national standard used to evaluate contamination of water and the toxicity thereof to the aquatic system and for human welfare. Mine water often contains potentially toxic concentrations of metals such as Fe, Al, Cr, Cd, Ni, Pb, Co, Zn and Cu. They are produced from coal or metal mining. Acid mine waters can have a pH-of –3.5 to 5, also at pH 6 – 8 which is called circumneutral. Mine waters can have elevated (semi-)metal concentrations (e.g. As, Mo, U, Sb) and F. Mine water discharging into rivers, lakes, streams or oceans might seriously degrade the water quality and cause damages to aquatic life. As described above, the main acid-producing process is the exposure of pyrite to oxygenfromairinthepresenceofwater,whichcausesbacterialcatalysed oxidative dissolution (Nordstrom, 2011b). When abandoned mines need to be redeveloped,itis,therefore,necessarytoknowthehydraulicparameters (transmissivity,hydraulicpermeability,dispersivity,porosity,storativityand transivimmitivity) which are needed for planning remediation strategies as they dictate where the mine water flows to. Metals and metalloids may contaminate surface waters as a result of wreathing of waste rocks when it rains the intrusion of rain into these waste rocks results in metal flowing from these sites into receiving waters and transported downstream 5
asdissolvedminerals,thismayhaveasubstantialinfluenceontheriver. Increasing movement and biological availability of minerals, thus impacting on the natural balance. Sediments are basins for pollutants in the aquatic environment therehavebeengenerallyacknowledgedandasanoutcome,itleadsto undesirable influences to the benthic ecosystem(Beaneet al., 2016). This study was relevant because there is a primary and high school nearby and the mine is located adjacent to the Edendalespruit, where numerous farms and some private residential areas rely on borehole water that might be polluted by the mine(Glass, 2006). 1.3GENERALAIMSANDOBJECTIVES Themainobjectivesofthepresentstudyweretodeterminethehydraulic parameters in mine water in the abandoned Edendale Lead Mine with the aim of identifying potential mine water pollution sources using tracer tests. In order to achieve the main objectives, the following activities were carried out i.Characterize the mine water quality, in terms of chemical analysis using ICP-OS and Ion chromatography and onsite parameters ii.UnderstandthehydrologicalsituationaroundEdendaleLeadMine, determine the stratification in mine water of the abandoned Edendale Lead Mine. iii.Conduct tracer test, tracer solute injection into shafts of the Edendale Lead Mine to determine hydraulic connectivity. 6
Paraphrase This Document
Need a fresh take? Get an instant paraphrase of this document with our AI Paraphraser
2LITERATURE REVIEW 2.1CHEMISTRYOFMINEWATER 2.1.1Mineraldissolution as asource ofcontamination Groundwater chemistry is influenced by rock and water interactions also the dissolution of minerals(Kumar, 2014). Dissolution occurs when there is contact betweenwaterandrock-formingmineralsthuschemicalweatheringoccurs (Matthess, 1982). According to(Andrewset al., 2013)when water especially acidic water and oxygen attacks minerals this is known as chemical weathering and dissolution is a type of chemical weathering in which soluble minerals dissolve. According toAlamet al.(2014)when dissolution occurs the by-products of these minerals results in contamination of groundwater as the concentration of mineral composed in an aquifer and/or exposed by human activities is increased. Minerals are naturally occurring they are found underground and on the surface in ores, rocks and natural mineral deposits furthermore, these minerals are maybe underoxidizingorreducingstateinwhichdissolutionorhydrolysiscan occur(Schreiberet al., 2013). Underground mines have audits and shafts through which mine water may be discharged, these openings are mined and allow sudden water intrusion when mining has ceased, however, the water flowing in this openings will interact with mineral sulphide in little time discharging water with low metal concentration and if 7
water accumulates and discharges at a lower flow rate mine pools are formed and mine water flows into nearby aquifers (Nordstrom et al., 2015). The EPA under the Safe Drinking Water Act defines a contaminant as “any radiological, chemical, physical or biological substances or material which dissolve inwatermay”.(Fetter,2000)statesthattherearedifferenttypesofwater contaminants which may migrate from groundwater to surface water vice versa reaching the aquatic environment or affecting the water used by humans for domestic, agricultural andrecreational uses. These contaminate according to Fetter,2005maybeorganicorinorganicchemicals,pathogens,and hydrocarbons. EPA has listed inorganic chemicals as follows, Sb, As, Cu, Cn, Fe, Al, Mn, Zn, Pb and anions (SO42-, Cl-, F-, NO3-) and cations (Mg, Ca, Na, and K). Inorganic chemicals may also be referred to as metal and metalloids contaminate. Minesareknowntodischargeminewaterwithelevatedconcentrationsof inorganic contaminants.According to(Wolkersdorfer, 2008), mine water has high levels of trace element metals (copper, zinc, lead iron, and metalloids (arsenic and antimony)includinganionsandcationssuchassulphidesandcarbonates. However, many trace element metals and/or metalloids are evaluated by the redox process as they become hydrolysed because they exist in more than one oxidation state the commonly found in mine water are:- Se[Se(IV), Se(VI)], Mn [Mn(II), Mn(IV)], Cr[Cr(III),Cr(VI)],Cu[Cu(I), Cu(II), Fe[Fe(II),Fe(III)andAs[As(III), As(V)],(Luomaet al., 2008). The major process that influences hydrogeochemistry cycle of elements globally whereby water is the transport of dissolved particles from land to sea (Stumm and 8
Morgan, 2012). When the dissolution of minerals occurs there is an alteration of rocks into soluble materials and soils into residues and sedimentary rocks(Stumm et al., 2012). Minerals may be categorized into primary, secondary, tertiary and quaternary minerals. Primary minerals are those which are originally occurring in ore such as silicates, carbonates and sulphides, when these minerals are oxidized they form secondary minerals which include sulphide minerals such as gypsum and other iron hydroxides when samples are taken the measured minerals such as calcium and magnesium are regarded as tertiary minerals including sulphates such as covellite however when samples are dried and stored the resulting minerals are regarded as quaternary and they may be hydrated iron sulphide such as siderotil or rozenite(Nordstromet al., 2015). Antimony occurs in the environment resulting from mining activities consequently it isanaturallyoccurringmetal(Okkenhuang,2011).Thecommonantimony minerals are stibnite, valentinite, senarmontite, and cervantite. Antimony occurs on group 15 of the periodic table it has similar properties as arsenic, it is a metalloid which is considered harmful to both aquatic environment, human beings and animals as it is commonly found in soils of abandoned smelters or mines (Fu, 2010). Antimony world reserves are found in South Africa, Mexico, China and Russia where lead, copper and silver ores are mined (Filala, 2002). In natural environments antimony is found in four [Sb (0), (-III), (III) and (V)] oxidation states however, the common oxidation states are Sb (V) and it has been 9
Secure Best Marks with AI Grader
Need help grading? Try our AI Grader for instant feedback on your assignments.
stated that in aerobic conditions the Sb (V) is dominated while Sb (III) is found in watery surroundings furthermore the antimony found in watery environment is toxic as compared to the aerobic antimony (Wang, 2011) and (Okkenhaug, 2011). Zinc is an abundant element that is listed 23rdcommonly found element within the earth (Flourance, 2014). The presence of zinc in the environment is sourced from mining activities and it is found in concentrations of 1μg/L through the dissolution of rocks in mining areas or abandoned mines(Borroket al., 2008). Sphalerite is the major component of zinc and it is found in pyrite deposits including copper and galena(Chandraet al., 2009). However, unlike other metals zinc is not redox active(Borroket al., 2008). Zinc can be found as free zinc ion (Zn2+) or attached to other compounds such as oxides under aerated conditions and under anoxic conditions, it attaches to sulphide and carbonates(Hofmannet al., 2008). The sphalerite breakdown it releases sulphide and zinc ions, the process is reversible as no solid species has been formed in equation 1.(Wolkersdorfer, 2008). According toChandraet al.(2009), pure sphalerite is mainly made up of zinc it constitutes 67 wt% of zinc, however, when sphalerite occurs in nature it has some impurities and iron in high concentrations the two types of sphalerite may be classified as high or low iron content sphalerite respectively. ZnS + 2O2→ Zn++ SO42-(1) The zinc ions released in equation 1. when hydrolysed they release protons which lower the pH in the aquatic environment and forms hydroxides, as in reaction 2 (Hofmannet al., 2008). 10
Zn++ H2OZn(OH)⟶++ H+(2) Furthermore, the dissolution of sphalerite may be caused my catalyst such as Thiobacillus ferrooxidant at very low pH after hydrolysis a condition best suitable for ferrous iron to be oxidised to ferric iron this dissolution leads to ferric iron being released into the aquatic environment as in reaction 3(Hofmannet al., 2008). ZnS + 2Fe3+Zn⟶2++ S+2Fe2+(3) The reactions show that zinc and other elements are transported into the aquatic environment through the dissolution of sphalerite. When the dissolution of ZnS occurs the metal concentration may be elevated and when hydrolysis results from dissolution the pH can be lowered. When zinc is in the aquatic environment at concentrations above the essential it can be harmful to both plants and animals making its way through the food chain to humans. The 34thelement in the earth’s crust is lead which is found in group 14 on the periodic table it is commonly used for industrial processes(Snogaass, 1986). Furthermore, the uses of lead include the making of electric cables, roofing, piping, and batteries(Lurie, 1981). Galena is the important mineral in which 90 % of lead in the world is found other lead sources that contribute a small percentage are cerussite and anglesite they occur when galena is altered by sulphide or/and carbonates(Snogaass, 1986). In the presence of dissolved oxygen dissolution of galena occurs as seen in equation 4. 11
PbS + 2O2→ Pb2++ SO42-(4) Galena and sphalerite always occur together, however; galena comprises of silver and other elements such as arsenic, antimony and bismuth whereas sphalerite comprises of iron(Snogaass, 1986). According toJoneset al.(2013)in lead mines, the expected metals in water resources are lead, zinc, sulphide, iron, and cadmium they are products of the dissolution of galena and sphalerite. When the dissolution of carbonates and sulphide minerals occurs there will be elevated concentrations of calcium and sulphide in the receiving water resources (Leeet al., 2005). Opencast mines cause contamination when minerals become soluble upon contacting mine water in this way contaminants are released into the environment (Stefania, 2005). Consequently, in aquatic environment when galena, antimony and sphalerite are in dissolution they release protons, sulphide, iron and other metals, the mobile lead and zinc ions are transported into the nearby water resources this poses a direct or indirect threat to the well-being of humans and the health of the ecosystem(Zhanget al., 2011). Dissolution of minerals described by Navarro, 2008, a case where a substantial influence on metal concentration resulting from sphalerite which gave off zinc, cadmium, arsenic from pyrite and lead and copper from galena in Cabezo Rajao abandoned mine which discharged into surface water thus river downstream. 2.1.2Mobility of contaminants - effects of pH Themobilityofmetalsandsemi-metalsinminewaterisinfluencedbythe 12
Paraphrase This Document
Need a fresh take? Get an instant paraphrase of this document with our AI Paraphraser
concentration of major and minor trace elements, the understanding of elevated metalconcentrationpresentinminewaterdischargeisessentialinthe determinationofenvironmentaleffectswhichminingposestotheaquatic environment, surface water and groundwater(Miluet al., 2002). The arithmetic expression used to express the activity of protons in water is known as p H it is logarithmically represented and it implies that one pH unit change symbolises a tenfold change to the proton activity which is the hydrogen ion, equation 5.(Kay, 2014). pH = − log10[H+](5) The lowest pH ever measured was by(Nordstromet al., 2000)at California’s Iron Mountain the p H was −3.6. According toKay (2014), the hydrogen activity in acidic water has high hydrogen ion activity above 10×10-7while for alkaline water the activity is less than 10×10-7, naturally pure water has the p Hof 7 at a temperature of 25°C. Reduction-Oxidation reactions are defined by electron activity and it is recorded in volts or millivolts, it measures the probability of electrons to be given off to electron acceptors in a system(Kay, 2014). The stability limit of minerals depends on pH and redox reactions; pH is known as the master variable in geochemical reactions (Stummet al., 2012). Kay (2014)states that Redox measurements can be recorded as either electron activity (pe) or quoted volts (Eh), the two are not interchangeable it is necessary 13
for theEh measurementtobeproperly recordedbecauseit is usedinthe conversion of Eh tope. The reason for the conversion process is explained by Wolkersdorfer (2008)he states that the international redox standard required the standard H2 electrode which is not suitable for field use, by the conversion the results are obtained according to the standard H2 electrode. The Eh is converted to pe by the following equation(Kay, 2014). pe=f 2.303RTEh(5) Where 2.303 is the conversion from natural log to base 10 log T is the temperature expressed in K ([K] = [°C] + 273.15) R is the gas constant (8.3144622 J K-1 mol-1) F is Faradays, constant (96,485.3365 J V-1g-1[sA mol-1]) Eh, and pH values are useful in the construction of pourbaix diagrams which illustrate the relationship between different minerals and the conditions in which they are exposed to.(the dissolved species as a function of pH and metal stability at a certain Eh value)(Al-Hinaiet al., 2014). These diagrams are useful in determining the mobility of certain elements. Some elements are insensitive to pH, they are mobile and soluble over a huge pH range these are commonly found in circumneutral mine waters which contain metals and semi-metals (Zn, Cd, Se, Pb and As)Figure 2.1. 14
Figure2.1: Solubility of metals as a function of p H(from Cravotta, 2008) The stability diagrams have been used to explain the mobility of metals in the aqueous environment, such has been seen in the study ofVink (1996)on which he showed the stability of antimony. The speciation of antimony is controlled by stability diagrams in the environment because antimony exists in both oxic and anoxic environments(Filellaet al., 2002). When the conditions favour oxidizing Sb is immobile as it forms solid oxide species (Sb2O4and Sb2O5) which precipitate into sedimentsFigure 2.2(Vink, 1996). Other solid species Sb(OH)3are formed under reducing conditions over a variety of pH values between (3 – 10) however, when pH is extended above 10 Sb(OH)3 may dissolve forming Sb(OH)4-Figure 2.2that is highly soluble and mobile under the same reducing conditions when the pH is lower than 3 a soluble species Sb(OH)2+is formed(Filellaet al., 2002). In the presence of sulphur Sb2S3(s) is formed when the pH is low, however, it is replaced by SbS2species at high pH this activity occurs under reducing conditions 15
Secure Best Marks with AI Grader
Need help grading? Try our AI Grader for instant feedback on your assignments.
(Filellaet al., 2002). The mobility of antimony species depends on the pH and redox, the release of antimony species into the environment is driven by these two factors because transportation into receiving water environment transpires when species are dissolved (in ionic form). Figure2.2: Stability diagram for Sb-species in the Sb – S – H2O system(from Filellaet al., 2002). Although oxidationof antimony canbeboth pentavalent andtrivalent in the environment the Sb species are available and mobile regardless of the state of oxidation and the mobility is affected by sorption more than it is by precipitation. According to(Wilsonet al., 2010)when Sb(OH)6-species are dominated there is anincreaseinmobilityofSb(V)inacidicenvironmentsfurthermore,the 16
occurrence of Sb(III) relates to the high presence of Sb2O3which is not pH dependent and it is consistent with Sb(OH)3in aqueous system. The hydroxyl groups are known to dissociate at high pH and give off hydrogen ion when pH is low at the surface this results in both negative and positive charge beinggivenoff,showingelevatedantimonyconcentrationsatlowpHand antimony oxides may be formed at pH above 12(Cravotta, 2008).Furthermore, the negative charges (oxides) adsorbs cations such as Cu, Zn, Ni, Pb and Cd while positivelychargedadsorbsoxyanionssuchasselenite,selenite,sulphate, arsenate, barate and arsenite at low pH. Nuttallet al.(2000)in their study to remove zinc in circumneutral mine water showed that sphalerite is steady in a wide pH variety in reducing environments Figure 2.3however, under oxidizing conditions at a p H of 7.5 – 8 zinc forms smithsonite which precipitates this process happens in a closed system where mine water is exposed to limestone. The free zinc ions can be seen at very low and neutral pH (0 – 7) when sphalerite is oxidized. According toNuttallet al. (2000)zinc is less mobile when it forms ZnCO3this process increases pH of mine water in this way zinc is completely removed or the concentration is lowered from circumneutral mine water. ZinchydroxidesoccuratveryhighpHoccursatoxidizingphase.These hydroxides may dissociate at the surface or protonate as stated previously in the case of antimony. Contamination of water resources and soils by zinc mobility is dependent on the pH of the water and the redox condition. 17
Mobilizationofcontaminationdependsontheenvironmentwhetheroxidising and/or reducing conditions (Arhin et al, 2015) Under oxidising conditions sulphide minerals are unstable and as a result, they release elements Fe, Pb, Cu, Zn and As on water surface. Although these elements are considered toxic by WHO, 2014 established that Cu, Fe and Zn are essential to human beings but only at a certain dosage but Baron, Ca, F, selenium is toxic even at low concentrations When the conditions are oxidizing dissolved minerals interacts with either the secondaryorprimarymineralsreleasingprotonswhichdecreasespHand increases metal concentration (Fe, Cu, Pb, Hg, Ni, Co and Cd) and metalloids (Sb, As, Al, Si, B, Mn and Li). It has been reported that pH depends on the chemical composition of host rock when secondary minerals are formed the present metals become immobile(Atanackovićet al., 2013; Youngeret al., 2004). Figure2.3: Eh-pH diagram for zinc( from Nuttallet al., 2000) 18
Paraphrase This Document
Need a fresh take? Get an instant paraphrase of this document with our AI Paraphraser
2.1.3Pyrite and sulphide mineral weathering The weathering of pyrite and sulphide minerals occurs when mining activities exposes these minerals to oxygen, water and/or microorganisms, this has caused environmental problems because weathering results in metals being released or transported into the receiving environment, aquatic or water resources for instant pyrite releases iron while sphalerite releases zinc(Johnsonet al., 2005). The most abundant sulphide mineral on the crust of the earth is pyrite and it is commonly associated with metals released from sulphide ores(Johnsonet al., 2005). Waste rocks, stockpiles or mine working comprises of pyrite and sulphide minerals these minerals are prone to weathering and they release Zn, Hg Cd. Cu, Cd, Ni, and Al in groundwater and flooded mine workings or water flowing from these sites(Bloweset al., 2003). When mining ceases and no mitigation is done to rehabilitate the mined area, the environmentandecosystemarenegativelyaffectedbyelevatedmetal concentration and low pH because the exposure of sulphide minerals in waste rocks or stockpiles exposed to climatic conditions accelerates acidity which causes metals in these minerals to dissolve consequently, in open shafts and audits oxidisingconditionsaredominatedbywatermayinfiltrateoroxygenas ventilations do not work anymore this is favourable to weathering of pyrite and sulphide minerals these activities produce Acid Mine Drainage(Lghoulet al., 2014; Younger, 2000c). 19
Water discharging from mine workings and sites surrounding the mine working has been seen to have degraded quality because they have in contact with pyrite and sulphide-rich rocks or waste rocks at favourable conditions for oxidizing minerals (Younger, 2000c)the water drainage from such will contain elevated levels of dissolved metals and sulphate. Weathering depends mainly on the conditions such as how much oxygen and water is available, temperature and in other cases the amount of dissolved ferric iron regenerated, this can be seen in the weathering of galena in the atmosphere which will release lead oxides and lead hydroxide and when galena is weathered in an aqueous environment at surface it will form lead carbonates and lead sulphide which may be discharged into aquatic environment. Weatheringcanbephysical,chemicalor/andbiological.Physicalweathering composes of a mechanical process which fragments rock into smaller particles by temperature or erosion rock material is then exposed to chemical weathering which occurs when the rock material comes into contact with water especially acidic water and gases in the atmosphere, however; biological weathering is when bacteriaeatontherockmaterialthesebacteriaarecatalystsinweathering (Andrewset al., 2013). Pyrite and other sulphide related minerals weathering is considered as chemical weathering which involves oxidation of the minerals, this occurs as a result of decomposition of reductive material as free oxygen is used and the process can be enhanced by bacterial activities. furthermore, protons and trace elements are 20
emitted into the environment and degrade the quality of water(Andrewset al., 2013; Ramos Arroyoet al., 2007). AccordingtoWhite(2013)oxidationisvitalingeochemistrybecausemost elements when in nature they have more than one valance and this influences the geochemical behaviour of these elements such as iron. Iron is known to be the most abundant element in the earth’s crust(Albarède, 2003). Iron is commonly a contaminant of mine water discharge which occurs in both acidic and circum-neutral pH(Holmeset al., 2000; Younger, 2000a)Pyrite is known as “fools gold” iron sulphide with a chemical formula (FeS2). The common sulphide minerals that produce acid are marcasite, chalcopyrite, pyrrhotite and pyrite when weathered these minerals transfers electrons(Valente et al., 2009). When metal dissolves from primary acid-forming minerals, secondary sources of acid production are formed this process is naturally(Bowellet al., 2000).Secondarymineralswhichareformedwhenpyriteisweatheredare goethite,ferrihydrite,schwertmannite,hematiteandjarositetheformationis dependent on the geochemistry of the mine water. There are a few steps involved in pyrite weathering and they are known to be vital to the end of the process the first one is the oxidation of Sulphur, followed by ferrousironbeingoxidizedfinallytheprecipitationandhydrolysisofferric compound minerals take place(Dold, 2010). 21
Secure Best Marks with AI Grader
Need help grading? Try our AI Grader for instant feedback on your assignments.
Figure2.4: Pyrite oxidation simplified diagram showing reaction pathway(from Bankset al., 1997). Weathering of iron disulphide pyrite occurs in equation 6 – 9(Bowellet al., 2000). The oxidation of pyrite increases iron and sulphide concentration when the ferrous iron is further oxidized it form ochre this lies on river beds causing a detrimental effect on the ecosystem of the river(Bankset al., 2001). When ferric iron is oxidized from ferrous iron it can precipitate from the solution forming ferrihydrite when the pH is nit low enough to maintain the ionic form, this precipitation happens in form of either goethite or ferric hydroxides(Belzileet al., 2004). FeS2+ H2O + 7/2O2→ Fe2++ 2SO4–+ 2H+(6a) 22
2FeS2+7O2+ 2H2O → 2FeSO4+2H2SO4(6b) Fe2++ H2O + O2→ Fe(OH)3+ 2H+(7a) 2FeSO4+H2SO4+ 1/2O2→ Fe2(SO4)3+ H2O(7b) Fe2++ 1/4O2+H+→ Fe3++ 1/4H2O(8) FeS2+14Fe3++ 8H2O → 15Fe2++2SO42-+16H+(9) In their study (Bowell et al., 2000) showed how the reactions of pyrite weathering take place in phases and what it involves. It can be seen in the equations that the most important aspect is the presence of oxygen. Phase 1 Equation 6(a) occurs in an abiotic environment and is enhanced by bacterial oxidation especially equation 6(b). Equation 7(a) also occurs in an abiotic environment, it becomes slow as pH drops to 4.5 which it elevates sulphate concentration and decreases iron and drops pH again equation 7(b)is associated with bacterial oxidation. Phase 2 Equation 6(a) and 6(b) continues in an abiotic environment and is still enhanced by bacterial oxidation 23
Equation 7(a) and 7(b) continues at frequency that is determined mainly by action of bacteria such asT.ferrooxidansAt this phase, the adequate pH is lower than 2.5 in this phase again the iron and sulphate concentrations are elevated and the ratio of ferrous to ferric iron is low Phase 3 Equation 8 occurs at a speed that is controlled by activity ofT.ferrooxidans Equation 9 will occur at a rate controlled by the speed of equation 8, however, the favourable conditions for this reaction are pH lower than 2.5, resulting in high concentrations of sulphate and total iron including a high ratio of ferrous/ferric. According to(Aykolet al., 2003)oxidation of pyrite disulphide which is a major source of AMD, it is not the only acid forming process, there is a need for oxidation of ferrous iron and hydrolysis of ferric iron to further increase the acid formation (Holmeset al., 2000). Second,topyrite,pyrrhotiteisthecommonlyknownironsulphidemineral. Pyrrhotite instigate in waste from sulphide ores and it is associated with galena, pyrite and chalcopyrite, publications on weathering of pyrrhotite are rare however the production of acidity is similar to that of pyrite(Dold, 2010). It is common in mafic and volcanic rocks, it is a non – stoichiometric composition x which can be 0 or 0.125 an iron lattice valance, commercially the pyrrhotite ore is found in copper and nickel deposits in countries like Canada, Australia, Russia and China(Belzile et al., 2004). 24
Paraphrase This Document
Need a fresh take? Get an instant paraphrase of this document with our AI Paraphraser
Dold (2010)in his study showed that weathering of pyrrhotite is similar to that of pyrite and it can be expressed as equation 10. Fe(1-x)S + (2-x/2)O2+ xH2O → (1-x)Fe2++ SO42-+ 2xH+(10) The oxidation agent in the oxidation of pyrrhotite can be ferric iron (equation 11) which was formed in pyrite oxidation this is because oxygen is not the only oxidant this is seen when microorganisms at a later stage oxidize pyrrhotite producing acid consuming products(Belzileet al., 2004). Fe(1-x)S + (8-2x)Fe3++ 4H2O → (9 – 3x)Fe2++ SO42-+ 8H+(11) This process proceeds in an acidic environment in the presence of elevated ferric iron concentration, because under this environmental condition ferric ions remain in solution and behave as an oxidizing agent for as long as the pH is acidic producing ferrous iron, sulphate and hydrogen ions(Belzileet al., 2004). In acidic environment pyrrhotite is known to dissolve at a fast rate the main products are ferric iron and hydrogen sulphide, however the dissolution can be slow in moderate conditions causing slow production of iron with little or no generation of hydrogen sulphide in anoxic environment this is known as a non- oxidative process(Belzileet al., 2004). Another iron sulphide mineral which produces acidity in water is chalcopyrite and the oxidation may be written as equation 12 although this shows no production of hydrogen ions the acidity production can be seen when the ferrous ion is oxidized 25
and there is hydrolysis of ferrihydrite equation 13(Dold, 2010). 2CuFeS2+ 4O2→ 2Cu2++ Fe2++ SO42-(12) 2CuFeS2+17/2O2+ 5H2O → 2Cu2++ 2Fe(OH)3+ 4SO42-+ 4H+(13) Chalcopyrite is non sensitive to oxidation, the rate of oxidation is enhanced by the presence of ferric iron(Dold, 2010). Iron Sulphide mineral such as arsenopyrite is associated with gold in many cases arsenopyriteisminedand goldisextractedfrom arsenopyrite, however,the oxidationoccurs duringweatheringprocessesandunderreducingconditions arsenopyrite is found to be stable(Corkhillet al., 2009). When FeAsS is oxidized sulphate and arsenic are produced, it has been seen in some studies that the degree of oxidation is more rapidly than that of pyrite, galena, chalcopyrite and sphalerite(Bloweset al., 2003). Arsenopyrite is oxidized according to equation 14 when the reaction occurs at the same time as the oxidation of ferrous iron which leads to the precipitation of ferrihydrite it is expressed as equation 15(Dold, 2010). The process for the oxidation of arsenopyrite is the same to that of pyrite however it is slower when the oxidant is oxygen(Dold, 2010). 4FeAsS + 13O2+ 6H2O → 4Fe2++ 4SO42-+ 4H2AsO4-+ 4H+(14) FeAsS +7/2O2+ 6H2O → Fe(OH)3+ SO42-+ H2AsO4-+ 3H+(15) 26
Marcasite chemical formula mimics that of pyrite also proton generation when oxidized, the rate at which marcasite is oxidized is faster compared to pyrite because of the large surface area of the fine grain size(Dold, 2010). The above reactions of weathering are the main producers of acid mine drainage, thecontaminationofwaterresourcesisnotonlylimitedtosulphideand protonation but the dissolution of other minerals in acidic conditions which are found when the weathering of iron sulphide minerals proceeds. 27
Secure Best Marks with AI Grader
Need help grading? Try our AI Grader for instant feedback on your assignments.
2.2STRATIFICATION 2.2.1Stratification in lakes Thehydrodynamicsoflakesarecontrolledbynutrientsandheat,the understandingofthesehydrodynamicsprocessesassistinwaterquality managementofwaterresources(Elçi,2008).Stratificationoflakescanbe chemical or thermal and it is commonly distributed in the summer season and it is established by vertical profiling(Yuet al., 2010). The most important factors in Lake Ecosystem are temperature and oxygen, the change in temperature has substantial influence in the biochemical processes which takes place in the lake(Antonopouloset al., 2003). It is known that the dissolved substances and oxygen in the lake ecosystem are controlled by thermal stratification this happens when there is cooling or heating of water, a density profilethatisverticallystablecanbeobservedwhenthereisachangein temperature there will be mixing of the two layers epilimnion and hypolimnion (Readet al., 2011) In summer the upper layer is less dense it floats above the dense cooler bottom layer this is because the epilimnion is heated, when there is a temperature difference between the two layers they remain stratified thermallyFigure 2.5(Elçi, 2008). Furthermore, the chemical and biological properties of these layers are different in the upper layer, photosynthesis takes place, and there is high dissolved oxygenconcentrationas algae, however,thebottomlayerdecompositionby 28
microorganisms which feed on organic matter reduces the percentage of dissolved oxygen, the sediments at the bottom of the lake or stream exchange chemical species with the hypolimnion layer(Çalışkanet al., 2009). In autumn epilimnion cools down the decrease in temperature results in the metalimnion disappears as the two layers mix forming one hydrological body, in this case, the chemical and physical properties remain the same this increases the biological activity and leads to disturbance in the ecosystem function of the lake or stream(Manahan, 2010). The above statement shows that the feeding for fish may be limited causing them to migrate because of nutrients, light accessibility and microbial materials used by microorganisms disturb the vertical stable density (Readet al., 2011). Figure2.5: Stratification of lakes(from UFI, 1994) Stratification can proceed for a limited time period or carry on for a longer time it depends on the time scale it can hours or years, there is decomposition of materials in which proceed as a result of mixture mechanisms(Readet al., 2011). The consideration of temperature change with respect to change in depth has 29
been used to determine lake dynamics through the thermocline a barrier between epilimnion and hypolimnion layers(Readet al., 2011). Pit lakes are formed when mine voids are flooded, in countries like USA they are called pools while in Scotland they are ponds or basins. In their study of pit lakes stratification showed that the ponds at the abandoned Frances Colliery in Scotland were chemically stratified with good water above as well as poorer water at the bottom. Waters of the mine are affected by the same geochemistry therefore, suggests that the shafts should not be considered separately but as mine pools because of the similarity of water quality properties(Elliotet al., 2007). Pit lakes may have two layers and as natural lakes the barrier is known as chemoclinewhiletheupperlayerisreferredtoasmixolimnionand monomolimnion the bottom layer, at the Iberian Pyrite Belt showed a permanent stratification with high oxygen concentration in the upper less dense layer while the bottom dense layer, anaerobic layer is separated by the chemocline the lake does not allow for mixology(Españaet al., 2009). The stratification of the mixolimnion is seen by the change in gradient which illustrates the change in physical and chemical properties in respect to depth however, the monomolimnion is can have no changing gradient or can be stratified with a steep gradient change as the mixolimnion layer(Españaet al., 2009). Españaet al.(2009)in their study of the Cueva de la Mora pit lakes observed stratificationinwhichtherewasanincreaseintemperatureandelectrical 30
Paraphrase This Document
Need a fresh take? Get an instant paraphrase of this document with our AI Paraphraser
conductivityFigure 2.6the upper layer is about 10 m and the bottom layer at a depth of 40 m. The temperature profile is uniform 17 and 18°C at the bottom layer while the upper layer was stratified sharply. According to the specific conductivity profile was stratified with a sharp gradient in both the bottom and upper layer from conductivity of 2 to 12 m S/cm. The result of the stratified pit lakes in Cueva de la Mora showed that the upper layer had better water quality than the bottom layer with elevated sulphide concentrations(Españaet al., 2009). Figure2.6: Temperature and specific conductivity profile of Cueva de la Mora Pit Lake (from España et al., 2009). 2.2.2Stratification of underground mines The stratification of underground mines is similar to that of lakes or pit lakes in the sense that there is density difference within the layers,(Nuttallet al., 2004) describes how stratification in underground mines is formed and how it can be disturbedFigure 2.7. When the mine voids filled up as the water table rebound 31
takes place, the water in the shaft rises to a level below the adit and the water in the shafts becomes stratified, with the upper water with better quality overlying the bottom poor quality water. The recharging continues and more water flows into the shafts from the adits causing turbulent flow and disturbs the stratification because the mine water flowing into the may have different chemical composition to that in the stratified shaft however, re-stratification can beexpected as the shaft is flooded and the water settles, the flow becomes laminar again the steadiness in the shafts allows different densities to be observed(Nuttallet al., 2004). Figure2.7: Development of stratification in mine water in a shaft and how it is lost(from Nuttallet al., 2004) Wolkersdorfer (2008)provided a detailed description of stratification in flooded undergroundmines.Stratificationhappenswhenthephysicalandchemical properties of water profile in the horizontal layer are different.Stratification is a phenomenon of both coal and metal mines in which there is a change in water quality parameters occurred with increasing depth. 32
Stratificationofminewaterprovideschemicalpropertiessuchaselectrical conductivity and thermodynamic which can be measured as temperature changes with depth. Stratification has been known as a method of mine water remediation because it assists on the understanding of the physical profile of mine water strata (Wolkersdorfer,2008).Thedensityofwaterisdependentontemperature, pressure and chemistry composition(Dietzet al., 2012). Physical properties such as viscosity, temperature and density when they change physical and chemical characteristics of the different horizontal layers(Wolkersdorfer, 2008). The mine water in shaft 2 of Jindrich density was influenced by elevated metal concentration and increased pressure this caused mine water to be steady with stratified layers (Johnson and Younger, 2008). Accordingto(Wolkersdorfer,2008)stratificationoffloodedmineshasbeen studied worldwide in Germany, USA, UK, Austria and Africa. Mine water can be stratified for years and may not be affected by(Zemanet al., 2008). Stratification profile in the abandoned Frances colliery which showed temperature and EC profiling stratified mine water was evident from better water quality overlying poor water qualityNuttallet al.(2004). The Frazer’s Grove mine showed elevated concentration of iron, sulphate and zinc thus the mine water was acidic as a result the conductivity ranged between 500-3200μS/cmFigure 2.8stratified mine water wasevidentseenfromthelowpHinthelowerpartsofthemineanda circumneutral pH at the upper parts of the mine water(Johnsonet al., 2002). 33
Secure Best Marks with AI Grader
Need help grading? Try our AI Grader for instant feedback on your assignments.
Figure2.8: Conductivity and temperature log of No. 2 Shaft at Frazer's Grove Mine(from Johnsonet al., 2002) A study conducted in Oklahoma, USA at the Picher Mining District whereby galena and sphalerite were mined. The mine was about 200 m deep and known to be the largest lead and zinc mine fields. The pH of the mine water was between 4 and 5. The stratification study showed that there was no connection among the upper and lower layers however a connection was found between shafts hydraulically as seen by the similarity of temperature and electrical conductivity in different shafts and depth (Wolkersdorfer, 2006). Other studies such as the one conducted in Pennsylvania Anthracite Fields showed an EC profile increase with depth from 400 -1000μS/cm in shallow parts of the mine while in deeper parts of the mine EC increased from 1000- 1400μS/cm,the deeper parts of the mine has slow-moving subsystems with poor water quality(Coldeweyet al., 1994). 34
2.3MINEWATERANDGROUNDWATERAQUIFER 2.3.1Characteristics of mine water aquifers and mine pools Acharacterizationofthevolumeofgroundwaterwhichaccumulatesinthe cessation of underground mine is known as mine pool, an aquifer is defined by means of a “geological unit that can store and transmit water at rates fast enough to supply to a borehole” aquifers are heterogenic and their thickness are different in distance over many meters.(Feeley IIIet al., 2003; Fetter, 2000; Yaoet al., 2016). Man-made aquifers which are created during mining operations are the sources of Acid Mine Drainage which is caused by exposed surface areas through which water flows in a permeable media by interconnected shafts and audits (Cánovaset al., 2016). Historically groundwater movement and transportation of solutes in aquifers has received attention from engineers and geoscientists for a clear understanding of these systems(Abdelazizet al., 2015). The interest in aquifers has led to characterization of aquifers worldwide, such as in the study ofVíaset al.(2010)in Europe that mapped carbonate aquifers to analyze their vulnerability and the study ofAbiye (2010)in East Africa which mapped the transboundary aquifers characterizing the recharge conditions and nature of host rocks. When it comes to aquifers in Africa there is less information especially on basement aquifers which are fractured and weathered in the Karoo also the shales which are found in West of Africa consequently, characterization of aquifers assist hydrologists to effectively protect subsurface water as a resource of economic value(Robinset al., 2007). 35
Abiye (2010)demonstrated that aquifers may be shared among countries such as aquifers of Ethiopia–Eritrea; Kenya; Sudan; Somalia; Djibouti. Carbonate rocks dominate Ethiopia-Somalia shared aquifers they have characteristics of dissolved cavitiesandhighwatersupplyfromtheirfracturedfeatures.Theaquiferof Ethiopia–Eritrea comprises of limestones and sandstones with a great possibility of groundwater production in contrast the Ethiopian- Kenya shared aquifer is made up of basaltic rocks that are fractured with multi-layer aquifer whereas lithology of Ethiopia–Sudancomprisesofgreenschists,ultramaficandmarblerocks interconnectedwithvolcanicrocks,alluvialdepositsandsedimentaryrocks. Beneath sedimentary rocks lies volcanic rocks which are fractured and weathered acting as the main groundwater supply, the source of groundwater in Ethiopia– Djibouti aquifers is controlled by alluvial and volcanic aquifers main rocks are basalts, siliceous and chorora characterized by intensive fracturing(Abiye, 2010). In South Africa the Karoo Supergroup covers about 50% of the geographical area and it is regarded as the largest groundwater supply of the arid and semi-arid zones in the country. The aforementioned comprises of weathered semi-confined, unconfinedshallowaquifersandfracturedsemi-confinedandconfineddeep aquifer systems. Other aquifers in South Africa include those found in Transvaal Supergroup (dolomitec aquicludes), Ventersdorp Supergroup (ventersdorp lavas) and Witwatersrand Supergroup (confined fractured aquifer)(Bothaet al., 2004; Witthüseret al., 2015). Four major provinces in South Africa are supplied by the karstic dolomitic aquifers of the Malmani Formation of the Transvaal Supergroup, the aquifer encompasses more water than the Vaal Dam(Durand, 2012). 36
Paraphrase This Document
Need a fresh take? Get an instant paraphrase of this document with our AI Paraphraser
However the aquifers found in the Karoo formations supply water irregularly the reason behind this is the formation features (compact rocks and water storage occurs on perpendicular fractures) subsequently these properties serve as flow pathways the fractured hard rocks make borehole drilling difficult even so many of theSouthAfricantownsaresituatedinsuchaquiferssuchasinDalmas, Mpumalanga receives its water supply from karstic dolomitic aquifers(Bothaet al., 2004; Robinset al., 2007). Fracturedaquifersarecommoninmetamorphic andigneousrocksfoundin shared aquifers of Ethiopia-Somalia. The heterogenetic properties govern the movement of groundwater and hydraulic conductivity and these aquifers possess different features such as flow of groundwater predominantly taking place in the fracturedzones,unconnectedgroundwatermovementpathsandchanneled groundwater movement(Abdelazizet al., 2015; Abiye, 2010). Volcanic and alluvial aquifers are common in metamorphic rocks characterized by weathered features and manifestation of water in lower depth such aquifers are shared in Ethiopia- Djibouti regions (Abiye, 2010). Karst aquifers are categorized by effective groundwater drainage resulting from the development of caves different hydraulic properties and large voids. Major rock hosts for karst aquifers are dolomite, gypsum, quartzite and anhydrite(Kaufmann, 2016). The dissolution of these host rocks by acidic water forms cavities leading to the change in porosity and hydraulic conductivity of the aquifer system as the host rocks become more fractured(Kaufmann, 2016; Wolkersdorfer, 2008). 37
Crystalline aquifers allow secondary permeability through deformation and faulting in marble layers. The rate of rainfall substantially influences the water supply of crystalline aquifers, lower rainfall consequently lead to little or no water quantity (Abiye, 2010). 2.3.2Aquifer parameters Inhydrologicalstudiesoffracturedrocksitisimportanttopredicttheflow contaminationtransferinheterogeneoussystems(LeBorgneetal2007). Hydraulic conductivity is directly proportional to grain size in a porous media (Odong, 2013). Understanding it is important in water flow as it controls mobility of pollutant transportation. Geologicalstructuresandgeomorphologydeterminestheoccurrenceof groundwater including the availability of recharge sources. Hydraulic parameters control the movement and storage of water. The factors that control migration of pollutants include the chemical and physical properties of contaminants further affected by properties if soil and aquifer. The properties of soil and aquifer are directlyproportionaltohydraulicparameters(Hiscock,2005).Changein permeability causes permanent effects such as depressed water level, change discharge (Booth, 2005). Hydraulic conductivity is the measure of the ability of a porous medium to transmit under a hydraulic gradient. It controls the velocity of groundwater flow which controls the velocity of pollutant flow through the aquifer. High conductivity equals 38
increased susceptibility to contamination(Hasiniainaet al., 2010)The measure in which water can move in a horizontal direction through the thick aquifer is known astransmissivity.Inapermeablerockwaterwhichisreleaseddefinesthe storativity of the aquifer. When there is saturation of the volume of water that is stored or released from pores resulting from mineral compression(Fetter, 2000). Dolomite aquifers found in Witwatersrand, Vereeniging and Pretoria consists of weathered rocks characterized by high storage, transmissivity and permeability and low water levels(Buttricket al., 1993). A study conducted by Schrader et al 2014 in far west rand, Johannesburg, South Africa illustrated the deeper we go down a dolomite rock dominated aquifer a decreaseinstorativityFigure2.9.Waterstorativitybyaquiferdependson fracturing and depth. Underneath the water table 40 m below surface it was observed that the percentage of storativity is high at 10% because there is more fractures (more open spaces in which water way me stored) but as we go down the karst where weathering is weak and no fractures just faults storativity becomes less with a percentage of 0.02 %. 39
Secure Best Marks with AI Grader
Need help grading? Try our AI Grader for instant feedback on your assignments.
Figure2.9: Schematic depiction of the vertical zonation of the dolomite in the FWR based on the degree of karstification/ fracturing and storativity (according to Winde et al. (2006) Barns, 2015 concluded that properties of aquifers such as hydraulic conductivity and porosity define the flowing path for groundwater whereas mobility of solutes resulting in pathway of contaminates depends on dispersivity. Brassington, 2007 provided a detailed description of the properties of an aquifer characteristics (a) hydraulic conductivity is defined as the volume of water that will flow through an aquifer in a unit time. (b) Permeability is a determinate of the rate at which water can flow through an aquifer (c) Porosity a measure of how much water is contained in an aquifer (the proportion of the volume of rock that consist of pores of the total rock mass. It is controlled by grain size, shape, degree of sorting, extent of chemical cementation and amount of fracturing). It does not provide a direct measure of the amount of water that will drain out of the aquifer becausesomeofthewaiterremainsintherock.Atermusedtodefine groundwater that drains out of the aquifer is specific yield(d) desp ersivity is a 40
term commonly used to describea manner in which water is dispersed as it flows throw an aquifer. (e) Storativity is the total volume of water in an aquifer. (f) Transmissivity Thesubsequentgroundwaterstreamexampleisnotjustcontrolledbythe arrangementofthewatertableadditionallybythedispersionofhydraulic conductivity in the rocks(Sophocleous, 2002) Stream frameworks rely on upon both the hydrogeologic qualities of the rock and soil material. Zones of high penetrability in the subsurface capacity as channels, which cause improved descending slopes in the material overlying the upgradient part of the high-porousness zone(Sophocleous, 2002). 2.3.3Interaction of mine water and groundwater The understanding of the interaction between groundwater and surface water is vital especially in areas where drought is predominating and the flow acidic mine water discharges in to rivers and streams (Nordstrom, 2011). Water in a region stream framework streams to a close-by release region, for example, a lake or stream. Water in a provincial stream framework ventures a more noteworthy separation than the area stream structure, and regularly releases to important waterways, important lakes, or to seas. A moderate stream structure is described by one or more topographic highs and lows situated between its energize and release zones(Sophocleous, 2002) 41
Groundwater moves along stream ways that are sorted out in space and frame a stream framework(Sophocleous, 2002). The collaborations of streams, lakes, and wetlands with groundwater are administered by the positions of the water bodies with admiration to groundwater stream frameworks, geologic attributes of their beds, and their climatic settings(Sophocleous, 2002) The spatial circulation of stream frameworks additionally impacts the force of common groundwater release. Water catchment may acquire groundwater from the region rapidly inside the closest topographic high and potentially from more far off territories(Sophocleous, 2002) Astheminevoidsturnouttobefulltoflooding,theexceedinglysullied groundwater can relocate into connecting aquifers or into surface waterways, where nonetheless devastating resource. Degrading the ecosystem(Younger, 2000c) water that refills the mine breaks down any acidic salts that have developed on the pore spaces of the uncovered dividers and roofs of underground loads, this underlyingseepagewaterhasatendencytobeallthemoreconceivably contaminating(Johnsonet al., 2005) 42
Paraphrase This Document
Need a fresh take? Get an instant paraphrase of this document with our AI Paraphraser
2.4TRACERS ANDTRACERTESTSINUNDERGROUNDMINES 2.4.1Types of tracers The term tracer is defined as a substance introduced into a biological system or any other system so it is consequently be distributed and it could be identified from its colour, radioactivity or its unique properties. Tracers in hydrology are aimed at validating, testing and developing proper hydrological system representations that present information by using environmental and artificial tracers(Leibundgutet al., 2011). Environmental tracers are understood as intrinsic constituents of water cycle,theyarenaturallyoccurringhowever,insomecasestheycanbe accidentally introduced for hydrogeological investigations. Tracers that are known to be artificial are defined as substances that are introduced into a hydrological system that is being investigated(Leibundgutet al., 2011). In a natural environment, tracers are used to mark patterns especially for wildlife in territorialidentificationatverylowconcentrations,inthiscase,datacanbe collected and characterization of substances achieved. Nonetheless, tracers in hydrogeology depend on the study purpose tracers may be suspended, floating or dissolvedsubstances(Leibundgutetal.,2011).Artificialtracersaidin understandingthemovementprocessesinthehydrologicenvironmentand determining hydraulic parameters and to envision flow paths within a hydrological system. These tracers are considered as a tool to characterize and understand difficult flows in the surface, groundwater, soil and aquifers or artificial systems (Leibundgutetal.,2011).Incontrast,environmentaltracersareusedto 43
understand catchment areas also historical background of water resources and hydrological data in unmeasured basins, in other cases, the use extends to integrated hydrological systems that are inaccessible(Leibundgutet al., 2011). Accordingtotheirdefinitionenvironmentaltracersareutilizedwhileartificial tracersareapplied.Insoils,surfaceandgroundwaterenvironmentaltracers diffuse or precipitate when utilized; they can be used in large areas for longer timeframes at catchment areas and help in finding solutions for applied problems. The application of artificial tracers is done in clearly defined hydrological systems at a known interval and measured tracers mass(Leibundgutet al., 2011). Pollution tracers are neither artificial or environmental they are present in a hydrological cycle through human activities such as waste disposals or the release of gaseous substances into the atmosphere(Leibundgutet al., 2011). Currently, the two main groups in tracing hydrology are subdivided according to their properties. Environmental tracers which are considered for scientific studies are stable isotopes, radioactive isotopes, noble gases, geochemical compounds, and physio-chemical parameters. Furthermore, artificial tracers that are applied in hydrologicalstudiesareeithersolutetracerssuchasfluorescence,non- fluorescent dyes, salts, fluorobenzoic acids, deuterated water and radionuclides or dissolved gas tracers and particulateTable 2.1(Leibundgutet al., 2011). 44
Need help grading? Try our AI Grader for instant feedback on your assignments.
Environmentaltracersaremainlyusedto(i)identifygenesisandwater components; this is the most cases provision of recharge elevation, volume and the distinction between summer and winter recharges and carbon dissolution. (ii) research hydrologic systems; the discovery of runoff constituents, groundwater movement, recharge, direct or indirect channels and water balances of lakes. (iii) measure flow constituents; evaluation of evaporation from rivers, lakes and seas, mapping surface waters. (iv) residence time confirmation; calculate carbon date and water movement timeframe(Leibundgutet al., 2011). The use of environmental tracers is restricted by the technique analysis ability and competenceoftracermethodandtime(Leibundgutetal.,2011).Themain advantageofusingenvironmentaltracersistheirnaturaloccurrence.These tracers can be used for local or global hydraulic investigations also be used as a tool for geological antiquity, precipitation origination or recharge and subsurface flow.Theuseofenvironmentaltracersinanyspaceandtimeallowstheir integration to give them a distinctive quality(Leibundgutet al., 2011). Integrated use of artificial and environmental tracers can enhance the success of tracerapplicationinhydrology.Intheplanningphaseofartificialtracing environmental tracer methods can be used. Unsuccessful artificial tracer test could be avoided by assessing primary residence time and analysis of flow prior to tracing test. Environmental tracers could be utilized as a secondary method for tracer testing application of artificial tracers and can be used as a control system when there is no breakthrough curve(Leibundgutet al., 2011). 46
Artificialtracersareusedtodetermineconnectivityofhydrologicalsystems, groundwater flow paths, water movement direction in aquifers and catchments, confirmation of flow velocities, aquifer hydraulic parameters that emanate from residence time, breakthrough curve and dispersion(Leibundgutet al., 2011). The most important artificial tracers are fluorescence tracers. They are commonly used by hydrologists because of their distinctive properties, easy to handle, highly sensitivity,simpletoanalyses,lowdetectionlimitandonlysmallamount necessary for field experiments(Kasset al., 1998). The most important and commonly used artificial tracers are fluorescence tracers, salt tracers are second then advanced tracers. However, drifting particle tracers are specialized and only applied in the assessment of specific investigations such as capacity filtration in unsaturated zones(Leibundgutet al., 2011). The success of tracing experiment in both field and laboratory requires an understanding of the characteristics of tracers and method applied(Leibundgutet al., 2011). Tracers in hydrology are applied to investigate water within different aspects, attributes in all various elements and underlying substances in the water cycle. 2.4.2Salt tracer physical and chemical characteristics The use of salt as a tracers in hydrological investigations provides satisfactory results 2.4.3Interpretation of salt tracer results 47
2.5EFFECTSOFMININGONTHEWATERENVIRONMENT 2.5.1Effects of mining on human health and aquatic life Many studies have been done to fully understand contamination diffusion from abandonedminesandtheirsubstantialinfluenceonwatercoursesandthe ecosystem(Palumbo-Roeet al., 2012). Consequently, the receiving water course must maintain an acceptable ecological status this can be achieved through the understanding of the effect which mining activities pose on the aquatic ecosystem through studies(Youngeret al., 2004). Watercourses which are affected by mining activities in many cases experience high iron content this is a result of ferrous iron oxidation to ferric iron the product is consequently precipitation of ferric hydroxides on stream beds(Youngeret al., 2004). Benthic invertebrates and algae are mostly affected by elevated precipitates of ferric hydroxides(Youngeret al., 2004). Other factors which contribute to the degradation of aquatic environment is photosynthesis decline this means that most primary producers are unable to produce food, therefore, there is an imbalance in the aquatic ecosystem the bottom feeders are mostly affected as there is an increase in turbidity resulting fromsuspended sediments which are discharged into watercourses(Youngeret al., 2004).It has been recorded that abandoned mines in Europe are the major environmental polluters of soils and rivers near these abandoned mining sites(Beaneet al., 2016). ## Africa and RSA. Thesecontaminatesfromtheabandonedminesareknownastheworst 48
Paraphrase This Document
Need a fresh take? Get an instant paraphrase of this document with our AI Paraphraser
environmental polluters they have a substantial influence on both human well- being and the ecosystem(Gutiérrezet al., 2016). This has been seen globally where metal discharging from abandoned mines caused severe degradation to numerous rivers as compared to agricultural pollutants(Ramaniet al., 2014). When metals and semi-metals exceed the recommended limit they may pose risk to the well-being of humans(Singhet al., 2008). It is important for the human population to have access to drinking water that is safe and clean to use for domestic and recreational purposes(Absalonet al., 2007). These metals and semi-metals pathways are through water supplies this is how humans ingest these contaminates(Thornton, 1996). Zinc is a well-known essential element which helps the body in the production of enzymes, it supports growth and generation of tissue however when ingested at elevated concentration it may cause abnormalities in humans(Zhanget al., 2011). Unlike zinc, lead is a non-essential element and it has a detrimental effect on humans. In situations where lead recommended limit was exceeded has resulted in the malfunctioning of the central nervous system and the immune system this occurs in adults consequently, in children intelligent is reduced and the physical development is slow andthey experience social behavioural problems(Zhanget al., 2011)(Mackayet al., 2013). The symptoms of excessive dosage of zinc are vomiting, nausea and stomach cramps this will in long-term cause imbalance in cholesterol and infertility in both males and females(Zhanget al., 2011). Nagajyotiet al.(2010)define contamination as any substance in the environment that causes a change in the condition of the environment by degrading the quality 49
and/or leading to detrimental effects. In South Africa common sulphide metal mercury is cinnabar which is associated with gold mining. Furthermore, it is ranked the second world mercury polluter where as china is the first and the emission of mercury may be from the burning of fossil fuel. The larges spillage of mercury occurred in Kwa-Zulu Natal were by contamination of the large river Magceni lead to restriction of fishing in the area to avoid consumption of fish because if fish is consumed whereby it has inorganic mercury lead to death, loss of sight and damage to central nervous system(Davieset al., 2010). The world’s largest producer of manganese is South Africa, it produces 80%. Manganese is suitable for both humans and animals but if consumed in levels above the recommended dosage it may be toxic and causes blood clotting, birth defects and colour change in hair with chronically exposure(Davieset al., 2010). There was a disease discovered in North West and Northern Cape of South Africa in sheep and cattle known as geophony it lead to hepatitis and death(Elsenbroek et al., 2002).Iron in elevated concentration in the body leads to siderosis an accumulation of iron because when ingested it becomes insoluble in the digestive system whereby the pH is circum-neutral. In males of Johannesburg South Africa, high levels were found in their liver at the death when post-mortem was done it was found that it causes tissue damage because it is the only essential metal which cannot be excreted out of the human system(Davieset al., 2010). Fluoride is naturally occurring in ground and surface water at a low concentration of 0.03 mg/L it is beneficial for teeth in humans but at elevated consumption, it can be toxic to both animals and humans. In provinces such as KZN, Limpopo, North 50
WestandNorthernCapefluorideispredominantbecauseoftheusageof groundwater and surface water for domestic and drinking purposes(Davieset al., 2010). When there is low magnesium in water it was evident in some parts of South Africa that there was death caused by ischemic heart disease because magnesiumplaysanimportedroleinenergyproductionandcellmigration including metabolic reaction(Davieset al., 2010). 2.5.2Consequences of mining on water resources ## 2.5.3Treatment of polluted mine waters 51
Secure Best Marks with AI Grader
Need help grading? Try our AI Grader for instant feedback on your assignments.
3METHODOLOGY 3.1DESCRIPTIONOFSTUDYAREA The abandoned Edendale Lead Mine is located on the farm Nooitgedagt 333 JR in Silverton, Pretoria eastFigure 3.10. Their two shafts mined are separated by the main road R513. The Edendale Lead Mine was one of the earliest mines in the Transvaal region and operated from 1890 to 1974, producing 6 333 t of ore, 4 762 t of lead, 1 127 t of silver and 105 t of antimony(Glass, 2006). Figure3.10: Overview of three shafts of the abandoned Edendale Lead Mine (Google Earth, 2004 http://earth.google.com; Datum WGS84, geographical coordinates, without scale). 52
Table3.2: Coordinates for each of the sample sites Sample Name LocationDatumWGS84,geographical coordinates E01Edendale Shaft 125°41’ 2.87 S 28°26’ 6.68 E E12Edendale Shaft 1225°45’ 5.03 S 28° 2533.74 E E13Edendale Shaft 1325°41’ 4.77 S 28°25’ 34.33 E EPDEdendale Point of Discharge25°41’ 6.32 S 28°25’ 35.70 E EUSEdendalespruit Upstream25°41’ 12.05 S 28°25’ 40.58 E EDSEdendalesruit Downstream25°41’ 6.81 S 28°25’ 32.27 E 3.1.1Geological setting and study area Southern Africa has the largest sedimentary deposits which are found in the Kanye Basin of Botswana, Transvaal Basin and the Griqualand West Basin these three basins are found in the Kaapvaal CraytonFigure 3.11(Erikssonet al., 1993).The Transvaal Basin is aged between 2.66 to 2.05 billion years is made up of chemical and clastic sedimentary and some volcanic rocks furthermore, the lowest part of the basin comprises of quartzite, carbonates and cherts and far west shales,dolomitesandsandstonesoverlaythisbasin.TheTransvaalbasin comprises of the Rooiberg Group,Pretoria Group, Chuniespoort and the oldest 53
Wolkeberg Group(Erikssonet al., 2012). The study area is located in the Silverton Formation which is part of the Pretoria Group. The Pretoria Group is 2100 to 2400 million years of age and is overlying the Chuniespoort and is overlaid by the Rooiberg Group is made up of shales and quartzite which are about 6-7 Km thick (Errikson, 2012). The quartzite dominating the Pretoria Group is a result of metamorphism by the Bushveld Complex intrusion sandstones. Consequently; Rooiberg Group is made up of lavas which are found to be metamorphosed into leptites and hornfilses (Eriksson, 2012). The Silverton FormationofthePretoriaGroupissandwichedbetweenDaspoortand Magaliesberg Formations. The Daspoort formation which is succeeded by the Silverton Formation is characterized by iron rocks which are found in the east and quartzite which are matured in age including secondary mudrocks(Eriksson et al., 2012). TheMagaliesberg Formation a succession of the Silverton Formation is commonly known as marine sandstone because of the shallow water structure and the maturity of petrographic nature, it is recognized by the immature sandstone. TheSilvertonFormationisagedbetween2100and2160millionyearsit comprises of carbonate mudrocks which are interbedded with sandstones, chert and dolomite. Upward the basin excessive calcium oxide and manganese oxide shales including tuff and is collectively known as Lydenberg shale are recognized. In the eastern part, there is Machadodorp volcanic which consists of basalts it is shallow and interbedded with carbonate rocks in the basin on the north (Erikson, 2012). 54
Paraphrase This Document
Need a fresh take? Get an instant paraphrase of this document with our AI Paraphraser
Figure3.11: The three main outcrops of Kaapvaal craton, Kanye basin in Botswana, Griqualand West basin and the Transvaal basin(from Eriksson et al., 2012). The common known sedimentary rocks are shales, sandstones and mudrock mainly found in the Pretoria Group and identified in the Silverton Formation. Lead is found in galena which occurs in sedimentary rocks and the mineralisation of leadis measuredby faults whichwerefoundaroundthesameage as the occurrence of Bushveld Complex intrusion in Edendale Lead Mine(Glass, 2006). The abandoned Edendale Lead Mine was dominated by quartzite on the south which became less on the north. The quartzite found in the two shafts belongs to 55
the Magaliesberg Formation and it was interbedded with limestone and shale. The limestone was 3 m thick on shaft 1 and the rocks were found to be carbonate which was altered by shales while the rocks in shaft 2 were of fine grain and identifiedaslimestone(Glass,2006).Theoredepositsoftheabandoned EdendaleLeadMineproducedgalenaandzincwithchalcopyriteincluding sphalerite, shaft two on the north produced with a small quantity of galena which was less than 1 m in thickness, pyrite and sphalerite. Ore was fine grained this is an indication of replacement which may have taken place when the incomplete gangue occurred resulting in the mixture of galena(Willemseet al., 1944) 3.1.2Climate and hydrology Pretoria is 1339 m above sea level and is surrounded by Magaliesberg Mountains these mountains are able to trap warm air rising the temperature found in Pretoria. The summers are long and wet as more precipitation is received during this season consequently; the winters are dry and short. The area receives a minimum of 625 mm and a maximum of 750 mm of rainfall per annum(Glass, 2006). According to the climate data, the study area has the lowest rain of 7mm in the dry season (winter) and a peak of rainfall in the wettest and hottest month, January with 138 mm. The Roodeplaat dam found in the north-east of Tshwane is the main catchment for mostriversinTshwane;itreceiveswaterdischargingfromEdendalespruit, MoreteleRiverandPienaarsRiver.Edendalespruitgoesthroughfarm Nooitgedatch and it flows through the Magaliesberg and Leeufontein quartzites it 56
then discharges in the south eastern part of the dam(Glass, 2006). Groundwater runs from elevated ground into valleys this movement is controlled by gravity and it depends on porosity of the rocks, the void size and the gradient of the water table(Lurie, 1981)The shales found in the study area forms part of South African boreholes according to South African borehole information, Silverton Formation yields between 72 and 120 000 L/day in most boreholes with 26 m to 29 m depth with no failure percentage(Lurie, 1981). 3.1.3Mining history The currently known abandoned Edendale Lead Mine which is situated on farm Nooitgedagt 333 JR east of Tswhane, Silverton operated from 1900 to 1974, in the 1800 prospecting was done the previous plans are not available however only 3 shafts of the mine remain, one on the south of the R513 road and the other two shafts are in the north east of the road. Consequently, the mine was owed by various companies and it operated by the name of the company at the time of ownershipTable 3.3. The first mine was the shaft 1 which was mined in 1900 it was a smelter plant this is evident by the structures which were found on the farm. In 1904 the mining depth was increased at shaft 1 by 41 m and the opposite mine was at 61 mFigure 3.12the mine produced 11000 tons of ore in that period which produced 80 % of galena and 450 g of silver the second shaft was further mined to 212 m in 1905 and 1120 tons of lead ore was produced(Reeks, 2012). The increase in mining depth resulted in water inflow into the mine this required 57
Secure Best Marks with AI Grader
Need help grading? Try our AI Grader for instant feedback on your assignments.
massive pumping which allowed the mine to sell millions of litres to other mines monthly. Consequently, the mine on the north east of the road also had an increased mining depth from 45 m to 94 m then later to 184 m this happened in 1906 and during this mining period the primary vein was galena and cerrusite there was also argentiferous zinc which increased in production percentage. The mine at this time was the first mine to produce ore and directly smelt it at the same site this was in 1906–1907(Reeks, 2012). Table3.3: Names used at the Edendale mine during operation(modified from Reeks, 2012) Company name/ mine nameOperating years Edendale Lead Mines Syndicate Ltd1894– 1905 Edendale Estates Ltd1903 – 1909 Donerhoycul Tributing Syndicate Ltd1911 – 1914 Edendale Inspection Syndicate1918 – 1919 Edendale Developing Syndicate Ltd1920 – 1923 The Edendale Lead and Zinc Co Ltd1935 – 1937 Union Lead Mine1937 – 1938 58
Union Lead and Silver Mine1938 – 1941 Edendale Lead Mines (Pty) Ltd1949 – 1974 Figure3.12: Cross section of the Edendale No 1 Mine 1903 – 1909(From Reeks, 2012) In 1908 the Edendale mine was liquidated then closed. However, in 1912 it was reopened and during the operation, 176 tons of lead ore was produced including an unknown quantity of zinc ore with 35 kg of silver(Reeks, 2012). Furthermore, in 1920 first grade lead and silver were produced from the ore deposit embedded fissure which was 1,5 m in width(Reeks, 2012). A third shaft was opened in 1921 it connected east of the second shaft and it was 17 m in depth it was further extended to 36 m beneath the cerussite vein which was 46 cm and produced first grade galena, westwards of the third shaft a 59
connecting shaft was also open it was 54 m initially and it was sunk to 214 m the mined vein produced 40 tons of ore yearly(Reeks, 2012). The mine was closed in 1923 due to financial restraints and reopened under Edendale Lead Mines in 1928 to 1931 however, no mining reports were found for thisdurationonlyprospectionplans(Reeks,2012).Themineoperatedas Edendale Lead and Zinc Mining Co from 1935 to 1937 in this time again only development plans were made hence there are no records of production(Reeks, 2012). Furthermore, the only production recorded was in 1937 when Union Lead Mine was the new operating mine name producing 65 tons of lead and in 1938 the new mine name was Union Silver and Lead Mines it increased the production of lead to 88 tons plans and development were doneFigure 3.13, it was reported that during the operation the mine was a smelter however, the smelting process was unsuccessful therefore, a sintering process was made from the reverberatory furnace that produced 2.5 tons of lead daily from 1938 to 1941 there were no records after this time(Reeks, 2012). 60
Paraphrase This Document
Need a fresh take? Get an instant paraphrase of this document with our AI Paraphraser
Figure3.13Cross section of the Edendale (Union Silver and Lead Ltd) No 2 Mine 1937 (from Reeks, 2012) Whenminingceasedin1941,therearenorecordsofminingactivitiesor production from 1942 to 1974 when the mine was operating under Edendale Lead Mine and the only reports are the fines for late tax submissions and the mine was dissolved in 1974(Reeks, 2012). The lifespan of the mine was 70 years and there was 5000 tons of lead and 1110 kg of silver which was produced in the duration from 1890- 1941(Reeks, 2012). Therewereinfrastructurefoundationfoundintheyear2010,threeshafts remaining one on the south of the R513 which was Edendale mine No. 1 and it is 7 m in depth for the purpose of the study it is known as shaft 1 and the other two on the north east of the main road which was Edendale mine No. 2 the shafts are 7 m and 4 m respectively they are known as shaft 12 and shaft 13 for the purpose of this study. The shafts were numbered by the Council of Geoscience and not according to the historic mine plans. 61
3.2DATA COLLECTION In order to characterize the mine water quality of the abandoned Edendale Lead Mine, 16 water samples were collected from different sample locationsError: Reference source not found.For this study water samples were collected at shaft 1,12and13,EdendalepointofdischargeandEdendalespruitbothatthe upstream and downstream. In order to better understand nature, potential pollution and hydrodynamic processes of the mine water at the abandoned Edendale Lead Minesampling, stratificationandtracertest weredoneinbothdry andwet seasons at different sample localities. 3.2.1Mine water chemistry Theon-siteparameterssuchaspH,temperature,oxygencontent,electrical conductivity, redox potential and alkalinity (kS) of the mine water were measured on-sitewithaportableinstrumentateverysamplinglocationTable3.4: Instruments used to measure on-site parameters in the field. The measurements of on-site parameters were of importance because the physical and chemical properties of mine water can change rapidly. Therefore the on-site parameters can never be constant. We measured the alkalinity of the mine water by titration. We used 50 mL of the sample and added a strong acid (H2SO4) by a digital titration and we continually measured the pH to the end point of 4,3. The data was used to calculate the acid capacity of the mine water. 62
Table3.4: Instruments used to measure on-site parameters in the field ParameterMeasurement Instrument Temperature, pH, Electrical Conductivity, Redox potential Hach or Myron L Ultrameter Dissolved OxygenHach Oxygen sensor Acid CapacityHach Digital Titration kit 3.2.2Sample collection procedures Samples were collected in pre-cleaned and pre-contaminated 500 mL and 50 mL polyethene bottles from shaft E01, E12, E13, Edendale Point of Discharge (EPD), Edendalespruitup-stream(EUS)andEdendalespruitdown-stream(EDS).All bottles were labelled with the sample location, date and sample name and were stored at 4°Ctemperature in a dark cooler box container and were transported to the laboratory for analysis. To collect samples in the shafts a bomb sampler was made. The bomb sampler is made of the bottom of a cut 1.5 L of a plastic water bottle attached to a stone on the side and tied to a rope which was about 10 m in length. The bomb sampler was lowered down each shaft (E01, E12, and E13) to a certain depth when it was filled with water the rope was slowly pulled up lifting the sampler to the ground surface. The sampler was rinsed 3 times with the sample water and the 500 mL 63
Secure Best Marks with AI Grader
Need help grading? Try our AI Grader for instant feedback on your assignments.
bottles were also rinsed 3 times with sample water the procedure for lowering the sampler down the shaft was repeated several times each time a water sample was collected. The sample water was then transferred into 500 mL bottles which were filled to the top and placed into the cooler box which had blue iced bottles for each sample location shaft E01, E12 and E13. Furthermore, the water sample was transferred to a 500 mL jag and a 50 mL syringe was rinsed with the sample water a 0.45 μm membrane filter was attached to the syringe and was used to draw sample water from the jag and rinsed the 50 mL bottle 3 times then water was transferred using the syringe attached to the filter into the 50 mL bottles the samples were acidified nitric acid and were also stored in the cooler box with blue ice bottles and transported to the laboratory. Sample water was transferred into a 500 mL plastic jag which was also rinsed 3 times with the sample water at each shaft (E01, E12 and E13) and on-site parameters (pH, DO, temperature, EC and redox) were measured and data were recorded in the field book. Other water samples were collected from the Edendalespruit at EUS and EDS. The stream was shallow water samples were collected using 500 mL and 50 mL plastic bottles. The 500 mL plastic bottles were immersed in the stream in an upstream position collecting sample water to rinse the plastic bottles 3 times the bottles were not filled when rinsing and the bottles were capped each time while rinsing at both localities (EUS and EDS). When collecting the water sample the 64
plasticbottlewas immersedinthestreaminanupstreampositionavoiding sediment disturbance and inflow of surface films the plastic bottles were filled to thetopandcappedthenplacedinthecoolerboxwithblueicebottles. Furthermore, a 50 mL syringe was submerged into the stream and slowly the plunger was pulled to draw 20 mL of sample water to rinse the syringe 3 times by holding the syringe up and shaking vigorously and pushing down the plunger to withdraw the water. A 45 μm membrane filter was attached. The syringe with the filter was submerged in the stream and the plunger was pulled up as in the above statement and the sample water was drawn and transferred into the 50 mL polyethylene bottles 3 times for rinsing the bottles were capped each time rinsing was done the water samples were collected in the same manner in which 50 mL of the filtered sample was transferred into polyethylene bottles and acidified with nitric acid the water sample was filled to the top and sealed then placed in the cooler box with blue ice bottles. 3.2.3Stratification We used a dipper and divers for stratification measurements in the three shafts of EdendaleLeadMine.Thesetwoinstrumentsmeasurechemical(electrical conductivity) and thermal (temperature) information at a certain depth (water level) on-site. A dipper is an instrument used to measure water level. It is made up of a flat tape which is wired and attached to a probe which senses water and causes a buzzer to beep (Brassington, 2007).We used a dipper which was 150 m we took measurements of EC and temperature at depth. The dipper was lowered down the shaft and it buzzed when the probe contacted water. Measurements were taken 65
every 0.5 – 1.0 cm down the shaft recording temperature and EC. 3.2.4Mine water tracing SodiumChloridewasusedasatracerwhentracingminewaterforthe determinationofhydraulicparametersintheminewateroftheabandoned Edendale Lead Mine. The tracer test was conducted from September 2016 to January 2017. The amount of tracer needed for the tracer test was calculated prior to the test itself and divers were used to monitoring the mass outflow. Divers are knownasdataloggersusedforlong-termmeasurementsofwaterlevel, temperature and electrical conductivity. In the laboratory, 21 kg of sodium chloride was dissolved in 75 L of tap water three days before the tracer test. The divers were installed at E13 and EPD, the divers were set to read data every 20 minutes for the duration of the tracer using the diver software. The CTD diver was used to measure EC at a range of 0- 120 mS/cm and a baro diver to compensate the barometric pressure. The solute was injected into shaft 12, to make sure that the entire tracer was poured down the shaft the bottles were constantly stirred up while injecting the tracer. 3.2.5Analytical methodology Whenallwatersampleswerecollectedboththeacidifiedandnon-acidified samples were taken to Waterlab (Pty) Ltd for analysis. Ion chromatography and Inductively Coupled Plasma–Mass Spectrometry or Inductively Coupled Plasma– OpticalEmissionSpectrometrywereusedfortheanalysisofelement 66
Paraphrase This Document
Need a fresh take? Get an instant paraphrase of this document with our AI Paraphraser
concentration. ICP was used for main ion analysis and for trace elements ICP-MS or ICP-OES. 67
4RESULTS AND DISCUSSION 4.1INTRODUCTION This chapter represents the results from laboratory analysis of water samples collected from the study area also stratification and tracer test are presented. The data for the study is given in appendices: on-site parameters: Appendix1; major ions andtraceelements:Appendix 2; stratification: Appendix 3; tracer tests: Appendix 4. 4.2ON-SITEPARAMETERS The on-site parameters provide understanding into the mine water chemistry as a result making them important. On-site parameters results are discussed here focusing on pH, redox potential, electrical conductivity, temperature, and dissolve oxygensaturationandpercentage.Table4.5:On-siteparametersfromthe abandoned Edendale Lead Mine. n: on-site parameter; ± is the standard deviation of the sample population. Average of the pH calculated using the [H+].shows an average of on-site parameters. Table4.5: On-site parameters from the abandoned Edendale Lead Mine. n: on-site parameter; ± is the standard deviation of the sample population. Average of the pH calculated using the [H+]. 68
EUSE12E13EPDEDS pH6.9 ± 0.46.7 ± 0.16.7 ± 0.26.7 ± 0.46.6 ± 0.7 Redox, mV 328 ± 123319 ± 42306 ± 86224 ± 65227 ± 65 EC, μS/cm 437 ± 134603 ± 15466 ±118615 ± 18670 ± 84 Temp, °C21.5 ± 2.522.9 ± 1.323.8 ± 2.021.8 ± 2.122.0 ± 1.5 DO, mg/L4.5 ± 2.02.1 ± 3.42.8 ± 2.82.0 ± 2.23.3 ± 2.3 DO, %55.9 ± 25.310.9 ± 8.816.8 ± 13.714.2 ± 16.634.5 ± 35.2 n399103 The pH was measured on-site at each sample point every time the samples were collected.Figure4.14showstheplotofpHvaluesagainstthedateofthe measurement. The average of the pH values is calculated using the arithmetic average for [H+].The pH values range from an average of 6.3 to 6.9 at E01 and EUS respectively. The mine water in shafts E12, E12 and at EPD the discharge point have same pH average of 6.7 however, at EDS in the Edendalespruit has lower pH average of 6.6 compared to the pH at EUS (Error: Reference source not found). The mine water and the Edendalespruit water have circumneutral pH between 6 and 8(Figure 4.14). The South African National Standard (SANS) for 69
Secure Best Marks with AI Grader
Need help grading? Try our AI Grader for instant feedback on your assignments.
domestic water requires the pH to be greater than 5 and below 9.7 but Target Water Quality Range (TWQR) pH standard is 6 or 9. The measured pHs at sample sites are within the standard of the domestic water requirement and therefore there is no problem with regard to pH of the mine water and Edendalespruit. All five sample sites have average pH values approaching 7 proposing a carbonate neutralization influence from the host rocks. All samples show that the water of the abandonedEdendaleLeadMine(ELM)iswithintheacceptablerangefor domestic use according to DWAF (1996). Higher pH results in a bitter taste in water while lower pHs are known to dissolve metals and other substances causing corrosion. Figure4.14: pH from the abandoned Edendale Lead Mine Redox potential is measured with the secondary electrode and the results have 70
been re-calculated to the standard hydrogen electrode as a result of adding the temperature dependent factor on the measured cell potential using equation 16 (Wolkersdorfer, 2008)to the real mV value measurements used to interpret the on-site information. E0: converted redox potential, mV, ET: measured OPR at temperatureT,mV;Tmeasuredtemperature,°C;a,b:empiricalelectrode dependent coefficients (for the Hanna Ag/AgCl, KCl, 3.5mol/L: a= 49.296, b= 298). E0(25°C)=ET−0.198·(T−25)+√a−b·T(16) The redox potential results are presented inFigure 4.15shows the corrected ORP values. Redox potential average ranges from 445 mV at E01. The ORP average at EUS is high in comparison to E12, E13, EPD and EDS. On average redox potential at EPD is the lowest at 224 mV while the redox in the shafts is higher at 319 mV and 306 mV in E12 and E13 respectively (table ##).Figure 4.15shows E01 with high redox potential values above 300 mV, however, EUS, E12, E13, EPD and EDS have redox values above 90 mV and below 400 mV. 71
80 130 180 230 280 330 380 430 480 530 Redox,mV Date E01 E12 E13 EDS EPD EUS Figure4.15: Redox (mV) from the abandoned Edendale Lead Mine Ehvaluesgreaterthan450mV,indicatingoxidisingconditions,duetothe relatively fast ground water circulation through karst features and fractures. Eh values less than 300 mV, indicating slightly reducing conditions; this might reflect a slower underground circulation since these samples were located close to the contact between the meta-sandstones and shales, respectively, and carbonate rocks(Ciduet al., 2007) Electrical Conductivity is known as the measure of water ability to allow electrical flow proportional to the amount dissolved salts and inorganic materials such as alkalis,chlorides,sulphateandcarbonatecompounds(Edition,2008).EC measures the concentration of dissolved ions in water.Figure 4.16showsthe highest EC values measured at EDS and the lowest EC measured at EUS (775 μS/cm and 248 μS/cm). The EC in E12 ranges between 580 μS/cm and 622 72
Paraphrase This Document
Need a fresh take? Get an instant paraphrase of this document with our AI Paraphraser
μS/cm with an average of 603 μS/cm this is higher compared to EC in E13 that ranges from 274 to 601 μS/cm with an average of 466μS/cm.The electrical conductivity average ranges from 356μS/cm to 670μS/cm at E01 and EDS (Error: Reference source not found).The EC at EDS, E12 and EPD are similar values at 603μS/cm, 615μS/cm and 670 μS/cm respectively, however, lower EC is at E01, EUS and E13 shown inError: Reference source not found. The more ions that are present, the higher the conductivity of water. Also, the fewer ions that are in the water, the lower the conductive. It is seen in the water chemistry results that the concentrations are low and as a result, the EC is within 0-800 μS/cm rangegooddrinkingwaterforhumans(aslongasthereisnoorganic contaminates). , Figure4.16: Electrical Conductivity (μS/cm) from the abandoned Edendale Lead Mine Temperature results presented inFigure 4.17shows that temperature varies from 73
18°Cto 28°C. The ambient temperature in Pretoria is # groundwater and surface waters are known to mimic the ambient surrounding temperatures. EUS has a low- temperature average of 21.5 °C in comparison to other sample sites while EPD has an average temperature of 21.8 °C close to that of EUS however, temperature average in E13 is the highest at 23.8 °CError: Reference source not found. High temperatures influences oxygen availability in water, the higher the temperature the lower the dissolved oxygen. It will be shown later the effect of temperature in relation to stratification. Figure4.17: Temperature (°C) from the abandoned Edendale Lead Mine The dissolved oxygen (DO) concentration average range from 4.5 mg/L to 2 mg/L at EUS and EPD respectively table##. The dissolved oxygen concentrations are below 15 mg/L.Figure 4.18shows lowest DO concentrations at E12, E13 and 74
EPD below 1 mg/L. In the Edendalespruit at EUS and EDS show DO below 2 mg/L while E01 has to DO below 3 mg/L. High DO value in E12 at 11.6 mg/L and in E23 at 9.80 mg/L. The low DO in the Edendalespruit could be because of bacteria which use up the oxygen or the biological oxygen demand by plants in the Edendalespruit stream water and also because of the water warmth. The average DO saturation values range from 0.37 % at E13 to 84.7 % at EUS with an average of 55.9 % (Figure 4.19) showing water ranging from low oxygen content to a high oxygen content. Figure4.18: Dissolved Oxygen (mg/L) from the abandoned Edendale Lead Mine 75
Secure Best Marks with AI Grader
Need help grading? Try our AI Grader for instant feedback on your assignments.
Figure4.19: Dissolved Oxygen (%) from the abandoned Edendale Lead Mine 76
4.3WATERCHEMISTRY The values from analytical data from samples which were collected at different locationswerecomparedalongsideoneanotherFigure4.20representsthe concentration of major ions and trace elements results. The concentrations of most major ions and trace elements were below detection limit Appendix #. The piper diagram shows the type of water that is found at Edendale Lead MineFigure 4.21. Arsenic in all water samples collected at EUS, E12, E13, EPD, EDS (Figure 4.20) is above the 0.001 mg/L as stipulated by WHO groundwater standards. The concentration of arsenic is the lowest at E13 (0.01 mg/L) and highest at EUS, E12 andEDS(0.03mg/L)evensotheseconcentrationsareverylow.TheBa concentrations are low as well within the recommended groundwater standard WHO 0.7 mg/L. However, very low concentrations are at EUS and there is an increaseofBaconcentrationsinE12andE13(0.13mg/Land0.10mg/L) respectively with a decrease in the discharge point (0.08 mg/L) and EDS (0.07 mg/L). Figure 4.20shows high Ca concentrations above the 32 mg/L set by WHO, The highest concentration at EPD, EDS and E12 (63 mg/L, 61 mg/L and 58 mg/L) and low concentrations at EUS with 39 mg/L and 41 mg/L at E13. The concentrations of chlorine are the same (5.0 mg/L) at EUS, E12, E13 and EPD and 4 mg/L at EDS the concentrations are within the 100 mg/L groundwater standard WHO. 77
Iron concentrations are fairly low below 3 mg/L required by WHO. Even so, Fe concentration at E12 is high compared to other samples. EUS, E13 and EDS show the same Fe concentration of 0.02 mg/L while EPD has a sight difference with 0.05 mg/L. Ga has no standard limit and very low concentrations are present in water samples. The highest concentration is at EPD in comparison with other samples while the lowest concentration is at EPD (Figure 4.20 High concentration of potassium causes nausea and vomiting even neurological damage however the potassium concentrations at all sample sites are within 50 mg/L recommended by WHO groundwater and surface water standards. There is the high concentration at EPD (4.4 mg/L) and low potassium concentration at EDS (1.5 mg/L)Figure 4.20. There are similar concentrations at EUS, E12 and E13 (3.5mg/L, 3.7 mg/L, and 3.0 mg/L) respectively. There are high concentrations of magnesium above the required WHO standard of 30 mg/L at EDS, EPD, E12 and EUS (51 mg/L, 39 mg/L, 37 mg/L and 31 mg/L) and lower concentration at E13 (25 mg/L) that is within the WHO standard. ManganeseconcentrationsareaboveWHOgroundwaterandsurfacewater standard 0-0.05 mg/L in all samples (Figure 4.20). At EUS concentration is 0.12 mg/L and 1.74 mg/L at E13 there are no health effects associated with these concentration values but a change in water colour also increased after taste can be experienced with concentrations above 2 mg/L. Sodium concentrations are highFigure 4.20but within the WHO groundwater standard of 100 mg/L. The highest concentration is at EDS with the lowest at E13. 78
Paraphrase This Document
Need a fresh take? Get an instant paraphrase of this document with our AI Paraphraser
There is only a slight difference in the sodium concentrations at E12 and EPD (9.3 mg/L and 9.6 mg/L). Nickel was extremely low and below detection limit at EPD. The lead was only detected at E13 with a concentration of 0.024 mg/L that is above WHO standard of 0.001 mg/L. Sulphate was higher at EDS (102 mg/L) relative to EUS (55 mg/L)Figure 4.20but not above the 200 mg/L recommended by WHO. Very low sulphate concentrations are at E12, EPD and E13 (0.6 mg/L, 5 mg/L and 27 mg/L) respectively. There is no WHO standard set for silicon the concentrations. Nevertheless, concentrations are high at E12 (19 mg/L), EDS (17 mg/L), EPD (16 mg/L), E13 (13 mg/L) and EUS (12 mg/L). Strontium and zinc concentrations are very low below 1 mg/L and Rb is only detected at EUS. Major ions in water samples are an important part of the classification of water type. Other ions were detected at low concentrations NO3 (<0.1 -0.1 mg/L), NO2 (<0.5- 5 mg/L), F- (<0.2 – 0.2 mg/L), PO43- (0.1 mg/L), NH4 (0.1 – 0.2 mg/L). In a Piper diagram, it can be seen that the mine water of the Edendale Lead Mine is alkalineFigure 4.21. Mine water characterized at EPD is in the HCO3 type while E12, E13, EUS and EDS are dominated by the Mg-Ca type, so as in E13 and EUS, the SO4 type is introduced and Cl type is also introduced at E13. The samples show relatively more alkaline earth metals then alkali metals. The main rock type found in the study area is limestone and dolomite, which explains the concentrations of Mg, Ca and bicarbonate in most of the samples. 79
0,00 0,01 0,10 1,00 10,00 100,00 1000,00 AsBaCaClFeGaKMgMnNaNiPbSO4SiSrRbZn Concentration, mg/L Elements EUSE12E13EPDEDS Figure4.20: Element concentration Figure4.21: Piper diagram for samples collected at the abandoned Edendale Lead Mine; n = 15, averages of three sampling campaigns. 80
4.4STATISTICALANALYSIS The data were statistically analysed using the Past3 computer software. ANOVA wasusedtocomparetheaveragetracemetalandmainion(elements) concentrations of all samples. The interpretation was performed at α = 0.05 (two- sided) where Ha: diff < 0 Ha: diff !=0 Ha: diff > 0 Pr(T < t) = 0.0028 Pr(|T| > |t|) = 0.0057 Pr(T > t) = 0.9972 81
Secure Best Marks with AI Grader
Need help grading? Try our AI Grader for instant feedback on your assignments.
4.5STRATIFICATION Allthethreeshaftsthatstratificationdatawascollectedwereinvestigated individually and inputted into excel. Stratification takes place when there is a change in density. This change in density is represented by a depth-dependent graph with a vertical change of temperature and electrical conductivity parameters. The temperature and conductivity profiles are represented in (Figure 4.22to Figure 4.28) monitored from January 2016 to September 2016 before the tracer test was conducted. Figure 4.22represents temperature and electrical conductivity profiles measured from E01, E12 and E13 January 2016. The temperature and conductivity profile at shaft E01 shows shallow waters with high EC and temperature and deep waters with lower EC and lower temperature E12 shows comparable temperature and EC. E13 has low EC and high temperature at shallow waters and higher EC and low temperature in deep waters. The temperature and electrical conductivity profiles measured from E01, E12 and E13 in March 2016 (Figure 4.23) E01 has higher temperatures (23 – 25°C) and higher electrical conductivity in the higher parts of the shaft and lower temperature (22 – 20°C)and lower electrical conductivity in the deeper parts of the shaft. Likewise, E12 shows higher temperature and electrical conductivity in the upper parts of the shaft and lower temperatures and electrical conductivity in the lower parts of the shaft. In contrast, E13 shows lower electrical conductivity in the upper parts and higher ones in the deeper parts of the shaft the temperature is again 82
high in the upper parts and low in the deeper parts of the shaft. Stratification measurement conducted in April 2016 in E01, E12 and E13 (Figure 4.24). The temperature and electrical conductivity profile of E01 show constant highertemperatureandelectricalconductivityinshallowwaterswithlower temperatures and electrical conductivity in deeper waters. The temperature and electrical conductivity profile in E12 again show higher temperature and electrical conductivity in shallow waters and lower ones in deeper waters. However, E13 has a lower temperature and electrical conductivity in shallow waters and higher temperature and electrical conductivity in deeper waters. 83
Figure4.22: Stratification on shaft E01, E12 and E13 in the abandoned Edendale Lead Mine January 2016 Figure 4.25represent temperature and electrical conductivity profile measured in June 2016. E01 temperature and electrical conductivity show high temperature in shallow waters and constant in deeper water with no variation and higher electrical conductivity in deeper waters with low electrical conductivity in shallow waters. The stratification in E12 shows higher temperature and electrical conductivity in 84
Paraphrase This Document
Need a fresh take? Get an instant paraphrase of this document with our AI Paraphraser
shallow waters and lower temperature and electrical conductivity in deeper waters. In E13 temperatures are lower in shallow waters and higher in deep waters while therewasconstantelectricalconductivity(431μS/cm)inshallowanddeeper waters. Figure4.23: Stratification on shaft E01, E12 and E13 in the abandoned Edendale Lead Mine in March 2016 In July 2016 temperature and electrical conductivity profileFigure 4.26show a decrease in water level at E01 with higher temperature and electrical conductivity 85
inupperwatersandlowertemperatureandelectricalconductivityindeeper waters. However, E12 shows constant temperature (21.2°C) in shallow waters and (21.1°C) in deeper waters with higher electrical conductivity in shallow waters andloweronesindeeperwaters.TheprofileinE13againshowshigher temperatures and electrical conductivity in shallow waters and lower temperature and electrical conductivity in deeper waters. Figure4.24: Stratification on shaft E01, E12 and E13 in the abandoned Edendale Lead Mine in April 2016 86
The water in E01 was out of reach in August 2016 represented inFigure 4.27. The temperature and electrical conductivity profile of E12 show again a well-stratified water body with higher temperatures and electrical conductivity in shallow waters andlowertemperaturesandelectricalconductivityindeeperwater.Butthe stratification in E13 has higher temperatures in shallow waters and lower ones in deeper waters with a constant electrical conductivity of 540μS/cm at all water depth. 87
Secure Best Marks with AI Grader
Need help grading? Try our AI Grader for instant feedback on your assignments.
Figure4.25: Stratification on shaft E01, E12 and E13 in the abandoned Edendale Lead Mine in June 2016 In September 2016 before the tracer test was conducted, the water in E10 was againoutofreachFigure4.28.E12hashighertemperaturesandelectrical conductivity in shallow waters and lower temperatures and electrical conductivity in deeper waters. Even so, E13 has constant temperatures at 22.5°C at all depth and constant electrical conductivity of 290μS/cmat all depth this is very low in comparison to other values in the same shaft in previous months. 88
Figure4.26: Stratification on shaft E01, E12 and E13 in the abandoned Edendale Lead Mine in July 2016 89
Figure4.27Stratification on shaft E12 and E13 in the abandoned Edendale Lead Mine in August 2016 Figure4.28: Stratification on shaft E12 and E13 in the abandoned Edendale Lead Mine September 2016 90
Paraphrase This Document
Need a fresh take? Get an instant paraphrase of this document with our AI Paraphraser
4.6TRACERTEST The use of artificial salts in karstic environments dates back before the 1960s. Salt tracers are effective as they are less sensitive in comparison to artificial dyes. The dissolution of salts into cations and anions increases ion mobility that causes elevated electrical conductivity(Leibundgutet al., 2011). Sodium chloride was used as a tracer in the determination of hydraulic connectivity of the shaft E12 and E13 at Edendale Lead Mine because it is nontoxic, cheap, abundantly available and has less potential of sorption, however, the natural occurrence of NaCl may cause high background concentrations(Leibundgutet al., 2011). Tracer detection is done through continuous measurement of chloride ion (EC). The tracer test was conducted from September 2015 to January 2016. The continuous measurement of electrical conductivity at E13 and EPD was used as a tracer mass detectorFigure 4.29shows that electrical conductivity at E13 range from 0.4 mS/cm to 0.6 mS/cm and EPD has an electrical conductivity of 0.2 mS/cm to 2.6 mS/cm. During the tracer test, the electrical conductivity increased in the wet months (Figure 4.29) which can clearly be attributed to the sodium chloride tracer (Wolkersdorfer et al. 2002) being transported by the rain water infiltrating into the subsurface. Only 17.1% of the injected tracer was recoveredFigure 4.30Figure 4.29. Considering the geological and hydrodynamic setting, the low recovery rate might be caused by a poor hydraulic connectivity between the point ofinjectionandpointofdischargeoradensity-drivensettlementofthe concentrated tracer. The first EC peak occurred in October 2015, second, third andfourthpeaksweredetectedinNovember,DecemberandJanuary 91
respectively. When there are multiple peaks in the EC measurement it shows that the tracer might be transported via various flow paths so as the dispersion and velocity are not the same (Leibundgut et al. 2011) or rain events cause the tracer to be flushed out of the mine. No peaks were observed in E13 (Figure 4.29). Therefore, it can be assumed that the tracer does not flow into shaft E13. This result shows that the tracer is transported from shaft E12 directly to the point of discharge but not to the adjacent shaft E13. Recovery rate refers to 0,0 0,5 1,0 1,5 2,0 2,5 3,0 2015-09-172015-10-072015-10-272015-11-162015-12-062015-12-262016-01-152016-02-04 EC, mS/cm Date EPDE13 Figure4.29: ECmeasurementinshaftE13anddischargepointofthe abandoned Edendale Lead Mine during tracer test 92
0% 1% 2% 3% 4% 5% 6% 7% 8% 9% 10% 11% 12% 13% 14% 15% 16% 17% 18% 051015202530354045505560657075 Recovery rate, % Time after injection , days Figure4.30: Recovery rate of the Edendale tracer test. 93
Secure Best Marks with AI Grader
Need help grading? Try our AI Grader for instant feedback on your assignments.
5CONCLUSION AND RECOMMENDATIONS If this trend continues, groundwater in flooded mines could be regarded as an important water resource, especially for industrial uses. The hydrogeochemical approach appeared to be a valuable tool for the understanding of processes occurring during rebound; monitoring of the water quality in the flooded mines should continue to pinpoint eventual variations related to extraction. Detailed knowledge of the composition of the host rocks, ore minerals, and mine wastes wouldbenecessaryinordertobetterunderstandthewater-rockinteraction processes and the geochemical behaviour of each metal 94
6REFERENCES ABDELAZIZ, R. & MERKEL, B.J. 2015.Sensitivity analysis of transport modeling in a fractured gneiss aquifer.Journal of African Earth Sciences,1032015/03/01/:121- 127. ABIYE, T.A. 2010. An overview of the transboundary aquifers in East Africa.Journal of African Earth Sciences,58(4), 2010/11/01/:684-691. ABSALON, D. & MATYSIK, M. 2007. Changes in water quality and runoff in the Upper Oder River Basin.Geomorphology,92(3):106-118. ADAMS, R. & YOUNGER, P.L. 2001. A strategy for modeling ground water rebound in abandoned deep mine systems.Ground Water,39(2):249-261. AL-HINAI, A.T., AL-HINAI, M.H. & DUTTA, J. 2014. Application of Eh-pH diagram for room temperature precipitation of zinc stannate microcubes in an aqueous media. Mater. Res. Bull.,491//:645-650. 95
ALAM, M.S., WU, Y. & CHENG, T. 2014. Silicate minerals as a source of arsenic contamination in groundwater.Water, Air, Soil Pollut.,225(11):1-15. ALBARÈDE, F. 2003.Geochemistry: an introduction.Cambridge University Press. ANDREWS, J.E., BRIMBLECOMBE, P., JICKELLS, T.D., LISS, P.S. & REID, B. 2013.An introduction to environmental chemistry.John Wiley & Sons. ANTONOPOULOS, V.Z. & GIANNIOU, S.K. 2003. Simulation of water temperature and dissolved oxygen distribution in Lake Vegoritis, Greece.Ecol. Model.,160(1–2), 2/1/:39-53. ATANACKOVIĆ, N., DRAGIŠIĆ, V., STOJKOVIĆ, J., PAPIĆ, P. & ŽIVANOVIĆ, V. 2013. Hydrochemical characteristics of mine waters from abandoned mining sites in Serbia and their impact on surface water quality.Environmental Science and Pollution Research,20(11):7615-7626. AYKOL, A., BUDAKOGLU, M., KUMRAL, M., H.GULTEKIN, A., TURHAN, M., ESENLI, V., YAVUZ, F. & ORGUN, Y. 2003. Heavy metal pollution and acid drainage from the abandoned Balya Pb-Zn sulfide Mine, NW Anatolia,Turkey.Environmental Geology,45(2):198-208. 96
Paraphrase This Document
Need a fresh take? Get an instant paraphrase of this document with our AI Paraphraser
BANKS, D., YOUNGER, P.L., ARNESEN, R., IVERSEN, E.R. & BANKS, S.B. 1997. Mine- water chemistry: the good, the bad and the ugly.Environ. Geol.,32(3):157-174. BANKS, S.B. & BANKS, D. 2001. Abandoned mines drainage: impact assessment and mitigation of discharges from coal mines in the UK.Engineering Geology,60(1–4), 6//:31-37. BEANE, S.J., COMBER, S.D.W., RIEUWERTS, J. & LONG, P. 2016. Abandoned metal mines and their impact on receiving waters: A case study from Southwest England.Chemosphere,1536//:294-306. BELZILE, N., CHEN, Y.-W., CAI, M.-F. & LI, Y. 2004. A review on pyrrhotite oxidation.J. Geochem. Explor.,84(2), 9//:65-76. BLOWES, D.W., PTACEK, C.J., JAMBOR, J.L. & WEISENER, C.G. 2003. The geochemistry of acid mine drainage.Treatise on geochemistry,9:612. BOOTH, C., SPANDE, E., PATTEE, C., MILLER, J. & BERTSCH, L. 1998. Positive and negative impacts of longwall mine subsidence on a sandstone aquifer.Environ. Geol.,34(2-3):223-233. 97
BORROK, D.M., NIMICK, D.A., WANTY, R.B. & RIDLEY, W.I. 2008. Isotopic variations of dissolved copper and zinc in stream waters affected by historical mining. Geochimica et Cosmochimica Acta,72(2):329-344. BOTHA, J.F. & CLOOT, A.H.J. 2004. Deformations and the Karoo aquifers of South Africa.Advances in Water Resources,27(4), 2004/04/01/:383-398. BOWELL, R., REES, S. & PARSHLEY, J. 2000. Geochemical predictions of metal leaching and acid generation: geologic controls and baseline assessment.Geol. Ore. Deposit.:799-823. BUTTRICK, D.B., VAN ROOY, J.L. & LIGTHELM, R. 1993. Environmental geological aspects of the dolomites of South Africa.Journal of African Earth Sciences (and the Middle East),16(1), 1993/01/01/:53-61. ÇALıŞKAN, A. & ELÇI, Ş. 2009. Effects of selective withdrawal on hydrodynamics of a stratified reservoir.Water Resour. Manag.,23(7):1257-1273. 98
CÁNOVAS, C., MACÍAS, F. & PÉREZ-LÓPEZ, R. 2016.Metal and acidity fluxes controlled by precipitation/dissolution cycles of sulfate salts in an anthropogenic mine aquifer.Journal of contaminant hydrology,188:29-43. CHANDRA, A.P. & GERSON, A.R. 2009. A review of the fundamental studies of the copper activation mechanisms for selective flotation of the sulfide minerals, sphalerite and pyrite.Advances in Colloid and Interface Science,145(1–2), 1/30/:97-110. CHIMHANDA, W.B. 2010. Hydrogeochemical and Isotopic Investigations of the Mine Water in the 1B Mine Pool of the Sydney Coal Field, Nova Scotia, Canada., unpubl. Master Thesis Univ, Tübingen. CIDU, R., BIDDAU, R. & NIEDDU, G. 2007. Rebound at Pb-Zn Mines Hosted in Carbonate Aquifers: Influence on the Chemistry of Ground Water.Mine Water Environ.,26(2), 2007/06/01:88-101. CIDU, R., FANFANI, L., FRAU, F., BIDDAU, R., CABRAS, R. & DA PELO, S. 2008. The abandoned antimony-mines of SE Sardinia: impact on surface waters.Proc. IMWA:127-130. 99
Secure Best Marks with AI Grader
Need help grading? Try our AI Grader for instant feedback on your assignments.
COLDEWEY, W. & SEMRAU, L. 1994. Mine water in the Ruhr area (Federal Republic of Germany).Proceedings of 5th International Mine Water Congress, Leicestershire: Quorn Selective Repro Limited.148. CORKHILL, C.L. & VAUGHAN, D.J. 2009. Arsenopyrite oxidation – A review.Appl. Geochem.,24(12), 12//:2342-2361. CRAVOTTA, C.A. 2008. Dissolved metals and associated constituents in abandoned coal-mine discharges, Pennsylvania, USA. Part 2: geochemical controls on constituent concentrations.Appl. Geochem.,23(2):203-226. DAVIES, T. & MUNDALAMO, H. 2010. Environmental health impacts of dispersed mineralisation in South Africa.J. Afri. Earth. Sci.,58(4):652-666. DIETZ, S., LESSMANN, D. & BOEHRER, B. 2012. Contribution of solutes to density stratification in a meromictic lake (Waldsee/Germany).Mine. Water. Environ., 31(2):129-137. DIVINE, C.D. & MCDONNELL, J.J. 2005. The future of applied tracers in hydrogeology. Hydrogeol. J,13:255-258. 100
DOLD, B. 2010.Basic concepts in environmental geochemistry of sulfidic mine-waste management.INTECH Open Access Publisher. DURAND, J.F. 2012. The impact of gold mining on the Witwatersrand on the rivers and karst system of Gauteng and North West Province, South Africa.Journal of African Earth Sciences,686/15/:24-43. EDITION, T. 2008. Guidelines for Drinking-water Quality. ELÇI, Ş. 2008. Effects of thermal stratification and mixing on reservoir water quality. Limnology,9(2):135-142. ELLIOT, T. & YOUNGER, P.L. 2007. Hydrochemical and isotopic tracing of mixing dynamics and water quality evolution under pumping conditions in the mine shaft of the abandoned Frances Colliery, Scotland.Appl. Geochem.,22(12), 12//:2834- 2860. ELSENBROEK, J. & NESER, J. 2002. An environmental application of regional geochemical mapping in understanding enzootic geophagia of calves in the Reivilo area, South Africa.Environ. Geochem. Hlth.,24(2):159-181. 101
ERIKSSON, P., SCHWEITZER, J., BOSCH, P., SCHEREIBER, U., VAN DEVENTER, J. & HATTON, C. 1993. The Transvaal sequence: an overview.J. Afr. Earth. Sci. , 16(1):25-51. ERIKSSON P.G., RAUTENBACH C.J DE W, WRIGHT D.W, BUMBY A.J, CATUNEANU O, MOSTERT P & M, V. 2009. Possible evidence for episodic epeiricmarineandfluvial sedimentation (and implications for palaeoclimatic conditions), c. 2.3–1.8 Ga, Kaapvaal craton, South Africa.273:153-173. ERIKSSON, P.G., BARTMAN, R., CATUNEANU, O., MAZUMDER, R. & LENHARDT, N. 2012. A case study of microbial mat-related features in coastal epeiric sandstones from the Paleoproterozoic Pretoria Group (Transvaal Supergroup, Kaapvaal craton, South Africa); The effect of preservation (reflecting sequence stratigraphic models) on the relationship between mat features and inferred paleoenvironment. Sedimentary Geology,263:67-75. ESPAÑA, J.S., PAMO, E.L., DIEZ, M. & SANTOFIMIA, E. 2009.Physico-chemical gradients and meromictic stratification in Cueva de la Mora and other acidic pit lakes of the Iberian Pyrite Belt.Mine. Water. Environ.,28(1):15-29. FEELEY III, T.J., VEIL, J.A., KUPAR, J.M. & PUDER, M.G. 2003. Use of mine pool water for power plant cooling. 102
Paraphrase This Document
Need a fresh take? Get an instant paraphrase of this document with our AI Paraphraser
FETTER, C.W. 2000.Applied hydrogeology.Prentice hall. FILELLA, M., BELZILE, N. & CHEN, Y.-W. 2002. Antimony in the environment: a review focused on natural waters: I. Occurrence.Earth-Sci. Rev.,57(1):125-176. GLASS, J. 2006. The environmental impact of the abandoned Edendale lead mine near Tshwane, South Africa.University of Johnnesburg. GUTIÉRREZ, M., MICKUS, K. & CAMACHO, L.M. 2016. Abandoned PbZn mining wastes and their mobility as proxy to toxicity: A review.Science of The Total Environment, 5659/15/:392-400. HASINIAINA, F., ZHOU, J. & GUOYI, L. 2010. Regional assessment of groundwater vulnerability in Tamtsag basin, Mongolia using drastic model.J Am Sci,6(11):65- 78. HOFMANN, T. & SCHUWIRTH, N. 2008. Zn and Pb release of sphalerite (ZnS)-bearing mine waste tailings.Journal of Soils and Sediments,8(6):433-441. 103
HOLMES, P.R. & CRUNDWELL, F.K. 2000. The kinetics of the oxidation of pyrite by ferric ions and dissolved oxygen: an electrochemical study.Geochimica et Cosmochimica Acta,64(2), 1//:263-274. JOHNSON, D.B. & HALLBERG, K.B. 2005. Acid mine drainage remediation options: a review.Sci. Total. Environ.,338(1):3-14. JOHNSON, K. & YOUNGER, P. 2002. Hydrogeological and geochemical consequences of the abandonment of Frazer’s Grove carbonate hosted Pb/Zn fluorspar mine, North Pennines, UK.Geological Society, London, Special Publications, 198(1):347-363. JONES, A., ROGERSON, M., GREENWAY, G., POTTER, H. & MAYES, W. 2013. Mine water geochemistry and metal flux in a major historic Pb-Zn-F orefield, the Yorkshire Pennines, UK.Environmental Science and Pollution Research, 20(11):7570-7581. KASS, W. & BEHRENS, H. 1998.Tracing technique in geohydrology.Balkema. KAUFMANN, G. 2016. Modelling karst aquifer evolution in fractured, porous rocks. Journal of Hydrology,5432016/12/01/:796-807. 104
KAY, F. 2014. Mechanisms of the removal of metals from acid and natural mine water under varying redox systems. Cardiff University, KGARI, T., VAN WYK, Y., COETZEE, H. & DIPPENAAR, M. 2016. Mine Water approach using Tracers in South African abandoned Coal Mines.IMWA 2016 – Mining Meets Water – Conflicts and Solutions, proceedings:410-416. KUMAR, P.J.S. 2014. Evolution of groundwater chemistry in and around Vaniyambadi Industrial Area: Differentiating the natural and anthropogenic sources of contamination.Chemie der Erde - Geochemistry,74(4), 12//:641-651. LEE, J.-Y., CHOI, J.-C. & LEE, K.-K. 2005. Variations in heavy metal contamination of stream water and groundwater affected by an abandoned lead–zinc mine in Korea. Environmental Geochemistry and Health,27(3):237-257. LEIBUNDGUT, C., MALOSZEWSKI, P. & KÜLLS, C. 2011.Tracers in hydrology.John Wiley & Sons. 105
Secure Best Marks with AI Grader
Need help grading? Try our AI Grader for instant feedback on your assignments.
LGHOUL, M., MAQSOUD, A., HAKKOU, R. & KCHIKACH, A. 2014. Hydrogeochemical behavior around the abandoned Kettara mine site, Morocco.Journal of Geochemical Exploration,144:456-467. LUOMA, S.N., RAINBOW, P.S. & LUOMA, S. 2008.Metal contamination in aquatic environments: science and lateral management.Cambridge University Press. LURIE, J. 1981.South African Geology: For Mining, Metallurgical, Hydrological, and Civil Engineering.McGraw-Hill Book Company. MACKAY, A.K., TAYLOR, M.P., MUNKSGAARD, N.C., HUDSON-EDWARDS, K.A. & BURN-NUNES, L. 2013. Identification of environmental lead sources and pathways in a mining and smelting town: Mount Isa, Australia.Environ. Pollut., 1809//:304-311. MANAHAN, S.E. 2010.Environmental chemistry.9th ed. MATTHESS, G. 1982.Properties of groundwater.John Wiley. 106
MHLONGO, S.E. & AMPONSAH-DACOSTA, F. 2016.A review of problems and solutions of abandoned mines in South Africa.Int. J. Min. Reclam. Env.,30(4):279-294. MILU, V., LEROY, J. & PEIFFERT, C. 2002. Water contamination downstream from a copper mine in the Apuseni Mountains, Romania.Environ. Geol.,42(7):773-782. NAGAJYOTI, P.C., LEE, K.D. & SREEKANTH, T.V.M. 2010. Heavy metals, occurrence and toxicity for plants: a review.Environmental Chemistry Letters,8(3):199-216. NORDSTROM, D.K., ALPERS, C.N., PTACEK, C.J. & BLOWES, D.W. 2000. Negative pH and extremely acidic mine waters from Iron Mountain, California.Environmental Science & Technology,34(2):254-258. NORDSTROM, D.K., BLOWES, D.W. & PTACEK, C.J. 2015. Hydrogeochemistry and microbiology of mine drainage: An update.Applied Geochemistry,57:3-16. NUTTALL, C.A. & YOUNGER, P.L. 2000. Zinc removal from hard, circum-neutral mine waters using a novel closed-bed limestone reactor.Water. Res.,34(4), 3//:1262- 1268. 107
NUTTALL, C.A. & YOUNGER, P.L. 2004. Hydrochemical stratification in flooded underground mines: an overlooked pitfall.Journal of contaminant hydrology, 69(1):101-114. PALUMBO-ROE, B., WRAGG, J. & BANKS, V.J. 2012. Lead mobilisation in the hyporheic zone and river bank sediments of a contaminated stream: contribution to diffuse pollution.Journal of Soils and Sediments,12(10):1633-1640. RAMANI, S., DRAGUN, Z., KAPETANOVIĆ, D., KOSTOV, V., JORDANOVA, M., ERK, M. & HAJRULAI-MUSLIU, Z. 2014. Surface water characterization of three rivers in the lead/zinc mining region of northeastern Macedonia.Archives of environmental contamination and toxicology,66(4):514-528. RAMOS ARROYO, Y.R. & SIEBE, C. 2007. Weathering of sulphide minerals and trace element speciation in tailings of various ages in the Guanajuato mining district, Mexico.CATENA,71(3), 12/1/:497-506. READ, J.S., HAMILTON, D.P., JONES, I.D., MURAOKA, K., WINSLOW, L.A., KROISS, R., WU, C.H. & GAISER, E. 2011. Derivation of lake mixing and stratification indices from high-resolution lake buoy data.Environ. Modell. Softw.,26(11), 11//:1325-1336. 108
Paraphrase This Document
Need a fresh take? Get an instant paraphrase of this document with our AI Paraphraser
REEKS, G.W. 2012. A history of silver mining in the greater Pretoria region, 1885-1999. ROBINS, N.S., CHILTON, P.J. & COBBING, J.E. 2007. Adapting existing experience with aquifer vulnerability and groundwater protection for Africa.Journal of African Earth Sciences,47(1), 2007/01/01/:30-38. SCHREIBER, M.E. & RIMSTIDT, J.D. 2013. Trace element source terms for mineral dissolution.Applied Geochemistry,3710//:94-101. SINGH, G.K., MONDAL, G.C., KUMAR, S., SINGH, T.B., TEWARY, B.K. & SINHA, A. 2008. Major ion chemistry, weathering processes and water quality assessment in upper catchment of Damodar River basin, India.Environmental Geology, 54(4):745-758. SNOGAASS, A. 1986. Lead in South Africa.J. South. Afri. Inst. Min. Metall.,3:97. SOPHOCLEOUS, M. 2002. Interactions between groundwater and surface water: the state of the science.Hydrogeology journal,10(1):52-67. 109
STUMM, W. & MORGAN, J.J. 2012.Aquatic chemistry: chemical equilibria and rates in natural waters.John Wiley & Sons. THORNTON, I. 1996. Impacts of mining on the environment; some local, regional and global issues.Applied Geochemistry,11:355-361. UFI. 1994.Upstate Freshwater Institute[Online]. Available from: http://www.upstatefreshwater.org/NRT-Data/Data-Analysis/data-analysis.html [Accessed: 02-23 2017]. VALENTE, T.M. & LEAL GOMES, C. 2009.Occurrence, properties and pollution potential of environmental minerals in acid mine drainage.Sci. Total. Environ.,407(3), 1/15/:1135-1152. VAN DER SCHYFF, E. 2012. South African mineral law: a historical overview of the state’s regulatory power regarding the exploitation of minerals. VÍAS, J., ANDREO, B., RAVBAR, N. & HÖTZL, H. 2010.Mapping the vulnerability of groundwater to the contamination of four carbonate aquifers in Europe.Journal of Environmental Management,91(7), 2010/07/01/:1500-1510. 110
VINK, B.W. 1996. Stability relations of antimony and arsenic compounds in the light of revised and extended Eh-pH diagrams.Chem. Geol.,130(1), 1996/08/07:21-30. WHITE, W.M. 2013.Geochemistry.John Wiley & Sons. WILLEMSE, J., SCHWELLNUS, C.M., BRANDT, J.W., RUSSELL, H. D. & & VAN ROOYEN, D.P. 1944. Lead deposits in the Union of South Africa and South West Africa with some notes on associated ores. .Memoir:37-74. WILSON, S.C., LOCKWOOD, P.V., ASHLEY, P.M. & TIGHE, M. 2010. The chemistry and behaviour of antimony in the soil environment with comparisons to arsenic: A critical review.Environ. Pollut,158(5), 5//:1169-1181. WITTHÜSER, K., HOLLAND, M., SEIDEL, T. & KÖNIG, C. 2015. NUMERICAL MODELLING OF MINE DEWATERING AND FLOODING IN THE EVANDER GOLD BASIN, SOUTH AFRICA.South African Journal of Geology,118(1):71-82. WOLKERSDORFER, C. 2005. Mine water tracer tests as a basis for remediation strategies.Chem. Erde. Geochem.,65:64-74. 111
Secure Best Marks with AI Grader
Need help grading? Try our AI Grader for instant feedback on your assignments.
WOLKERSDORFER, C. 2008.Water management at abandoned flooded underground mines: fundamentals, tracer tests, modelling, water treatment.Springer Science & Business Media. WOLKERSDORFER, C., FELDTNER, N. & TREBUŠAK, I. 2002. Mine water tracing–a tool for assessing flow paths in flooded underground mines.Mine Water Environ., 21(1):7-14. YAO, M., LIU, P., SHANG, M., TAO, Y., LEI, C. & CAO, L. 2016. Determining sources of mine water based on hydraulic characteristics analysis of a fault system. Environmental Earth Sciences,75(10):1-8. YENILMEZ, F., KUTER, N., EMIL, M.K. & AKSOY, A. 2011. Evaluation of pollution levels at an abandoned coal mine site in Turkey with the aid of GIS.International Journal of Coal Geology,86(1), 4/1/:12-19. YOUNGER, P.L. 2000a. The adoption and adaptation of passive treatment technologies for mine waters in the United Kingdom.Mine. Water. Environ.,19(2):84-97. 112
YOUNGER, P.L. 2000b. Nature and practical implications of heterogeneities in the geochemistry of zinc-rich, alkaline mine waters in an underground F–Pb mine in the UK.Appl. Geochem.,15(9), 10/1/:1383-1397. YOUNGER, P.L. 2000c. Predicting temporal changes in total iron concentrations in groundwaters flowing from abandoned deep mines: a first approximation.Journal of Contaminant Hydrology,44(1):47-69. YOUNGER, P.L., COULTON, R.H. & FROGGATT, E.C. 2005. The contribution of science to risk-based decision-making: lessons from the development of full-scale treatment measures for acidic mine waters at Wheal Jane, UK.Sci. Total. Environ.,338(1–2):137-154. YOUNGER, P.L. & WOLKERSDORFER, C. 2004. Mining Impacts on the Fresh Water Environment: Technical and Managerial Guidelines for Catchment Scale Management.Mine Water Environ.,23(1):s2-s80. YU, H., TSUNO, H., HIDAKA, T. & JIAO, C. 2010. Chemical and thermal stratification in lakes.Limnology,11(3):251-257. 113
ZEMAN, J., ŠUPÍKOVÁ, I. & ČERNÍK, M. 2008. Mine Water Stratification at Abandoned Mines and its Geochemical Model.PROCEEDINGS, 10th International Mine Water Association Congress.183-186. ZHANG, X., YANG, L., LI, Y., LI, H., WANG, W. & YE, B. 2011. Impacts of lead/zinc mining and smelting on the environment and human health in China.Environ. Monit. Assess,184(4):2261-2273. 114
Paraphrase This Document
Need a fresh take? Get an instant paraphrase of this document with our AI Paraphraser