PSYC2530: Statistical Analysis and Hypothesis Testing Problem Set #2
VerifiedAdded on 2023/01/13
|5
|1103
|27
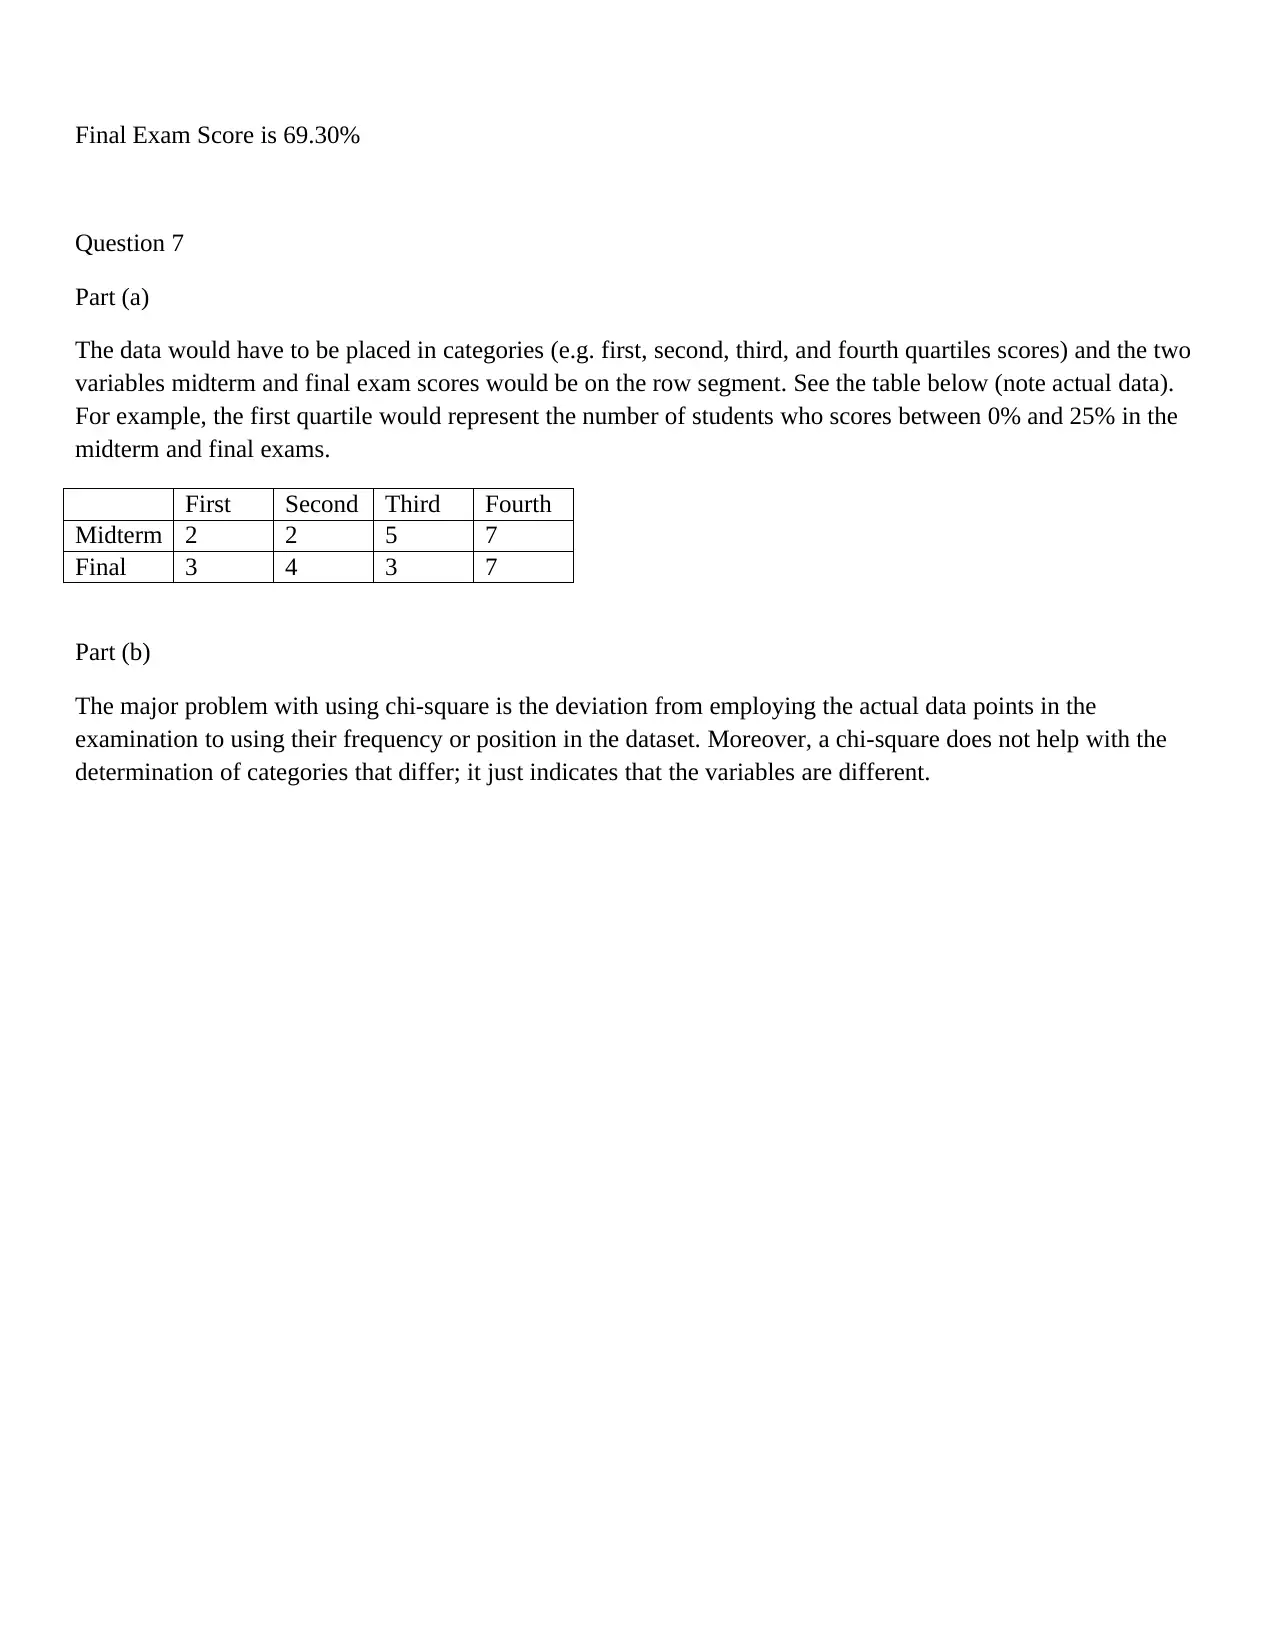
Homework Assignment
AI Summary
This document provides a comprehensive solution to Problem Set #2 for PSYC2530, a psychology course. The assignment focuses on statistical analysis, including hypothesis testing and confidence intervals. The solution begins with a paired sample t-test to compare student scores on two attempts of the same exam, calculating the t-score, p-value, and effect size (Cohen's d). It then explores confidence intervals, interpreting the range within which the mean score difference lies. The assignment further examines an independent samples t-test to compare the results of two different classes, followed by a discussion of sample size effects. Regression analysis is employed to assess the relationship between midterm and final exam scores, including the calculation of the correlation coefficient, R-squared, and the significance of the f-statistic. The document also demonstrates how to predict final exam scores based on midterm scores using a regression model and concludes with a discussion of chi-square analysis for categorical data. The solution incorporates calculations, interpretations, and graphical representations to demonstrate a thorough understanding of the statistical concepts.
1 out of 5
Related Documents


Your All-in-One AI-Powered Toolkit for Academic Success.
+13062052269
info@desklib.com
Available 24*7 on WhatsApp / Email
![[object Object]](/_next/static/media/star-bottom.7253800d.svg)
Copyright © 2020–2026 A2Z Services. All Rights Reserved. Developed and managed by ZUCOL.