BUS7200 Statistics for Research Methods: Hypothesis Testing

Verified

Added on  2020/10/15

|5
|683
|147
Homework Assignment
AI Summary
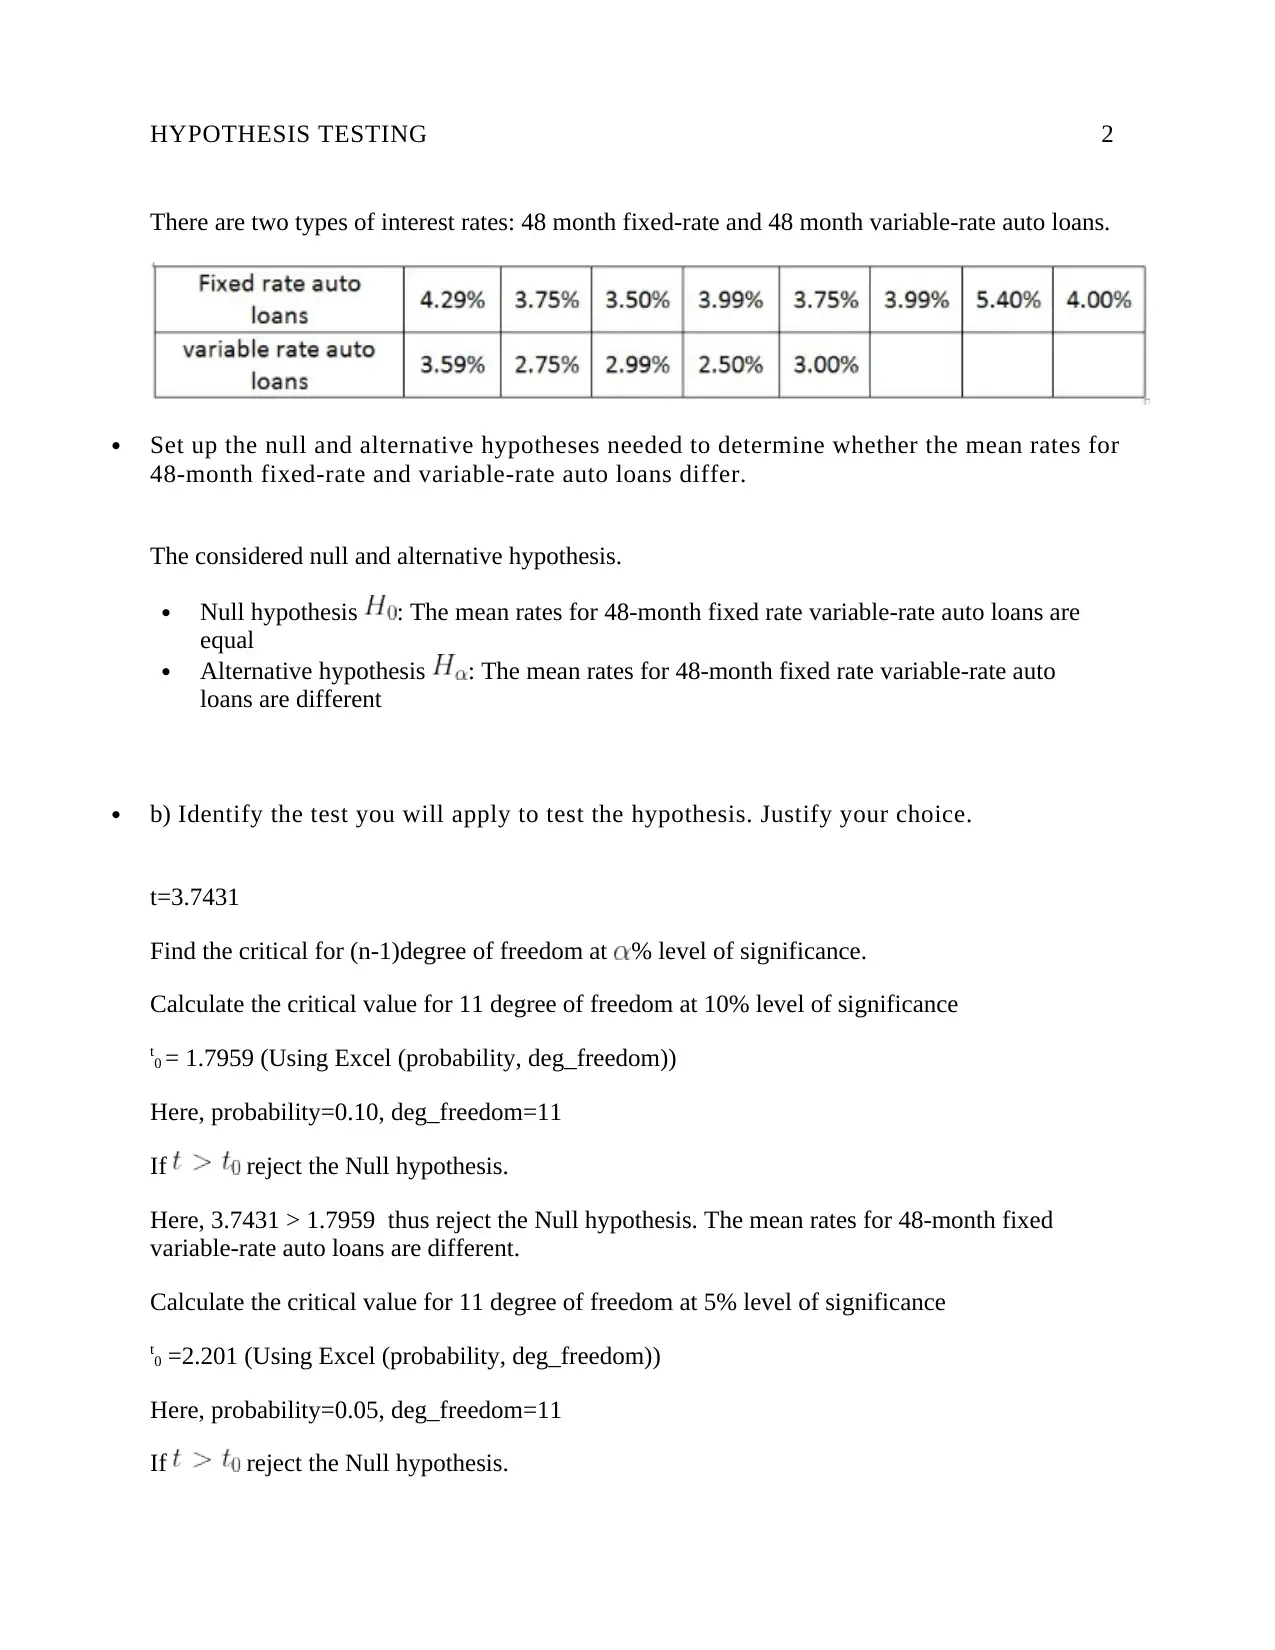
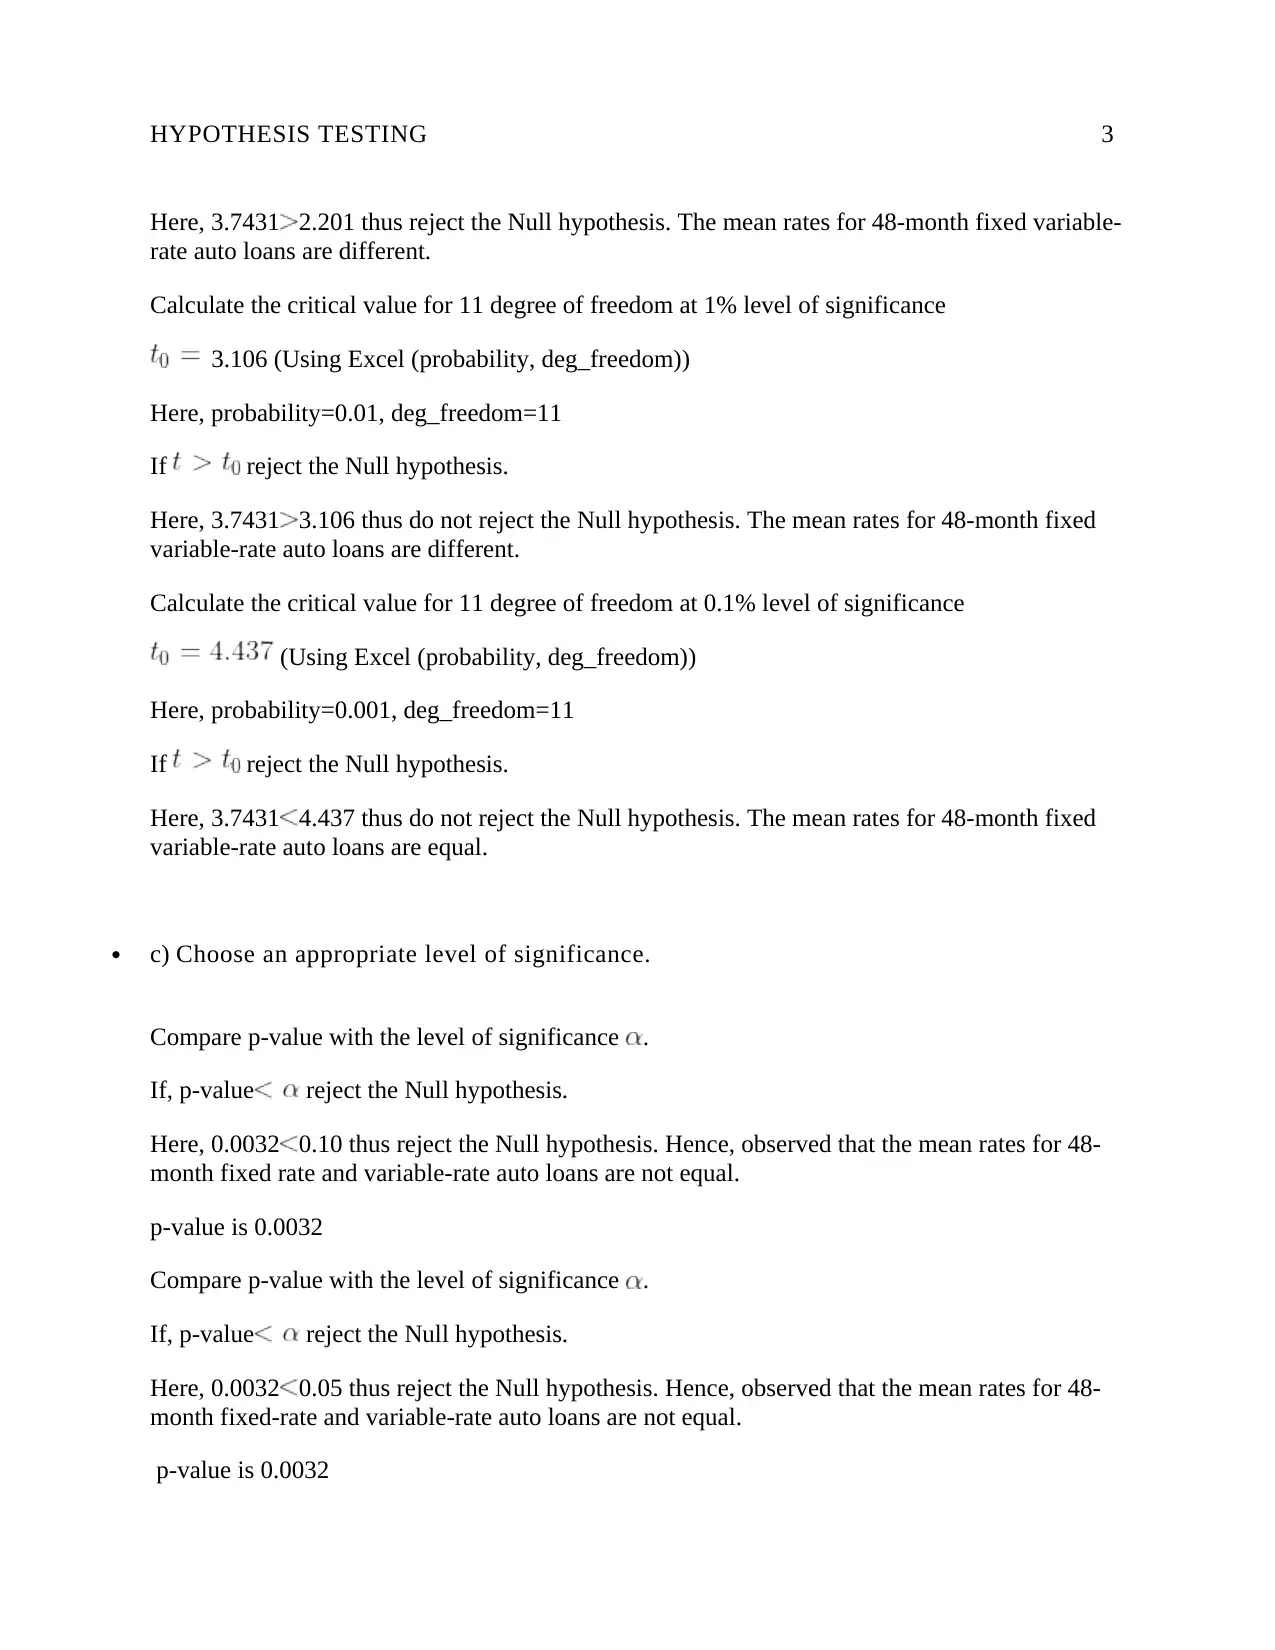
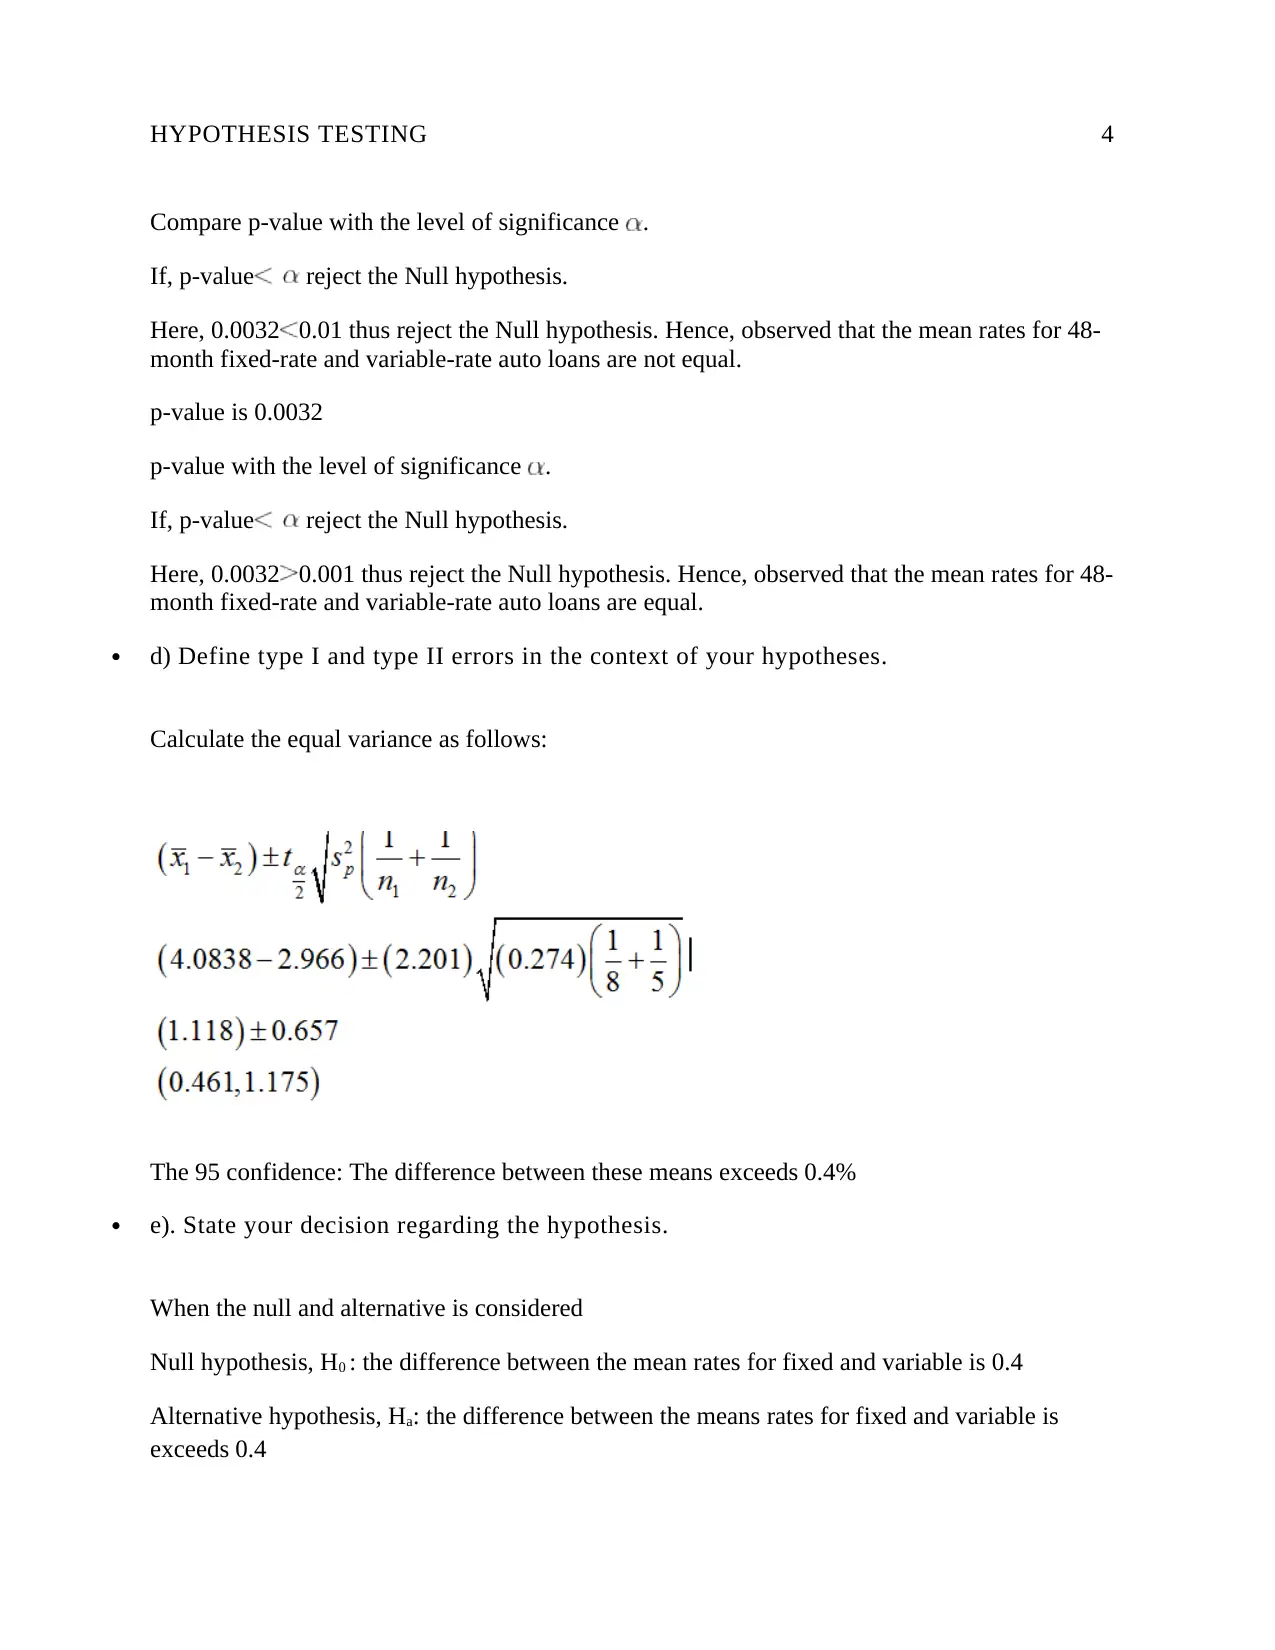
This assignment focuses on hypothesis testing to determine if there's a difference between the mean rates of 48-month fixed-rate and variable-rate auto loans. It begins by establishing null and alternative hypotheses, followed by the selection of a t-test for analysis. The solution calculates critical values at different significance levels (10%, 5%, 1%, and 0.1%) and compares them with the calculated t-statistic to determine whether to reject or fail to reject the null hypothesis. The assignment also includes the calculation and interpretation of p-values, defining Type I and Type II errors, and assessing the difference between means, including a 95% confidence interval analysis. The student concludes with a decision regarding the hypothesis, considering the context of the problem and statistical evidence, referencing relevant statistical concepts and methods.
Document Page
Running Head: HYPOTHESIS TESTING 1
Hypothesis Testing
Napoleon Wilson
South University
BUS7200 Statistic for Research Methods 1
Week 2 Project
Dr. List
Oct 5, 2020
tabler-icon-diamond-filled.svg

Paraphrase This Document

Need a fresh take? Get an instant paraphrase of this document with our AI Paraphraser
Document Page
HYPOTHESIS TESTING 2
There are two types of interest rates: 48 month fixed-rate and 48 month variable-rate auto loans.
Set up the null and alternative hypotheses needed to determine whether the mean rates for
48-month fixed-rate and variable-rate auto loans differ.
The considered null and alternative hypothesis.
Null hypothesis : The mean rates for 48-month fixed rate variable-rate auto loans are
equal
Alternative hypothesis : The mean rates for 48-month fixed rate variable-rate auto
loans are different
b) Identify the test you will apply to test the hypothesis. Justify your choice.
t=3.7431
Find the critical for (n-1)degree of freedom at % level of significance.
Calculate the critical value for 11 degree of freedom at 10% level of significance
t0 = 1.7959 (Using Excel (probability, deg_freedom))
Here, probability=0.10, deg_freedom=11
If reject the Null hypothesis.
Here, 3.7431 > 1.7959 thus reject the Null hypothesis. The mean rates for 48-month fixed
variable-rate auto loans are different.
Calculate the critical value for 11 degree of freedom at 5% level of significance
t0 =2.201 (Using Excel (probability, deg_freedom))
Here, probability=0.05, deg_freedom=11
If reject the Null hypothesis.
Document Page
HYPOTHESIS TESTING 3
Here, 3.7431 2.201 thus reject the Null hypothesis. The mean rates for 48-month fixed variable-
rate auto loans are different.
Calculate the critical value for 11 degree of freedom at 1% level of significance
3.106 (Using Excel (probability, deg_freedom))
Here, probability=0.01, deg_freedom=11
If reject the Null hypothesis.
Here, 3.7431 3.106 thus do not reject the Null hypothesis. The mean rates for 48-month fixed
variable-rate auto loans are different.
Calculate the critical value for 11 degree of freedom at 0.1% level of significance
(Using Excel (probability, deg_freedom))
Here, probability=0.001, deg_freedom=11
If reject the Null hypothesis.
Here, 3.7431 4.437 thus do not reject the Null hypothesis. The mean rates for 48-month fixed
variable-rate auto loans are equal.
c) Choose an appropriate level of significance.
Compare p-value with the level of significance .
If, p-value reject the Null hypothesis.
Here, 0.0032 0.10 thus reject the Null hypothesis. Hence, observed that the mean rates for 48-
month fixed rate and variable-rate auto loans are not equal.
p-value is 0.0032
Compare p-value with the level of significance .
If, p-value reject the Null hypothesis.
Here, 0.0032 0.05 thus reject the Null hypothesis. Hence, observed that the mean rates for 48-
month fixed-rate and variable-rate auto loans are not equal.
p-value is 0.0032
Document Page
HYPOTHESIS TESTING 4
Compare p-value with the level of significance .
If, p-value reject the Null hypothesis.
Here, 0.0032 0.01 thus reject the Null hypothesis. Hence, observed that the mean rates for 48-
month fixed-rate and variable-rate auto loans are not equal.
p-value is 0.0032
p-value with the level of significance .
If, p-value reject the Null hypothesis.
Here, 0.0032 0.001 thus reject the Null hypothesis. Hence, observed that the mean rates for 48-
month fixed-rate and variable-rate auto loans are equal.
d) Define type I and type II errors in the context of your hypotheses.
Calculate the equal variance as follows:
The 95 confidence: The difference between these means exceeds 0.4%
e). State your decision regarding the hypothesis.
When the null and alternative is considered
Null hypothesis, H0 : the difference between the mean rates for fixed and variable is 0.4
Alternative hypothesis, Ha: the difference between the means rates for fixed and variable is
exceeds 0.4
tabler-icon-diamond-filled.svg

Paraphrase This Document

Need a fresh take? Get an instant paraphrase of this document with our AI Paraphraser
Document Page
HYPOTHESIS TESTING 5
References
Orris, B.B.R.O.E.M.J. B. (2014). Essentials of Business Statistics. [South University].
Retrieved
from https://digitalbookshelf.southuniversity.edu/#/books/1260089932/
chevron_up_icon
1 out of 5
circle_padding
hide_on_mobile
zoom_out_icon
[object Object]