Hypothesis Tests involving Two Population Means or Proportions Report 2022
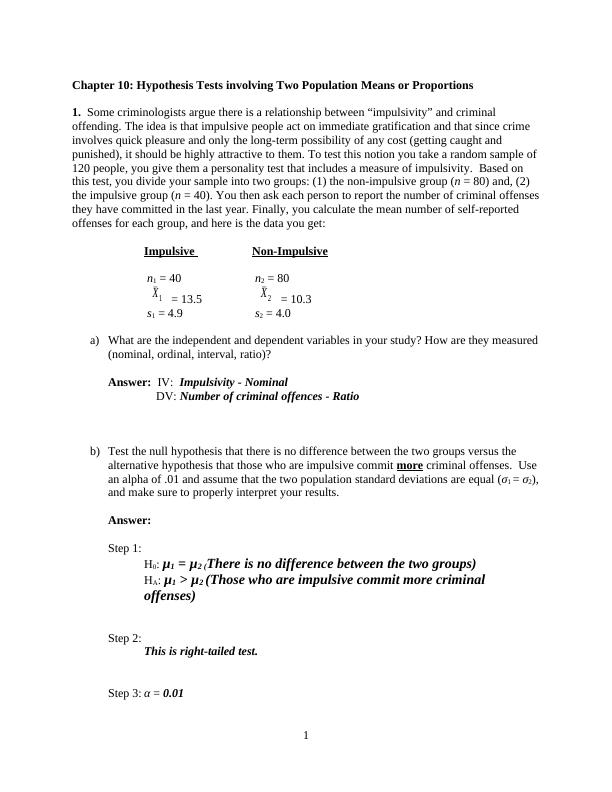
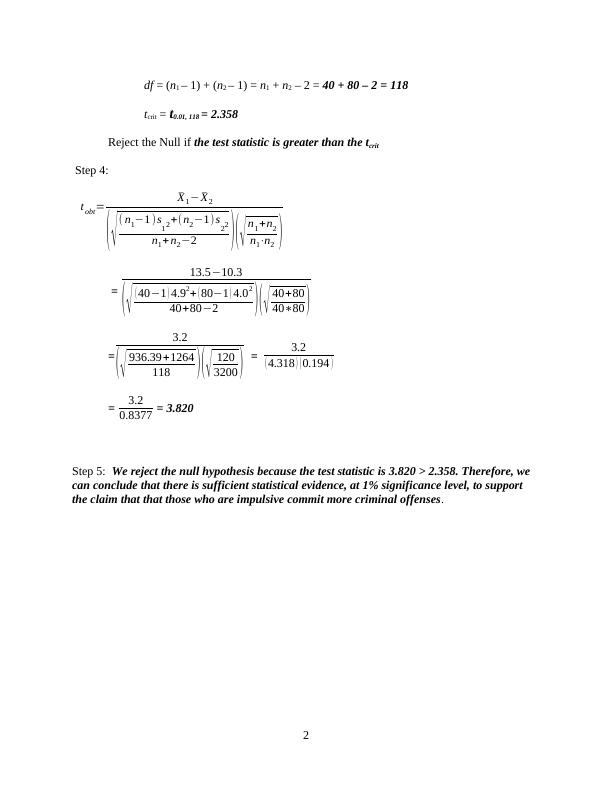
Test the null hypothesis that there is no difference between the two groups in terms of criminal offenses committed based on impulsivity.
4 Pages775 Words11 Views
Added on 2022-10-18
Hypothesis Tests involving Two Population Means or Proportions Report 2022
Test the null hypothesis that there is no difference between the two groups in terms of criminal offenses committed based on impulsivity.
Added on 2022-10-18
ShareRelated Documents
End of preview
Want to access all the pages? Upload your documents or become a member.