Business Analytics and Clinic Data Analysis Report
VerifiedAdded on 2022/08/14
|12
|1979
|14
Report
AI Summary
This report presents a comprehensive business analytics analysis of clinic data, focusing on descriptive, predictive, and prescriptive details to aid in business growth. The descriptive analysis examines patient demographics, including cities, ethnicities, gender, and age, along with statistical details of descriptions, drugs, and reasons for visits. It categorizes medications, graphs patient origins by year, and determines private health insurance usage and diabetic patient averages. Predictive analysis involves forecasting annual income for 2020 and studying associations between diseases like obesity and heart disease, diabetes and hypertension. The prescriptive section offers management and procedural recommendations to boost annual revenue, such as hiring specialists, expanding clinic locations, and improving patient categorization. References to relevant studies support the findings, providing a data-driven approach to enhance the clinic's performance and patient services.

ICT BUSINESS ANALYTICS AND VISUALISATION
1
ICT BUSINESS ANALYTICS AND VISUALISATION
Name of Institution:
Name of student:
Date:
1
ICT BUSINESS ANALYTICS AND VISUALISATION
Name of Institution:
Name of student:
Date:
Paraphrase This Document
Need a fresh take? Get an instant paraphrase of this document with our AI Paraphraser
ICT BUSINESS ANALYTICS AND VISUALISATION
2
Descriptive
Ethnic background, gender and age
The patients were from 368 distinct cities. The cities that had the highest number of patients
were: Middleton Grange (6135), Bossley Park (5009) and Hoxton Park (6435). On the other
hand, some of the cities with the lowest number of patients were: Coledale (1), Mardi (1),
Yarrabilba (1), Lyons (1), Hisdale (1), and Colebee (1).
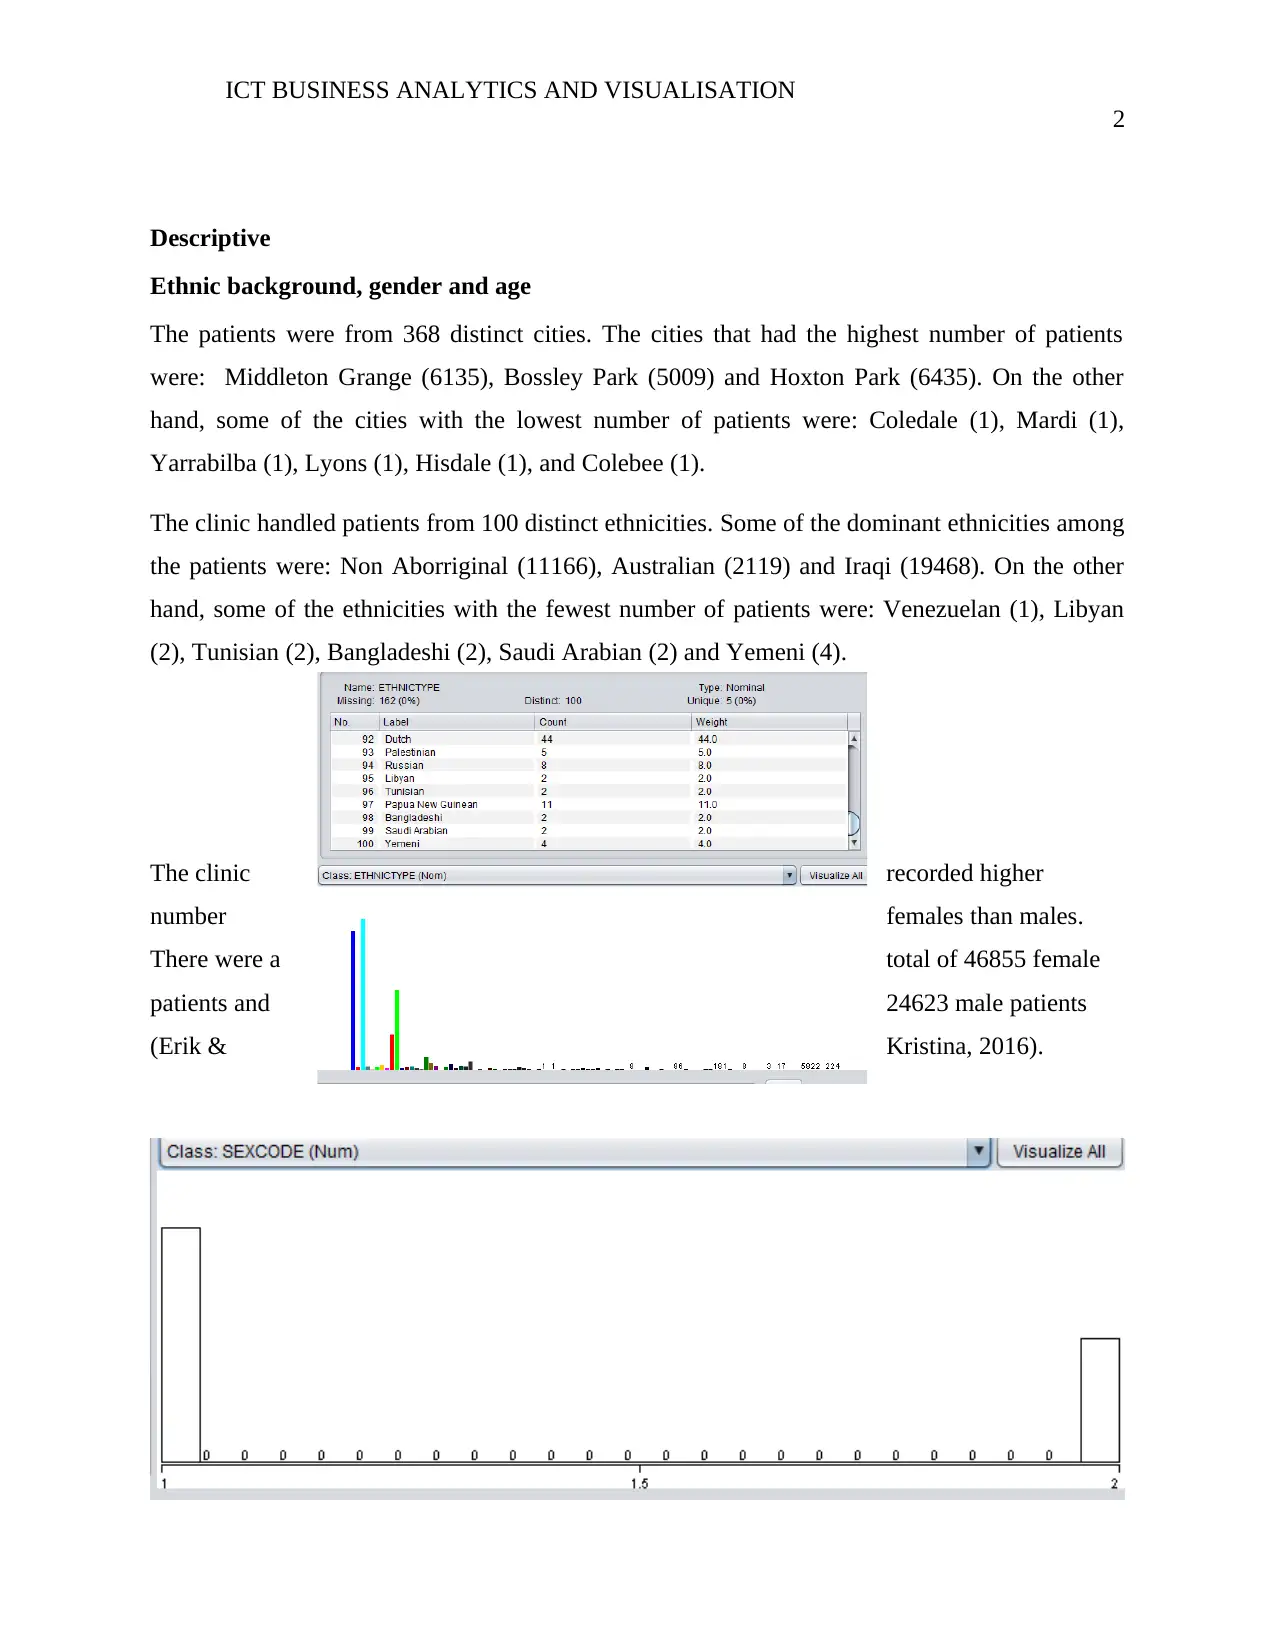
The clinic handled patients from 100 distinct ethnicities. Some of the dominant ethnicities among
the patients were: Non Aborriginal (11166), Australian (2119) and Iraqi (19468). On the other
hand, some of the ethnicities with the fewest number of patients were: Venezuelan (1), Libyan
(2), Tunisian (2), Bangladeshi (2), Saudi Arabian (2) and Yemeni (4).
The clinic recorded higher
number females than males.
There were a total of 46855 female
patients and 24623 male patients
(Erik & Kristina, 2016).
2
Descriptive
Ethnic background, gender and age
The patients were from 368 distinct cities. The cities that had the highest number of patients
were: Middleton Grange (6135), Bossley Park (5009) and Hoxton Park (6435). On the other
hand, some of the cities with the lowest number of patients were: Coledale (1), Mardi (1),
Yarrabilba (1), Lyons (1), Hisdale (1), and Colebee (1).
The clinic handled patients from 100 distinct ethnicities. Some of the dominant ethnicities among
the patients were: Non Aborriginal (11166), Australian (2119) and Iraqi (19468). On the other
hand, some of the ethnicities with the fewest number of patients were: Venezuelan (1), Libyan
(2), Tunisian (2), Bangladeshi (2), Saudi Arabian (2) and Yemeni (4).
The clinic recorded higher
number females than males.
There were a total of 46855 female
patients and 24623 male patients
(Erik & Kristina, 2016).
ICT BUSINESS ANALYTICS AND VISUALISATION
3
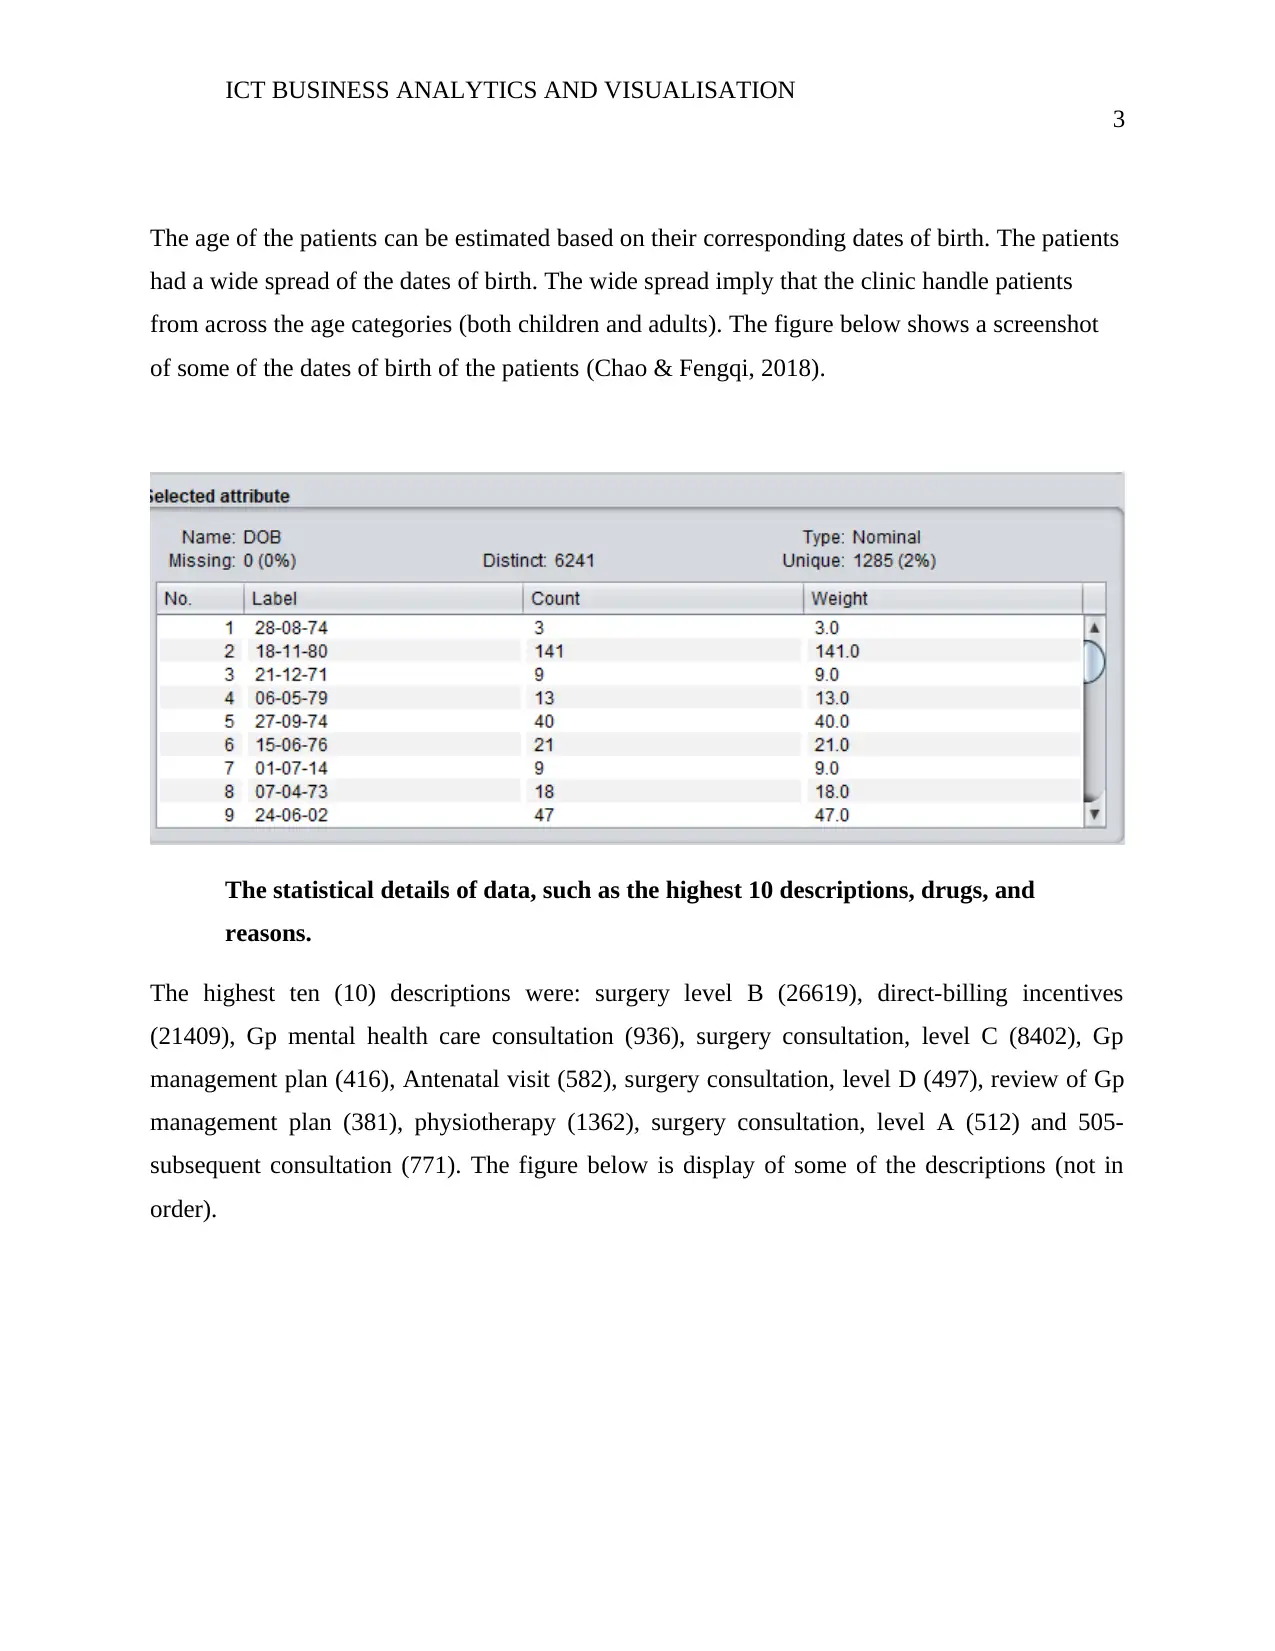
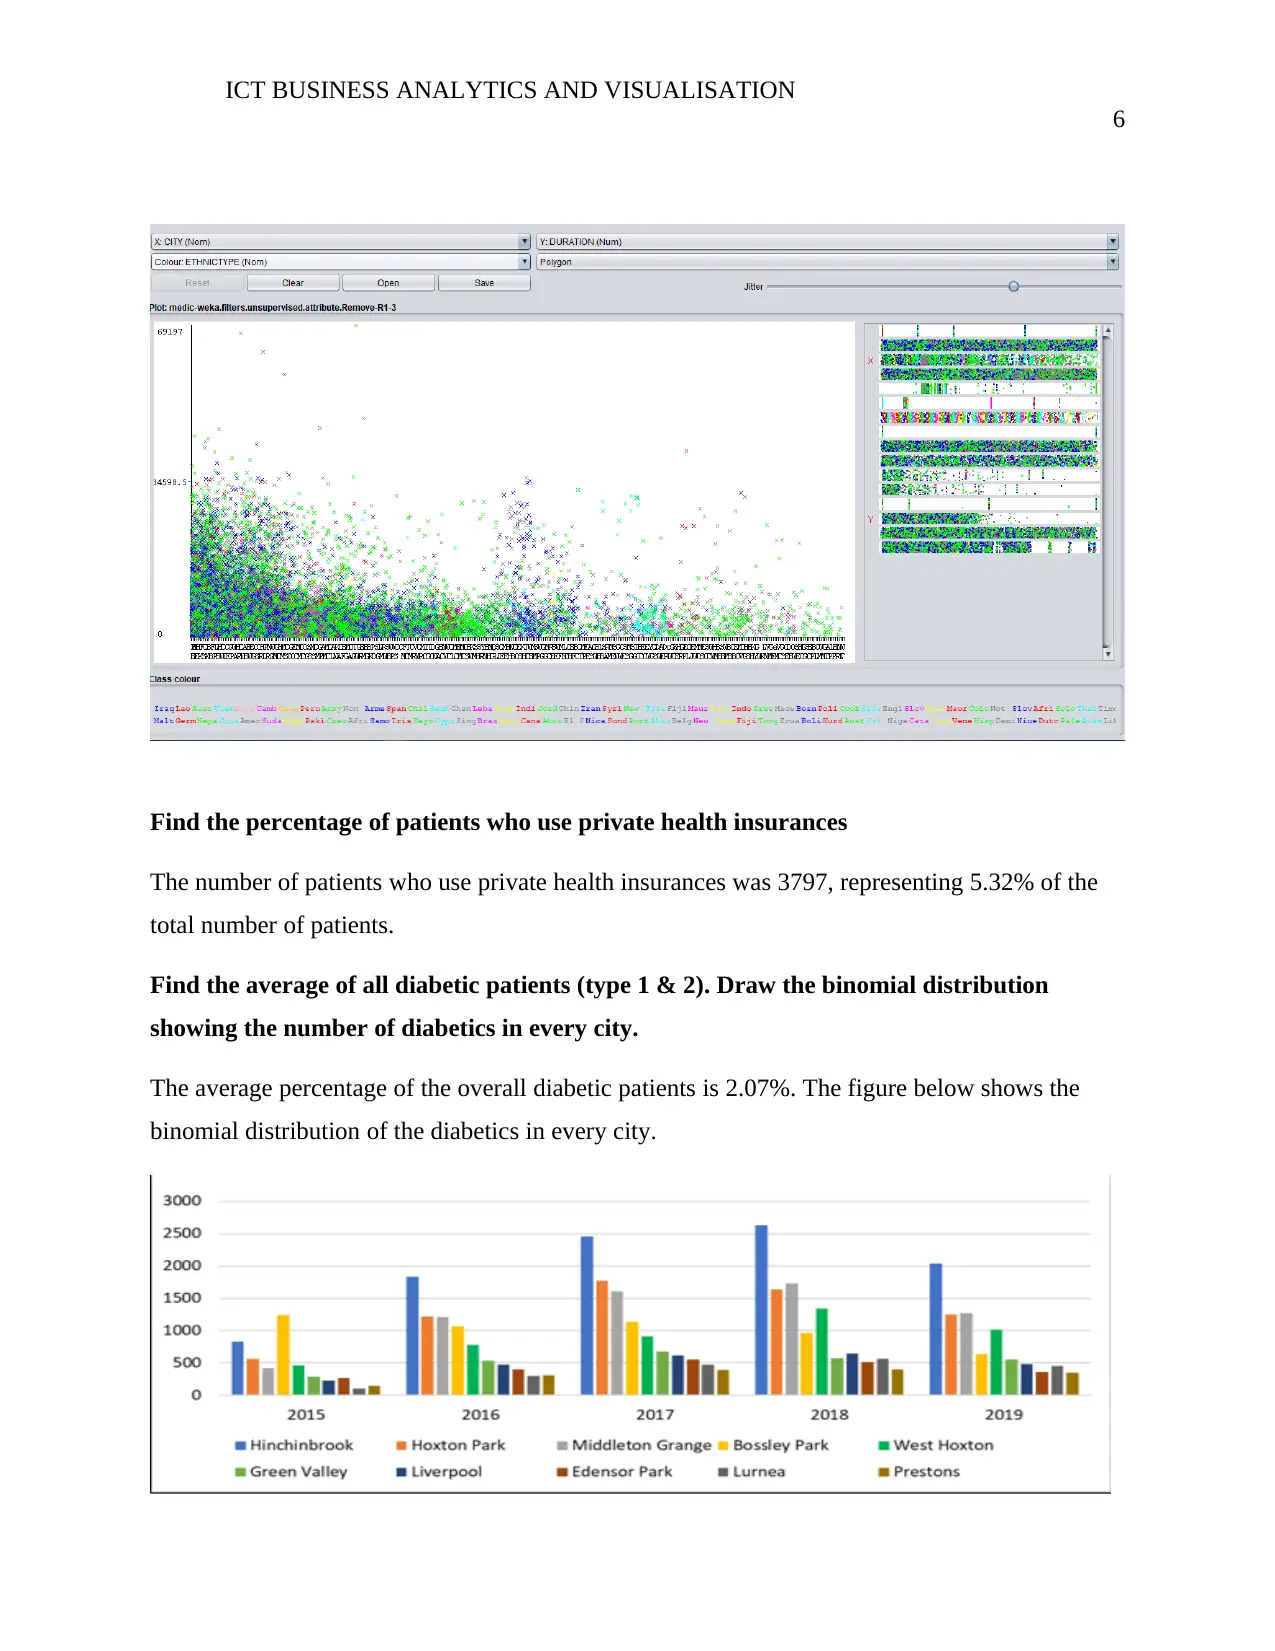
The age of the patients can be estimated based on their corresponding dates of birth. The patients
had a wide spread of the dates of birth. The wide spread imply that the clinic handle patients
from across the age categories (both children and adults). The figure below shows a screenshot
of some of the dates of birth of the patients (Chao & Fengqi, 2018).
The statistical details of data, such as the highest 10 descriptions, drugs, and
reasons.
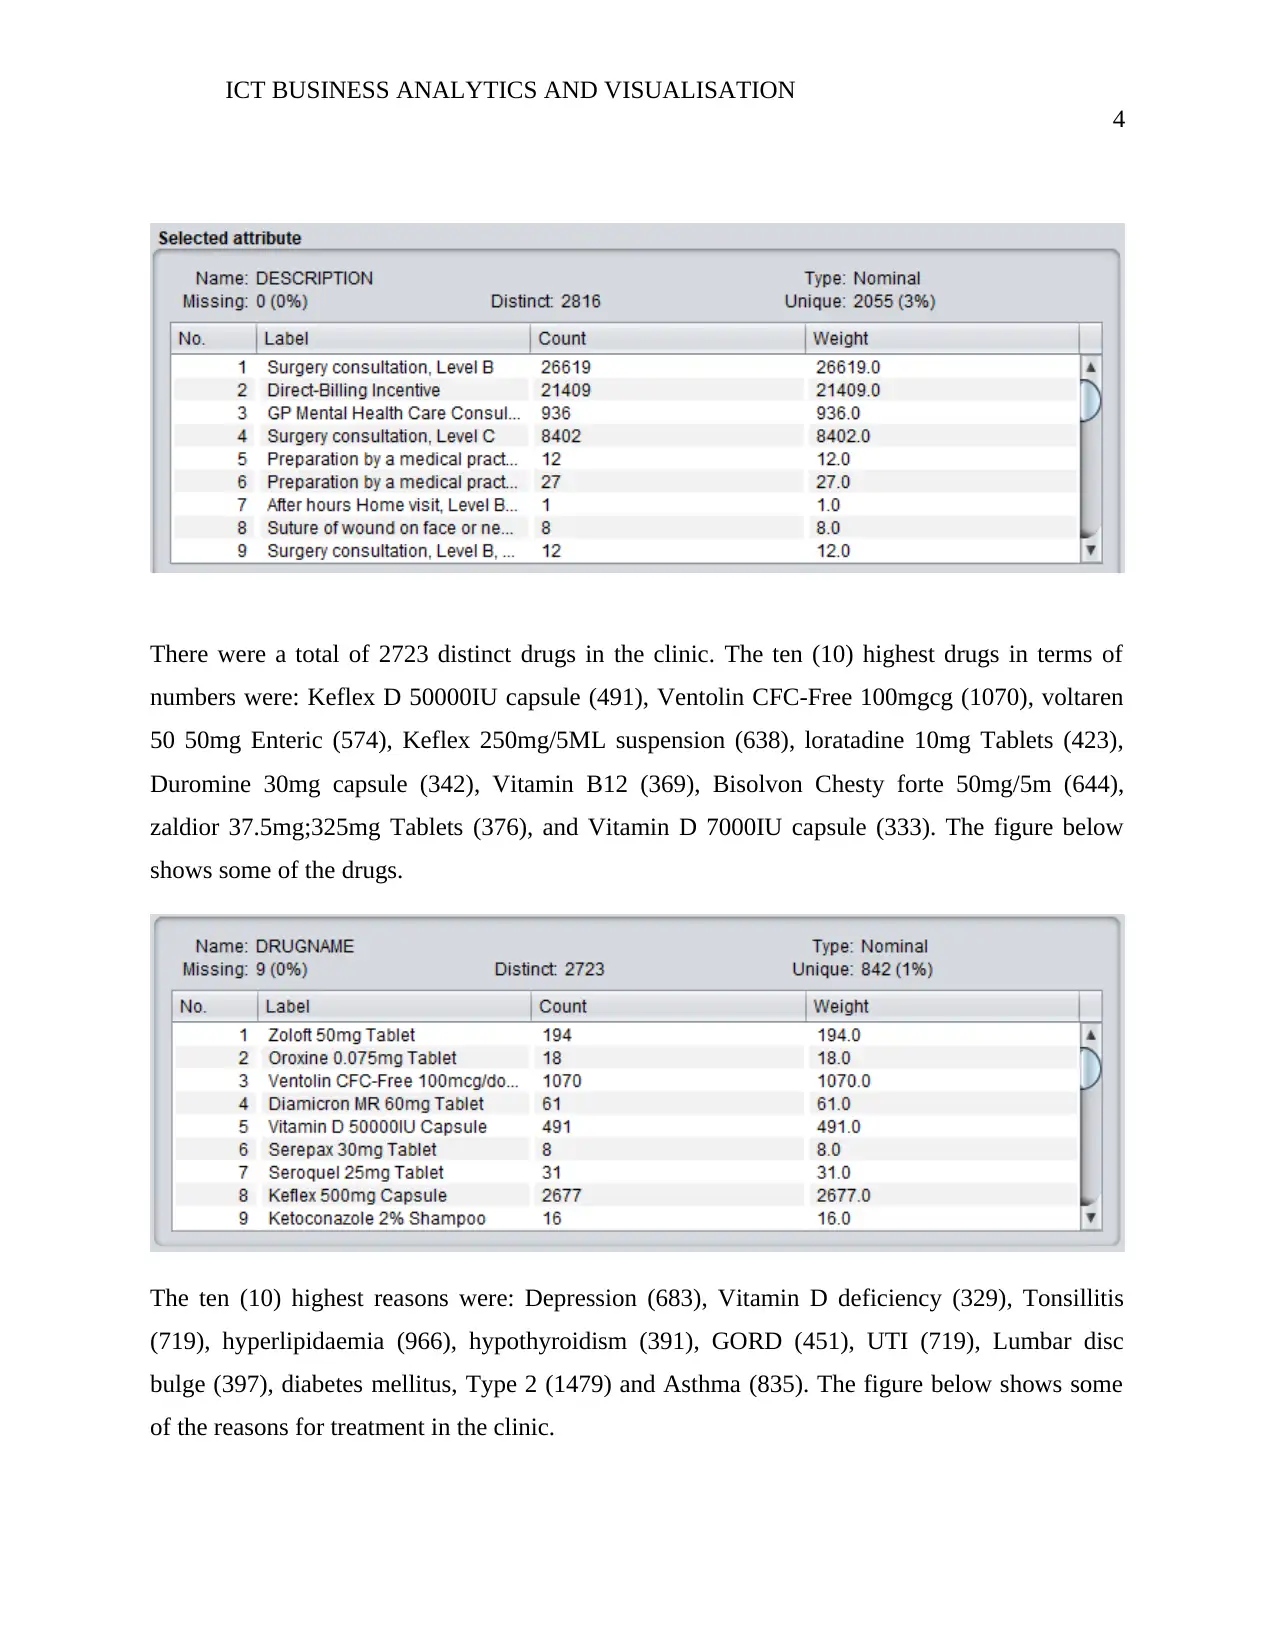
The highest ten (10) descriptions were: surgery level B (26619), direct-billing incentives
(21409), Gp mental health care consultation (936), surgery consultation, level C (8402), Gp
management plan (416), Antenatal visit (582), surgery consultation, level D (497), review of Gp
management plan (381), physiotherapy (1362), surgery consultation, level A (512) and 505-
subsequent consultation (771). The figure below is display of some of the descriptions (not in
order).
3
The age of the patients can be estimated based on their corresponding dates of birth. The patients
had a wide spread of the dates of birth. The wide spread imply that the clinic handle patients
from across the age categories (both children and adults). The figure below shows a screenshot
of some of the dates of birth of the patients (Chao & Fengqi, 2018).
The statistical details of data, such as the highest 10 descriptions, drugs, and
reasons.
The highest ten (10) descriptions were: surgery level B (26619), direct-billing incentives
(21409), Gp mental health care consultation (936), surgery consultation, level C (8402), Gp
management plan (416), Antenatal visit (582), surgery consultation, level D (497), review of Gp
management plan (381), physiotherapy (1362), surgery consultation, level A (512) and 505-
subsequent consultation (771). The figure below is display of some of the descriptions (not in
order).
⊘ This is a preview!⊘
Do you want full access?
Subscribe today to unlock all pages.
Trusted by 1+ million students worldwide
ICT BUSINESS ANALYTICS AND VISUALISATION
4
There were a total of 2723 distinct drugs in the clinic. The ten (10) highest drugs in terms of
numbers were: Keflex D 50000IU capsule (491), Ventolin CFC-Free 100mgcg (1070), voltaren
50 50mg Enteric (574), Keflex 250mg/5ML suspension (638), loratadine 10mg Tablets (423),
Duromine 30mg capsule (342), Vitamin B12 (369), Bisolvon Chesty forte 50mg/5m (644),
zaldior 37.5mg;325mg Tablets (376), and Vitamin D 7000IU capsule (333). The figure below
shows some of the drugs.
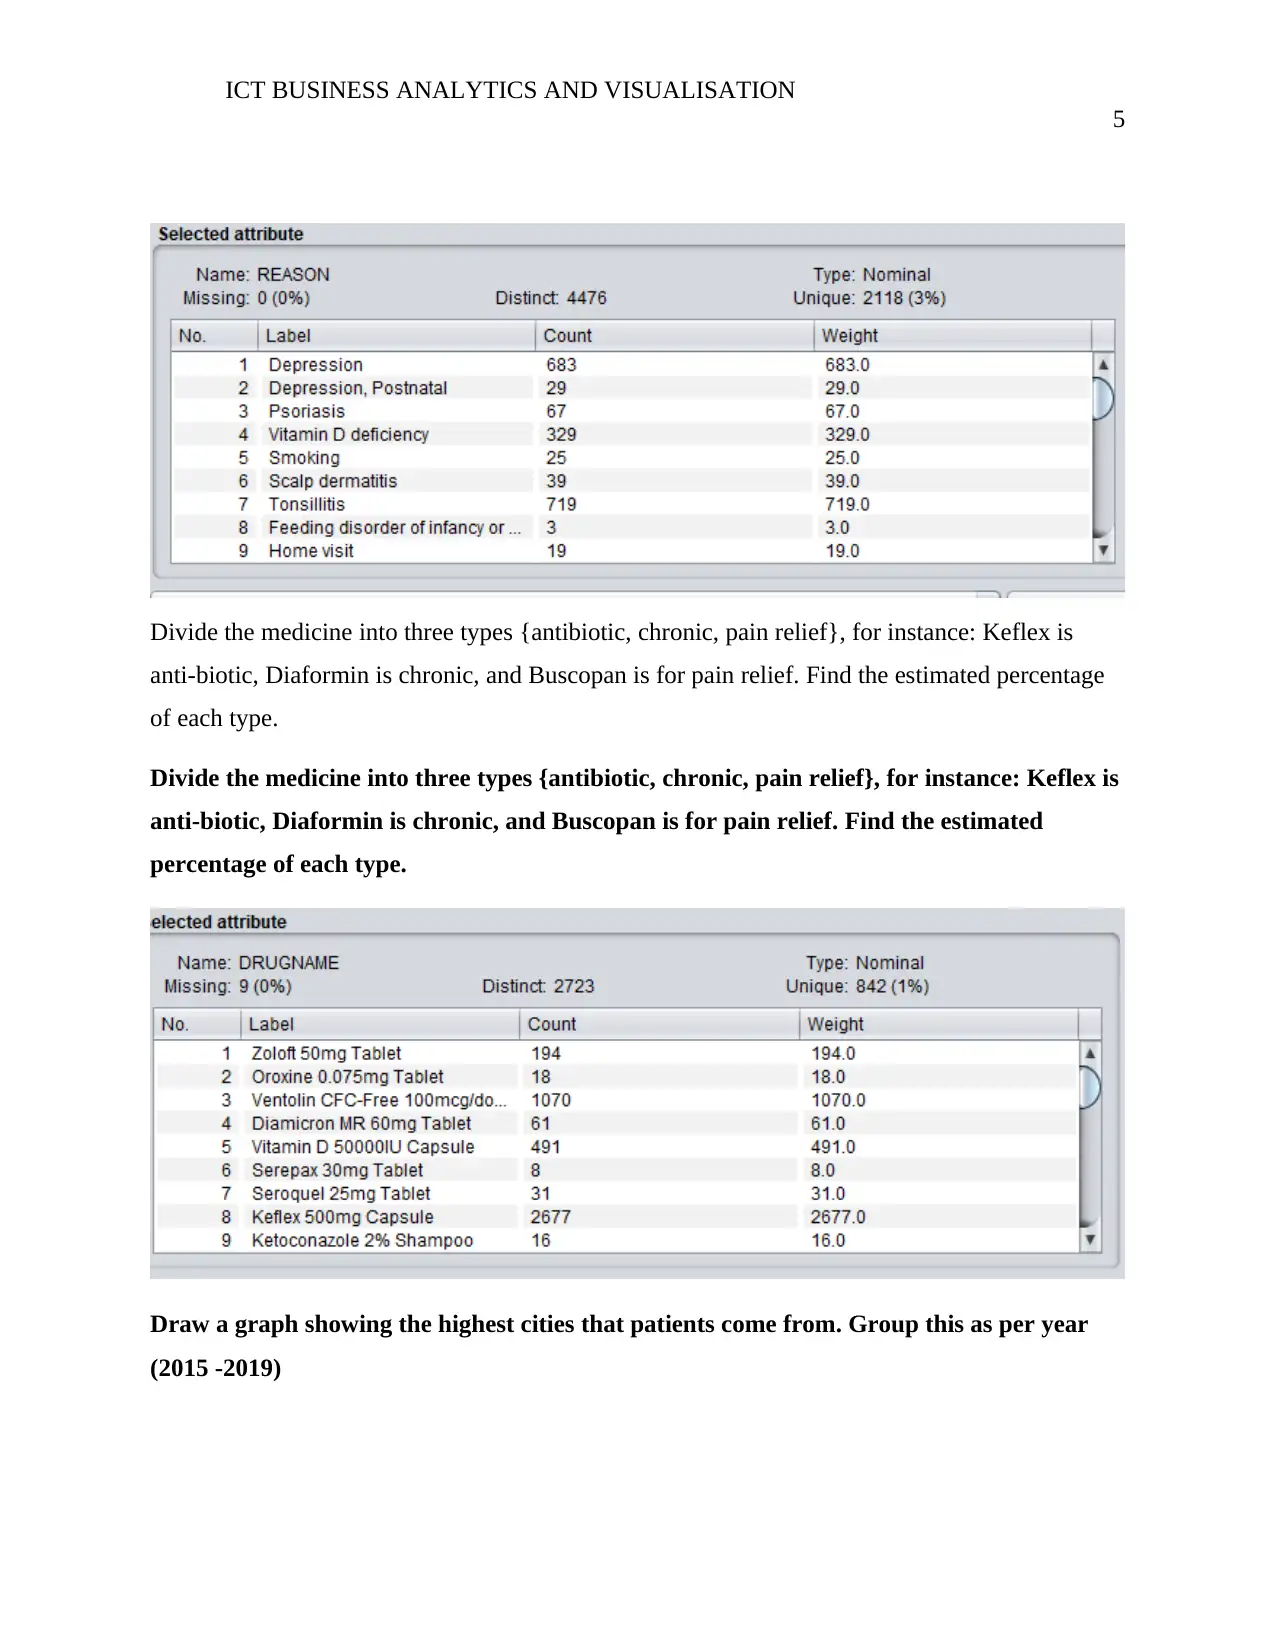
The ten (10) highest reasons were: Depression (683), Vitamin D deficiency (329), Tonsillitis
(719), hyperlipidaemia (966), hypothyroidism (391), GORD (451), UTI (719), Lumbar disc
bulge (397), diabetes mellitus, Type 2 (1479) and Asthma (835). The figure below shows some
of the reasons for treatment in the clinic.
4
There were a total of 2723 distinct drugs in the clinic. The ten (10) highest drugs in terms of
numbers were: Keflex D 50000IU capsule (491), Ventolin CFC-Free 100mgcg (1070), voltaren
50 50mg Enteric (574), Keflex 250mg/5ML suspension (638), loratadine 10mg Tablets (423),
Duromine 30mg capsule (342), Vitamin B12 (369), Bisolvon Chesty forte 50mg/5m (644),
zaldior 37.5mg;325mg Tablets (376), and Vitamin D 7000IU capsule (333). The figure below
shows some of the drugs.
The ten (10) highest reasons were: Depression (683), Vitamin D deficiency (329), Tonsillitis
(719), hyperlipidaemia (966), hypothyroidism (391), GORD (451), UTI (719), Lumbar disc
bulge (397), diabetes mellitus, Type 2 (1479) and Asthma (835). The figure below shows some
of the reasons for treatment in the clinic.
Paraphrase This Document
Need a fresh take? Get an instant paraphrase of this document with our AI Paraphraser
ICT BUSINESS ANALYTICS AND VISUALISATION
5
Divide the medicine into three types {antibiotic, chronic, pain relief}, for instance: Keflex is
anti-biotic, Diaformin is chronic, and Buscopan is for pain relief. Find the estimated percentage
of each type.
Divide the medicine into three types {antibiotic, chronic, pain relief}, for instance: Keflex is
anti-biotic, Diaformin is chronic, and Buscopan is for pain relief. Find the estimated
percentage of each type.
Draw a graph showing the highest cities that patients come from. Group this as per year
(2015 -2019)
ICT BUSINESS ANALYTICS AND VISUALISATION
6
Find the percentage of patients who use private health insurances
The number of patients who use private health insurances was 3797, representing 5.32% of the
total number of patients.
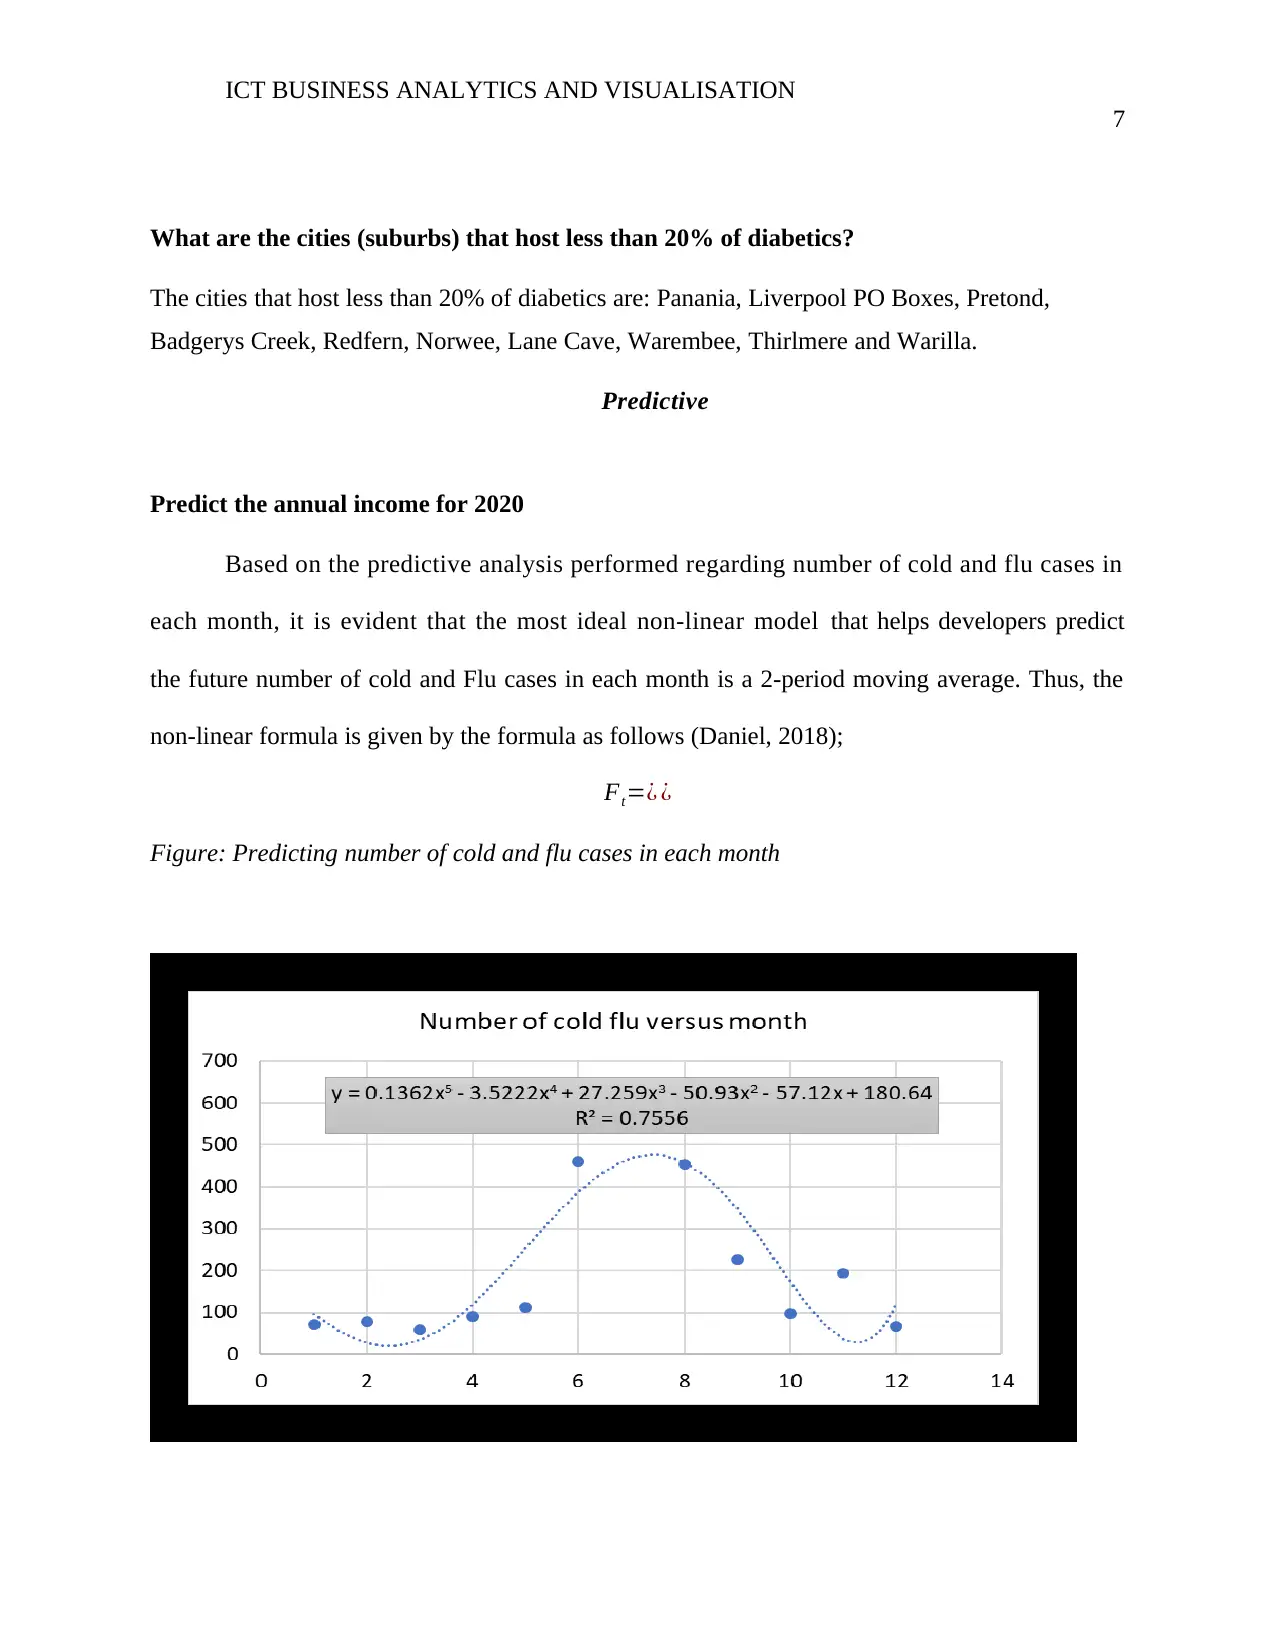
Find the average of all diabetic patients (type 1 & 2). Draw the binomial distribution
showing the number of diabetics in every city.
The average percentage of the overall diabetic patients is 2.07%. The figure below shows the
binomial distribution of the diabetics in every city.
6
Find the percentage of patients who use private health insurances
The number of patients who use private health insurances was 3797, representing 5.32% of the
total number of patients.
Find the average of all diabetic patients (type 1 & 2). Draw the binomial distribution
showing the number of diabetics in every city.
The average percentage of the overall diabetic patients is 2.07%. The figure below shows the
binomial distribution of the diabetics in every city.
⊘ This is a preview!⊘
Do you want full access?
Subscribe today to unlock all pages.
Trusted by 1+ million students worldwide
ICT BUSINESS ANALYTICS AND VISUALISATION
7
What are the cities (suburbs) that host less than 20% of diabetics?
The cities that host less than 20% of diabetics are: Panania, Liverpool PO Boxes, Pretond,
Badgerys Creek, Redfern, Norwee, Lane Cave, Warembee, Thirlmere and Warilla.
Predictive
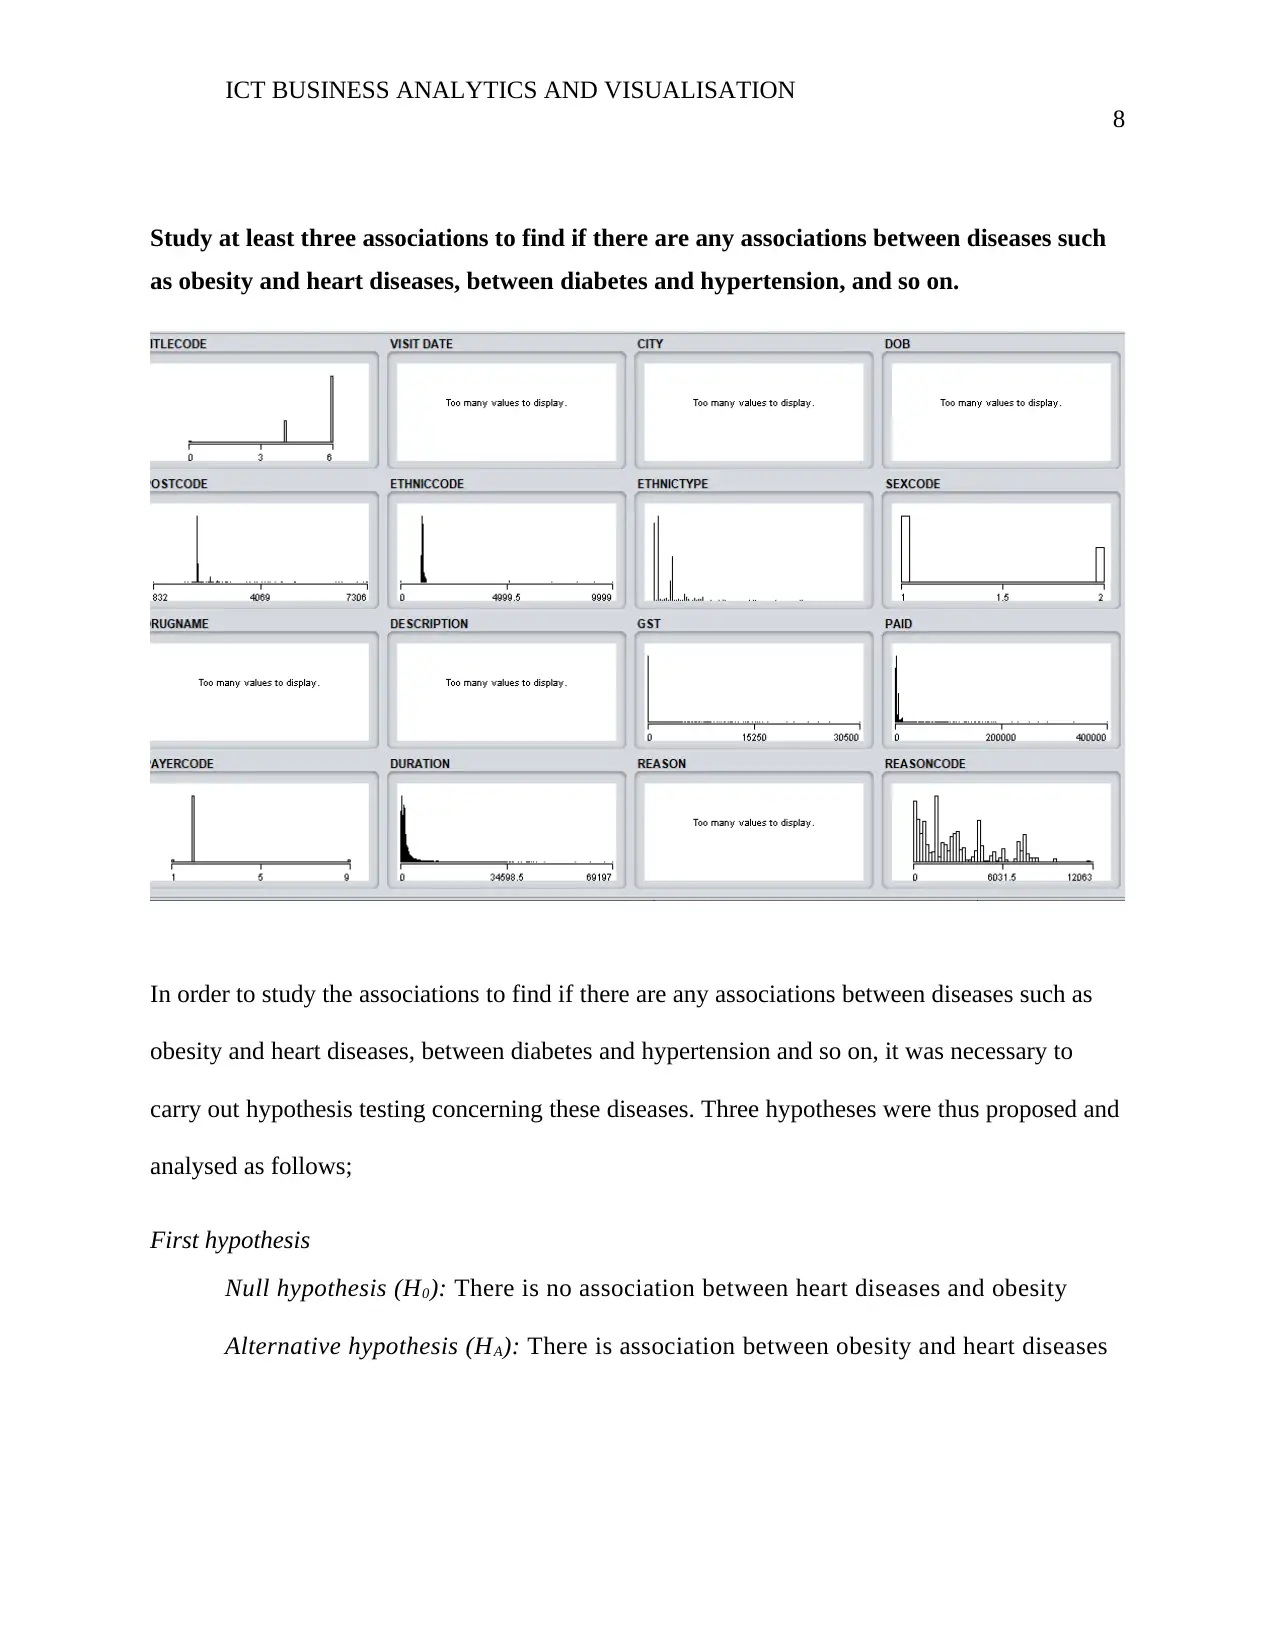
Predict the annual income for 2020
Based on the predictive analysis performed regarding number of cold and flu cases in
each month, it is evident that the most ideal non-linear model that helps developers predict
the future number of cold and Flu cases in each month is a 2-period moving average. Thus, the
non-linear formula is given by the formula as follows (Daniel, 2018);
Ft=¿ ¿
Figure: Predicting number of cold and flu cases in each month
7
What are the cities (suburbs) that host less than 20% of diabetics?
The cities that host less than 20% of diabetics are: Panania, Liverpool PO Boxes, Pretond,
Badgerys Creek, Redfern, Norwee, Lane Cave, Warembee, Thirlmere and Warilla.
Predictive
Predict the annual income for 2020
Based on the predictive analysis performed regarding number of cold and flu cases in
each month, it is evident that the most ideal non-linear model that helps developers predict
the future number of cold and Flu cases in each month is a 2-period moving average. Thus, the
non-linear formula is given by the formula as follows (Daniel, 2018);
Ft=¿ ¿
Figure: Predicting number of cold and flu cases in each month
Paraphrase This Document
Need a fresh take? Get an instant paraphrase of this document with our AI Paraphraser
ICT BUSINESS ANALYTICS AND VISUALISATION
8
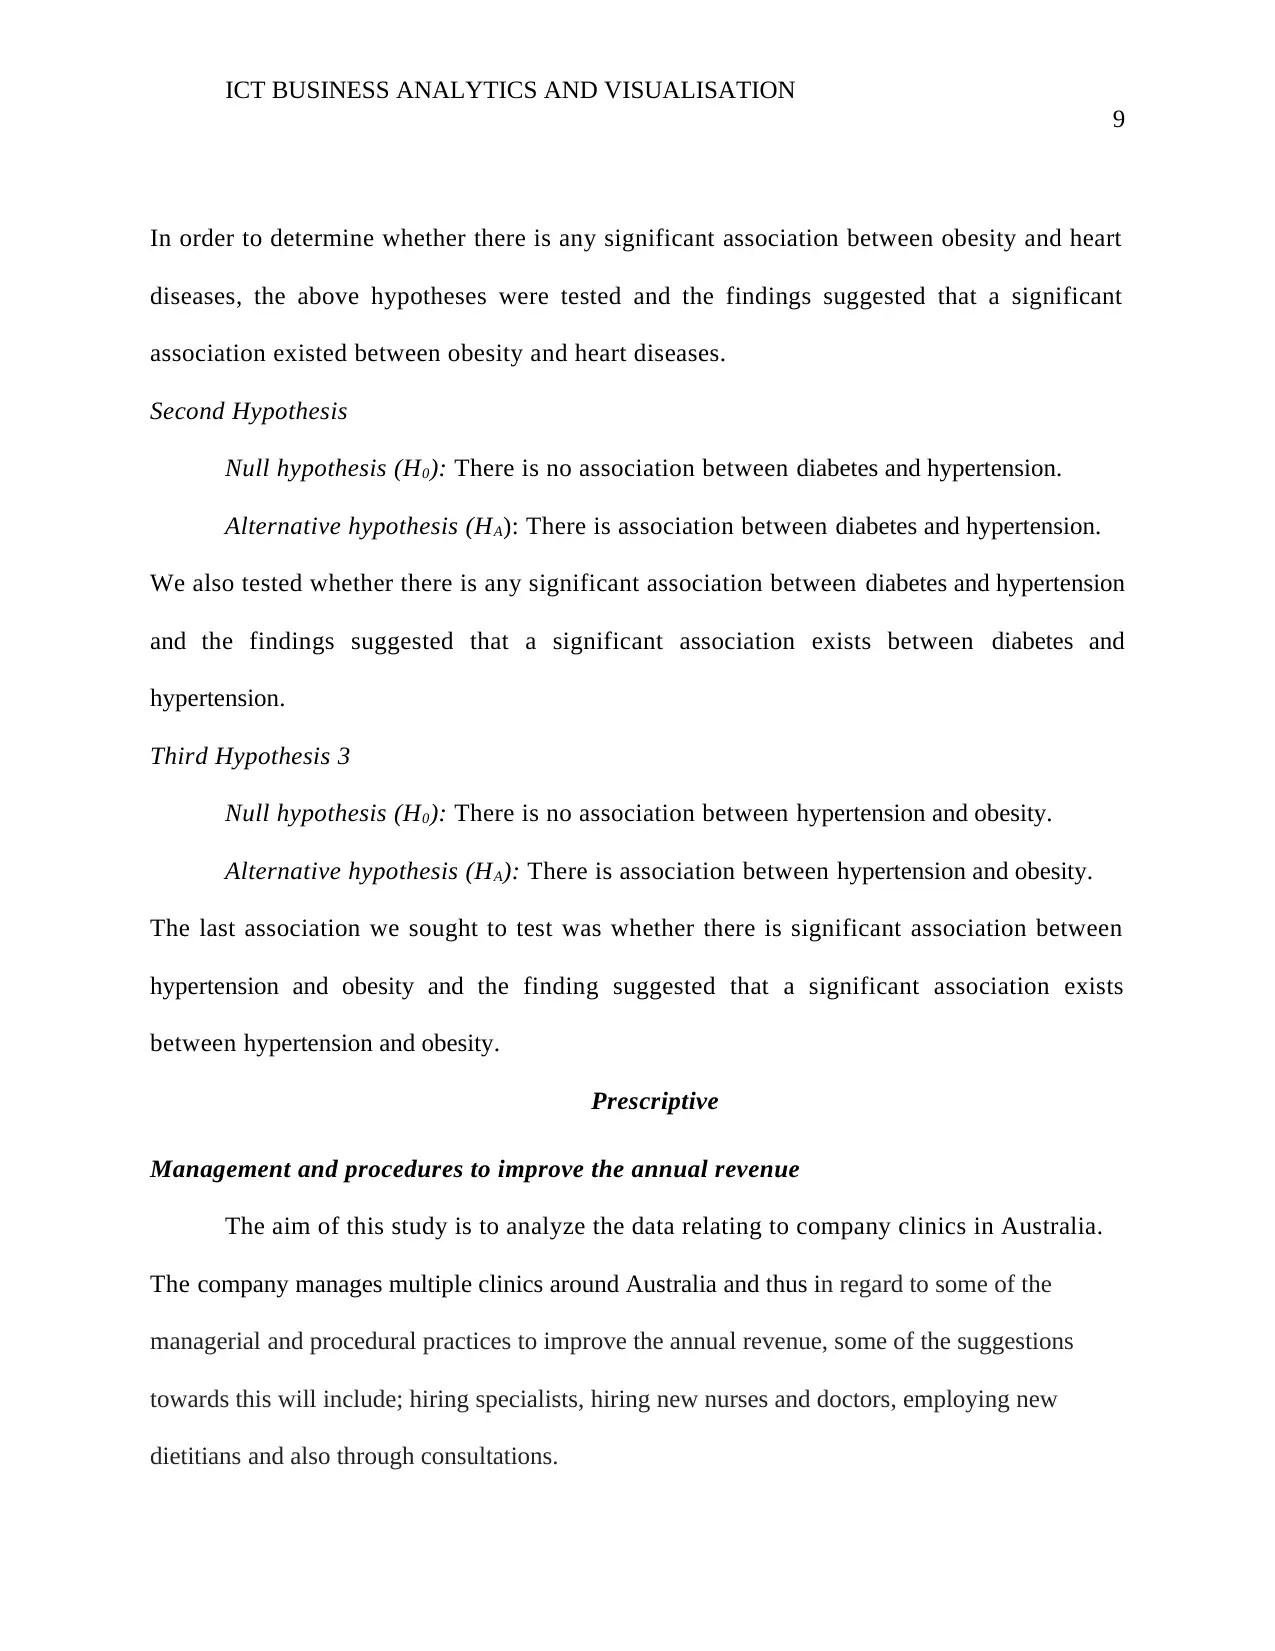
Study at least three associations to find if there are any associations between diseases such
as obesity and heart diseases, between diabetes and hypertension, and so on.
In order to study the associations to find if there are any associations between diseases such as
obesity and heart diseases, between diabetes and hypertension and so on, it was necessary to
carry out hypothesis testing concerning these diseases. Three hypotheses were thus proposed and
analysed as follows;
First hypothesis
Null hypothesis (H0): There is no association between heart diseases and obesity
Alternative hypothesis (HA): There is association between obesity and heart diseases
8
Study at least three associations to find if there are any associations between diseases such
as obesity and heart diseases, between diabetes and hypertension, and so on.
In order to study the associations to find if there are any associations between diseases such as
obesity and heart diseases, between diabetes and hypertension and so on, it was necessary to
carry out hypothesis testing concerning these diseases. Three hypotheses were thus proposed and
analysed as follows;
First hypothesis
Null hypothesis (H0): There is no association between heart diseases and obesity
Alternative hypothesis (HA): There is association between obesity and heart diseases
ICT BUSINESS ANALYTICS AND VISUALISATION
9
In order to determine whether there is any significant association between obesity and heart
diseases, the above hypotheses were tested and the findings suggested that a significant
association existed between obesity and heart diseases.
Second Hypothesis
Null hypothesis (H0): There is no association between diabetes and hypertension.
Alternative hypothesis (HA): There is association between diabetes and hypertension.
We also tested whether there is any significant association between diabetes and hypertension
and the findings suggested that a significant association exists between diabetes and
hypertension.
Third Hypothesis 3
Null hypothesis (H0): There is no association between hypertension and obesity.
Alternative hypothesis (HA): There is association between hypertension and obesity.
The last association we sought to test was whether there is significant association between
hypertension and obesity and the finding suggested that a significant association exists
between hypertension and obesity.
Prescriptive
Management and procedures to improve the annual revenue
The aim of this study is to analyze the data relating to company clinics in Australia.
The company manages multiple clinics around Australia and thus in regard to some of the
managerial and procedural practices to improve the annual revenue, some of the suggestions
towards this will include; hiring specialists, hiring new nurses and doctors, employing new
dietitians and also through consultations.
⊘ This is a preview!⊘
Do you want full access?
Subscribe today to unlock all pages.
Trusted by 1+ million students worldwide
ICT BUSINESS ANALYTICS AND VISUALISATION
10
Also, hiring staff for instance, staff ethnic background, language and other gender would
promote better medical services. Based on the procedural part, increasing employees work hours
from part time to full and establishing small pharmacy inside the clinics or opening another
clinic branch in another area would be of great value. Since majority of the patients came from
the city of Hinchinbrook and the second city with the highest number of patients was the
Hoxton Park while Middleton Grange city was the third city with the highest number of
patients. This shows that the management needs to consider opening branches in these cities
since the number of patients recorded from these cities are so high that it would be good to
have branches in these cities (Elius, 2017).
Most patients seen in the clinics were of the Australian origin, followed by the Iraqi
who were slightly more than a quarter of the population. Based on this, it would be
advisable that the management considers hiring nurses who are of Australian origin to cope
with the big numbers of the Australian patients that is seen in the clinics.
Divide patients into three different categories {regular, irregular, rare}. Suggest a
minimum number of visits per month for each category. Find the possible attributes that
may increase the patient’s regularity, such as ethnicity, age, gender and city.
Paraphrase This Document
Need a fresh take? Get an instant paraphrase of this document with our AI Paraphraser
ICT BUSINESS ANALYTICS AND VISUALISATION
11
In regard to the possible attributes, the analysis of the attributes related to regularity to the
hospital was carried out. But first, the regularity was defined as follows;
Regular patients; this was in relation to those patients who attended more than
seven visits
Irregular patients; this was in relation to those patients who attended between
three and seven visits
Rare patients; this was in relation to those patients who attended between zero
and two visits.
Based on the analysis of the relationship between regularity and gender; regularity and
ethnicity; regularity and age, the results showed that there was a significant association
between gender and patient regularity. Female patients were more regular as compared to
the male patients. This implies that regularity increase by being a female patient (Waller,
2013). We also established that some ethnicity were more regular than others. This means
that regularity increases based on some ethnicity.
If the average visit for {Regular} visitors was ψ / year, what is the probability of having?
(ψ – 10)/year visits.
Ψ=24623
Probability= (24623-10)/71521
=0.3394
References
ICT BUSINESS ANALYTICS AND VISUALISATION
12
Chao, N. & Fengqi, Y., 2018. Data-driven decision making under uncertainty integrating robust
optimization with principal component analysis and kernel smoothing methods. Journal of
Computer and Chemical Engineering, 112(6), pp. 190-210.
Erik, B. & Kristina, M., 2016. The Rapid Adoption of Data-Driven Decision-Making. Journal of
American Economic Review, 106(5), pp. 133-139.
Eugenijus, K., 2018. On data-driven decision-making for quality education. Journal of
Computers in Human Behavior, 5(04), pp. 234-245.
Kristina , M. & Erik, B., 2016. Data in Action: Data-Driven Decision Making in U.S.
Manufacturing. US Census Bureau Centre for Economic Studies Paper, 16(06), pp. 16-26.
Mathew, T. H., Jana, B.-G. & Hyoung, J. P., 2017. Data driven decision-making in the era of
accountability: Fostering faculty data cultures for learning. The Review of Higher Education,
40(3), pp. 391-426.
Rachel, R., Rachael, K. & Yukiko, M., 2019. When Data-Driven Decision Making Becomes
Data-Driven Test Taking: A Case Study of a Midwestern High School. Journal of Educational
Policy, 43(1), pp. 20-34.
⊘ This is a preview!⊘
Do you want full access?
Subscribe today to unlock all pages.
Trusted by 1+ million students worldwide
1 out of 12

Your All-in-One AI-Powered Toolkit for Academic Success.
+13062052269
info@desklib.com
Available 24*7 on WhatsApp / Email
![[object Object]](/_next/static/media/star-bottom.7253800d.svg)
Unlock your academic potential
Copyright © 2020–2026 A2Z Services. All Rights Reserved. Developed and managed by ZUCOL.