Data Analytics Project: Analyzing Crime Data to Justify Police Funding
VerifiedAdded on 2023/04/25
|12
|1290
|388
Project
AI Summary
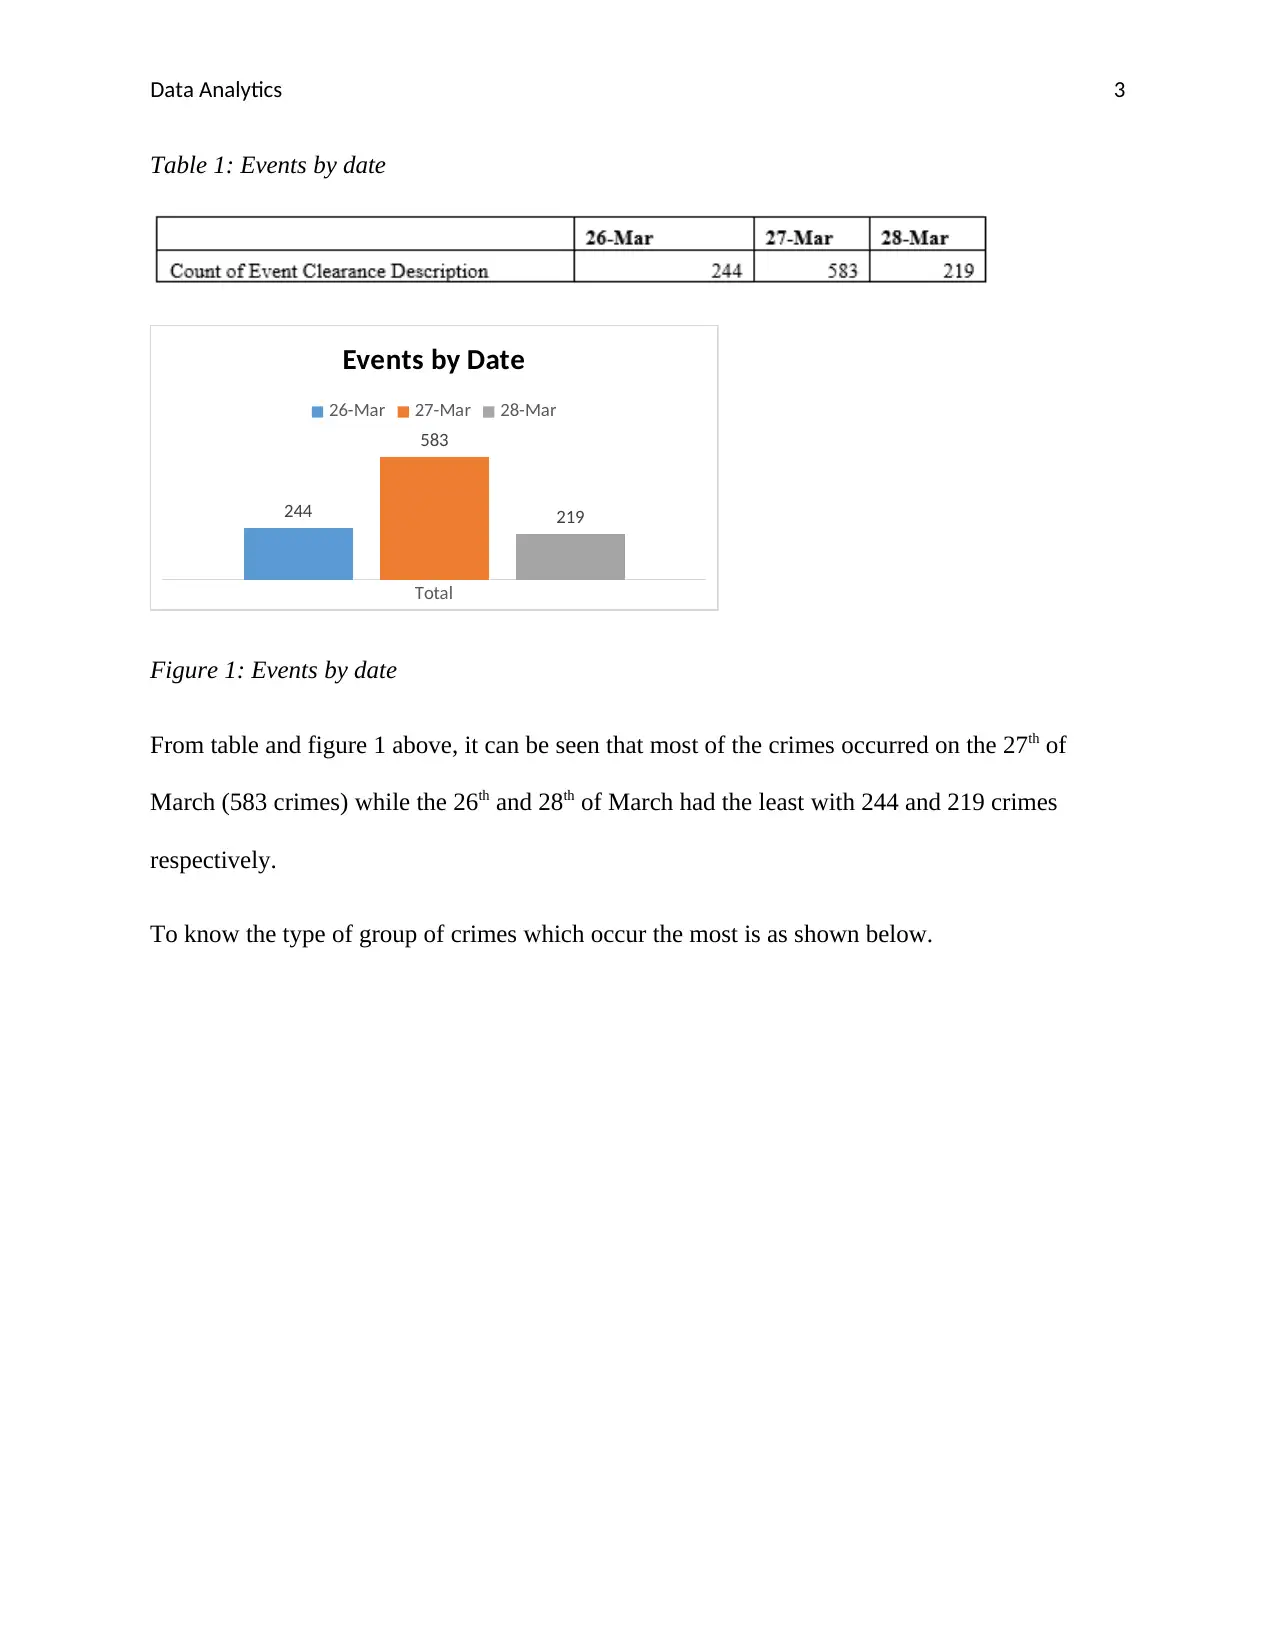
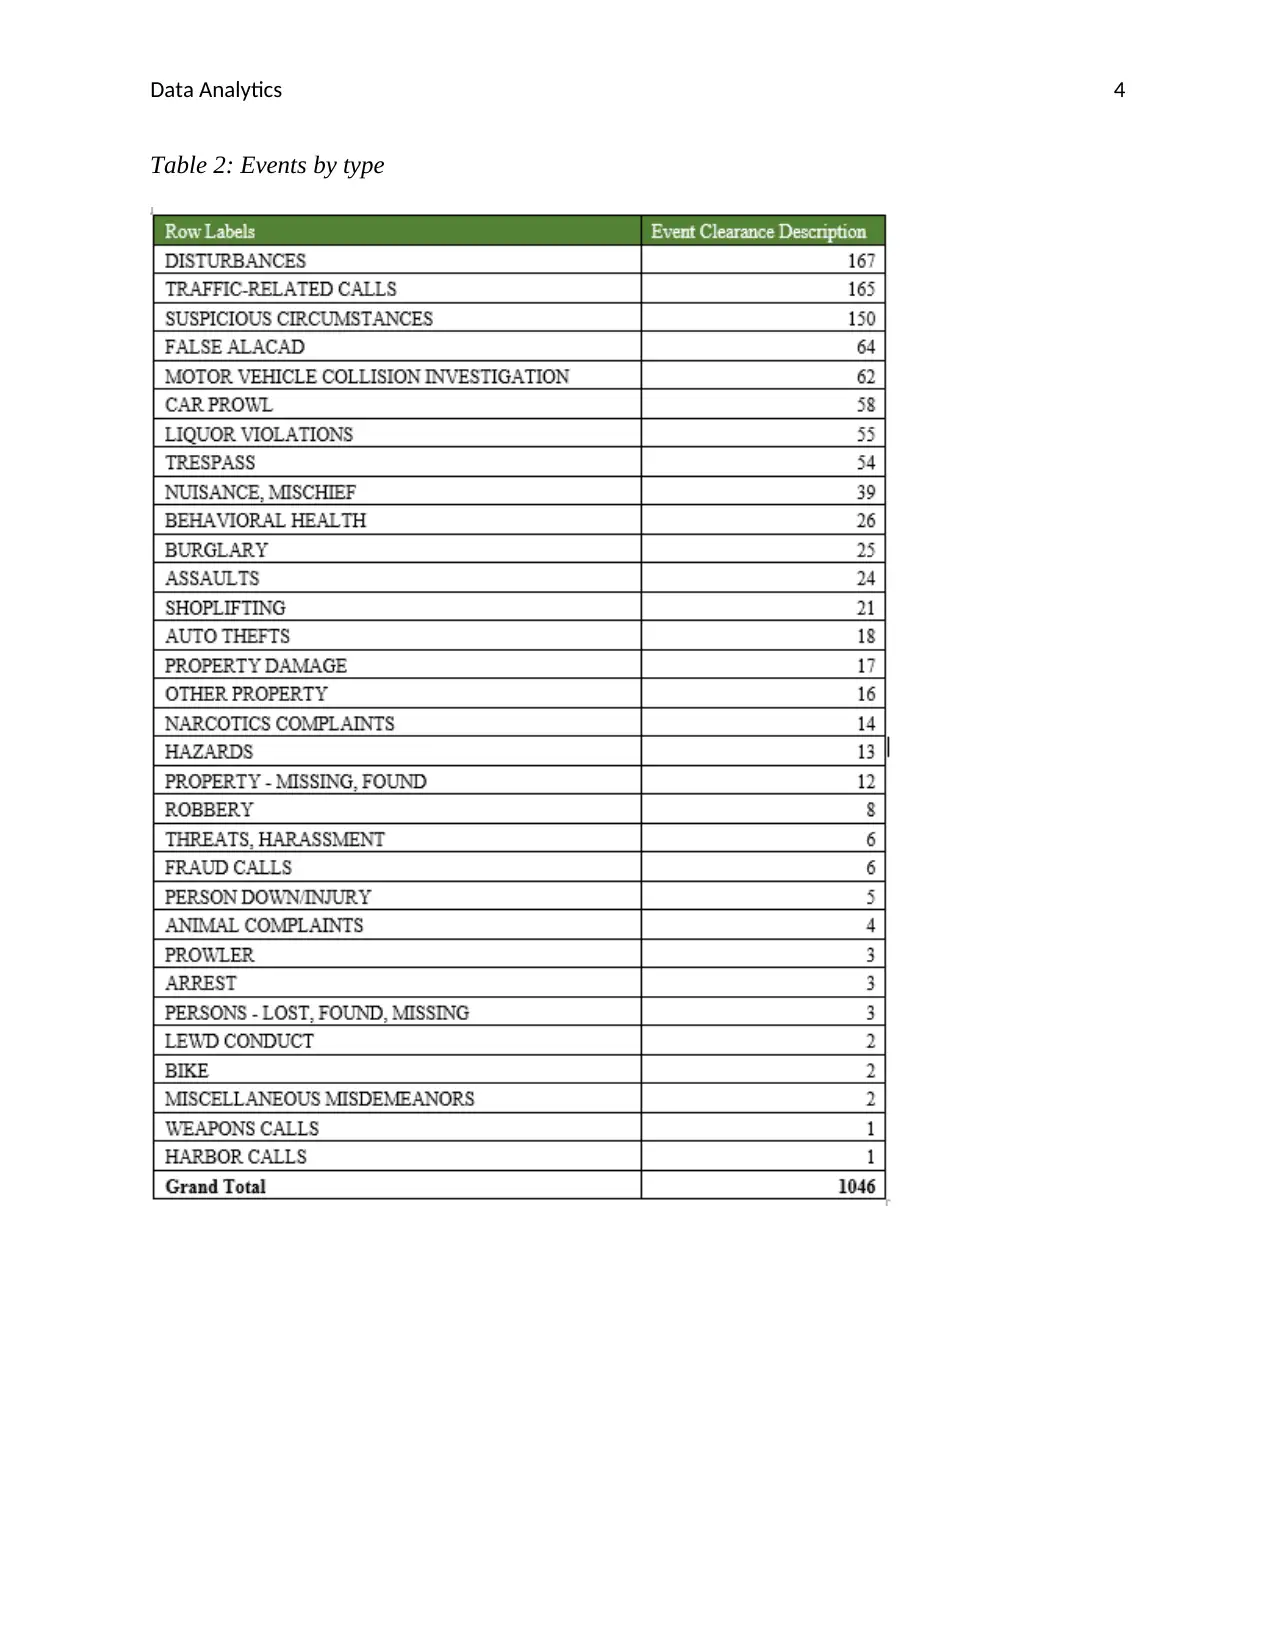
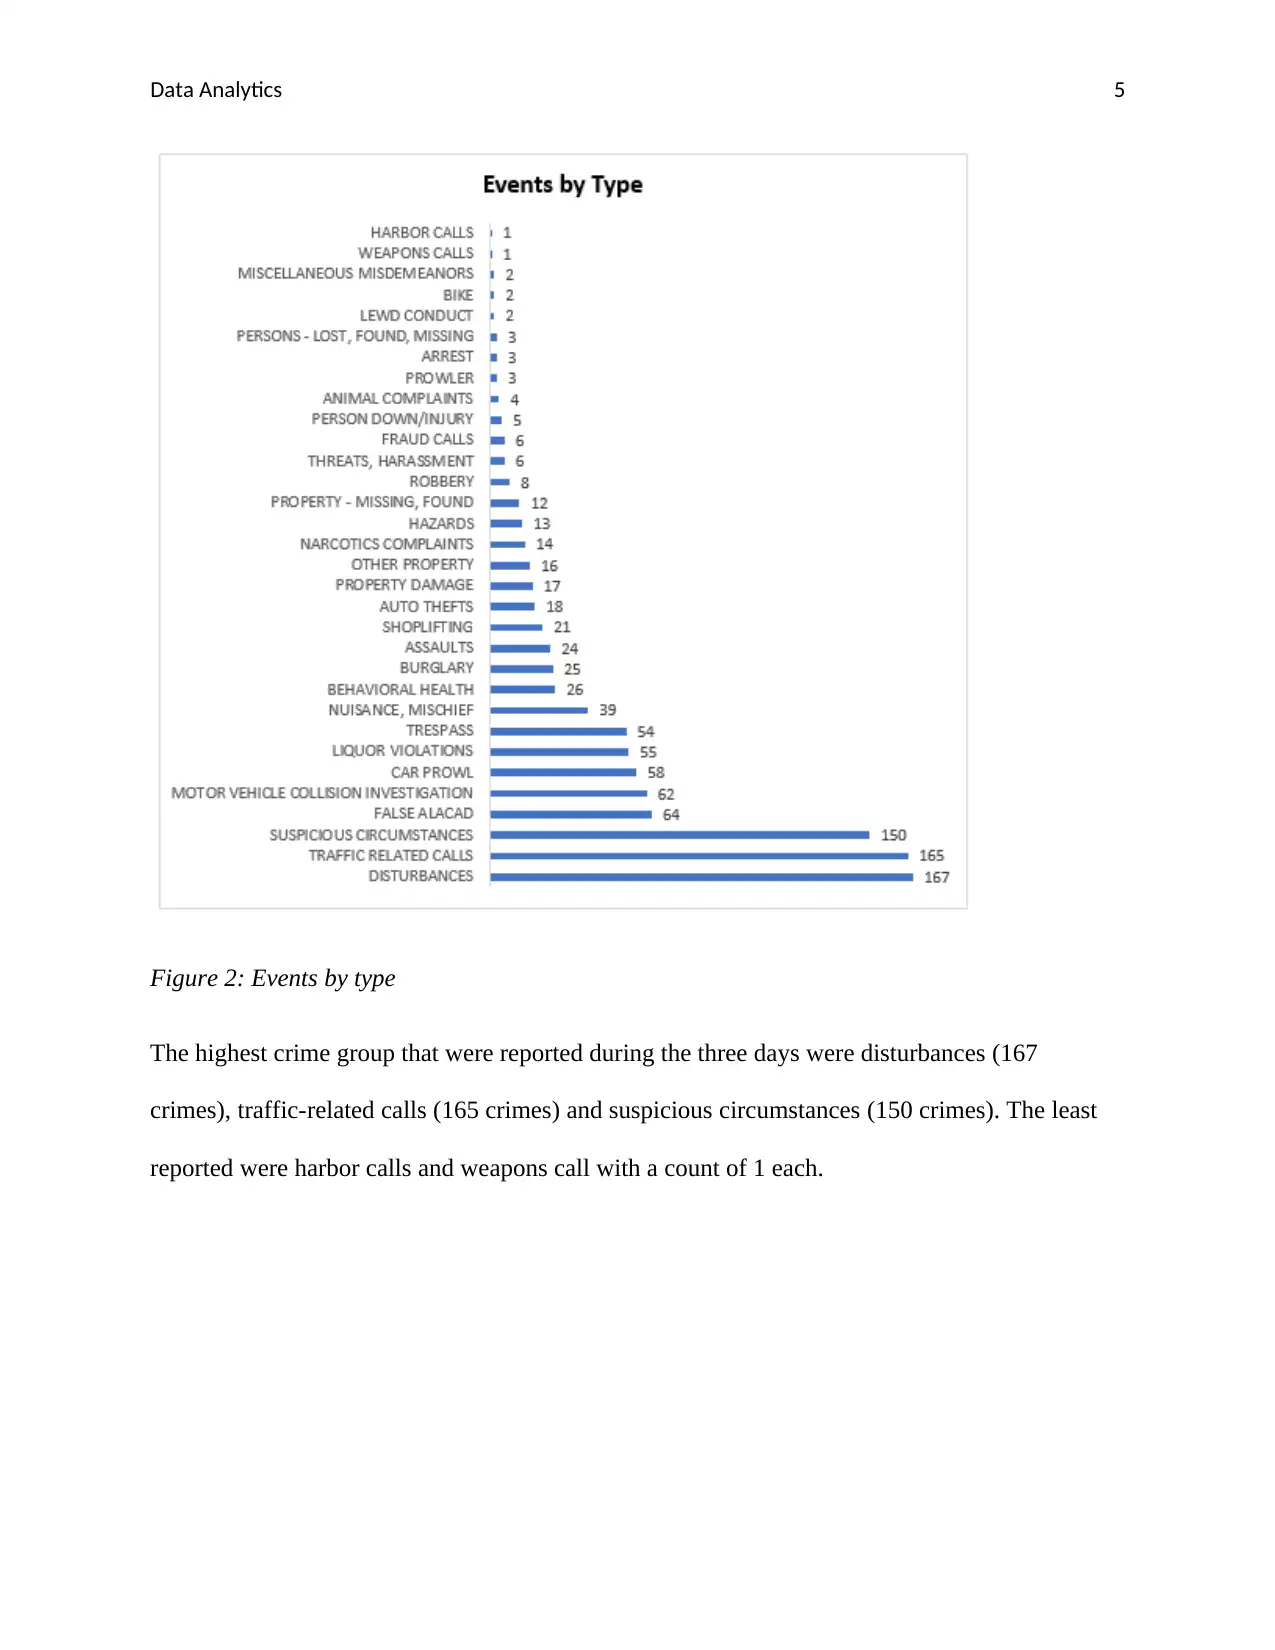
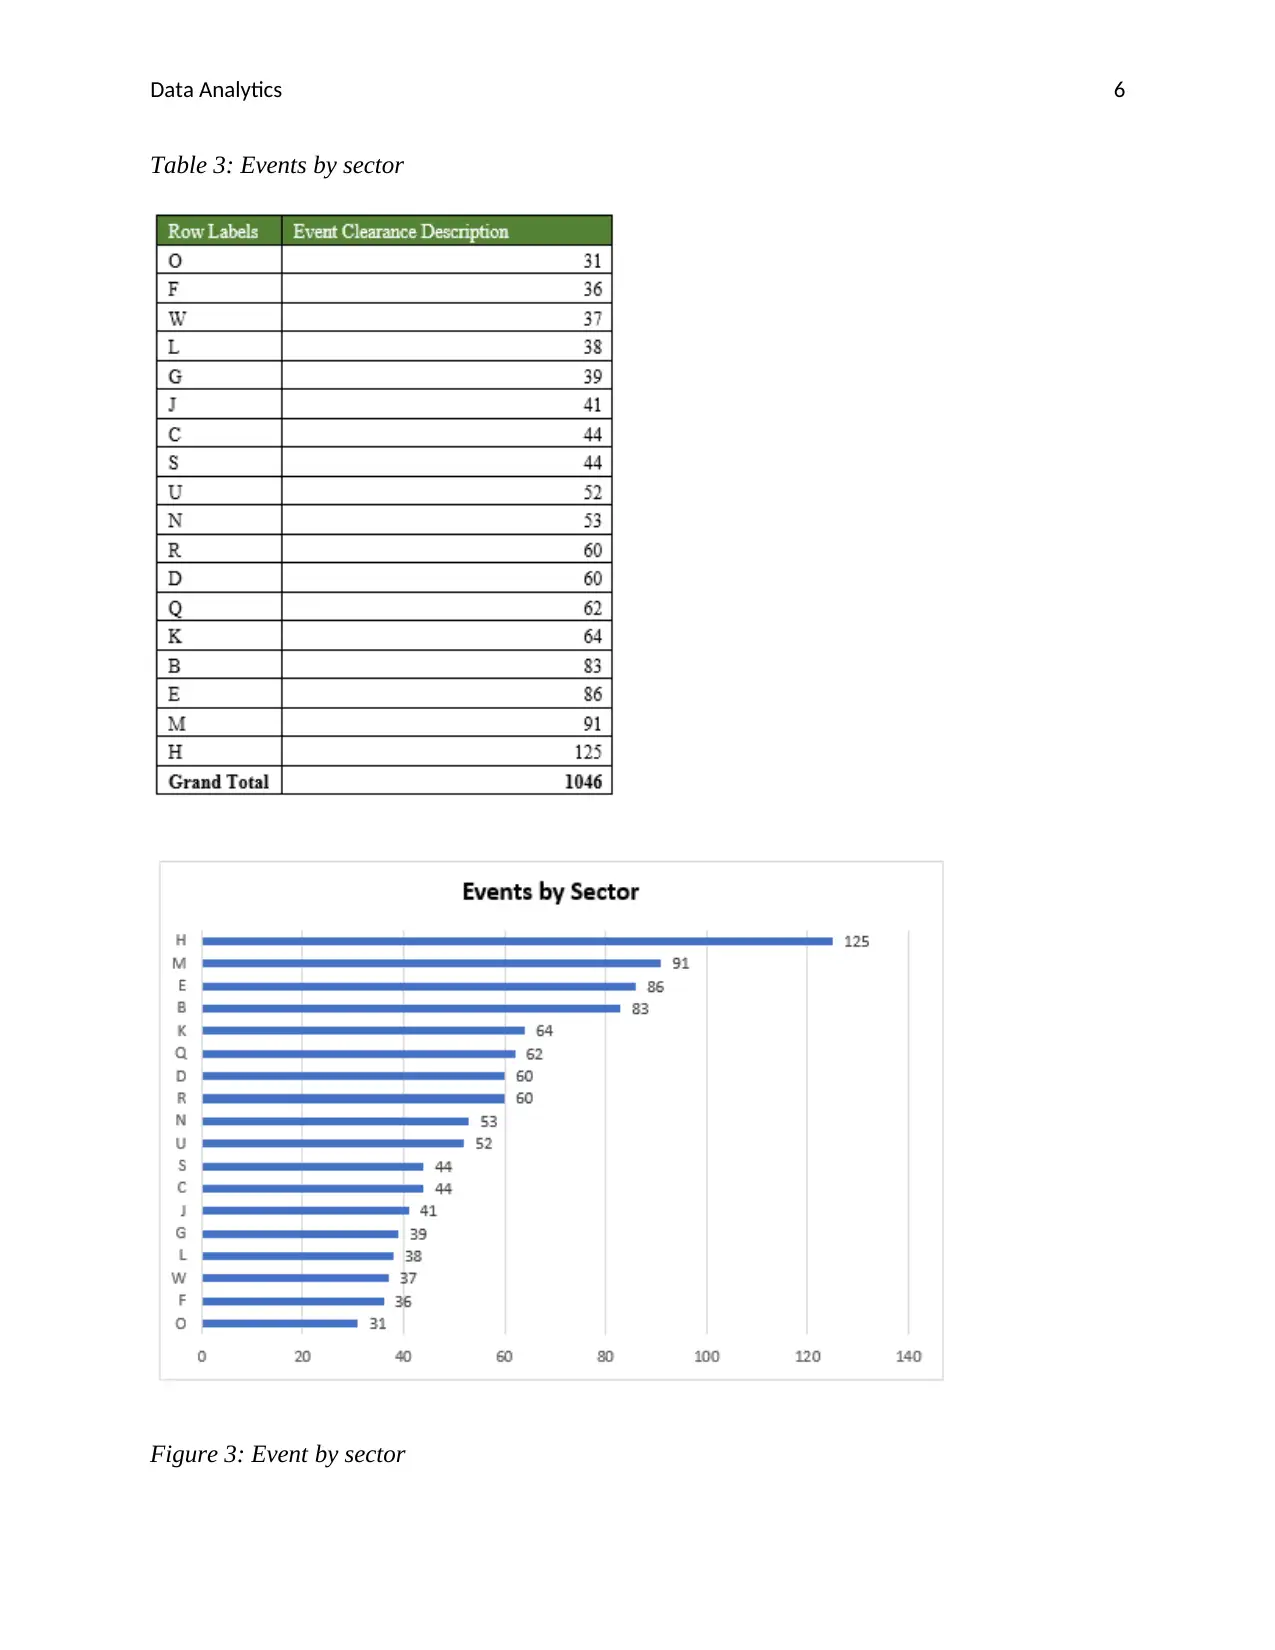
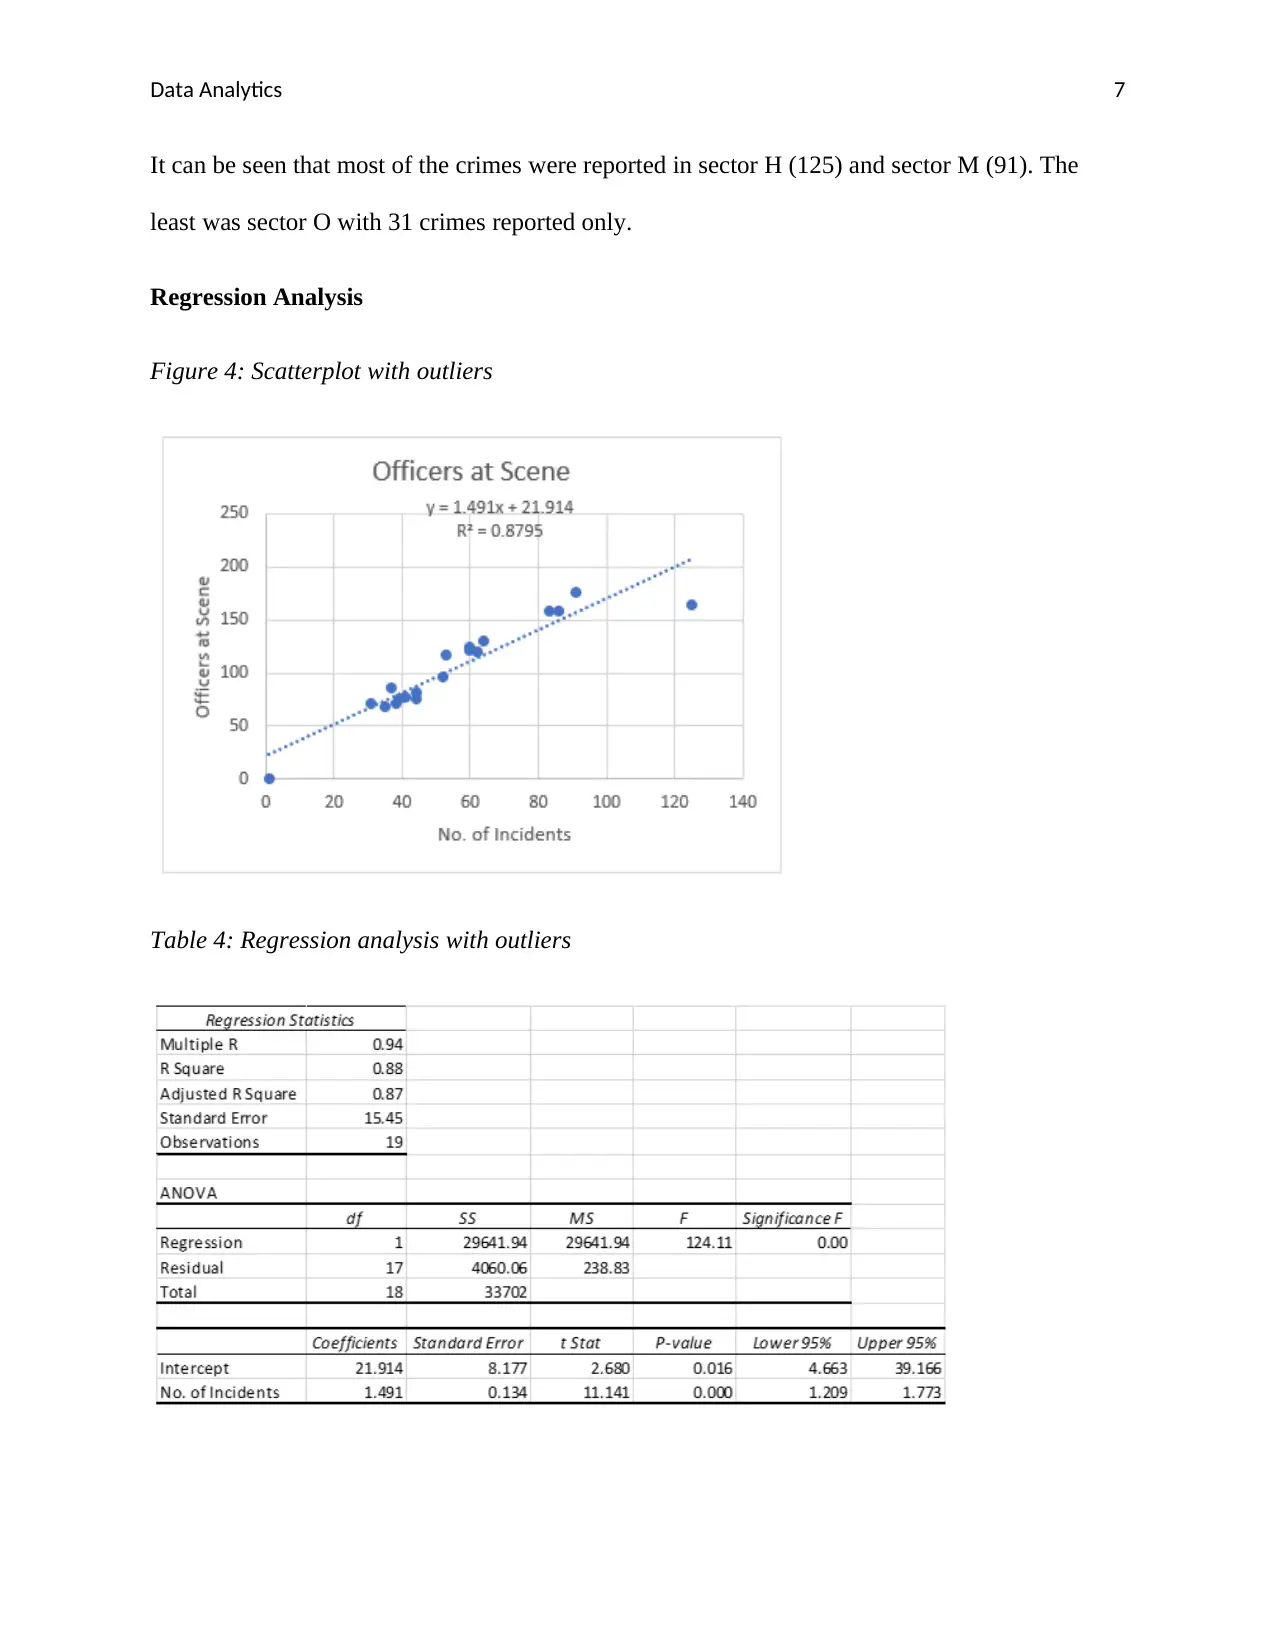
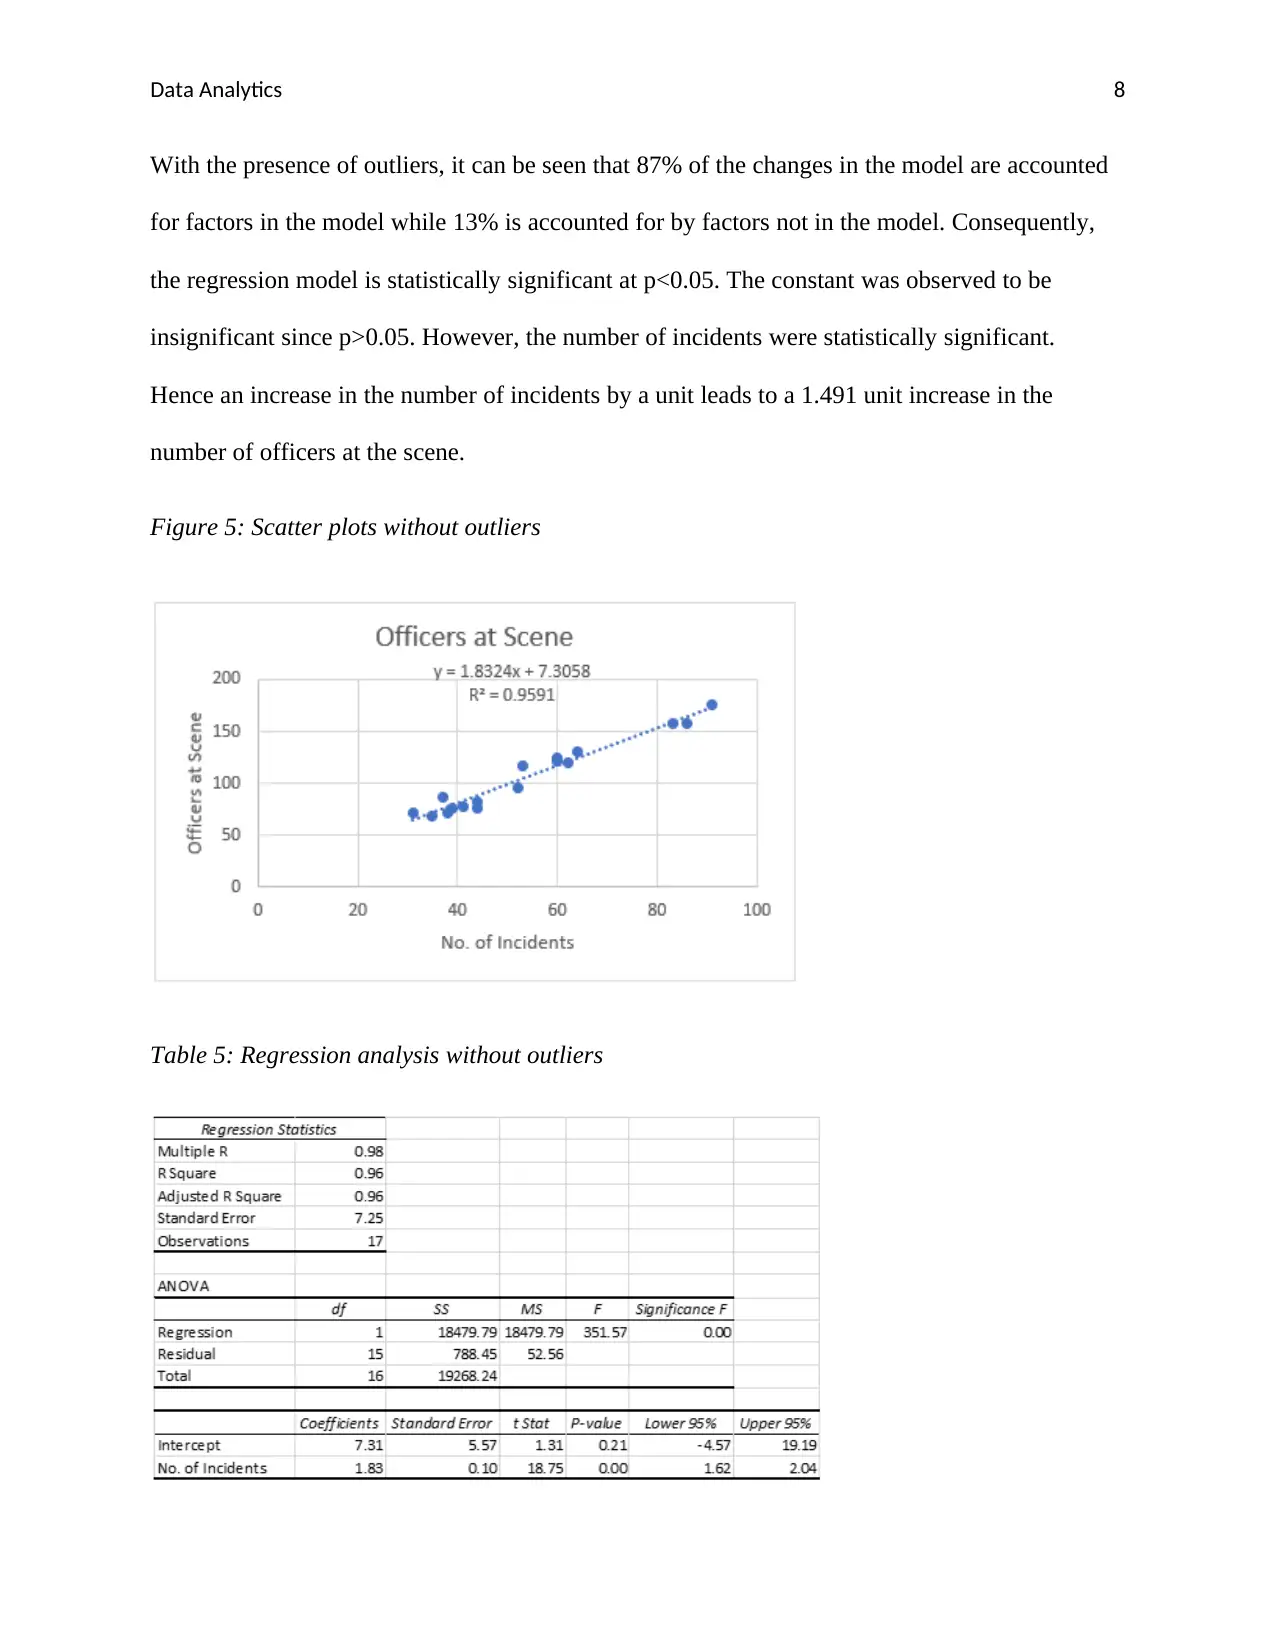
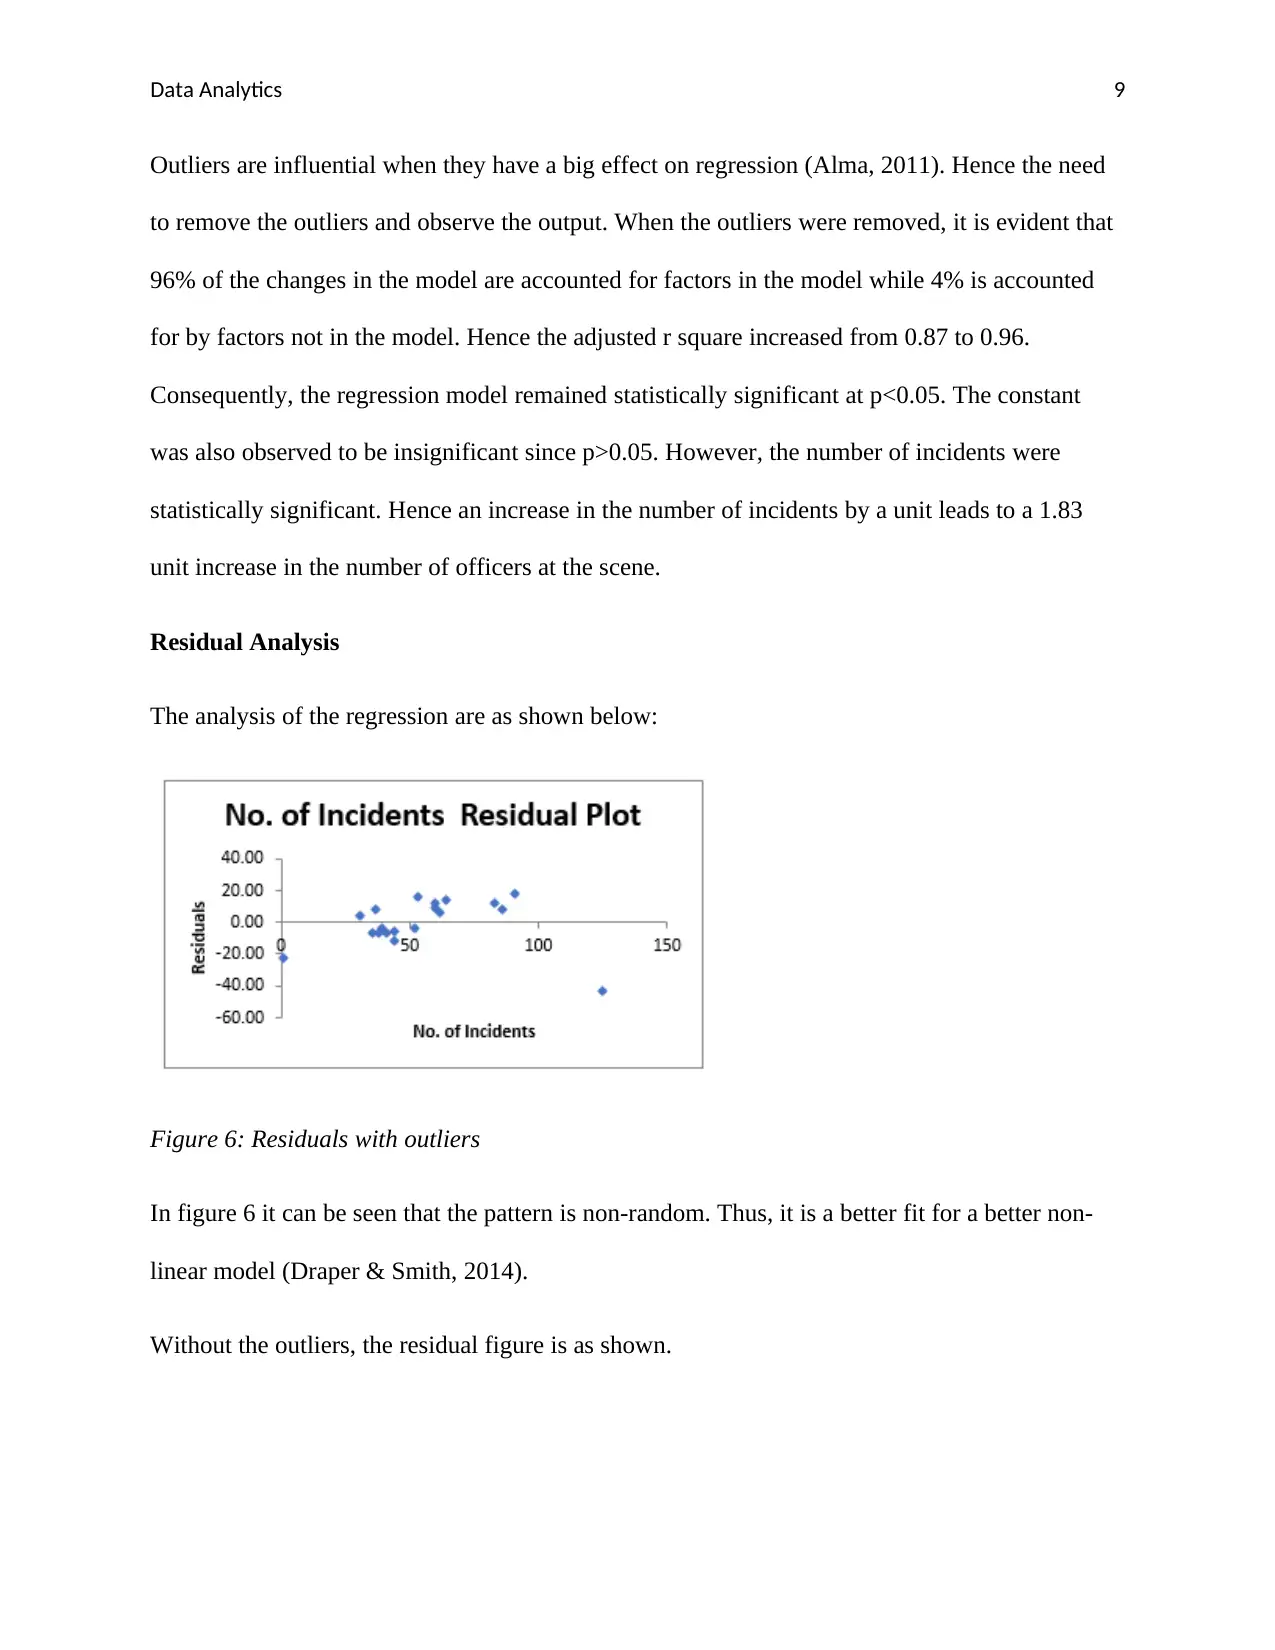
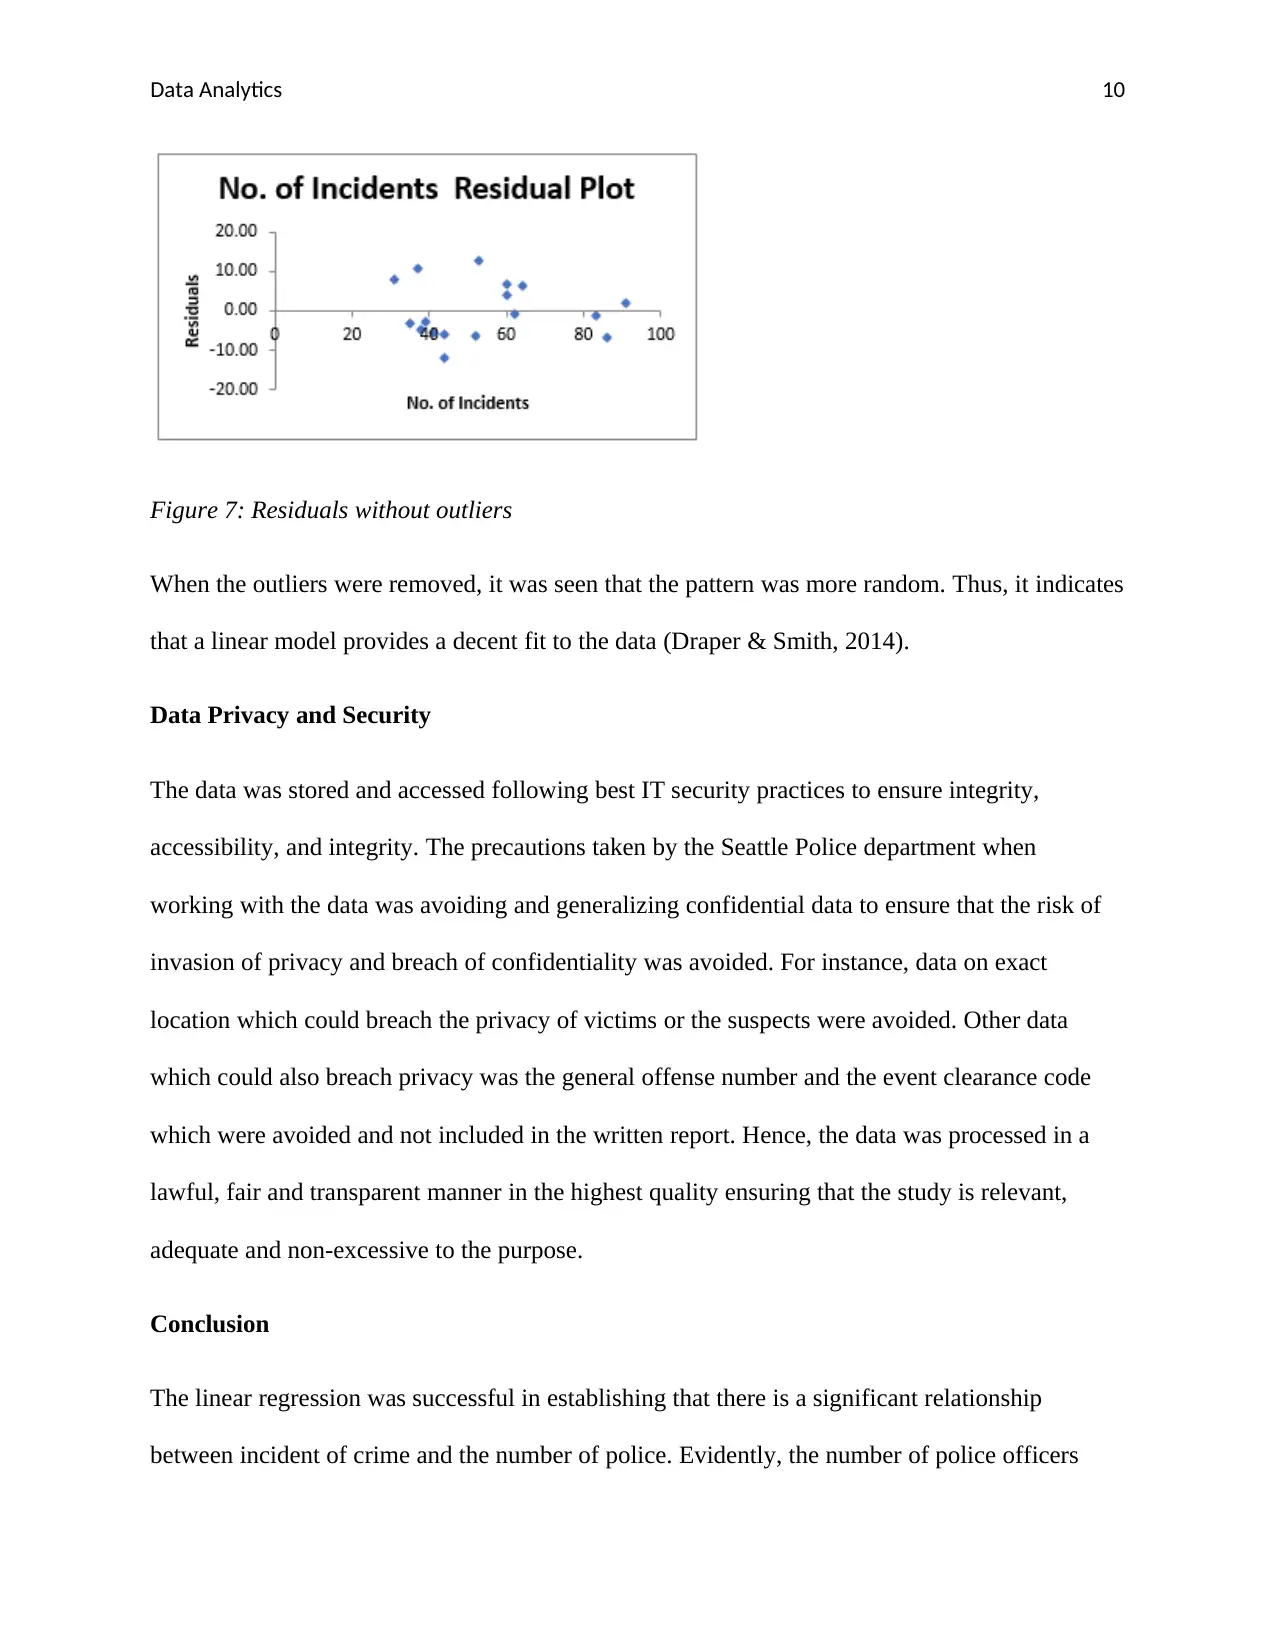
This project analyzes crime incidents to determine whether a police department needs funding. It examines crime incidents by sector, time, and type, using linear regression to analyze the association between crime incidents and the number of officers at the scene. The data was prepared by removing errors, duplicates, and unnecessary columns, followed by imputation of missing values. The analysis reveals that most crimes occurred on March 27th, with disturbances, traffic-related calls, and suspicious circumstances being the most reported crime groups. Regression analysis, conducted with and without outliers, demonstrates a statistically significant relationship between the number of incidents and the number of officers required. Residual analysis further validates the linear model's fit. The study concludes that the police department is understaffed relative to the number of incidents and justifies the need for increased funding to meet the required officer-to-incident ratio, emphasizing data privacy and security measures throughout the process. Desklib provides access to this and other solved assignments for students.
1 out of 12
Your All-in-One AI-Powered Toolkit for Academic Success.
+13062052269
info@desklib.com
Available 24*7 on WhatsApp / Email
![[object Object]](/_next/static/media/star-bottom.7253800d.svg)
Copyright © 2020–2025 A2Z Services. All Rights Reserved. Developed and managed by ZUCOL.