Engineering Report: Analyzing Car Component Impact on Miles Per Gallon
VerifiedAdded on 2022/09/09
|14
|2777
|15
Report
AI Summary
This engineering report investigates the impact of various car components on miles per gallon (MPG). The study utilizes a dataset from the StatLib library, analyzing 392 observations with variables including MPG, horsepower, weight, and other factors. The report begins by defining and collecting data, followed by exploratory data analysis including descriptive statistics, frequency tables, histograms, and correlation analysis. A research question is formulated to determine the relationship between MPG and car components, leading to the development of several hypotheses. Data analysis employs regression analysis to assess the influence of continuous variables and ANOVA to examine the impact of discrete variables (number of cylinders, model year, and origin). The findings reveal statistically significant relationships between MPG and horsepower, weight, number of cylinders, model year, and origin. The study concludes that automakers can optimize car components like horsepower and weight to improve fuel efficiency. The report also suggests that future research could benefit from larger datasets and more recent data.
RUNNING HEADER: IMPACT OF CAR COMPONENTS ON MILES PER GALLON 1
Impact of car components on miles per gallon
Student’s name:
Student’s ID:
Institution:
Impact of car components on miles per gallon
Student’s name:
Student’s ID:
Institution:
Paraphrase This Document
Need a fresh take? Get an instant paraphrase of this document with our AI Paraphraser
Impact of car components on miles per gallon 2
Introduction
Global warming has been on the rise over the past decades as it threatens to unbalance the
intricate and fragile nature. Negative impacts include rising seas, high temperature, droughts,
and severe flooding among others (Crutzen et al., 2016). Thus, global warming not only
jeopardises our health but also our national security while threatening other basic human
needs. Immediate actions have been called upon by various stakeholders globally to tame the
baffling rise of global warming (Cook et al., 2016). Hence, there is a push for cleaner energy
and hybrid technologies. In the US, the major cause of global warming is vehicle emissions
which contribute nearly one-fifth of all emission in the country (Saad & Jones, 2016).
According to Sun et al., (2017), this represents around 24 pounds of carbon dioxide together
with other gases which cause global warming for every gas gallon. Currently, the United
States has almost 253 million trucks and cars on the road (Jezek et al., 2015). Transpiration in
the US produces close to thirty percent of all US global warming emissions compared to any
other sector.
A push for cleaner hybrid technologies and cleaner energy is assumed to make automakers
desire to optimise certain car components with an aim to maximise the travelled distance on a
single gallon of fuel (Meckling & Nahm, 2019). Not only is this concept attractive to
customers who are environmentally aware but also to other customers who may want to save
on gas. Hence, the following study aims to identify the connection between miles per gallon
and car components.
Defining and collecting data
The data chosen to be used in this study was obtained from StatLib library. Carnegie Mellon
University is the custodian of StatLib library. American Statistical Association Exposition
Impact of car components on miles per gallon 3
used the dataset in 1983. However, the current dataset is a slightly modified version of the
dataset that was provided in the StatLib library.
The dataset has 398 observation with 9 variables. According to Volkovs et al., (2014) data
cleaning is vital in ensuring that data is consistent, correct and useable. Hence, 6 rows were
omitted from the dataset. The 6 rows had blank values under the variable horsepower and
were thereby omitted in the analysis to ensure consistency, usability and correctness of the
results obtained. As a result, only 392 observations were used in the analysis. The dataset
entails the city-cycle fuel consumption in miles per gallon which was predicted using 3
multivalued discrete and 5 continuous variables. Every case in the dataset represents specific
attributes to a particular type of vehicle. The data can be classified as being observational
since it contains data which collects metrics and attributes with regards to each car with each
row representing a different model of car (Mooij et al., 2016). The observational nature of the
data suggests that the data cannot be used in establishing causation (Bareinboim & Pearl,
2016).
The response variable, mpg is a continuous variable while the explanatory variables were
either multi-valued discrete (origin, model year, and cylinders) and continuous variables
(weight, horsepower, displacement, and acceleration).
To conduct data analysis, the computer software chosen was Ms Excel. Ms Excel was chosen
since it can import data from other sources and that it has a lot of control giving the user an
entire gamut of options and offers better organization of the output (Nunes et al., 2015).
Exploratory Data Analysis
Exploratory data analysis involves performing initial investigations on a dataset with an aim
of discovering patterns, anomalies, checking assumptions, summary statistics and graphical
presentation (Young & Pearce, 2013).
⊘ This is a preview!⊘
Do you want full access?
Subscribe today to unlock all pages.
Trusted by 1+ million students worldwide
Impact of car components on miles per gallon 4
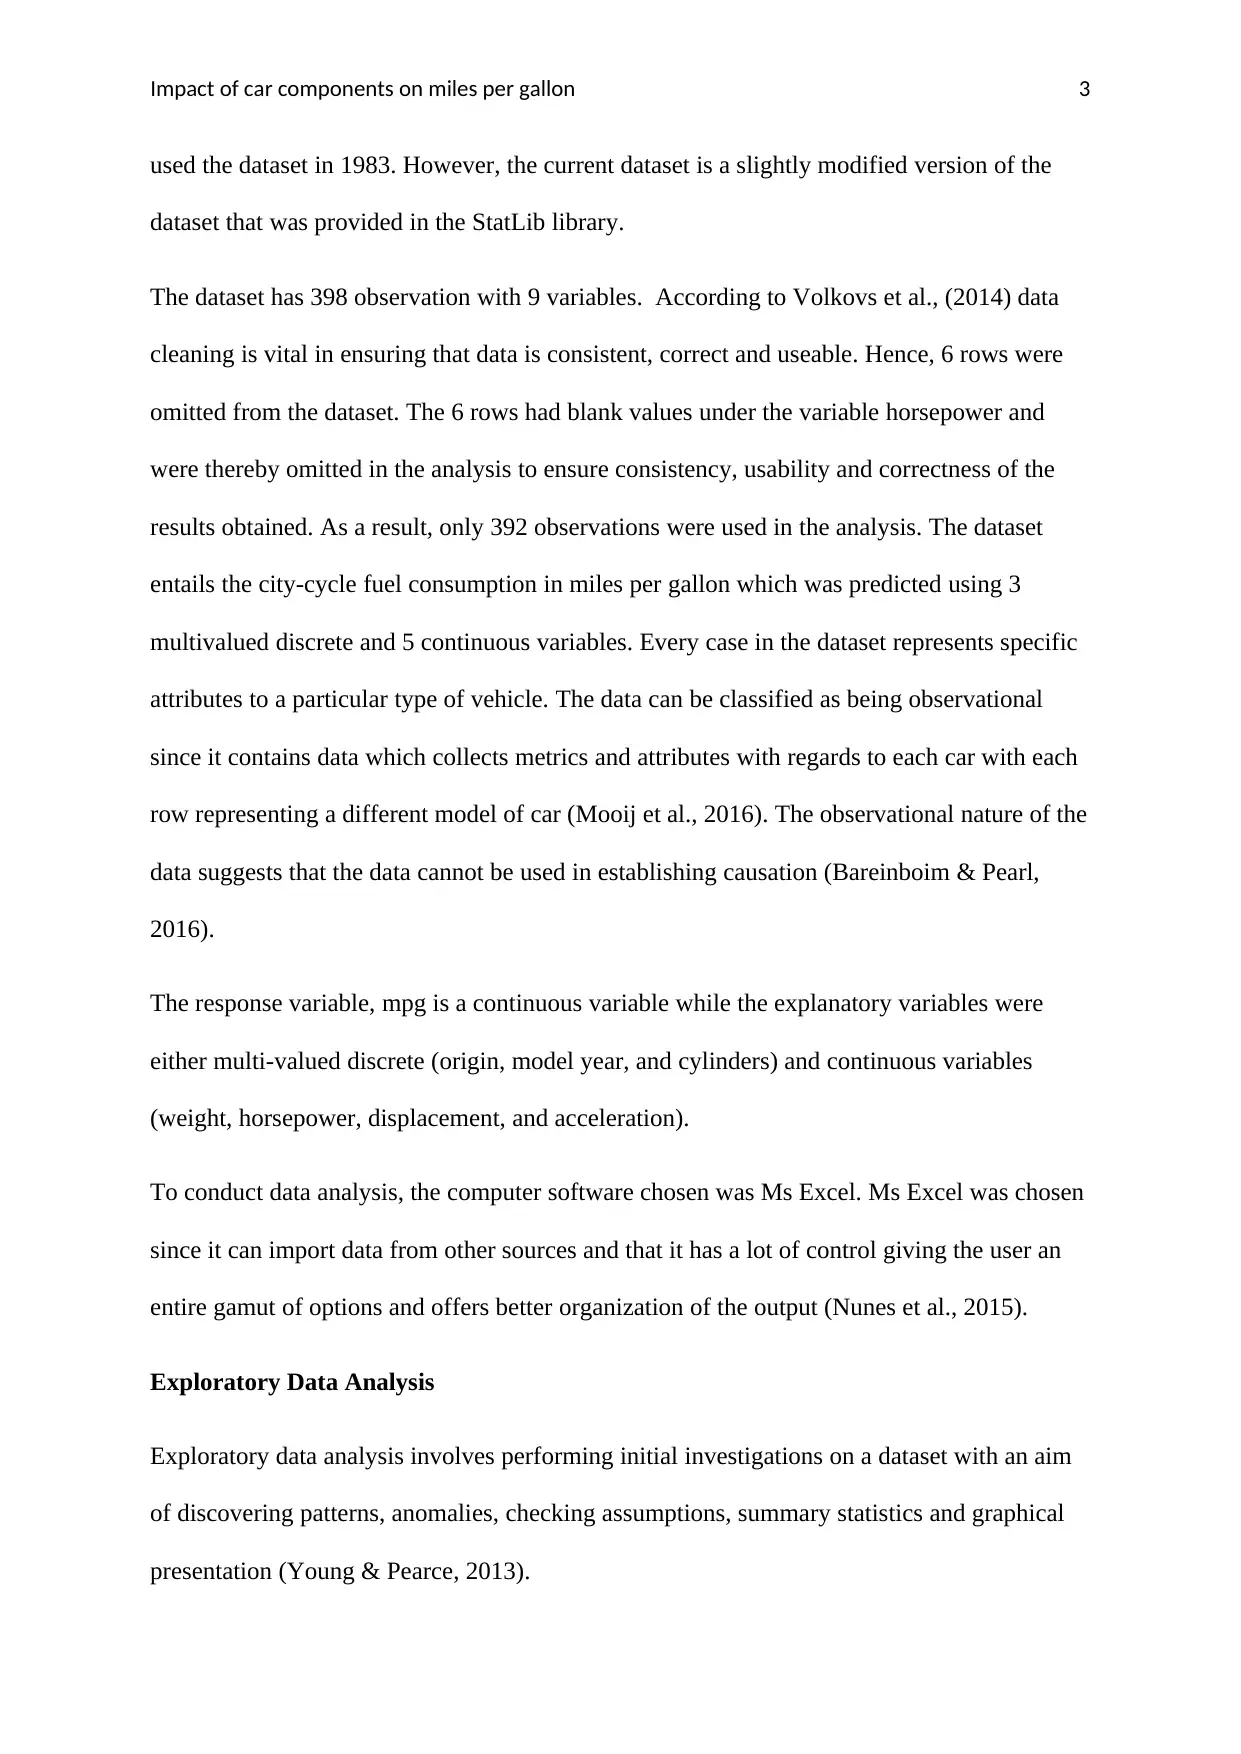
Summary statistics
Since the variables were either continuous or multi-valued discrete, two summary statistics
were carried out. The first summary statistics was the descriptive statistics. The results are as
shown below:
Table 1: Descriptive Statistics
The means of the five continuous variables are as shown above with their respective standard
deviations in the adjacent column.
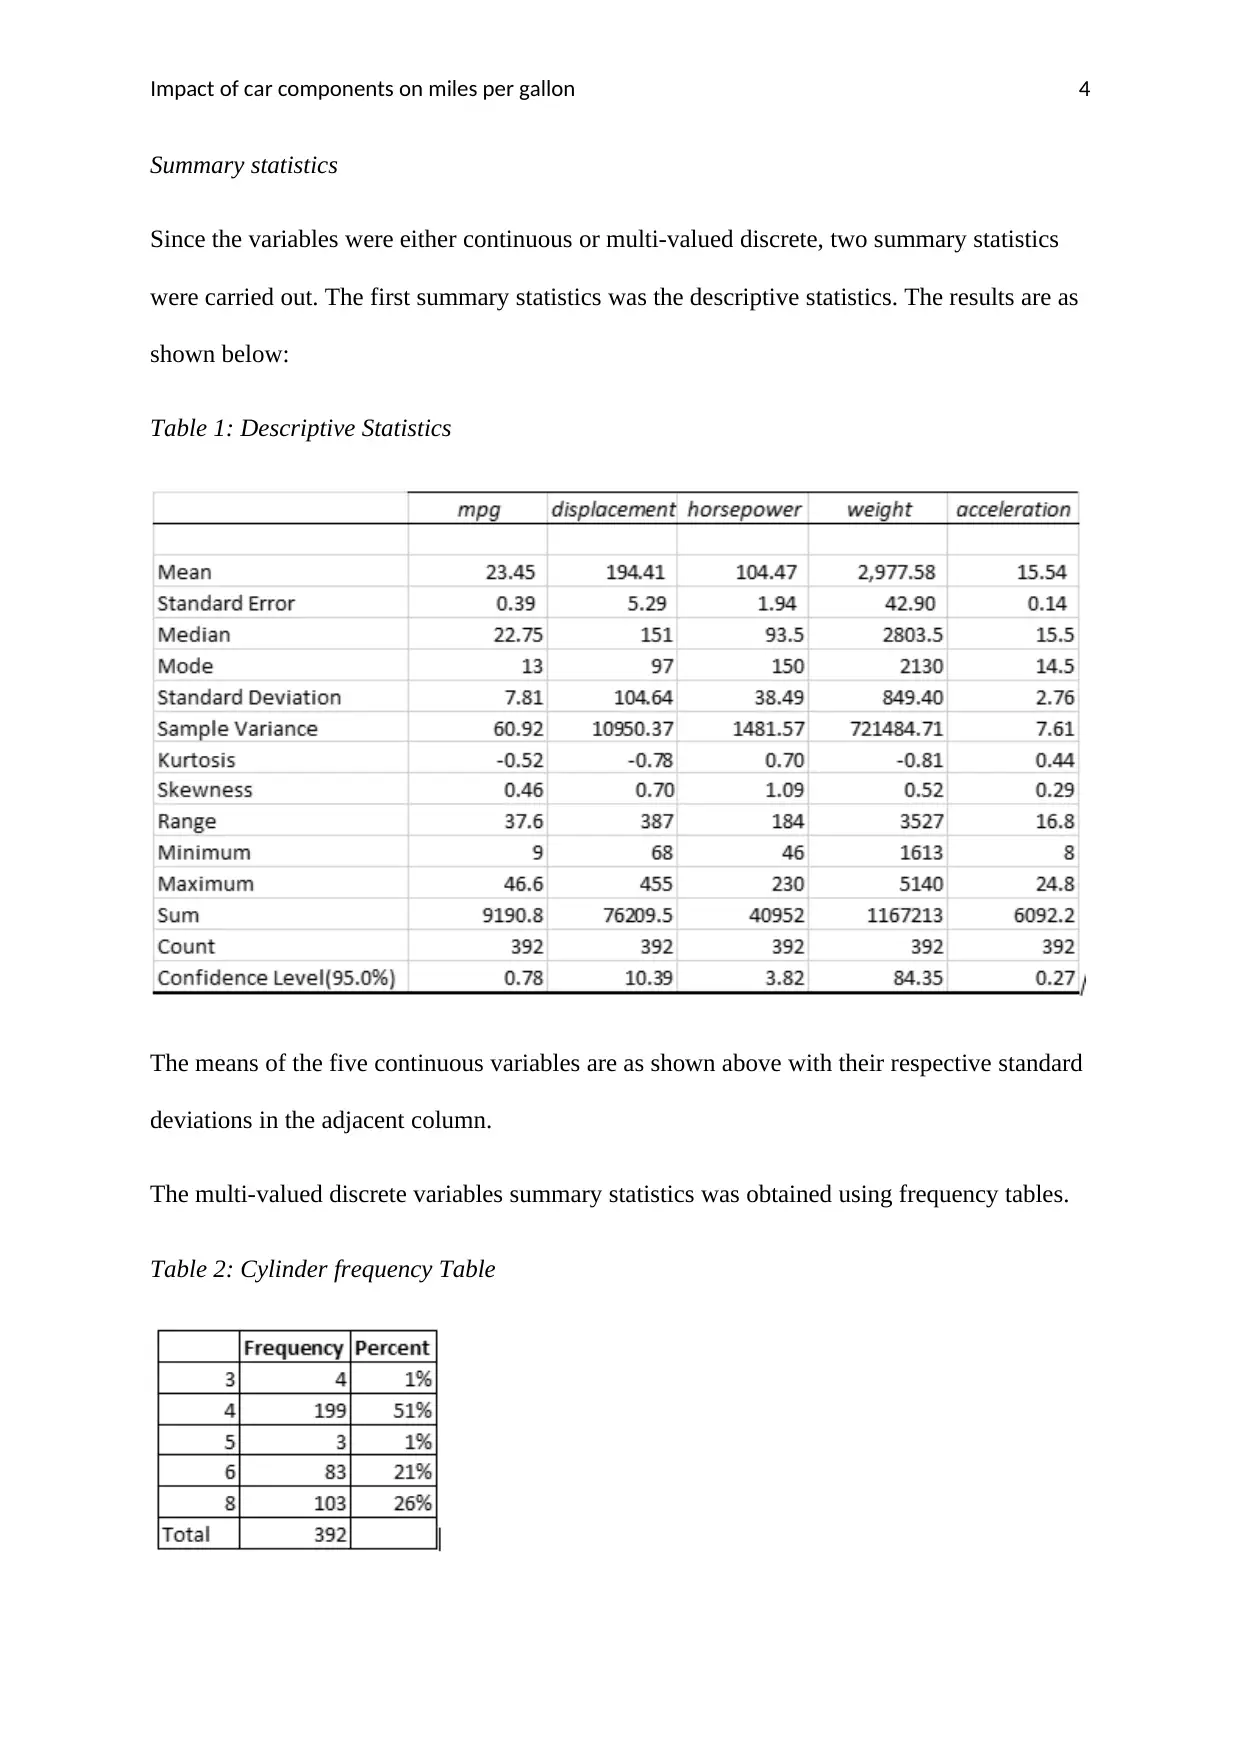
The multi-valued discrete variables summary statistics was obtained using frequency tables.
Table 2: Cylinder frequency Table
Summary statistics
Since the variables were either continuous or multi-valued discrete, two summary statistics
were carried out. The first summary statistics was the descriptive statistics. The results are as
shown below:
Table 1: Descriptive Statistics
The means of the five continuous variables are as shown above with their respective standard
deviations in the adjacent column.
The multi-valued discrete variables summary statistics was obtained using frequency tables.
Table 2: Cylinder frequency Table
Paraphrase This Document
Need a fresh take? Get an instant paraphrase of this document with our AI Paraphraser
Impact of car components on miles per gallon 5
Most of the vehicles use 4 cylinders (50.8%) while the vehicles with 8 and 6 engines were
only 26.3% and 21.2% respectively. The least representations were from vehicles with 3
engines (1%) and 5 engines (0.8%).
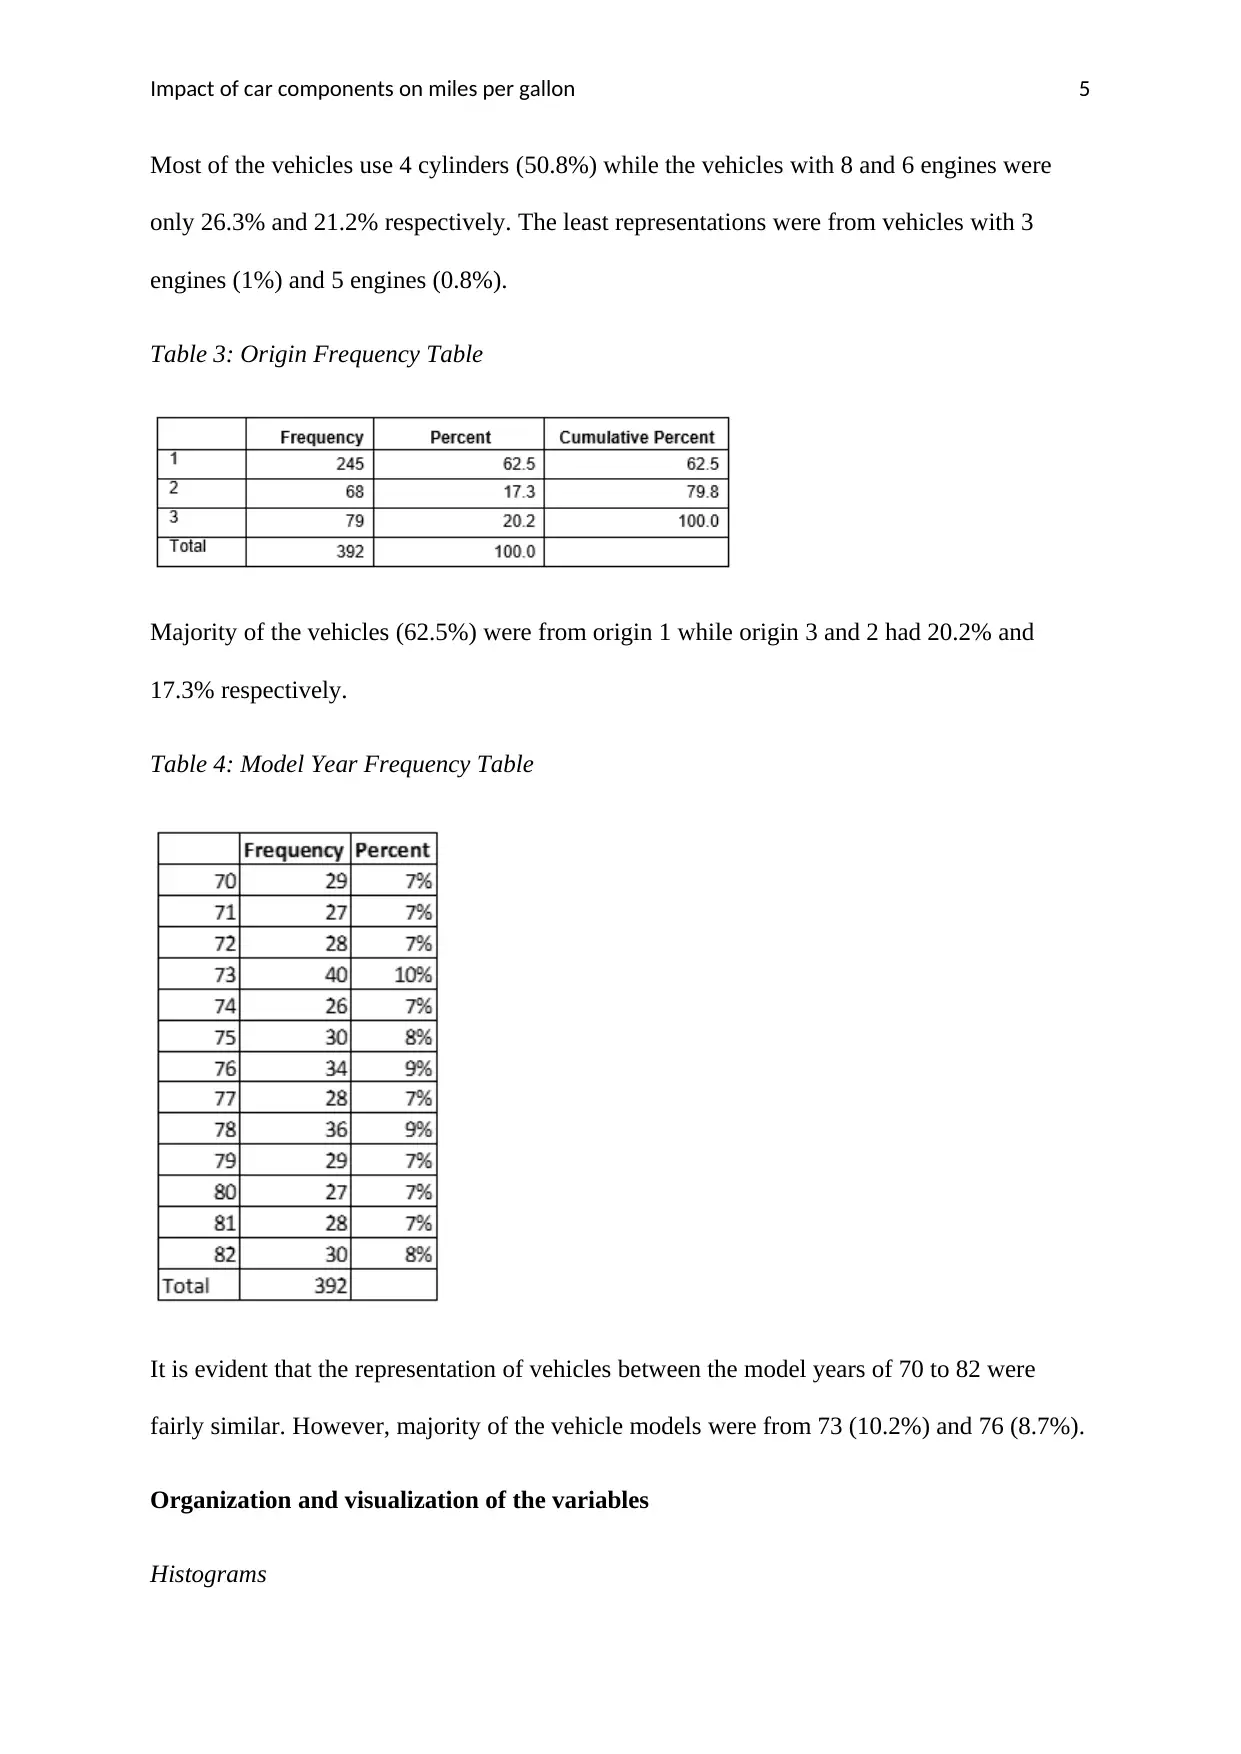
Table 3: Origin Frequency Table
Majority of the vehicles (62.5%) were from origin 1 while origin 3 and 2 had 20.2% and
17.3% respectively.
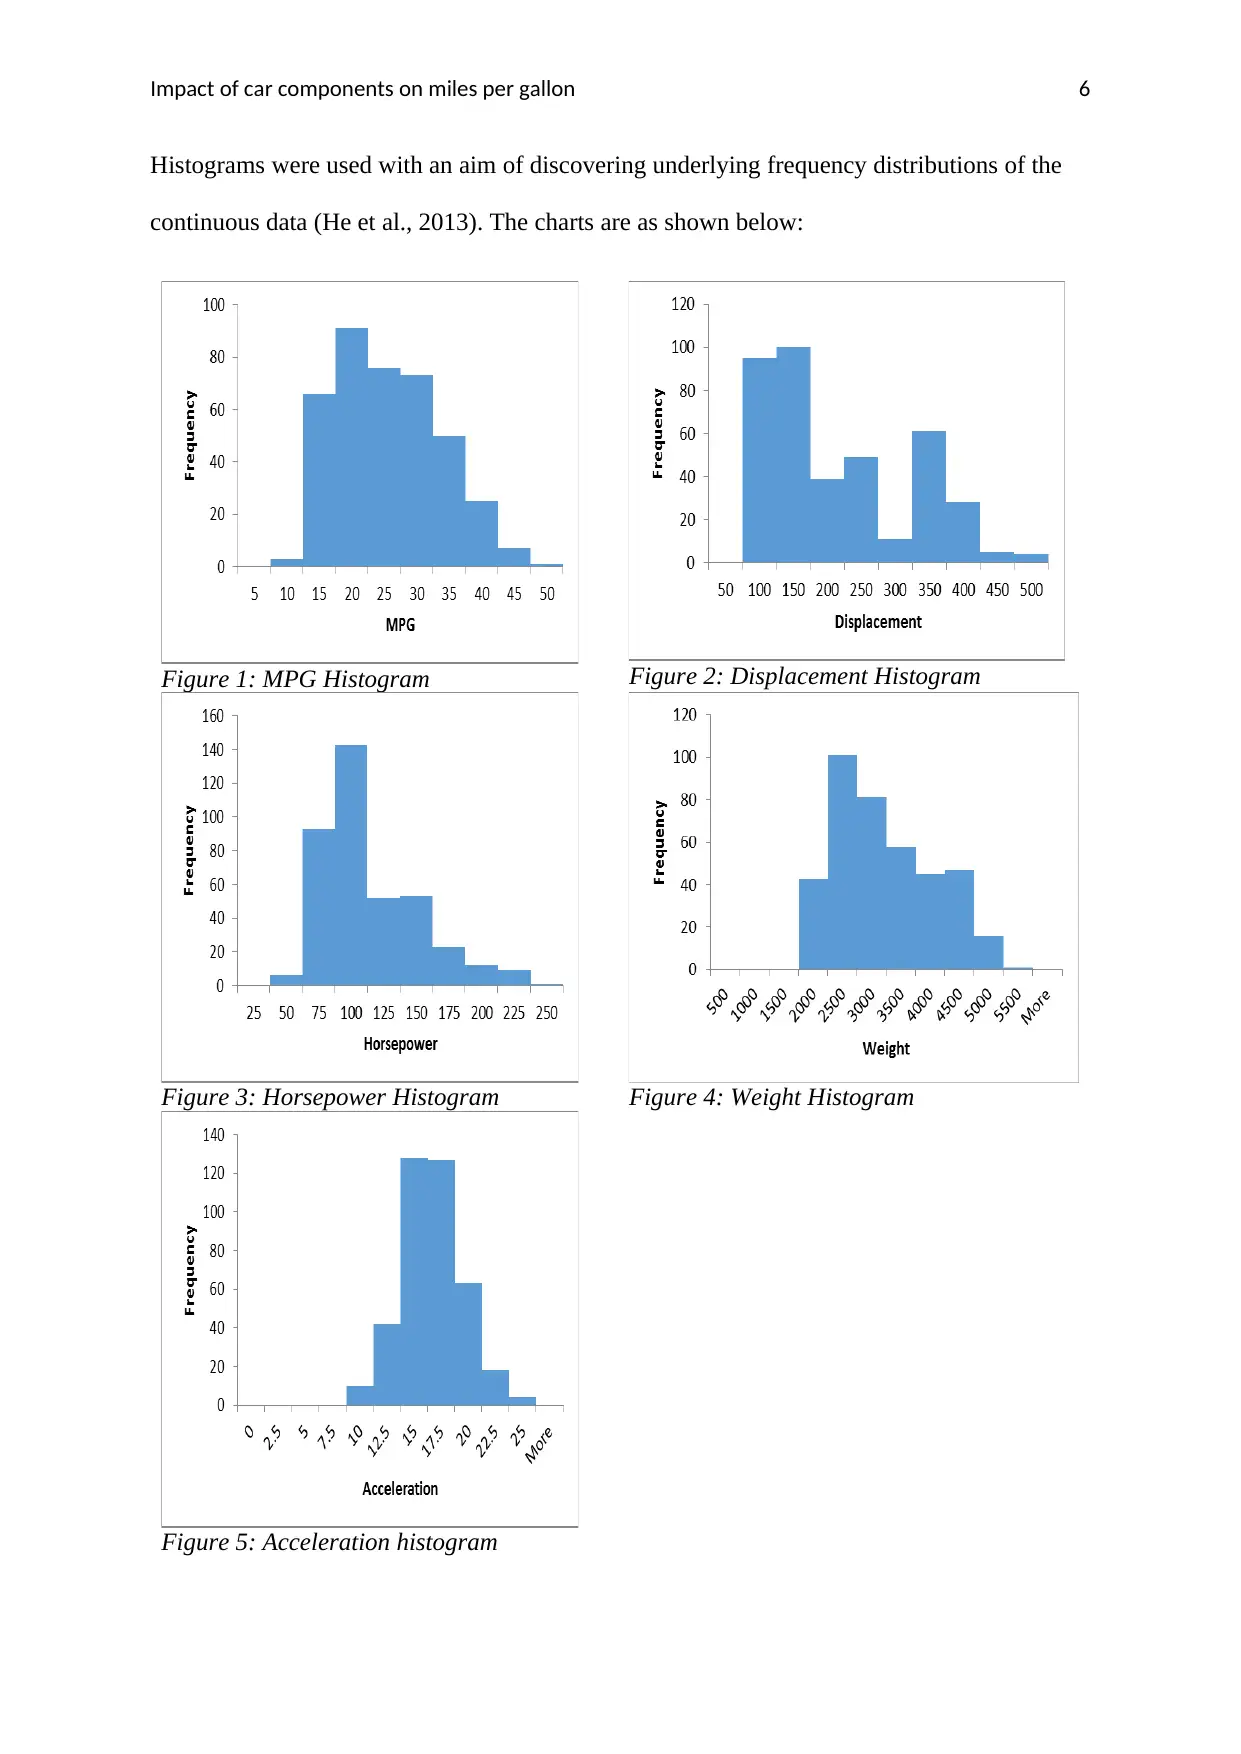
Table 4: Model Year Frequency Table
It is evident that the representation of vehicles between the model years of 70 to 82 were
fairly similar. However, majority of the vehicle models were from 73 (10.2%) and 76 (8.7%).
Organization and visualization of the variables
Histograms
Most of the vehicles use 4 cylinders (50.8%) while the vehicles with 8 and 6 engines were
only 26.3% and 21.2% respectively. The least representations were from vehicles with 3
engines (1%) and 5 engines (0.8%).
Table 3: Origin Frequency Table
Majority of the vehicles (62.5%) were from origin 1 while origin 3 and 2 had 20.2% and
17.3% respectively.
Table 4: Model Year Frequency Table
It is evident that the representation of vehicles between the model years of 70 to 82 were
fairly similar. However, majority of the vehicle models were from 73 (10.2%) and 76 (8.7%).
Organization and visualization of the variables
Histograms
Impact of car components on miles per gallon 6
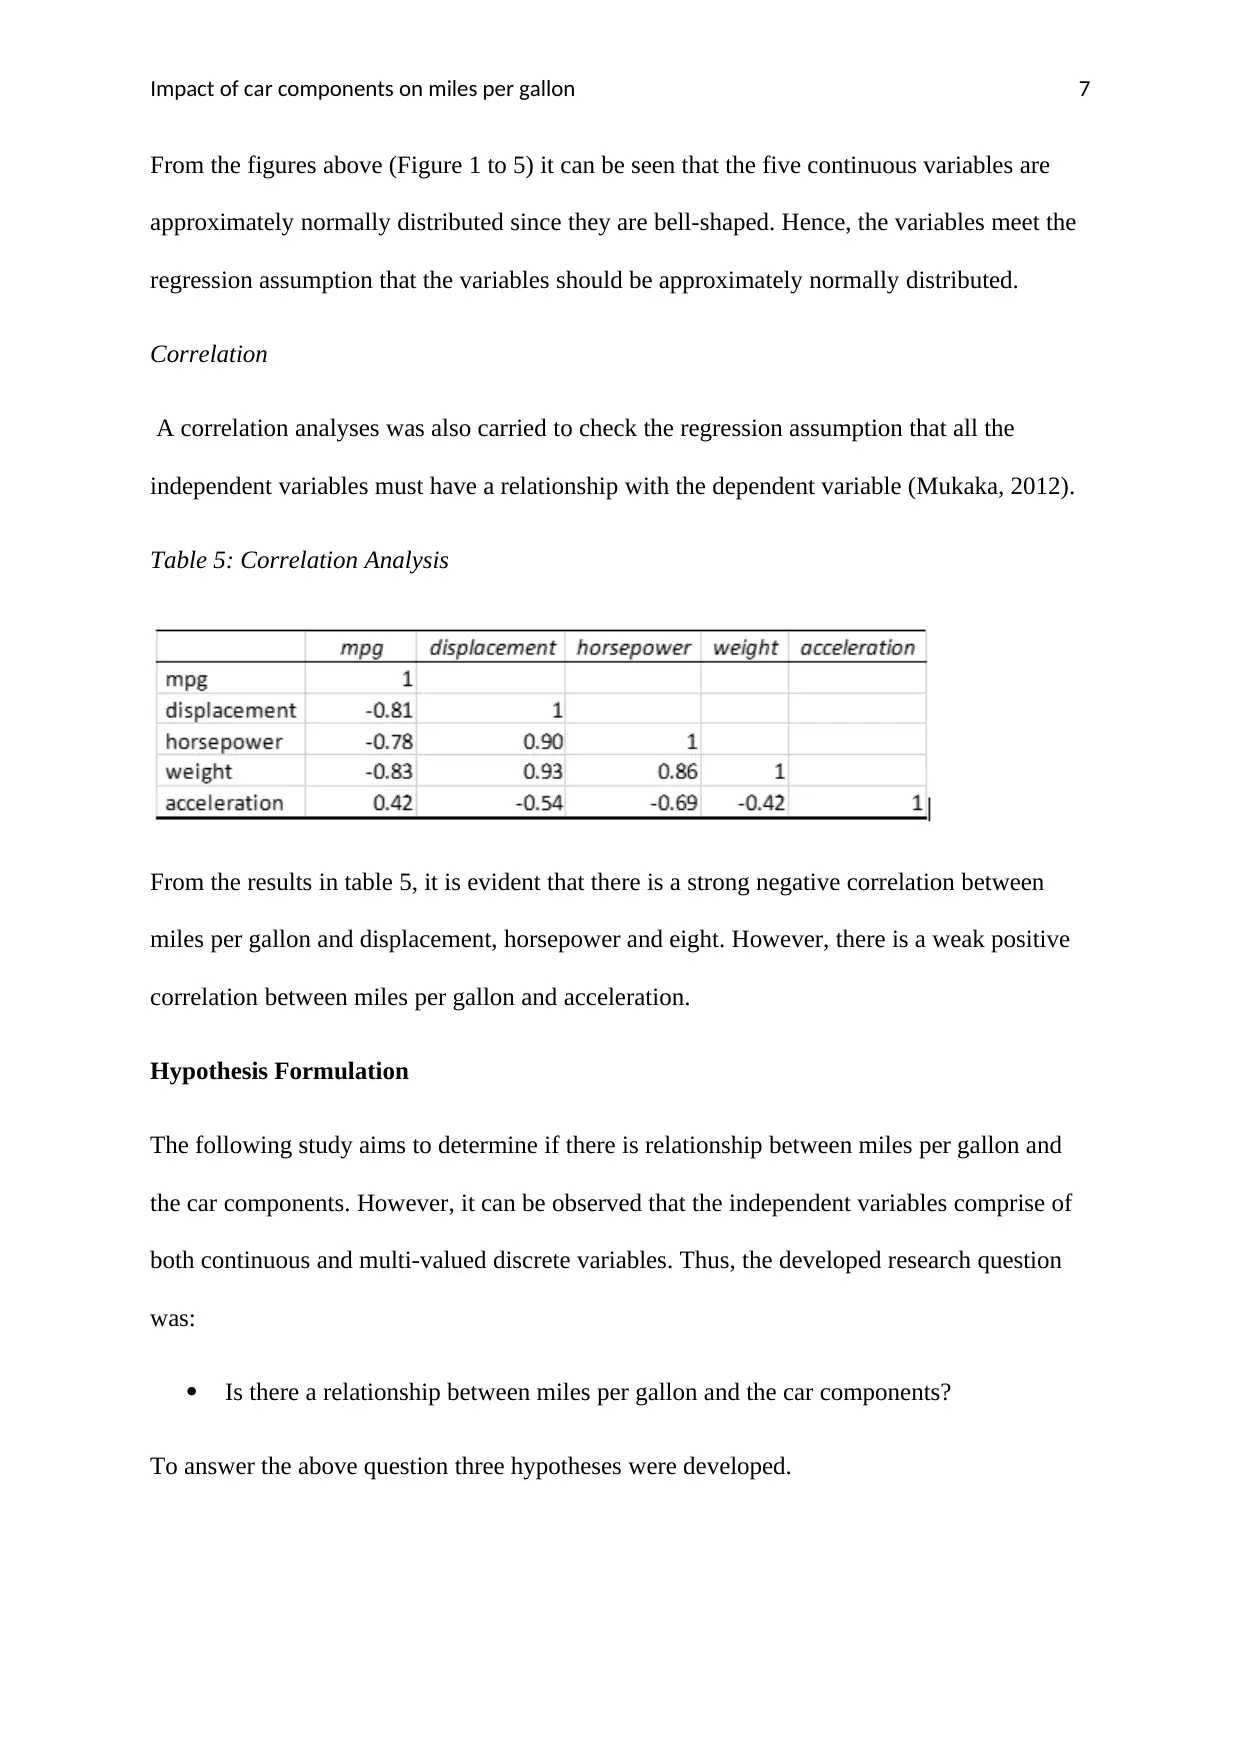
Histograms were used with an aim of discovering underlying frequency distributions of the
continuous data (He et al., 2013). The charts are as shown below:
Figure 1: MPG Histogram Figure 2: Displacement Histogram
Figure 3: Horsepower Histogram Figure 4: Weight Histogram
Figure 5: Acceleration histogram
⊘ This is a preview!⊘
Do you want full access?
Subscribe today to unlock all pages.
Trusted by 1+ million students worldwide
Impact of car components on miles per gallon 7
From the figures above (Figure 1 to 5) it can be seen that the five continuous variables are
approximately normally distributed since they are bell-shaped. Hence, the variables meet the
regression assumption that the variables should be approximately normally distributed.
Correlation
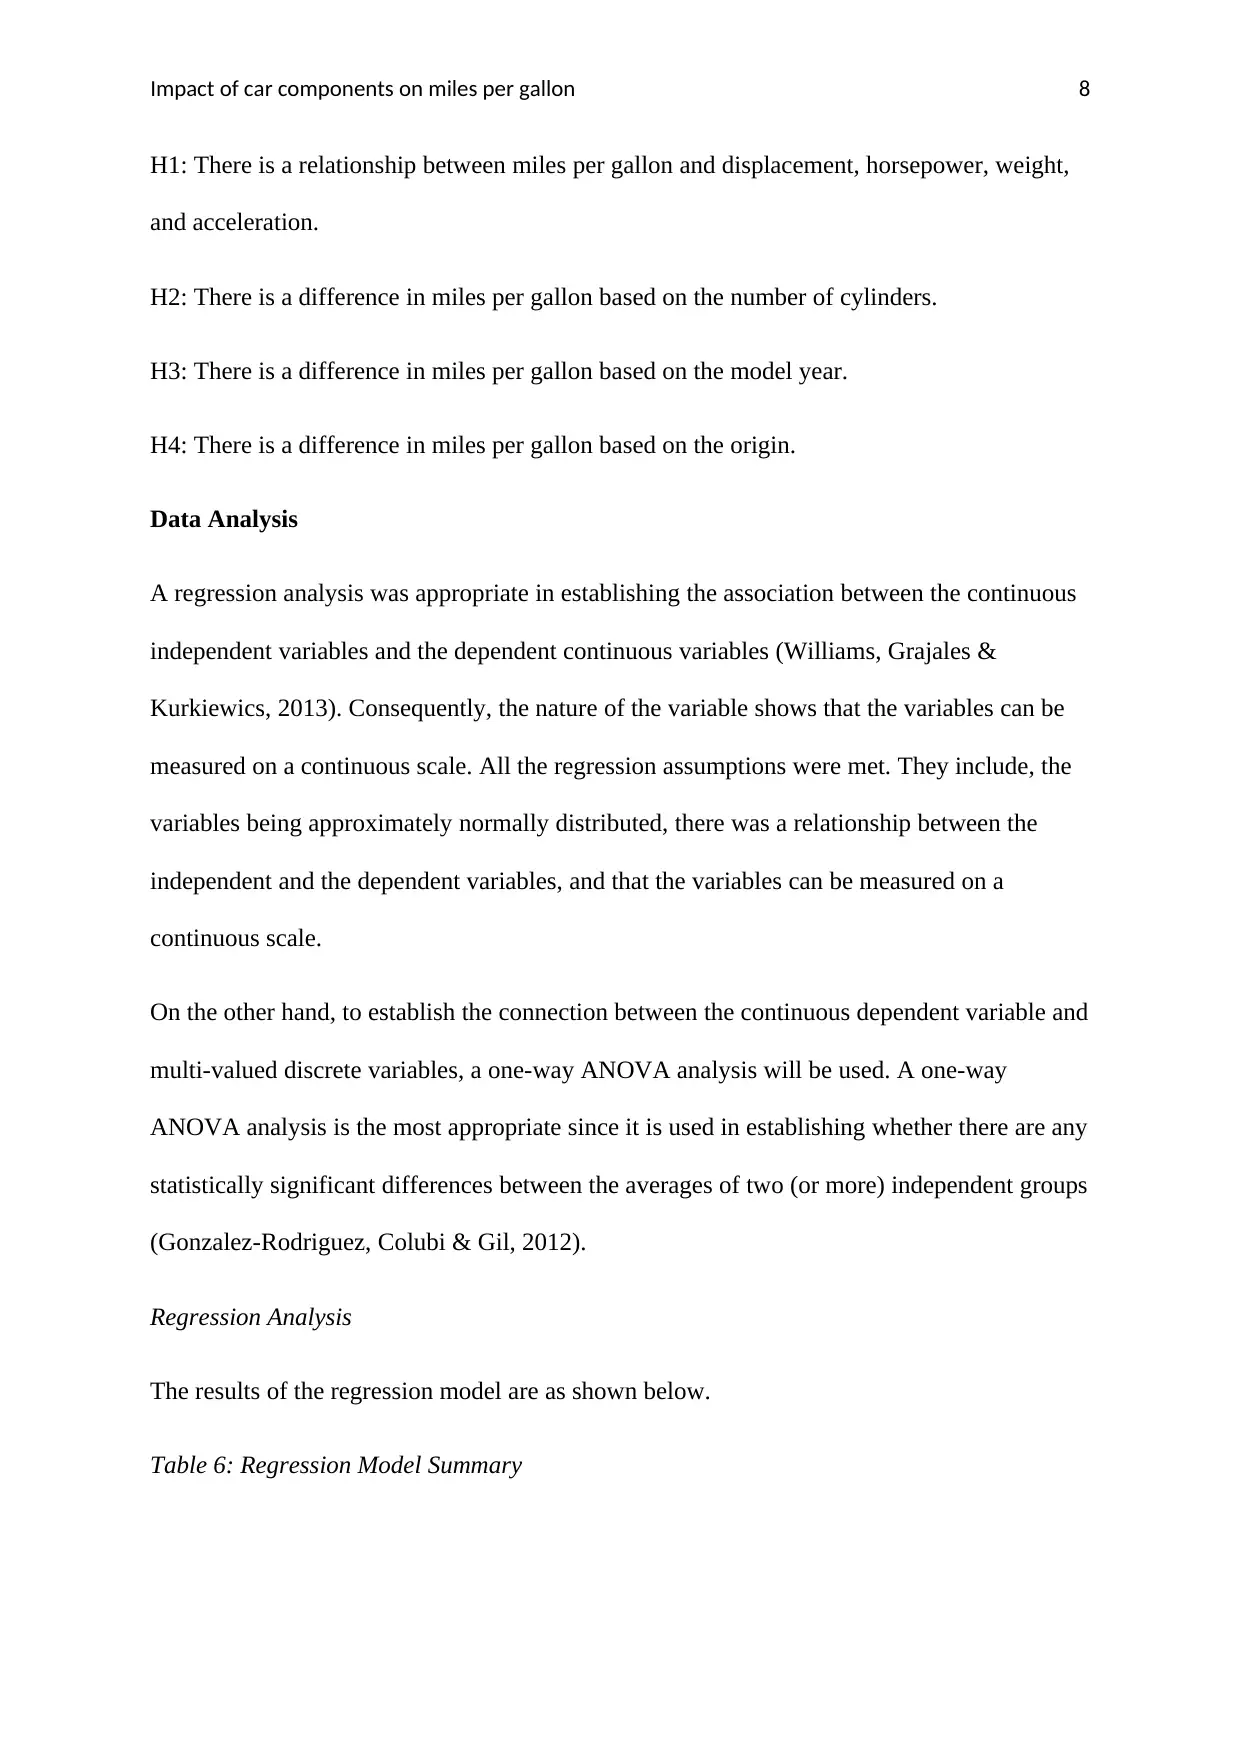
A correlation analyses was also carried to check the regression assumption that all the
independent variables must have a relationship with the dependent variable (Mukaka, 2012).
Table 5: Correlation Analysis
From the results in table 5, it is evident that there is a strong negative correlation between
miles per gallon and displacement, horsepower and eight. However, there is a weak positive
correlation between miles per gallon and acceleration.
Hypothesis Formulation
The following study aims to determine if there is relationship between miles per gallon and
the car components. However, it can be observed that the independent variables comprise of
both continuous and multi-valued discrete variables. Thus, the developed research question
was:
Is there a relationship between miles per gallon and the car components?
To answer the above question three hypotheses were developed.
From the figures above (Figure 1 to 5) it can be seen that the five continuous variables are
approximately normally distributed since they are bell-shaped. Hence, the variables meet the
regression assumption that the variables should be approximately normally distributed.
Correlation
A correlation analyses was also carried to check the regression assumption that all the
independent variables must have a relationship with the dependent variable (Mukaka, 2012).
Table 5: Correlation Analysis
From the results in table 5, it is evident that there is a strong negative correlation between
miles per gallon and displacement, horsepower and eight. However, there is a weak positive
correlation between miles per gallon and acceleration.
Hypothesis Formulation
The following study aims to determine if there is relationship between miles per gallon and
the car components. However, it can be observed that the independent variables comprise of
both continuous and multi-valued discrete variables. Thus, the developed research question
was:
Is there a relationship between miles per gallon and the car components?
To answer the above question three hypotheses were developed.
Paraphrase This Document
Need a fresh take? Get an instant paraphrase of this document with our AI Paraphraser
Impact of car components on miles per gallon 8
H1: There is a relationship between miles per gallon and displacement, horsepower, weight,
and acceleration.
H2: There is a difference in miles per gallon based on the number of cylinders.
H3: There is a difference in miles per gallon based on the model year.
H4: There is a difference in miles per gallon based on the origin.
Data Analysis
A regression analysis was appropriate in establishing the association between the continuous
independent variables and the dependent continuous variables (Williams, Grajales &
Kurkiewics, 2013). Consequently, the nature of the variable shows that the variables can be
measured on a continuous scale. All the regression assumptions were met. They include, the
variables being approximately normally distributed, there was a relationship between the
independent and the dependent variables, and that the variables can be measured on a
continuous scale.
On the other hand, to establish the connection between the continuous dependent variable and
multi-valued discrete variables, a one-way ANOVA analysis will be used. A one-way
ANOVA analysis is the most appropriate since it is used in establishing whether there are any
statistically significant differences between the averages of two (or more) independent groups
(Gonzalez-Rodriguez, Colubi & Gil, 2012).
Regression Analysis
The results of the regression model are as shown below.
Table 6: Regression Model Summary
Impact of car components on miles per gallon 9
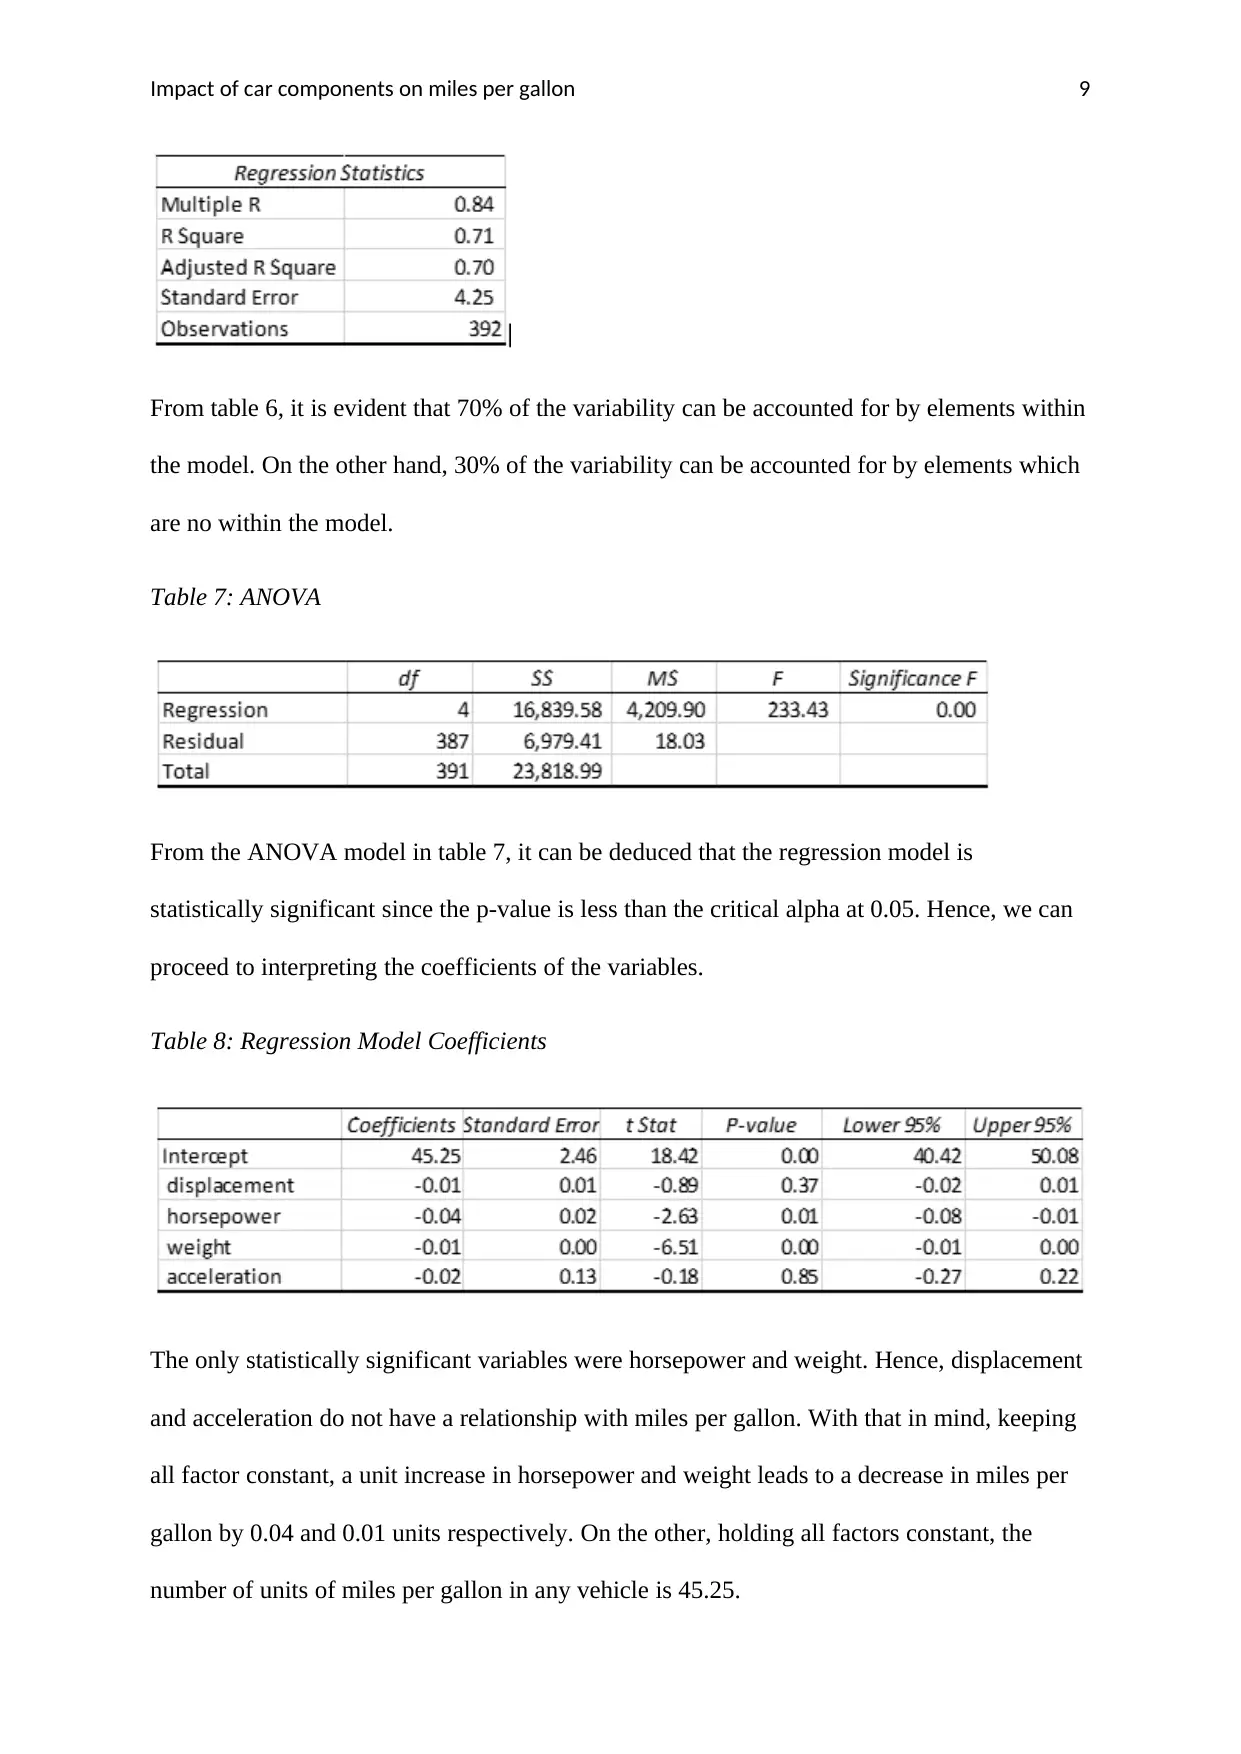
From table 6, it is evident that 70% of the variability can be accounted for by elements within
the model. On the other hand, 30% of the variability can be accounted for by elements which
are no within the model.
Table 7: ANOVA
From the ANOVA model in table 7, it can be deduced that the regression model is
statistically significant since the p-value is less than the critical alpha at 0.05. Hence, we can
proceed to interpreting the coefficients of the variables.
Table 8: Regression Model Coefficients
The only statistically significant variables were horsepower and weight. Hence, displacement
and acceleration do not have a relationship with miles per gallon. With that in mind, keeping
all factor constant, a unit increase in horsepower and weight leads to a decrease in miles per
gallon by 0.04 and 0.01 units respectively. On the other, holding all factors constant, the
number of units of miles per gallon in any vehicle is 45.25.
⊘ This is a preview!⊘
Do you want full access?
Subscribe today to unlock all pages.
Trusted by 1+ million students worldwide
Impact of car components on miles per gallon 10
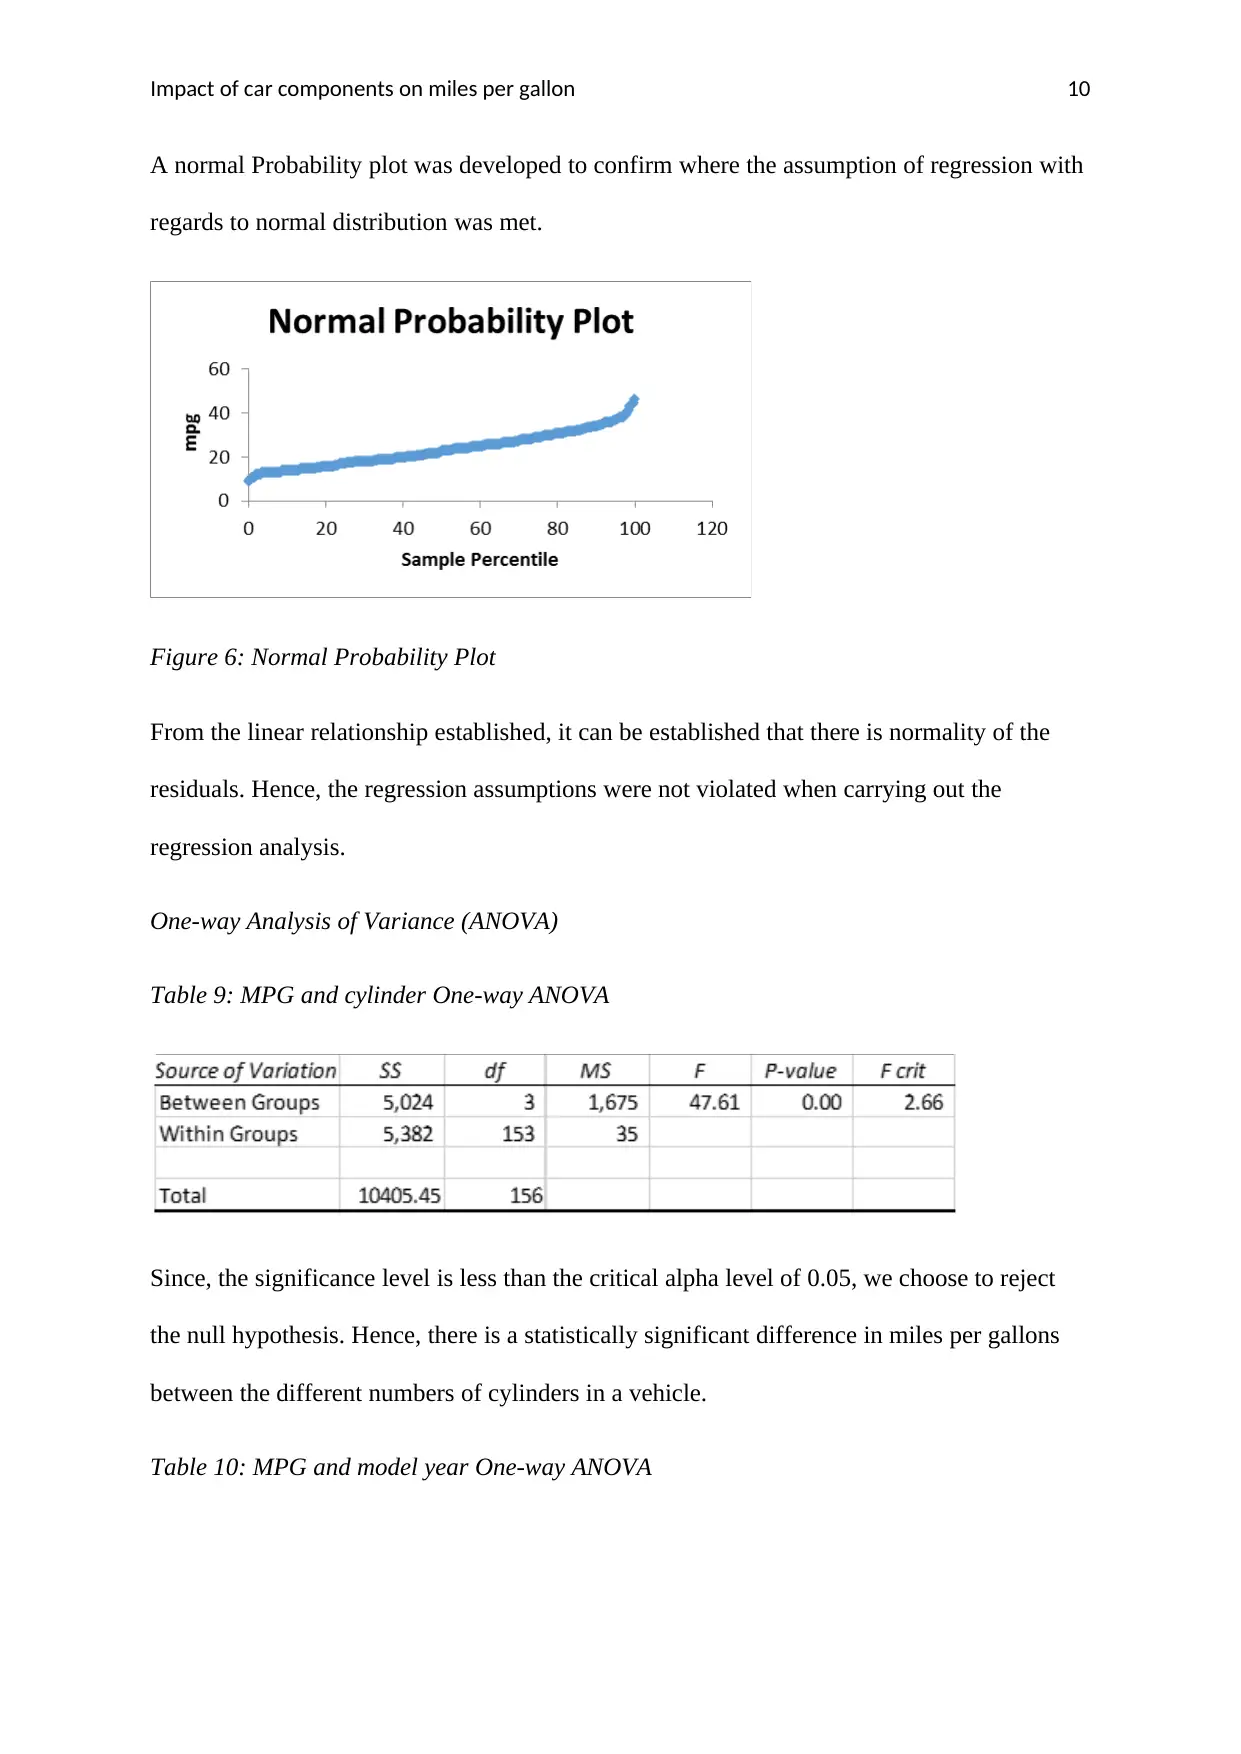
A normal Probability plot was developed to confirm where the assumption of regression with
regards to normal distribution was met.
Figure 6: Normal Probability Plot
From the linear relationship established, it can be established that there is normality of the
residuals. Hence, the regression assumptions were not violated when carrying out the
regression analysis.
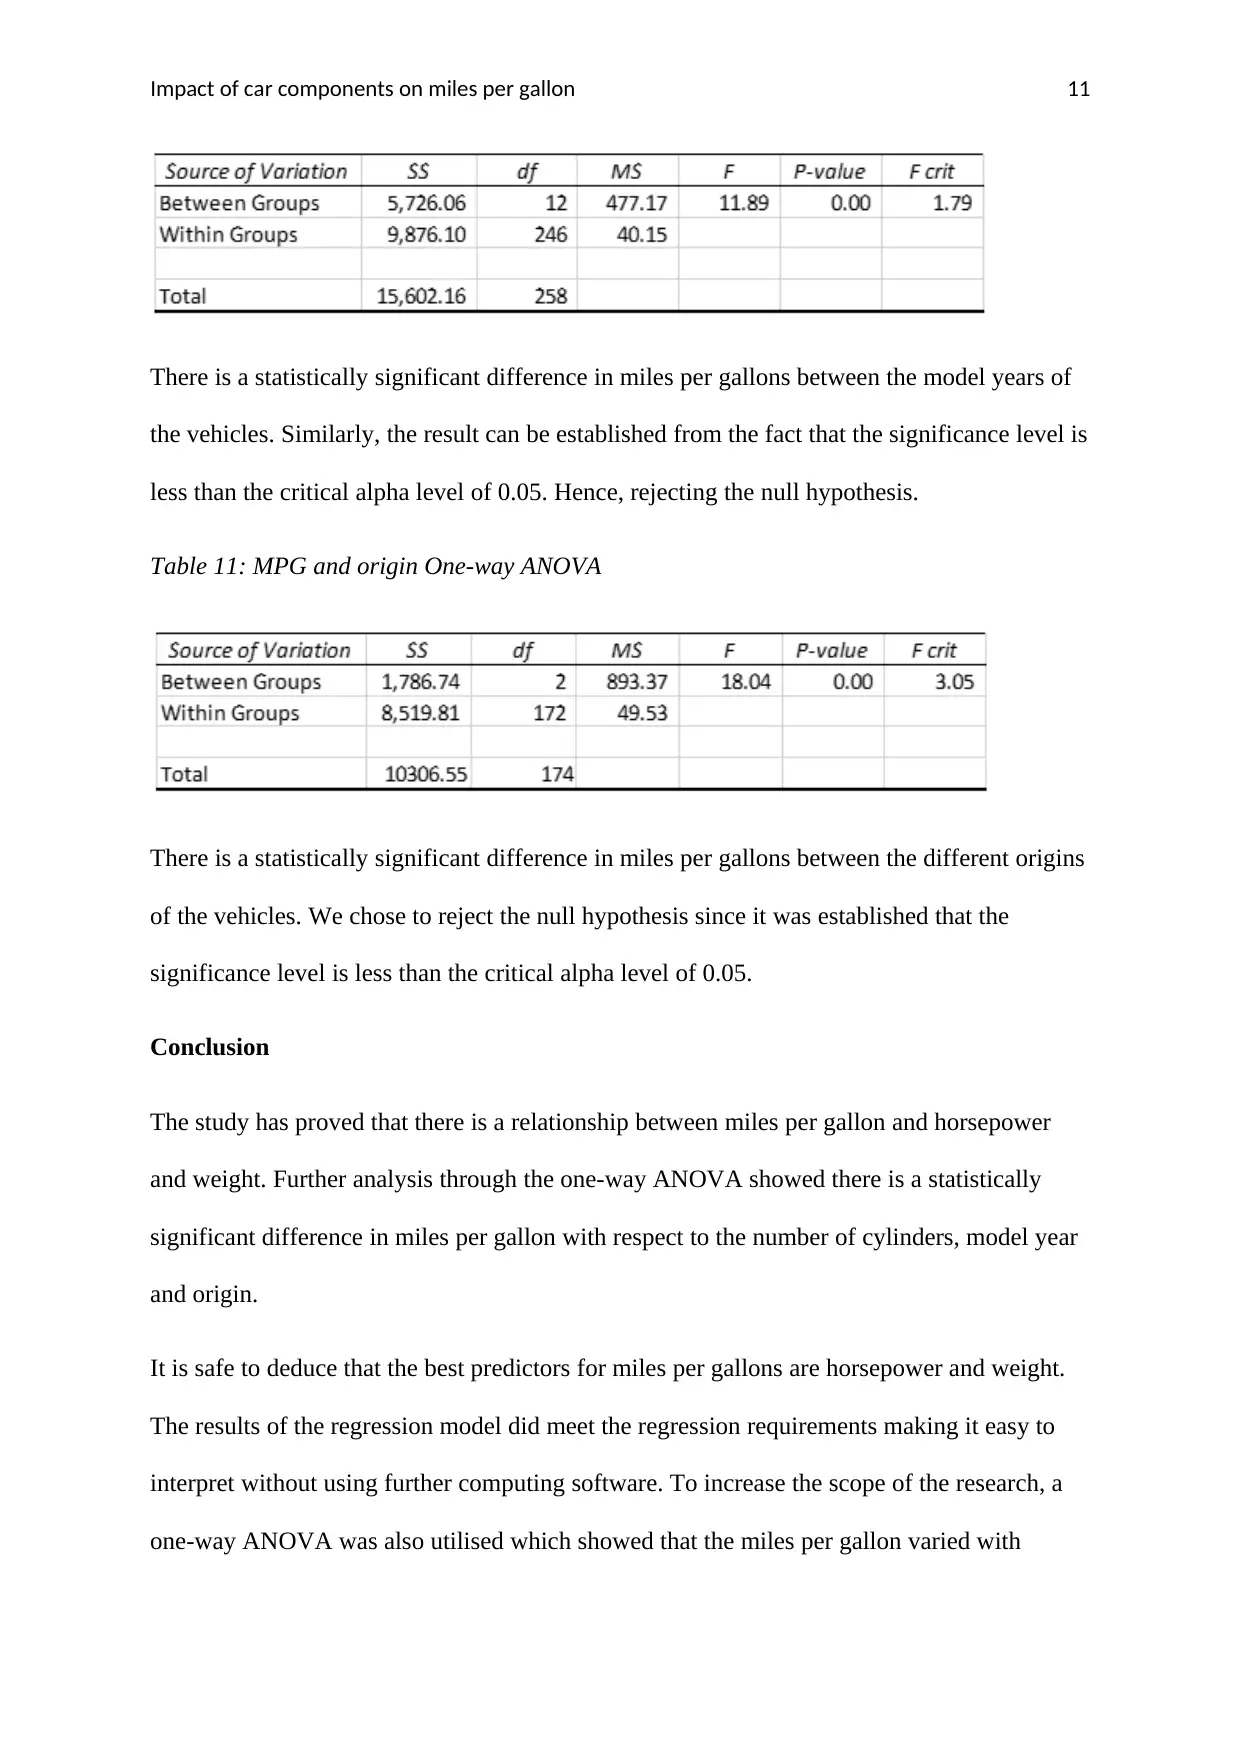
One-way Analysis of Variance (ANOVA)
Table 9: MPG and cylinder One-way ANOVA
Since, the significance level is less than the critical alpha level of 0.05, we choose to reject
the null hypothesis. Hence, there is a statistically significant difference in miles per gallons
between the different numbers of cylinders in a vehicle.
Table 10: MPG and model year One-way ANOVA
A normal Probability plot was developed to confirm where the assumption of regression with
regards to normal distribution was met.
Figure 6: Normal Probability Plot
From the linear relationship established, it can be established that there is normality of the
residuals. Hence, the regression assumptions were not violated when carrying out the
regression analysis.
One-way Analysis of Variance (ANOVA)
Table 9: MPG and cylinder One-way ANOVA
Since, the significance level is less than the critical alpha level of 0.05, we choose to reject
the null hypothesis. Hence, there is a statistically significant difference in miles per gallons
between the different numbers of cylinders in a vehicle.
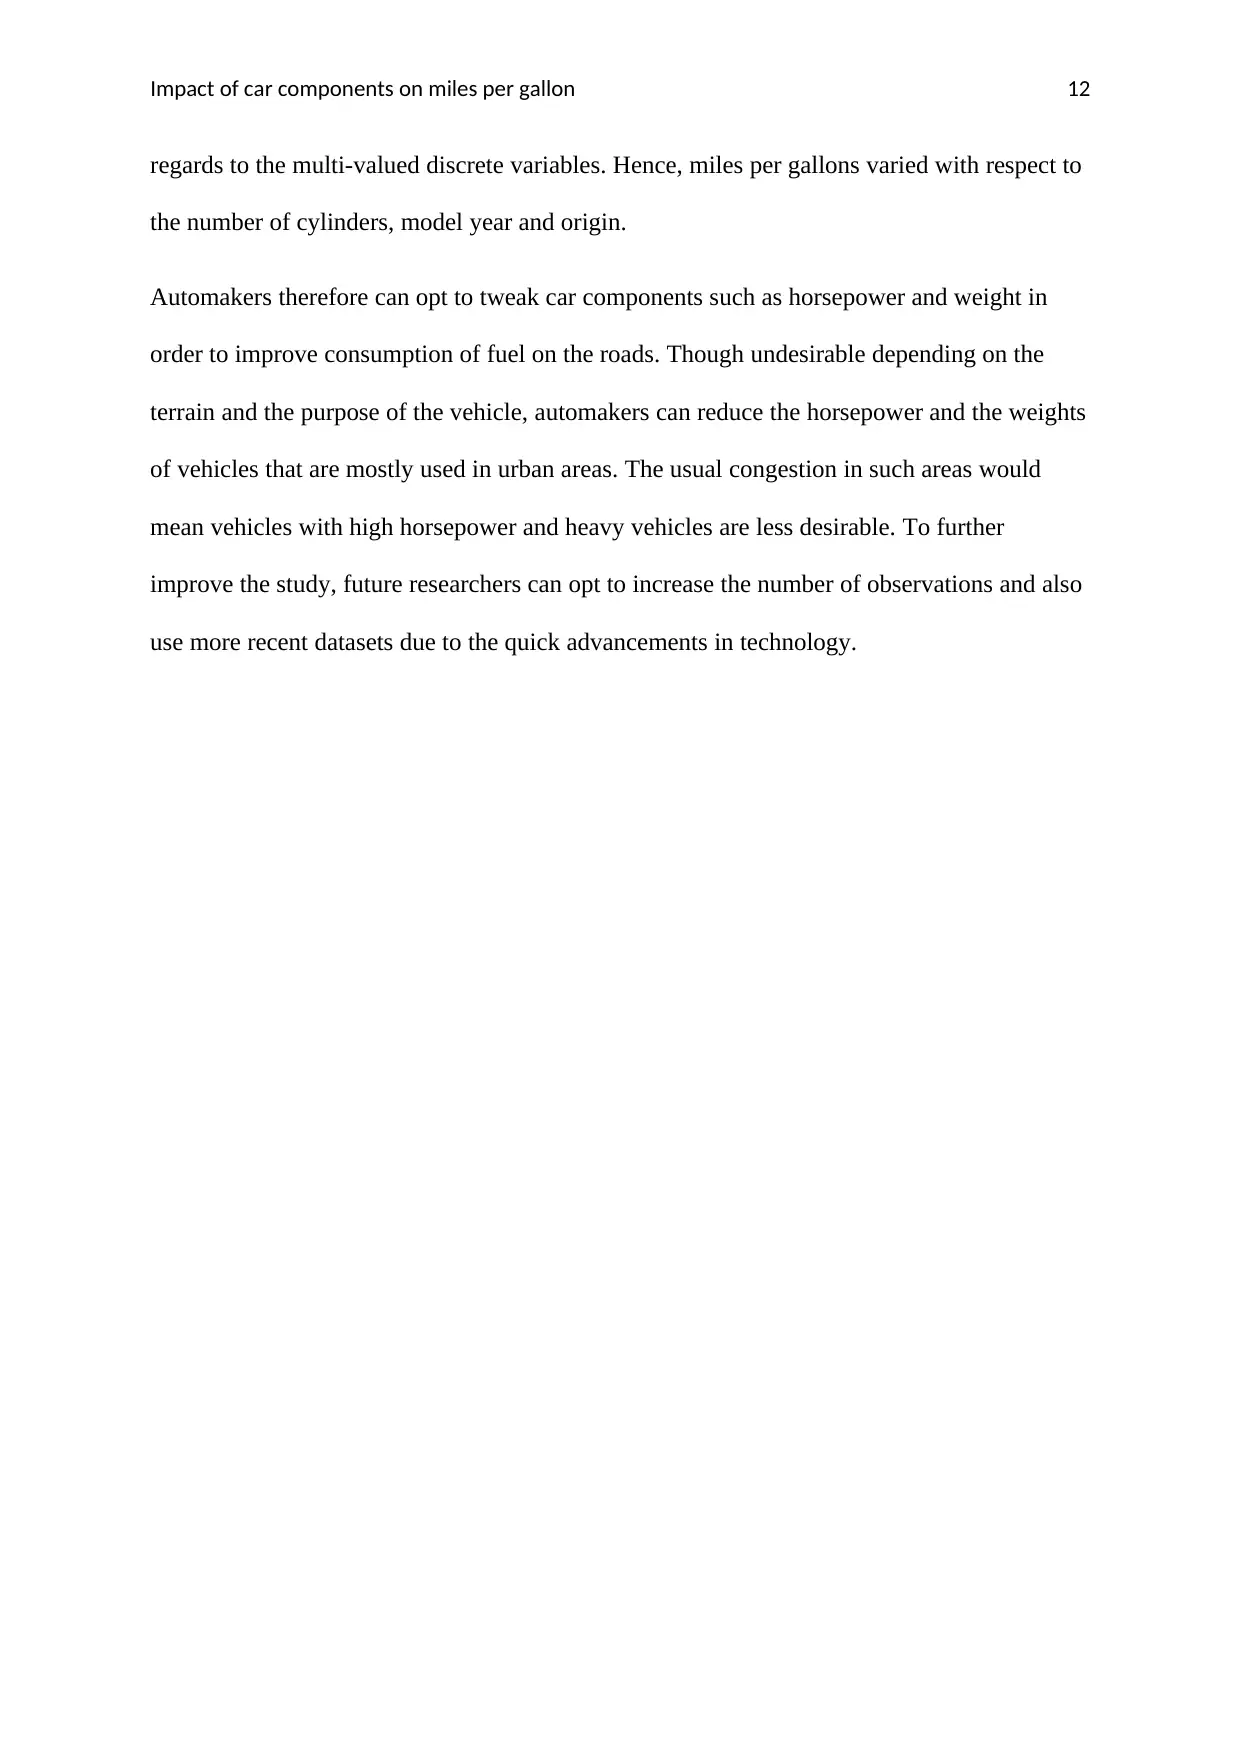
Table 10: MPG and model year One-way ANOVA
Paraphrase This Document
Need a fresh take? Get an instant paraphrase of this document with our AI Paraphraser
Impact of car components on miles per gallon 11
There is a statistically significant difference in miles per gallons between the model years of
the vehicles. Similarly, the result can be established from the fact that the significance level is
less than the critical alpha level of 0.05. Hence, rejecting the null hypothesis.
Table 11: MPG and origin One-way ANOVA
There is a statistically significant difference in miles per gallons between the different origins
of the vehicles. We chose to reject the null hypothesis since it was established that the
significance level is less than the critical alpha level of 0.05.
Conclusion
The study has proved that there is a relationship between miles per gallon and horsepower
and weight. Further analysis through the one-way ANOVA showed there is a statistically
significant difference in miles per gallon with respect to the number of cylinders, model year
and origin.
It is safe to deduce that the best predictors for miles per gallons are horsepower and weight.
The results of the regression model did meet the regression requirements making it easy to
interpret without using further computing software. To increase the scope of the research, a
one-way ANOVA was also utilised which showed that the miles per gallon varied with
Impact of car components on miles per gallon 12
regards to the multi-valued discrete variables. Hence, miles per gallons varied with respect to
the number of cylinders, model year and origin.
Automakers therefore can opt to tweak car components such as horsepower and weight in
order to improve consumption of fuel on the roads. Though undesirable depending on the
terrain and the purpose of the vehicle, automakers can reduce the horsepower and the weights
of vehicles that are mostly used in urban areas. The usual congestion in such areas would
mean vehicles with high horsepower and heavy vehicles are less desirable. To further
improve the study, future researchers can opt to increase the number of observations and also
use more recent datasets due to the quick advancements in technology.
⊘ This is a preview!⊘
Do you want full access?
Subscribe today to unlock all pages.
Trusted by 1+ million students worldwide
1 out of 14
Your All-in-One AI-Powered Toolkit for Academic Success.
+13062052269
info@desklib.com
Available 24*7 on WhatsApp / Email
![[object Object]](/_next/static/media/star-bottom.7253800d.svg)
Unlock your academic potential
Copyright © 2020–2026 A2Z Services. All Rights Reserved. Developed and managed by ZUCOL.