Inferential Statistical Analysis Report - Year 2 Statistics Module
VerifiedAdded on 2023/02/01
|5
|744
|96
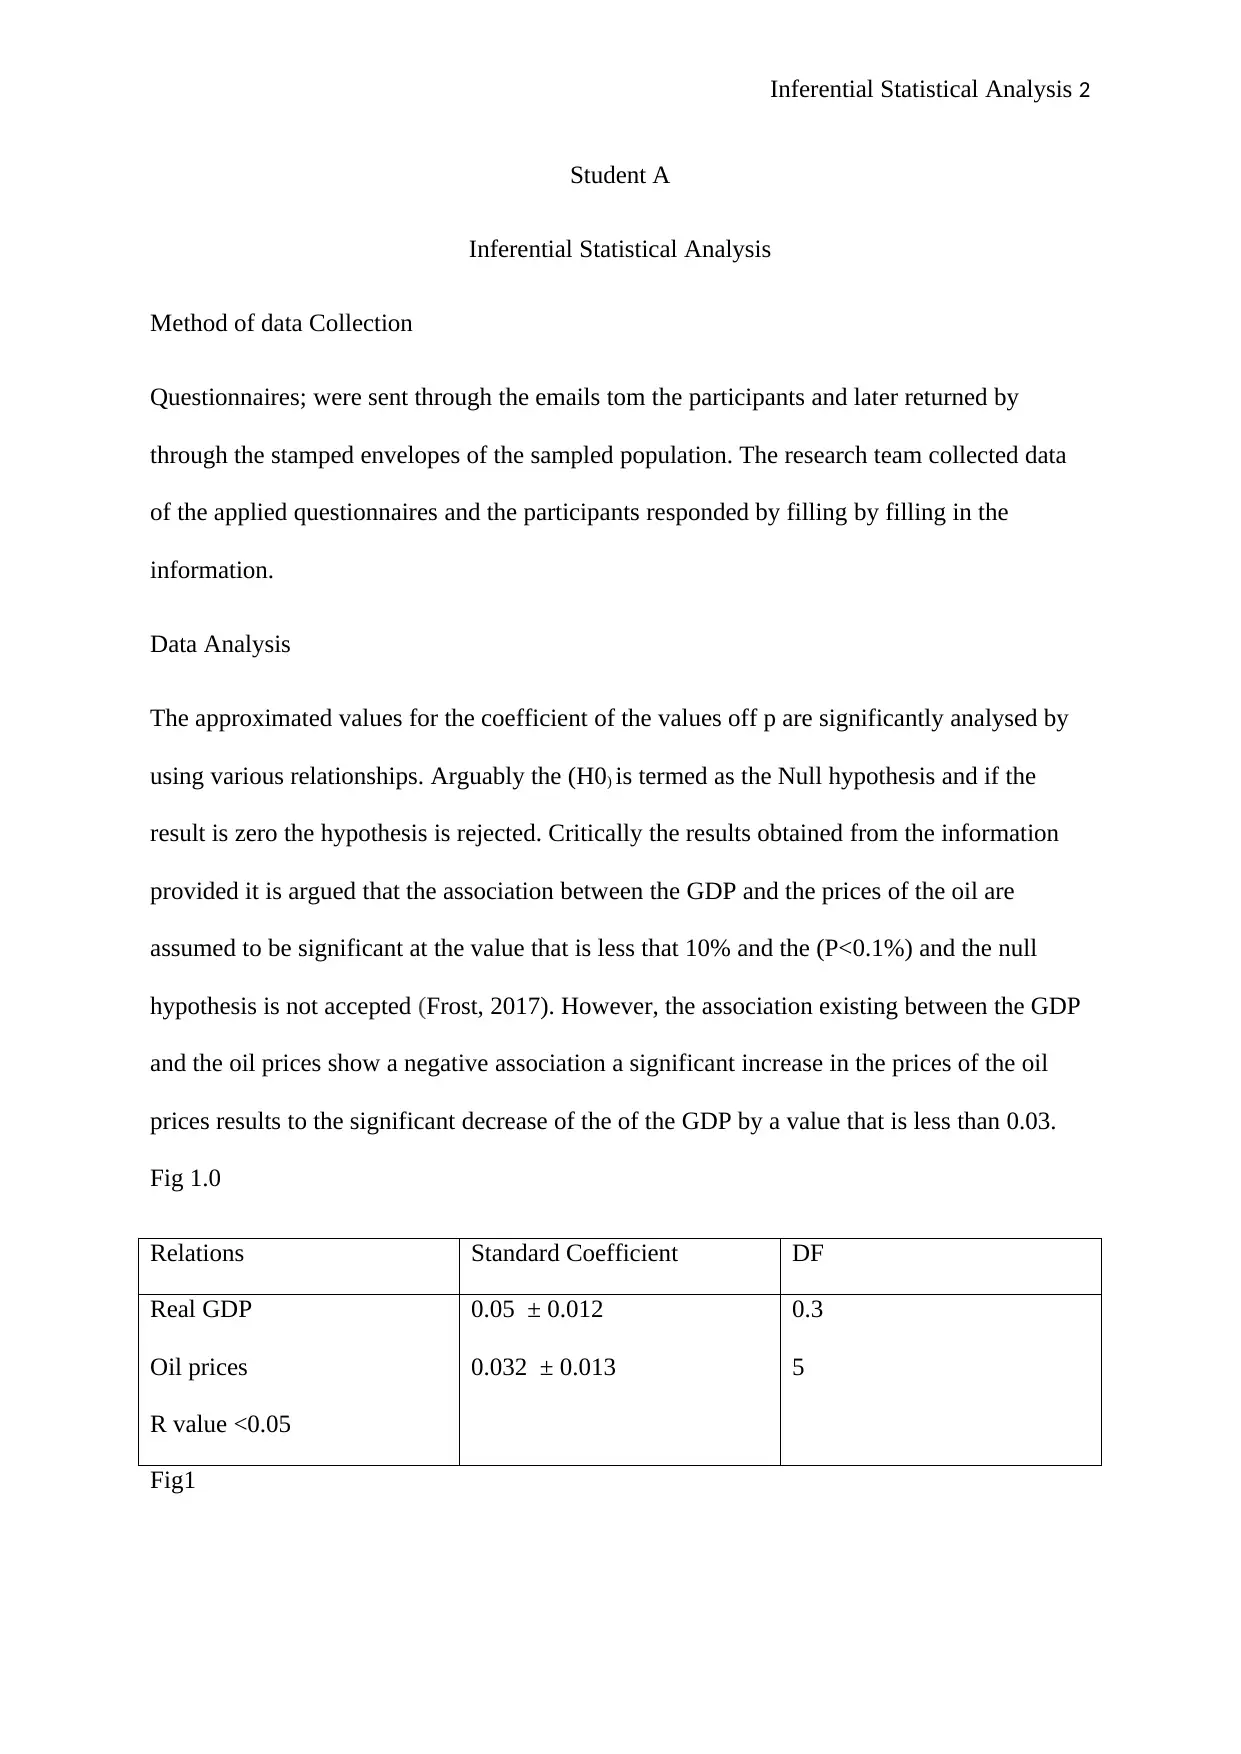
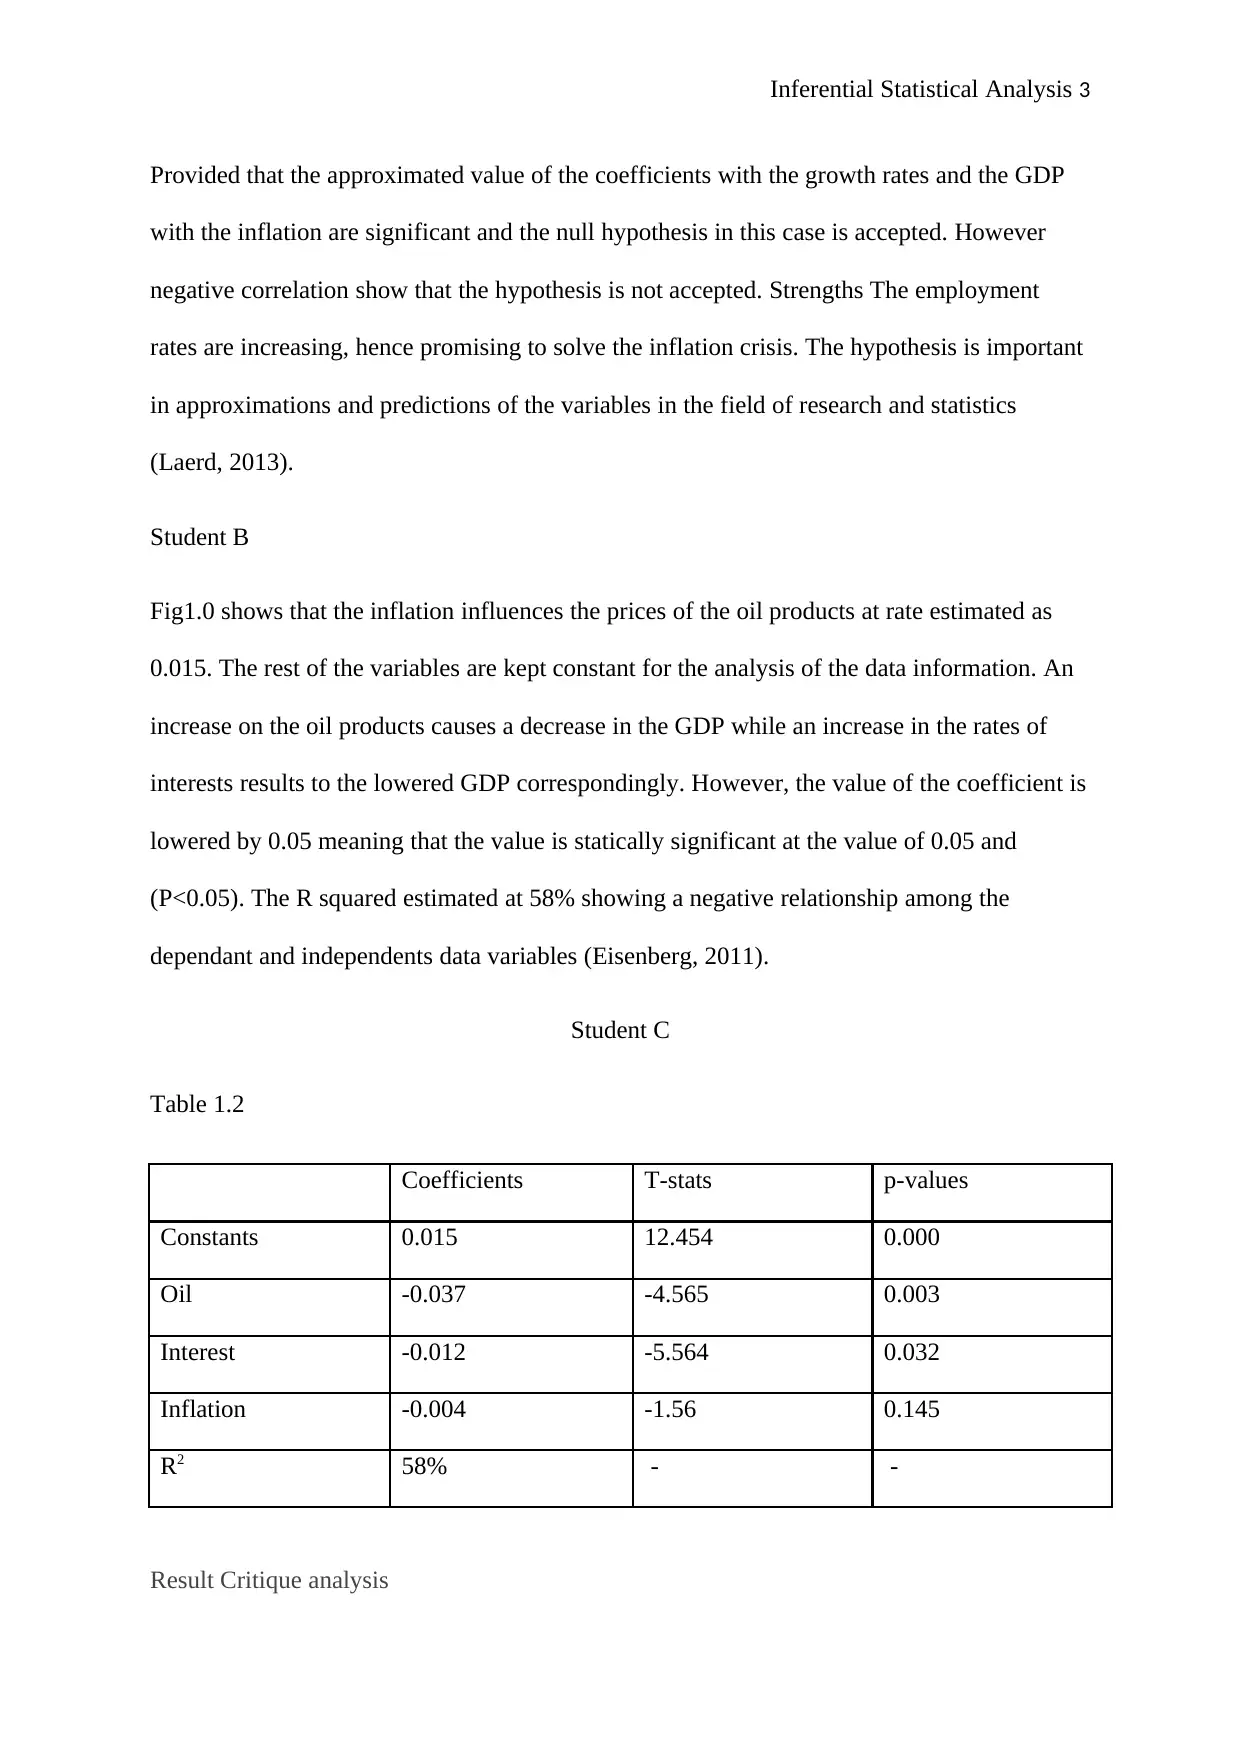
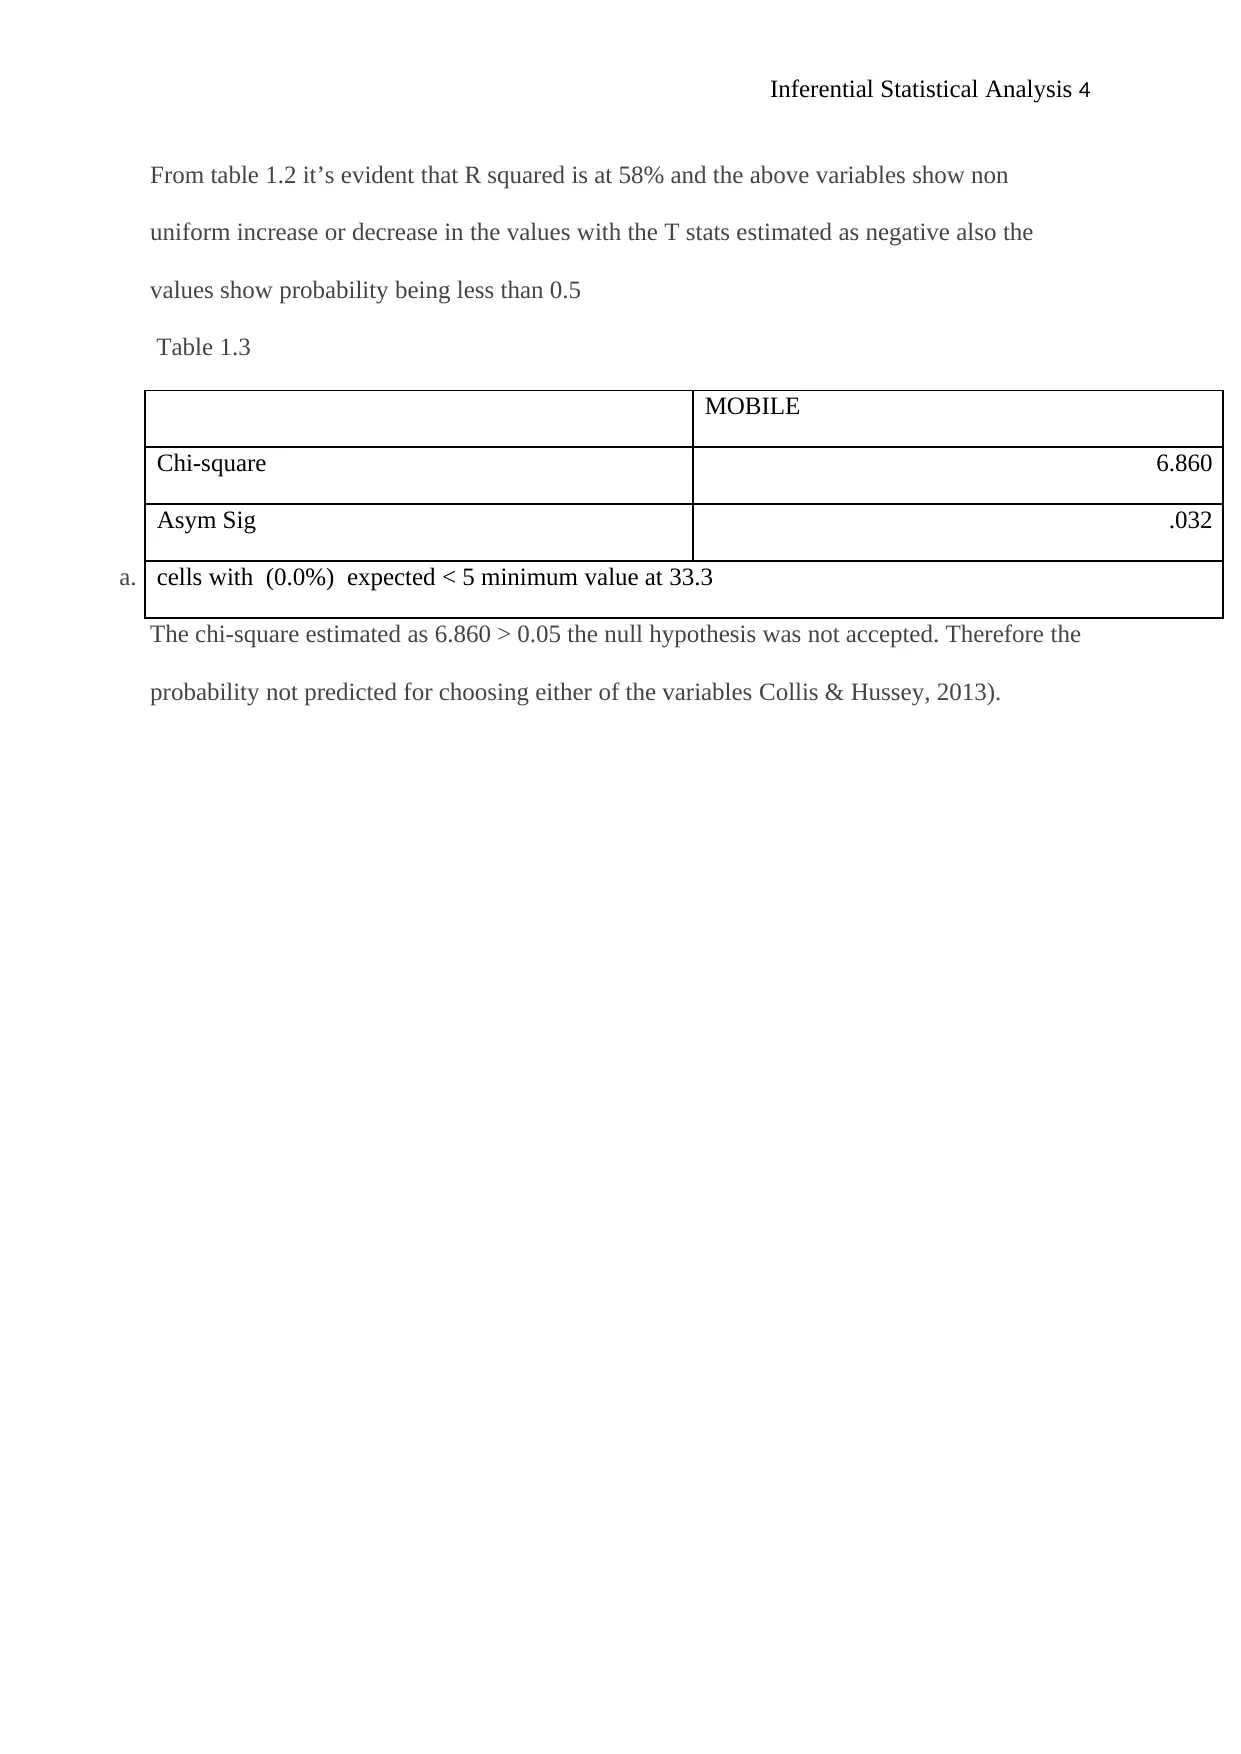
Report
AI Summary
This report presents an inferential statistical analysis, examining the relationships between GDP, oil prices, interest rates, and inflation. The analysis utilizes questionnaires for data collection and applies statistical methods to assess the significance of various correlations. The report includes interpretations of coefficients, p-values, and R-squared values to determine the acceptance or rejection of null hypotheses. The findings suggest a negative correlation between oil prices and GDP, as well as between interest rates and GDP. The report also provides tables summarizing the coefficients, t-stats, and p-values for each variable, along with a chi-square test. The strengths of the analysis include the application of statistical methods for predictions and approximations of variables. The report references several sources including books and online resources.
1 out of 5
Related Documents


Your All-in-One AI-Powered Toolkit for Academic Success.
+13062052269
info@desklib.com
Available 24*7 on WhatsApp / Email
![[object Object]](/_next/static/media/star-bottom.7253800d.svg)
Copyright © 2020–2026 A2Z Services. All Rights Reserved. Developed and managed by ZUCOL.