Statistics Assignment: MATH 1342 Module 7 - Cell Phone Ownership Study
VerifiedAdded on 2022/10/18
|4
|556
|14
Homework Assignment
AI Summary
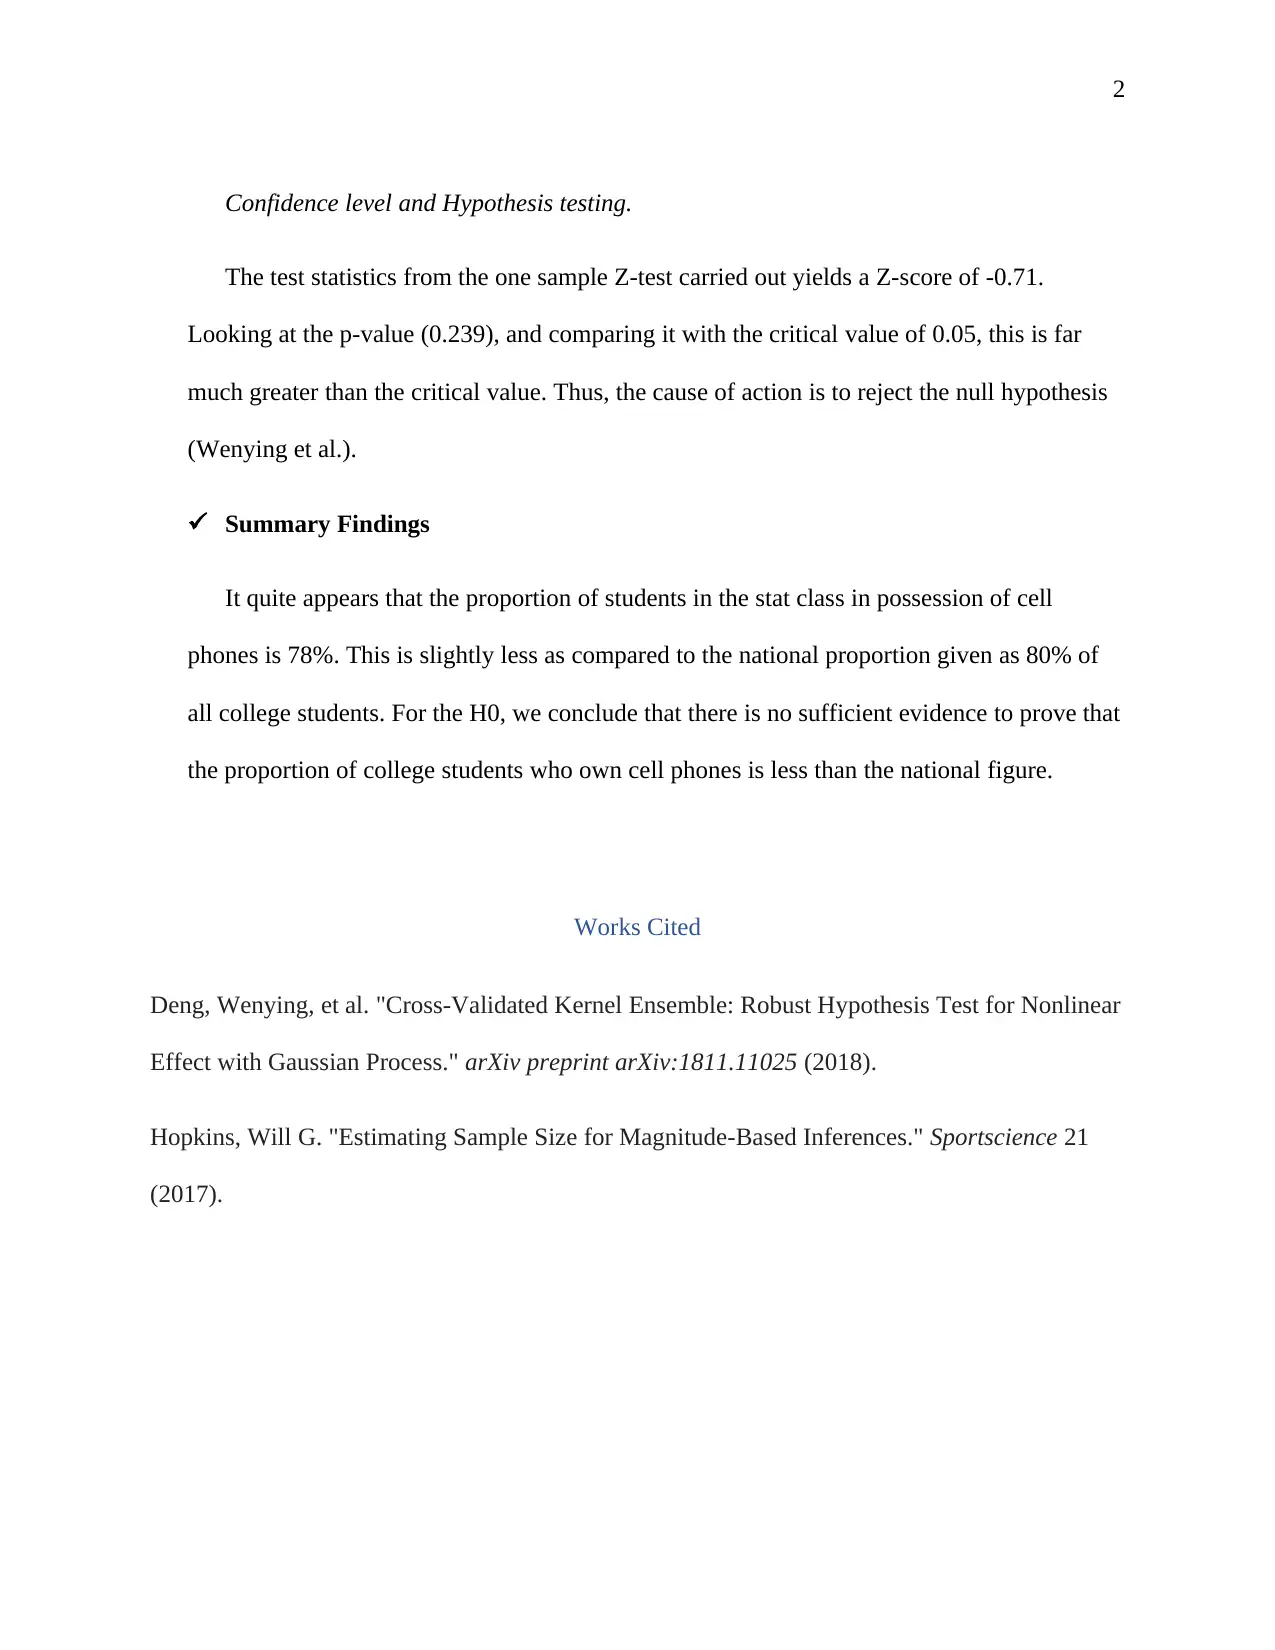
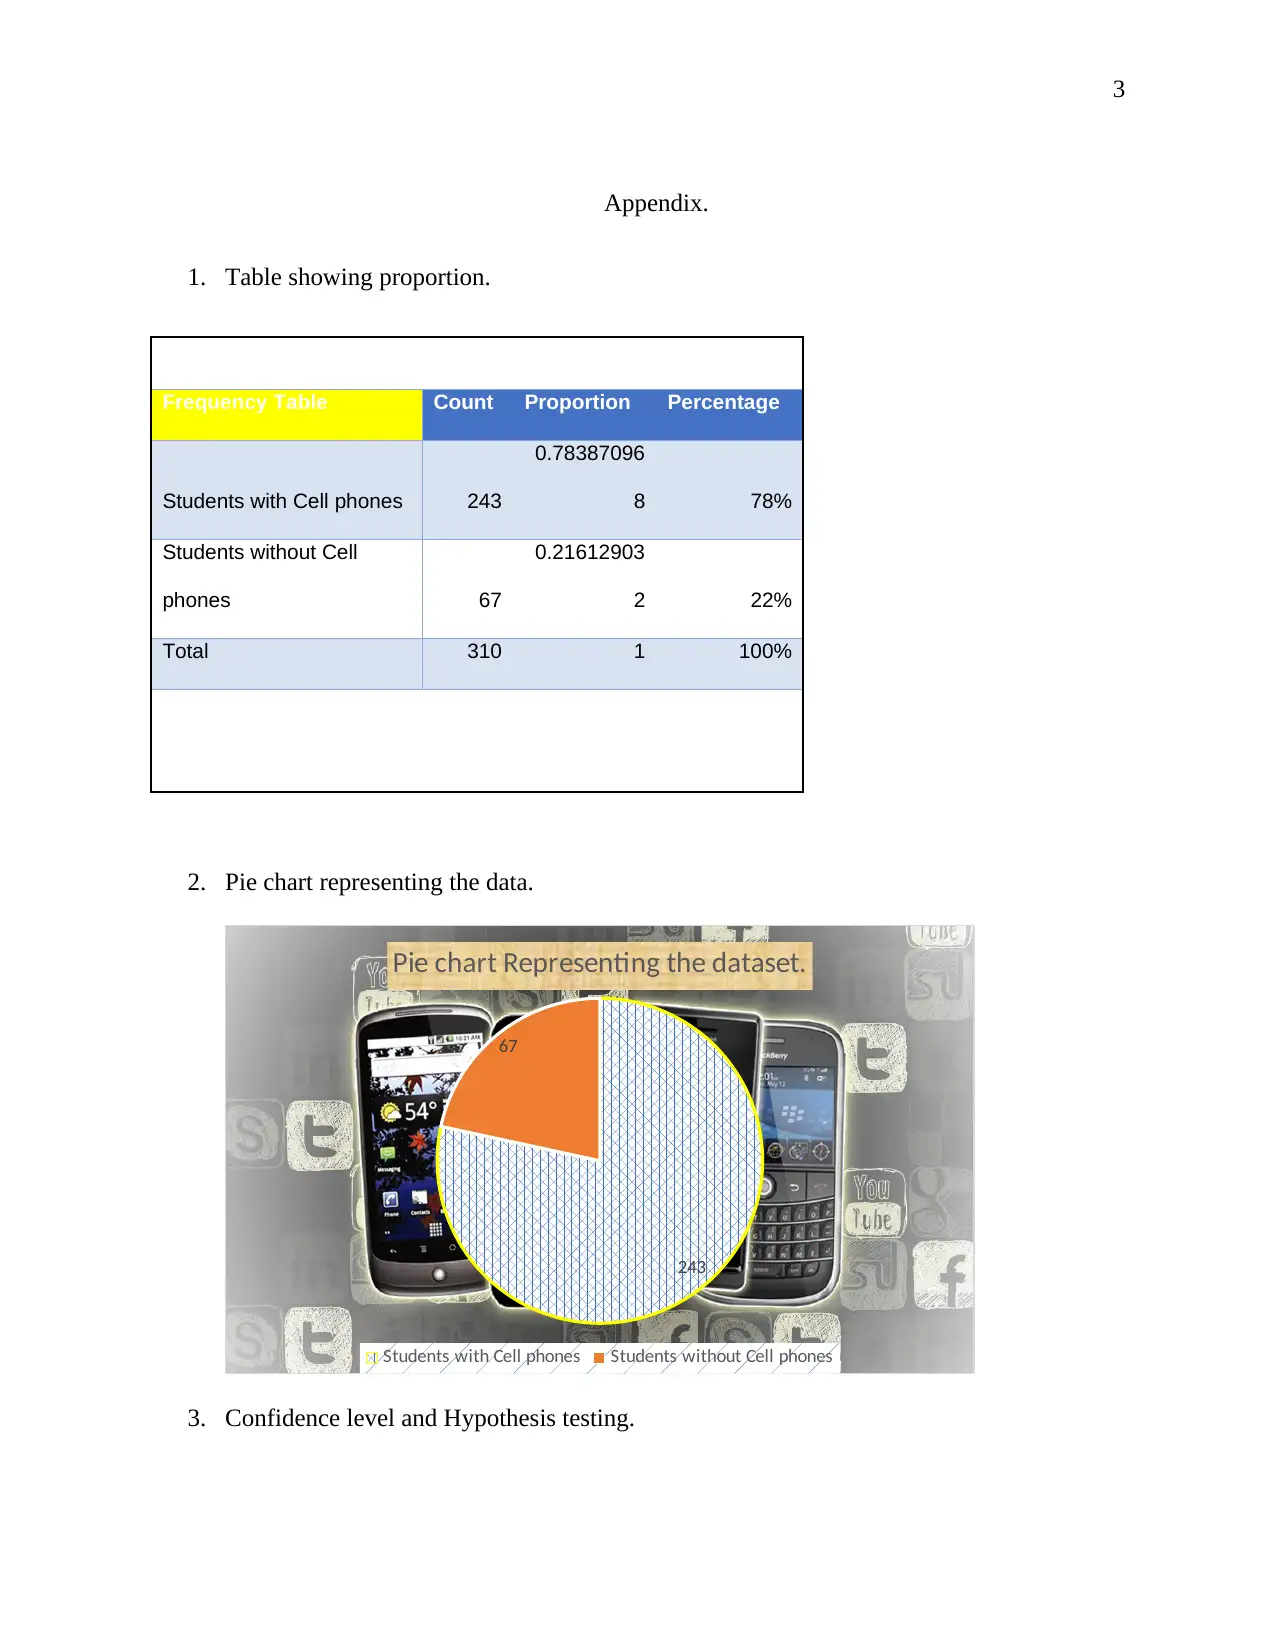
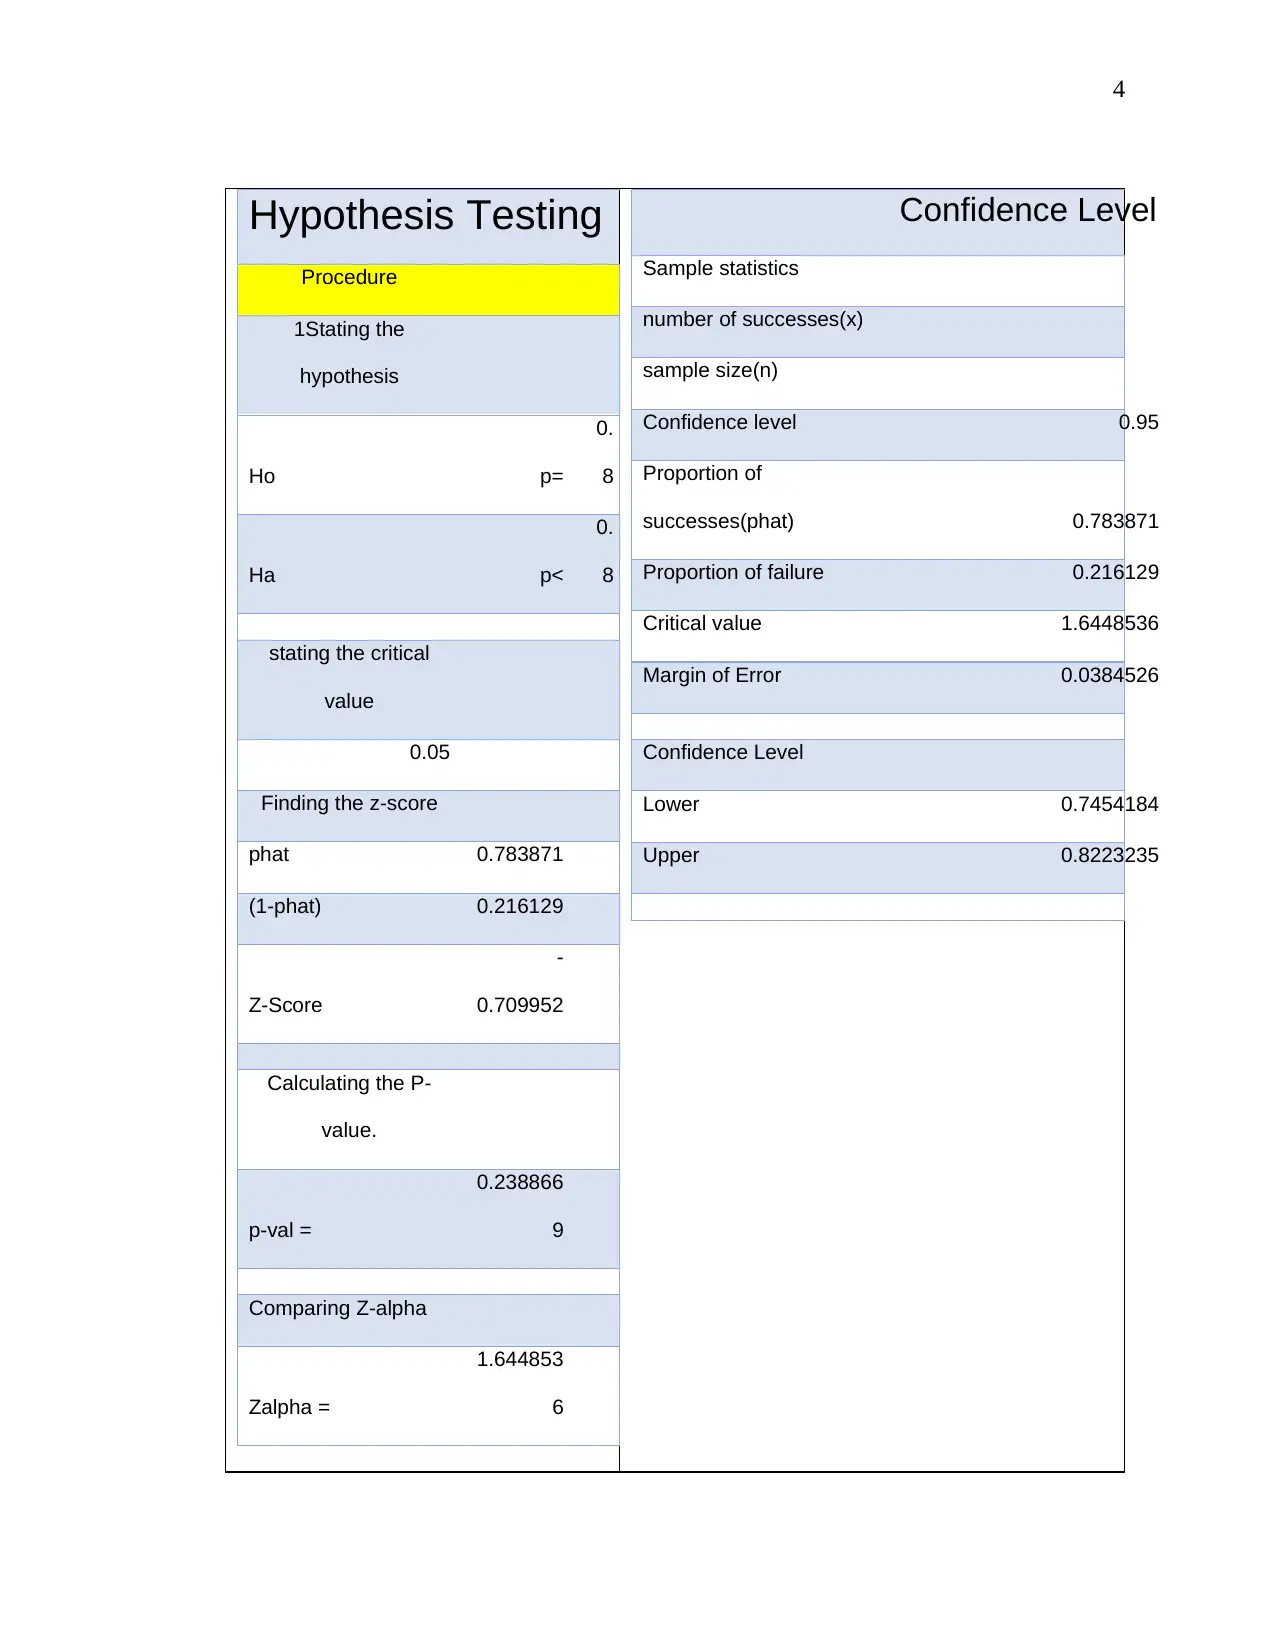
This assignment analyzes survey data from a statistics class to determine if the proportion of students owning cell phones at a large state university is lower than the national average of 80%. The student performs a one-sample Z-test and constructs a confidence interval to compare the sample proportion to the national proportion. The analysis includes identifying variables, exploring the data, and conducting hypothesis testing. The findings indicate that 78% of the students in the sample own cell phones, slightly less than the national average, and the null hypothesis is rejected. The assignment includes tables and a pie chart to represent the data and the calculations of Z-score, p-value, and confidence levels, along with works cited.
1 out of 4
Related Documents


Your All-in-One AI-Powered Toolkit for Academic Success.
+13062052269
info@desklib.com
Available 24*7 on WhatsApp / Email
![[object Object]](/_next/static/media/star-bottom.7253800d.svg)
Copyright © 2020–2025 A2Z Services. All Rights Reserved. Developed and managed by ZUCOL.