Financial Analysis: Money Supply, Inflation, and Leveraged Buyout
VerifiedAdded on 2021/01/02
|12
|3100
|327
Report
AI Summary
This report delves into the intricate relationship between money supply and inflation, analyzing the economic landscapes of Australia, Argentina, and South Africa. It examines the trends in money supply (M1 and M2 components) and inflation rates over recent years, providing insights into the factors influencing these economic indicators. Furthermore, the report investigates the leveraged buyout (LBO) of the UK National Grid Gas Division in Q4 2016, evaluating the suitability of the LBO approach. The analysis includes the financial details of the transaction, the involvement of various investors, and the strategic implications of the deal. The report considers the perspectives of the Financial Policy Committee (FPC) in assessing the transaction's impact on the UK's financial landscape. Overall, the report offers a comprehensive financial analysis, combining macroeconomic principles with a real-world case study to provide a nuanced understanding of financial markets and corporate transactions.

INTER STUDY
Paraphrase This Document
Need a fresh take? Get an instant paraphrase of this document with our AI Paraphraser
TABLE OF CONTENTS
INTRODUCTION...........................................................................................................................1
QUESTION 1...................................................................................................................................1
Analysing link between money supply and inflation in Australia...............................................1
Evaluate whether link between money supply and inflation has changed over last three year...2
Analysing link between money supply and inflation in Argentina..............................................2
Evaluate whether link between money supply and inflation has changed over last three year...3
Analysing link between money supply and inflation in South Africa.........................................4
Evaluate whether link between money supply and inflation has changed over last three year...4
QUESTION 2...................................................................................................................................5
Examining leveraged buyout of UK National Grid Gas Division in Q4 of 2016........................5
Evaluating suitability of leveraged buyout approach to transaction............................................7
CONCLUSION................................................................................................................................7
REFERNCES...................................................................................................................................9
INTRODUCTION
After UK decided to leave EU there were many challenges that are agreed upon through
all sort of uncertainty around domestic and global economic outlook. Then there were
movements in asset price like that of decrease in exchange rate of sterling to around 12% with
fall down in commercial real estate prices (CRE). In this current report discussion will be done
on what is the link between money supply and inflation in countries like that of Australia,
Argentina and South Africa with the changes in last three years. Then afterwards examination of
leveraged buyout of UK National Grid Gas Division in Q4 of 2016 will be evaluated as per the
view of FPC.
QUESTION 1
Analysing link between money supply and inflation in Australia
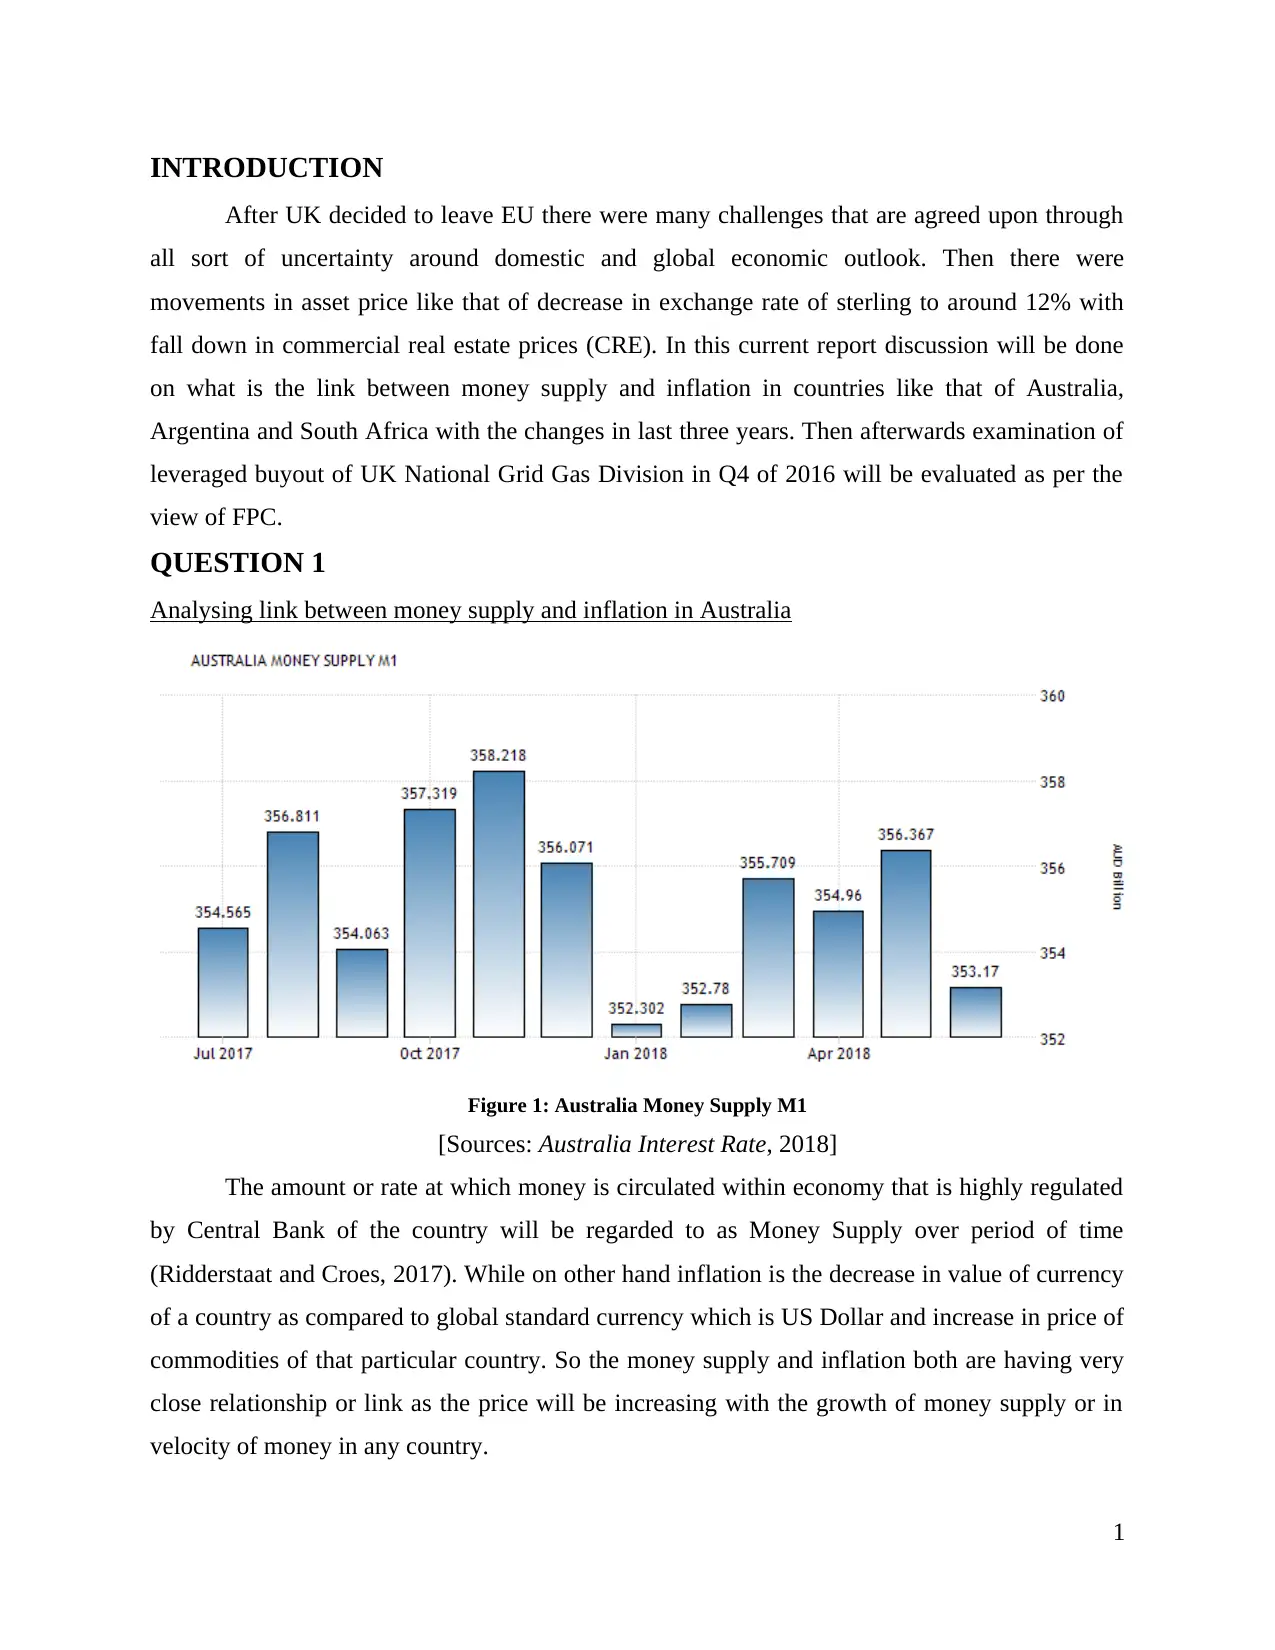
Figure 1: Australia Money Supply M1
[Sources: Australia Interest Rate, 2018]
The amount or rate at which money is circulated within economy that is highly regulated
by Central Bank of the country will be regarded to as Money Supply over period of time
(Ridderstaat and Croes, 2017). While on other hand inflation is the decrease in value of currency
of a country as compared to global standard currency which is US Dollar and increase in price of
commodities of that particular country. So the money supply and inflation both are having very
close relationship or link as the price will be increasing with the growth of money supply or in
velocity of money in any country.
1
After UK decided to leave EU there were many challenges that are agreed upon through
all sort of uncertainty around domestic and global economic outlook. Then there were
movements in asset price like that of decrease in exchange rate of sterling to around 12% with
fall down in commercial real estate prices (CRE). In this current report discussion will be done
on what is the link between money supply and inflation in countries like that of Australia,
Argentina and South Africa with the changes in last three years. Then afterwards examination of
leveraged buyout of UK National Grid Gas Division in Q4 of 2016 will be evaluated as per the
view of FPC.
QUESTION 1
Analysing link between money supply and inflation in Australia
Figure 1: Australia Money Supply M1
[Sources: Australia Interest Rate, 2018]
The amount or rate at which money is circulated within economy that is highly regulated
by Central Bank of the country will be regarded to as Money Supply over period of time
(Ridderstaat and Croes, 2017). While on other hand inflation is the decrease in value of currency
of a country as compared to global standard currency which is US Dollar and increase in price of
commodities of that particular country. So the money supply and inflation both are having very
close relationship or link as the price will be increasing with the growth of money supply or in
velocity of money in any country.
1
⊘ This is a preview!⊘
Do you want full access?
Subscribe today to unlock all pages.
Trusted by 1+ million students worldwide
Money supply is having many components which are altogether properly describing
velocity or flow of money over certain period of time. In year 2018, in Australia the M1
component of Money Supply was in month of May around 356.37 AUD billion and in June it
was 353.17 AUD billion (Galí, 2015). This money supply M1 from 1975 to 2018 was averaged
on 122.14 AUD billion while in 2017 November it was at its highest to 358.22 AUD billion.
While the inflation rate in Australia is 2-3% all over the time which is known to as targeted rate
of inflation in country.
Evaluate whether link between money supply and inflation has changed over last three year
Over the past years the inflation in Australia was close to 2% with the Customer Purchase
Index at 2.1%. this was forcasted that inflation in coming year of 2019 and 2020 will be higher
that it is in current time then in current year 2018 it is 1 ¾ %. The major reason behind this lower
down in inflation rate will be ease down in housing markets of Malbourne and Sydney and this is
also supporting Australian economy with lower down in interest rates (Friedman, 2017).
Analysing link between money supply and inflation in Argentina
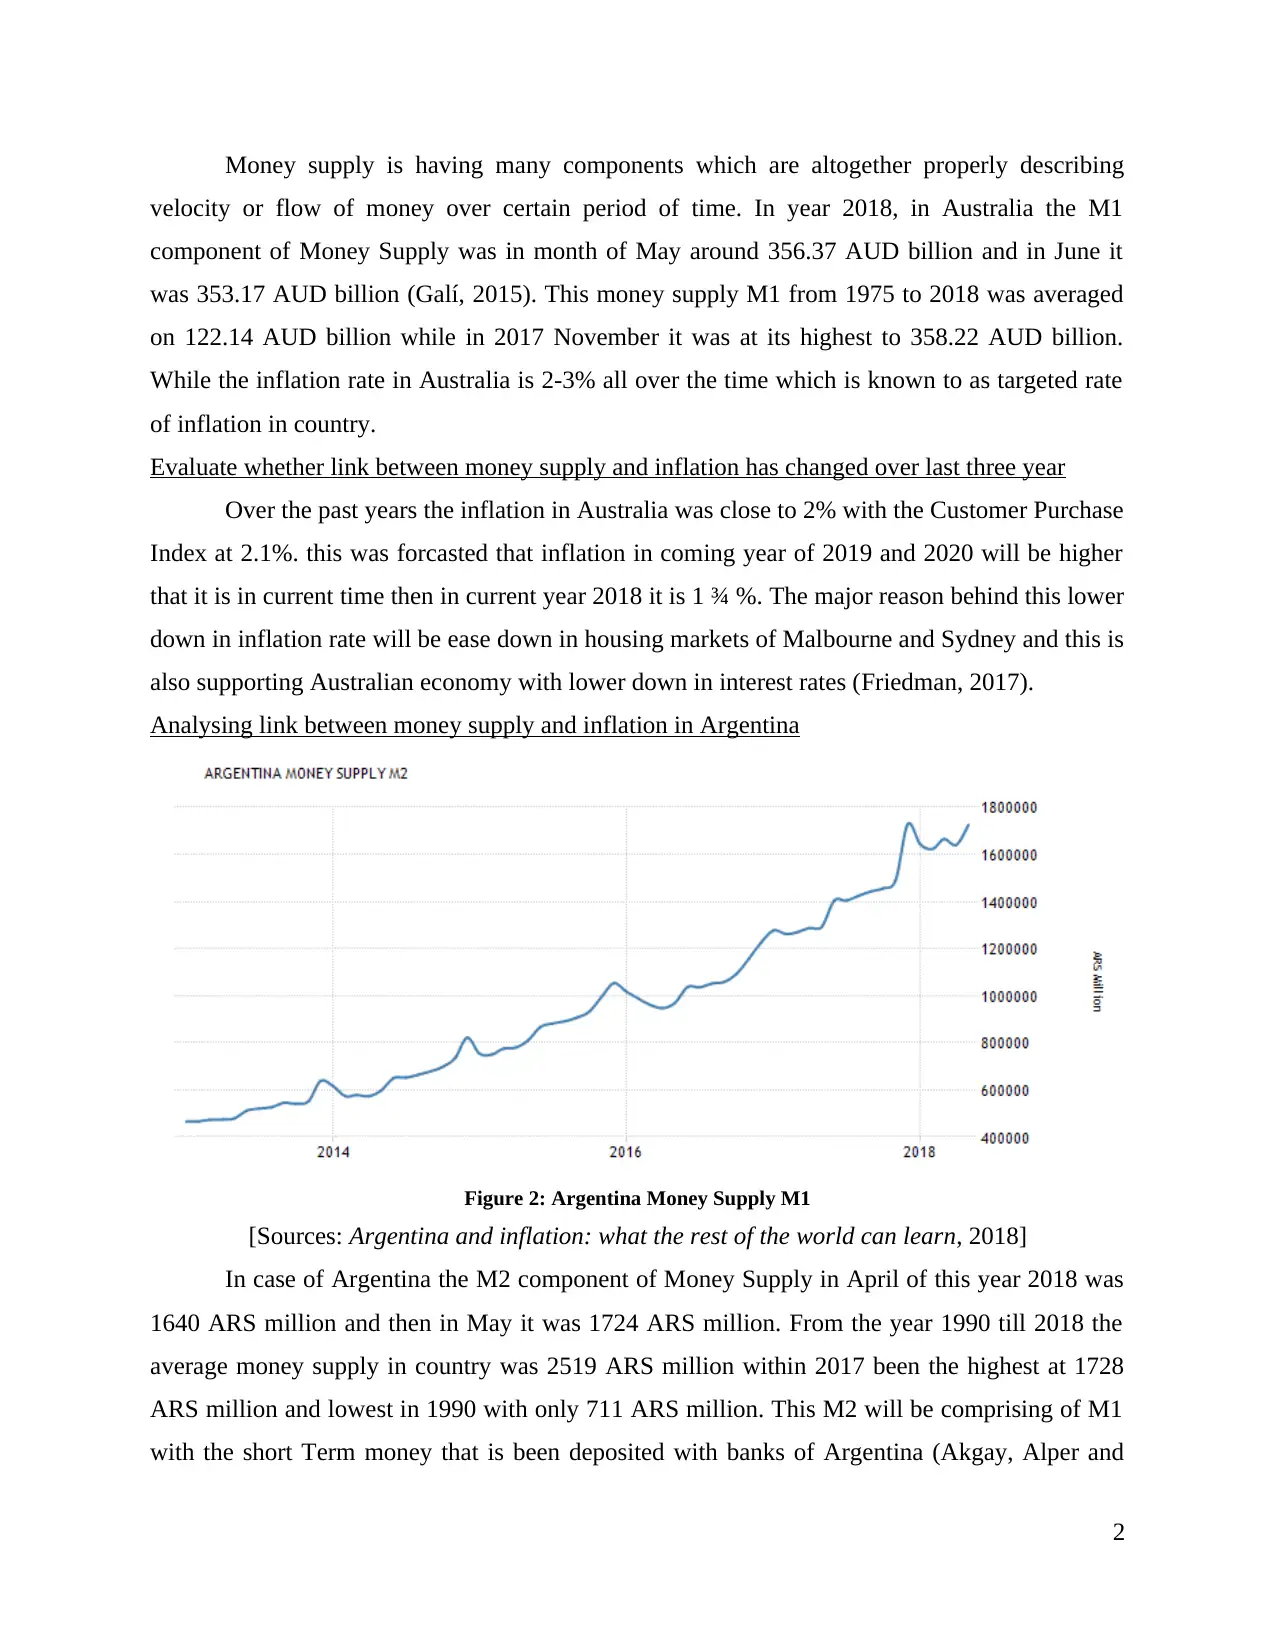
Figure 2: Argentina Money Supply M1
[Sources: Argentina and inflation: what the rest of the world can learn, 2018]
In case of Argentina the M2 component of Money Supply in April of this year 2018 was
1640 ARS million and then in May it was 1724 ARS million. From the year 1990 till 2018 the
average money supply in country was 2519 ARS million within 2017 been the highest at 1728
ARS million and lowest in 1990 with only 711 ARS million. This M2 will be comprising of M1
with the short Term money that is been deposited with banks of Argentina (Akgay, Alper and
2
velocity or flow of money over certain period of time. In year 2018, in Australia the M1
component of Money Supply was in month of May around 356.37 AUD billion and in June it
was 353.17 AUD billion (Galí, 2015). This money supply M1 from 1975 to 2018 was averaged
on 122.14 AUD billion while in 2017 November it was at its highest to 358.22 AUD billion.
While the inflation rate in Australia is 2-3% all over the time which is known to as targeted rate
of inflation in country.
Evaluate whether link between money supply and inflation has changed over last three year
Over the past years the inflation in Australia was close to 2% with the Customer Purchase
Index at 2.1%. this was forcasted that inflation in coming year of 2019 and 2020 will be higher
that it is in current time then in current year 2018 it is 1 ¾ %. The major reason behind this lower
down in inflation rate will be ease down in housing markets of Malbourne and Sydney and this is
also supporting Australian economy with lower down in interest rates (Friedman, 2017).
Analysing link between money supply and inflation in Argentina
Figure 2: Argentina Money Supply M1
[Sources: Argentina and inflation: what the rest of the world can learn, 2018]
In case of Argentina the M2 component of Money Supply in April of this year 2018 was
1640 ARS million and then in May it was 1724 ARS million. From the year 1990 till 2018 the
average money supply in country was 2519 ARS million within 2017 been the highest at 1728
ARS million and lowest in 1990 with only 711 ARS million. This M2 will be comprising of M1
with the short Term money that is been deposited with banks of Argentina (Akgay, Alper and
2
Paraphrase This Document
Need a fresh take? Get an instant paraphrase of this document with our AI Paraphraser
Ozmucur, 2018). While the rate of inflation in Argentina is currently about 25.4% and its central
bank is using many tools and techniques to dispose of this inflation to 15%. The value of
currency of Argentina is also declining from the current rate at 18.6% with the government is
making their efforts in reversing their policies of protectionism and spending high on
infrastructure of country as well.
Evaluate whether link between money supply and inflation has changed over last three year
The annual rate of inflation in Argentina in year 2017 was about 20% which was in year
2016 estimated to as 40%. The Central bank of Argentina was struggling in order to keep their
economy stable and out of this disinflationary path as their goal was to achieve 5% of rate for
next three years (Bernanke, Laubach and Posen, 2018). The collapse of dollar peg of peso in the
non-market exchange rate was the main reason of increase in inflation rate and then which
finally had the highest rate in 2016 for 40%.
This all recent high increase rate of inflation and estimation of even higher rates were all
taking part in harming the economy of Argentina. It was noticed that there was increase in
interest rates in order to compensate this from higher inflation and then government was buying
peso at rate of 25% (Hung and Thompson, 2016). In this context as well all lenders of country
were reluctant to give a long term credit to borrowers that too at some fixed interest rates as if
they did so then due to inflation value of bonds and loans will be lower down. Other than this the
household sector which the real estate will also not willing to give long term loan that too at
variable interest rates as this will also be causing rise in payments as well. None of the sector or
industry was left untouched with this effect of inflation rate as life insurance sector.
3
Analysing link between money supply and inflation in South Africa
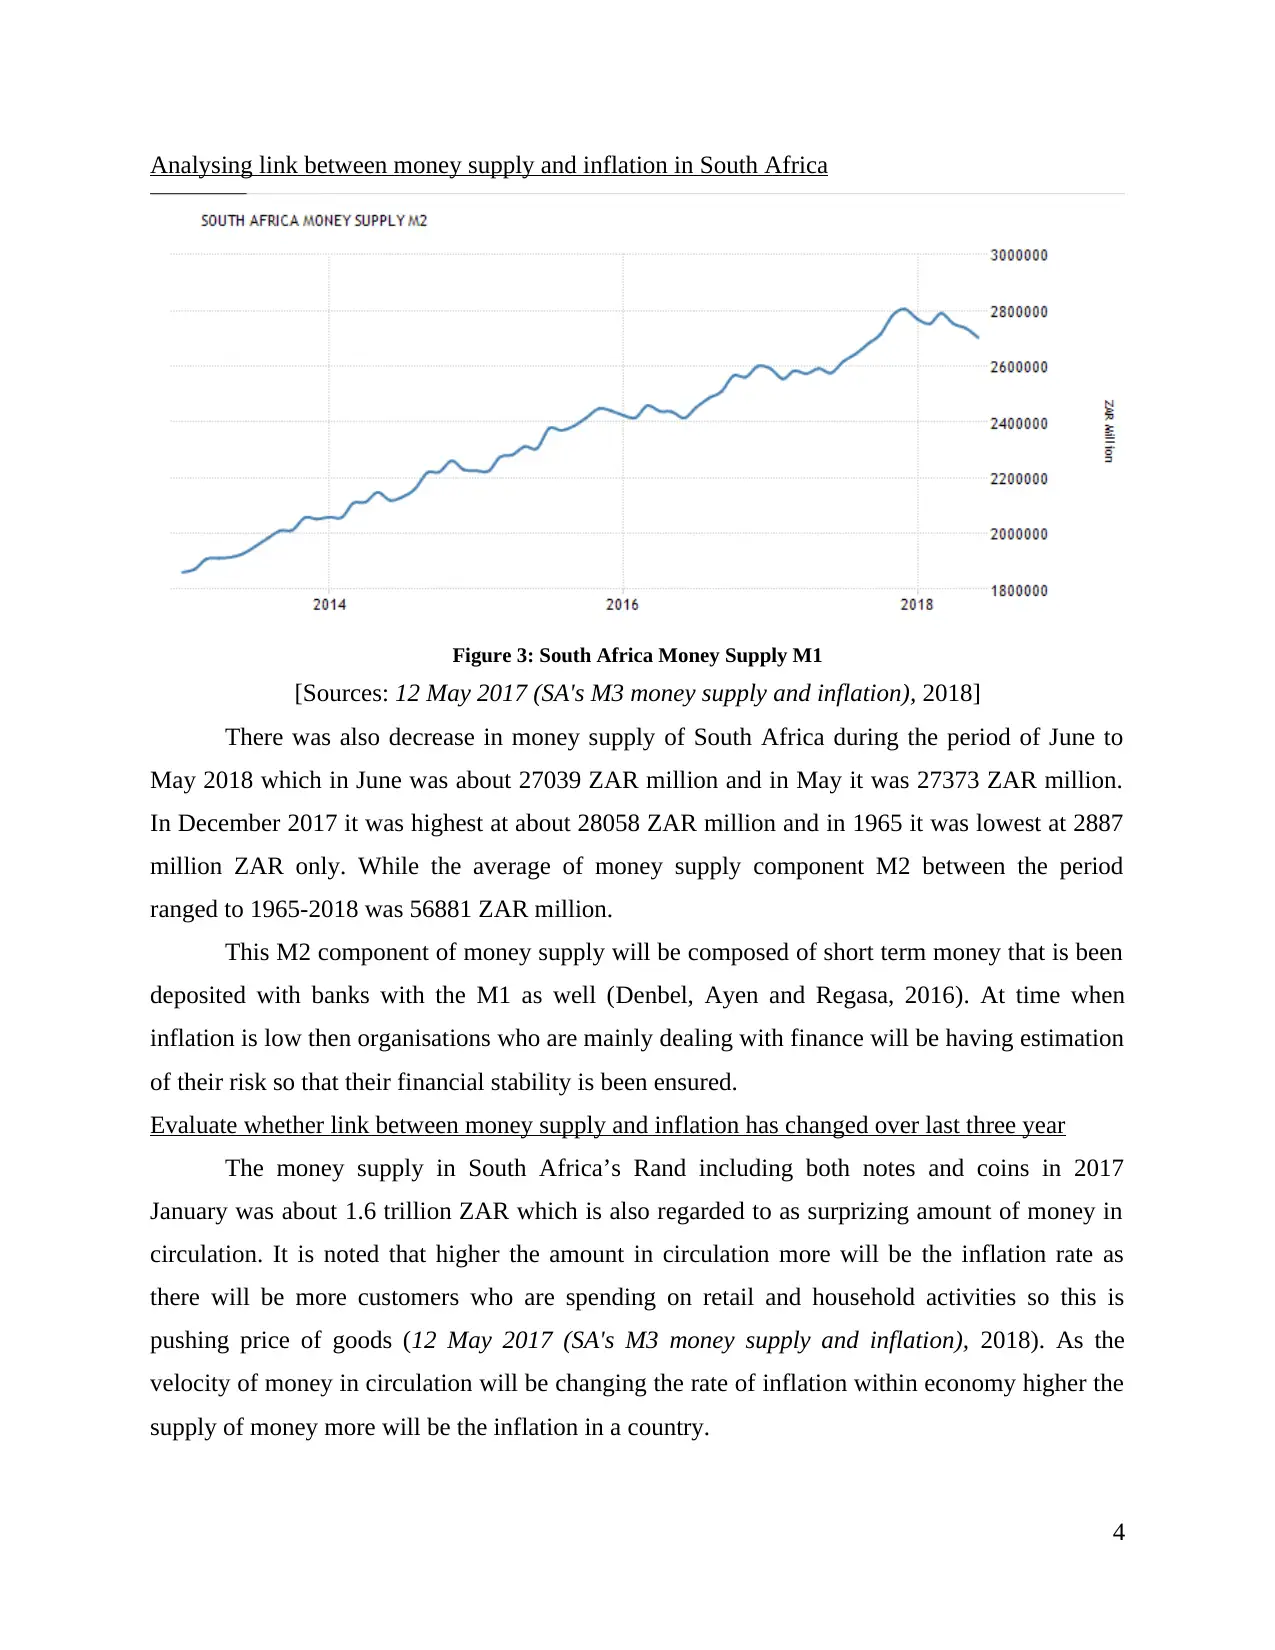
Figure 3: South Africa Money Supply M1
[Sources: 12 May 2017 (SA's M3 money supply and inflation), 2018]
There was also decrease in money supply of South Africa during the period of June to
May 2018 which in June was about 27039 ZAR million and in May it was 27373 ZAR million.
In December 2017 it was highest at about 28058 ZAR million and in 1965 it was lowest at 2887
million ZAR only. While the average of money supply component M2 between the period
ranged to 1965-2018 was 56881 ZAR million.
This M2 component of money supply will be composed of short term money that is been
deposited with banks with the M1 as well (Denbel, Ayen and Regasa, 2016). At time when
inflation is low then organisations who are mainly dealing with finance will be having estimation
of their risk so that their financial stability is been ensured.
Evaluate whether link between money supply and inflation has changed over last three year
The money supply in South Africa’s Rand including both notes and coins in 2017
January was about 1.6 trillion ZAR which is also regarded to as surprizing amount of money in
circulation. It is noted that higher the amount in circulation more will be the inflation rate as
there will be more customers who are spending on retail and household activities so this is
pushing price of goods (12 May 2017 (SA's M3 money supply and inflation), 2018). As the
velocity of money in circulation will be changing the rate of inflation within economy higher the
supply of money more will be the inflation in a country.
4
⊘ This is a preview!⊘
Do you want full access?
Subscribe today to unlock all pages.
Trusted by 1+ million students worldwide
QUESTION 2
Examining leveraged buyout of UK National Grid Gas Division in Q4 of 2016
Leveraged buyout (LBO) is that process under which the company will be able to control
its share with management of outside capital and this is done by purchasing the other company
(What Is A Leveraged Buyout (LBO), 2018). Under this at time when company is performing to
purchase the other one need to only provide certain part of their financing thus they would be
able to make larger purchase with using leverage or debt. In this current scenario all new
investors will need to have 50% of equity and 50% of debt. The amount of interest paid on the
debt will be lower than the income or return generated on income so this is very good way out to
generate higher income with lower amount of risk included in this capital. Then it is considered
that buyer of company will need to put their more sum of money into buying the other one so for
this buyer firm should be in stable condition so that they could be able to pay their debts and
chance of bankruptcy will increase.
National Grid Gas Division is a British multinational company which is dealing in gas
and electricity utilities with having activities in both USA and UK. In the 4th Quarter of 2016
dated December 8th of 2016 National Grid Gas Division of UK agreed upon to sale its majority
of shares to group of investors in Chinese and Qatari wealth funds with a deal of worth £13.8
billion (Cumming and Fleming, 2016). Then they also decided to give about 61% of
shareholding to the Australian bank including the China Investment Corporation (CIC), Qatar
Investment Authority and Hermes and Allianz who are the fund managers. In month of
September there were certain rules regarding foreign investment within country which were
announced by government of UK for the testing of which this sale or deal was initiated. For
benefiting energy consumers in Britain with amount £150 million Company declared to return
about £4 billion to its shareholders.
5
Paraphrase This Document
Need a fresh take? Get an instant paraphrase of this document with our AI Paraphraser
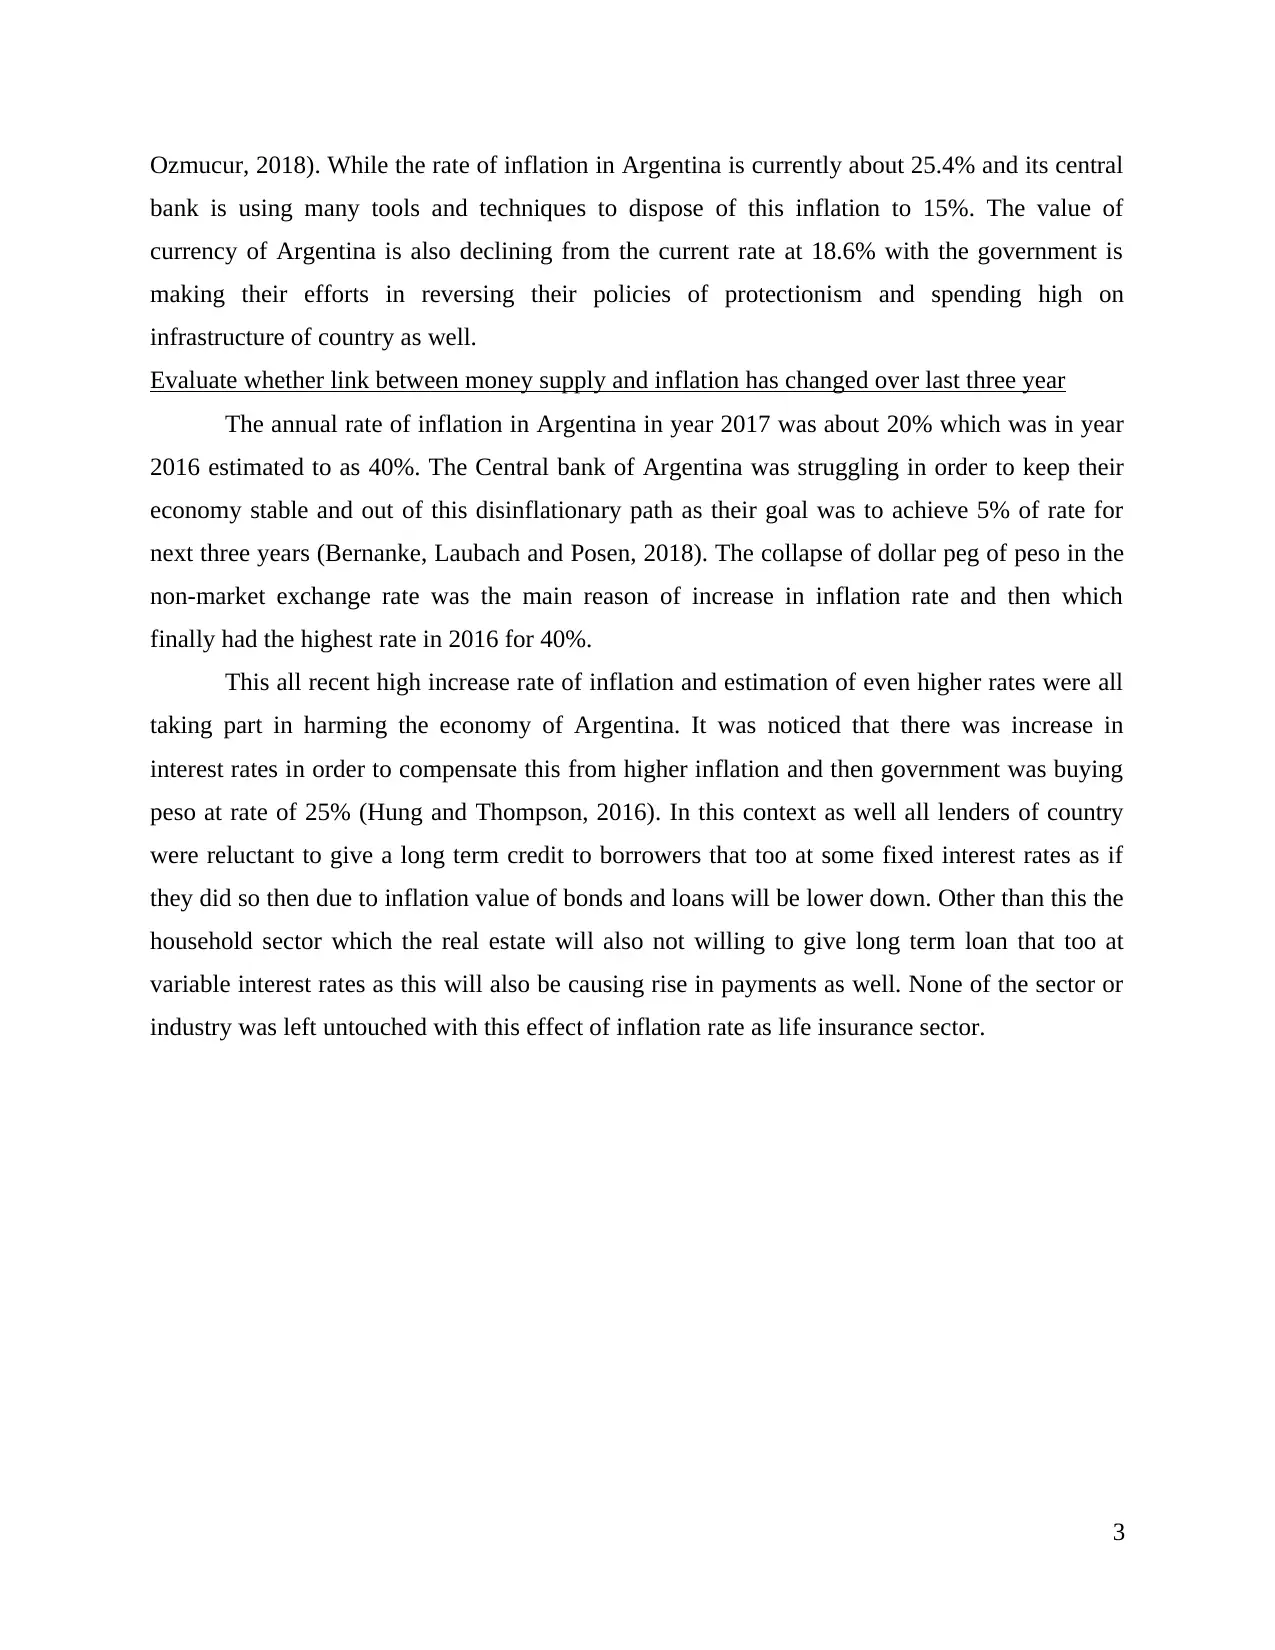
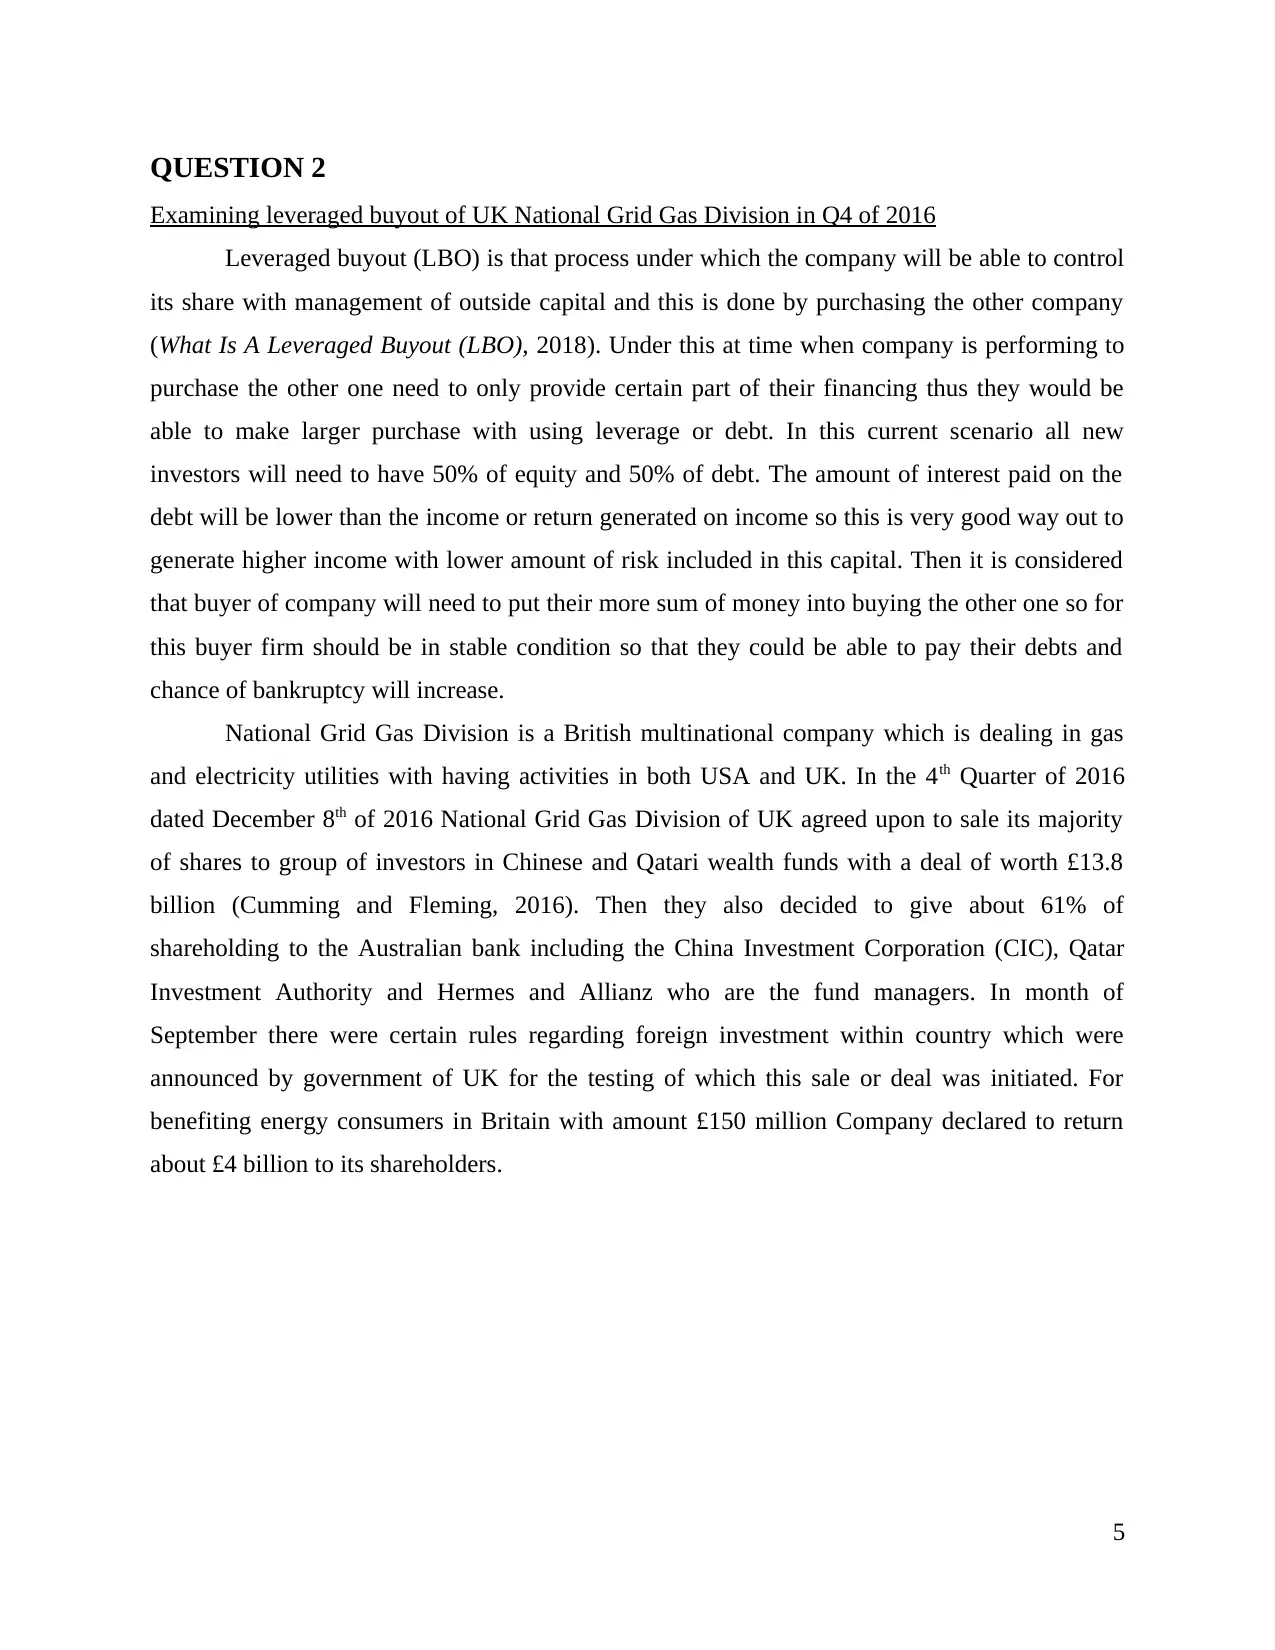
Figure 4: National Grid Gas UK Division
[Source: National Grid sells majority stake in UK gas infrastructure to Chinese and Qatari state
investors, 2018]
The company will be receiving cash stake for its gas arm of amount £3.6 billion and then
the debt financing for the amount £1.8 billion with keeping stake of about 31% of share with
themselves. Other than this CIC and Macquarie will be having the largest share in this which is
about 10.5% and 14.5% respectively then 102.5 of share will be with Allianz and 8.5% will be
with Qataris. This was one of the biggest infrastructure deal of UK which included the division
of amount to about £13.8 billion that too including the debt of £1.8 billion (Locatelli, Palerma
and Mancini, 2015). All the parties which are included within this were the potential buyers for
future sales as they were interested in 14% extra stake in the distribution in the near future if
National Grid Gas is conducting in future then. This UK division of National Grid Gas is the
most important part of infrastructure of company as this is indulges in providing about 82000
miles of gas lines to about 11 million households of London, North west England and West
Midlands which is generating about £403 million of operating profits (National Grid sells
majority stake in UK gas infrastructure to Chinese and Qatari state investors, 2018). Thus this
leverage buyout is concern with ownership of critical national assets while there is very low rate
in gas business but on same time it is much mature at its level as well.
6
The transaction was based on receiving approval from EU and one of the biggest
investments made by China in any western countries. The energy regulator within this deal will
be that of Ofgem while the monopoly would be of Macquarie.
Evaluating suitability of leveraged buyout approach to transaction
Within this method when company is purchasing the other one with using major debt
capital then the new owner of firm will be using cash flow to acquire and generate income to
overcome that debt (Baker, 2016). So under this method it becomes essential that buyer is
planning to buy that company which is having more money to finance or is having that much
potential either. In the case of National grid gas UK division leverage buyout approach was the
best suited decision as the company is having that much potential to overcome all sort of debt in
the future. For its buyers it is the best opportunity to provide good amount of profits or returns as
their targeted company will be having profitable as well.
While this could also call for their restructuring of operations as mismanagement will be
one of the biggest problem in this context of production inefficiencies as well. This approach of
leveraged buyout will be best suited for National Grid gas that is been adopted by them for the
restructuring of their corporate firm. Leveraged buyout will be having modification of all
managers in eliminating the departments which are not required to expense upon. Other than this
it will also be involving taking all business which is in hands of public firms and ready for going
in private hands. This simply means that all the shares of firm rather than going to only certain
number of buyers of large group will be with smaller group who all are owing larger number of
shares in firm. This type of structural change will also be having certain tax benefits for firms
with having the above mentioned advantages (Locatelli, Palerma and Mancini, 2015). So is the
case with National Grid Gas Division of UK as they will be having tax benefits like that of
improved economies of scale and increase in market penetration as well. The tax benefits will
include like that of tax shields, companies are allowed to deduct all interest paid on debt like that
of expenses and not the dividend which are paid to all equity shareholders and this is not
regarded to as expense.
CONCLUSION
From the above report it is concluded that leverage buyout method for National Grid Gas
UK division is best and suitable for improving and enhancing their profits in near coming future.
If the company is not calculating the correct profits or returns at initial stage only then this would
7
⊘ This is a preview!⊘
Do you want full access?
Subscribe today to unlock all pages.
Trusted by 1+ million students worldwide

be becoming difficult for them to manage in future terms and then transaction leading to
bankruptcy. Then it is also concluded that money supply and inflation is having direct
relationship which means that if one is increasing other one would also increase. The circulation
of money in country if leading to increase then this would be causing or leading to rise in
inflation.
8
bankruptcy. Then it is also concluded that money supply and inflation is having direct
relationship which means that if one is increasing other one would also increase. The circulation
of money in country if leading to increase then this would be causing or leading to rise in
inflation.
8
Paraphrase This Document
Need a fresh take? Get an instant paraphrase of this document with our AI Paraphraser
REFERNCES
Books and Journals:
Akgay, O.C., Alper, C.E. and Ozmucur, S., 2018. Budget Deficit, Inflation and Debt
Sustainability: Evidence from Turkey, 1970-2000. In Inflation and Disinflation in
Turkey (pp. 83-102). Routledge.
Baker, F., 2016. Have technology specific measures for the UK electricity market reform gone
far enough. J. Clean Energy Technol, 4(2).
Bernanke, B.S., Laubach, T., and Posen, A.S., 2018. Inflation targeting: lessons from the
international experience. Princeton University Press.
Cumming, D. and Fleming, G., 2016. Taking China private: The Carlyle Group, leveraged
buyouts and financial capitalism in Greater China. Business History, 58(3), pp.345-363.
Denbel, F.S., Ayen, Y.W. and Regasa, T.A., 2016. The relationship between inflation, money
supply and economic growth in Ethiopia: Co integration and Causality
Analysis. International Journal of Scientific and Research Publications, 6(1), pp.556-565.
Friedman, M., 2017. Quantity theory of money. The new Palgrave dictionary of economics,
pp.1-31.
Galí, J., 2015. Monetary policy, inflation, and the business cycle: an introduction to the new
Keynesian framework and its applications. Princeton University Press.
Hung, H.F. and Thompson, D., 2016. Money supply, class power, and inflation: Monetarism
reassessed. American Sociological Review, 81(3), pp.447-466.
Locatelli, G., Palerma, E. and Mancini, M., 2015. Assessing the economics of large Energy
Storage Plants with an optimisation methodology. Energy, 83, pp.15-28.
Ridderstaat, J. and Croes, R., 2017. The link between money supply and tourism demand cycles:
A case study of two Caribbean destinations. Journal of Travel Research, 56(2), pp.187-
205.
Online:
Argentina and inflation: what the rest of the world can learn. 2018. [Online]. Accessed through:
<https://www.weforum.org/agenda/2017/01/argentina-and-inflation-what-the-rest-of-the-
world-can-learn>.
Australia Interest Rate. 2018. [Online]. Accessed through:
<https://tradingeconomics.com/australia/interest-rate>.
9
National Grid sells majority stake in UK gas infrastructure to Chinese and Qatari state
investors. 2018. [Online]. Accessed through: <
ttps://www.independent.co.uk/news/business/news/national-grid-sells-shares-china-qatar-
investors-a7463256.html>.
What Is A Leveraged Buyout (LBO). 2018. [Online]. Accessed through:
<https://www.wallstreetoasis.com/what-is-a-leveraged-buyout-lbo>.
12 May 2017 (SA's M3 money supply and inflation). 2018. [Online]. Accessed through:
<https://www.southafricanmi.com/blog-12may2017.html>.
10
⊘ This is a preview!⊘
Do you want full access?
Subscribe today to unlock all pages.
Trusted by 1+ million students worldwide
1 out of 12