Comprehensive Report: User Testing of an Interactive AutoCAD System
VerifiedAdded on 2021/04/21
|25
|5738
|24
Report
AI Summary
This report details the user testing of the AutoCAD interactive system, a complex CAD program used by various professionals. The study evaluates the performance of users categorized as beginners, intermediate, and advanced, on specific use cases: importing saved layer settings (dimension, color, and text styles), inserting blocks from other drawings, and quantity estimation. The evaluation methodology involved users performing these tasks, noting goals, procedures, commands, and estimated times. Post-task, users provided feedback on inputs, icon identification, layout complexity, command usage, shortcut keys, text and image quality, time taken, efficiency, errors, monotony, task effectiveness, autonomy, and satisfaction. The findings aim to determine human factors influencing user interaction and capabilities within AutoCAD, assessing their ability to utilize commands, elements, and tools, including layers, blocks, and dimensions, along with their understanding of shortcut keys. The tasks were conducted using AutoCAD 2014 in a university computer lab.

User Testing of an Interactive System 1
USER TESTING OF AN INTERACTIVE SYSTEM
Name
Course
Professor
University
City/state
Date
USER TESTING OF AN INTERACTIVE SYSTEM
Name
Course
Professor
University
City/state
Date
Paraphrase This Document
Need a fresh take? Get an instant paraphrase of this document with our AI Paraphraser
User Testing of an Interactive System 2
Table of Contents
Part ONE: The interactive system and its users......................................................................................3
Part TWO: The use cases..........................................................................................................................4
Part THREE: The evaluation methodology............................................................................................6
Evaluation procedure............................................................................................................................6
User tasks...............................................................................................................................................7
Task descriptions...................................................................................................................................9
Debriefing procedure..........................................................................................................................10
Part FOUR: The evaluation....................................................................................................................11
Evaluation performance......................................................................................................................11
Evaluating results................................................................................................................................11
Part FIVE: The findings of the evaluation............................................................................................20
References................................................................................................................................................22
User Testing of an Interactive System 3
Part ONE: The interactive system and its users
The interactive system evaluated in this report is AutoCAD. AutoCAD is a computer-
aided design (CAD) program or software that is used to create technical 2D or 3D drawings,
models or illustrations of buildings, machines, computer chips, manufacturing goods, bridges,
roads, fashion products, etc. This is one of the most complex interactive systems. It is used by
different professionals such as engineers, architects, designers, artists, drafters (civil drafters,
mechanical drafters, electrical drafters, architectural drafters, electrical drafters and electronics
drafters), contractors, building managers, game developers, 3D animators, graphic designers,
product manufacturers, prototype designers, and inventors, among others. Though largely used in
engineering field, AutoCAD software also has applications in different other fields such as
fashion and medicine/healthcare (Letafatkar, et al., 2011). The professionals that use AutoCAD
are assumed to have been trained on how to use the software and fully understand CAD
principles. Therefore users of AutoCAD must possess requisite technical knowledge and skills.
Nevertheless, AutoCAD is also used as a learning tool that enhances students’ understanding
(Gracia-Ibanez & Vergara, 2016) (especially engineering students) (Zakaria, et al., 2012).
AutoCAD users have a wide range of capabilities. They can use the software to create 2D
or 3D models or drawings of structures or products they want to create; create and provide
dimensions (baseline dimensions, angular dimensions or radial dimensions), measurements and
notes of the structure or product; create technical blueprints and schematic of structures and
products; create layers (that can be turned on and off) of various systems of the structure (such as
plumbing systems, electrical systems, heating systems, ventilation systems and air conditioning
systems) or product; import layers from other drawings and add them to the working drawing;
edit, modify or make changes to the drawings created to correct any errors and ensure that they
⊘ This is a preview!⊘
Do you want full access?
Subscribe today to unlock all pages.
Trusted by 1+ million students worldwide

User Testing of an Interactive System 4
are as per the required specifications; insert blocks that have already been used or created on the
drawing; import a PAGESETUP from other drawings (Pei, 2017); create custom palettes and
blocks; create different viewports of the drawing; manipulate external references; create and
apply materials; apply rendering; provide measurements of materials needed to create the
structures and products; think creatively and critically; analyze drawings extensively; read and
analyze drawings critically; and prepare appropriate drawings template files and construction or
manufacturing documentation.
Other fundamental capabilities of AutoCAD users include: meticulously understand all
commands of the software; know and use shortcut keys so as to finish the design work more
quickly; understand all drafting techniques, symbols and codes; quick in learning any new
software tools and commands; plan properly on how to start and finish a project successfully;
communicate and collaborate effectively with other project team members; store and retrieve
data and files easily and quickly; save files in different formats; use the software together with
other relevant systems, tools and technologies such as Excel, Building Information Modeling
(BIM), lean manufacturing tool, etc., and present final work elegantly, precisely and
professionally; interpret drawings clearly. These capabilities vary depending on the knowledge
level of the user. The users tested in this paper will be categorized as beginner users,
intermediate users, and advanced users.
Part TWO: The use cases
The subsets of the functionality of AutoCAD software that will considered in this report
are: import saved settings of layers from a different drawing (particularly dimension styles, color
styles and text styles) and use them in another drawing; insert blocks from other drawings or
online sources, and quantity estimation that involves estimating the quantity of materials needed
Paraphrase This Document
Need a fresh take? Get an instant paraphrase of this document with our AI Paraphraser
User Testing of an Interactive System 5
to create the designed structure or product. Therefore the use cases considered in this report are:
importing and using layers from a different drawing, inserting blocks that were used and saved in
a different drawing, and quantity estimation. All these tasks are completed and tested using
AutoCAD. In the first use case, dimension styles, color styles and text styles (layer settings) that
were used and saved in a different drawing will be imported and used in the new drawing. The
user will be required to start the AutoCAD software, open the working page where the drawing
is being created, and follow the required commands so as to important the right layers from the
saved drawing and use it in the drawing that is being worked on. In the second use case, the user
will have to obtain several blocks from both saved design drawings, and insert them in the
drawing that is being worked on. The blocks will include drawing details and symbols. In the
third use case, the user will be estimating the total amount of materials that are required to build,
manufacture or create the designed structure or product. The quantities of individual components
will be determined them summed up to find the total estimate. This report will not consider other
use cases of AutoCAD, such as creating new blocks, applying rendering, analyzing drawings
comprehensively, importing a PAGESETUP, modifying drawings to accommodate new changes,
preparing drawing documentations, etc. The focus will only be on the three use cases mentioned
above.
In all these use cases, the AutoCAD user must have the requisite capabilities to perform
the tasks. For instance, the user must fully understand the tools and commands that should be
used, and how to use them.
User Testing of an Interactive System 6
Part THREE: The evaluation methodology
Evaluation procedure
The fundamental goal of this process is to determine the capabilities of different
AutoCAD users in performing the above mentioned use cases. This will help in determining the
most suitable human factors that should be considered when designing AutoCAD and other
interactive systems. It is very important to consider human factors when designing interactive
systems (Leva, et al., 2015); (Phansalkar, et al., 2010). This is because human factors
significantly influence the interaction between users and the systems (Robert, 2011); (Samer,
2016). If appropriate human factors are not considered then users’ interaction, capabilities and
understanding of the systems may not be as good as needed (Al-Ageel, et al., 2015). In other
words, human factors influence user capabilities and experience (Abduljalil & Kang, 2011);
(Saeed, et al., 2014).
The users were categorized into three groups: beginner users, intermediate users, and
advanced users. Beginner users are those with basic AutoCAD skills. They may be still in the
process of training or learning how to use AutoCAD. Intermediate users are those with
considerable AutoCAD skills. They are usually those that have completed AutoCAD training
and using it for some time. Advanced users are those with high-level AutoCAD capabilities.
They must have used the software for quite a long time and therefore are very conversant with it.
Each user was required to perform the three tasks consecutively. Before starting to perform the
tasks, users were required to note down the goal or expected outcome of the task, state the
general procedure of performing each task, list commands that will be used in performing the
task, identify various icons or symbols used in performing the task, state the inputs for each task,
⊘ This is a preview!⊘
Do you want full access?
Subscribe today to unlock all pages.
Trusted by 1+ million students worldwide
User Testing of an Interactive System 7
and give the estimated time to complete the tasks. Thereafter, users executed the three tasks, one
at a time.
After completing the tasks, users were asked to answer questions and give their feedback
on the following issues: inputs used, ease of identifying icons, layout complexity, ease of finding
and using commands, number of shortcut keys used, quality of texts and images, total time taken
to complete the three tasks, efficiency, error frequency, monotony and boredom, task
effectiveness, autonomy and user satisfaction. All these tasks were performed using the same
version of AutoCAD – AutoCAD 2014, installed in desktop computers in the university
computer lab.
User tasks
The three tasks in this paper are: importing saved layers from a different drawing,
inserting blocks obtained from another drawing, and quantity estimation.
Importing layers: layers are one of the elements of AutoCAD drawings that significantly
influences how the final drawing looks like. The specific layers imported in this report were
dimension styles, color styles and text style. When layer is entered as a command prompt,
various options are displayed depending on the structure or product being drawn. If it is building,
layer options can include foundation, floor plan, fixtures, doors, cabinets, roof, electrical,
plumbing, etc. (Pandey, 2016). The properties and visibility of these objects can be controlled
using layers such as linetype, color, etc. Generally, layers help in organizing various objects of
the drawing by purpose or function thus reducing its complexity (Autodesk Inc., 2015). They
also help in improving visibility of the drawing.
Paraphrase This Document
Need a fresh take? Get an instant paraphrase of this document with our AI Paraphraser
User Testing of an Interactive System 8
Inserting blocks: a block refers to a named object comprising of one or more objects
(Autodesk Inc., 2018). When a block is inserted, all information of the block (including layers,
linetypes, geometry and colors) are also transferred and stored in a table of definitions behind-
the-scenes. The blocks inserted in this exercise were from a different drawing. It is also worth
noting that blocks can be inserted from the current drawing.
Estimating quantity of materials: AutoCAD can be used to calculate or compute
quantities of materials that are needed to create a structure, machine or product that is in the
drawing. Since AutoCAD drawings are organized in layers, the user has to estimate materials for
each individual layer. For example, if it is a house drawing, the user estimate materials for the
floor, doors, windows, roof, fixture, etc. In this task, the user has to estimate volumes of
materials for the entire drawing.
These tasks aimed at determining users’ capabilities to use various commands, elements
and tools of AutoCAD including: basics such as units\properties, commands such as linetype,
properties and matchprop, viewing (such as draw order), layers, layouts (such as mview),
geometry (such as circle, line, hatch, pline and rectang), precision (such as dist and osnap),
blocks (such as external blocks and insert), modifying (such as align, copy, mirror, fillet, erase,
extend, explode, rotate, trim, stretch, move, offset, move and pedit commands), dimensions (such
as dimaligned, dimlinear, dimangular, diradius, dimdiameter, dimcontinue, and dimstyle), notes
& labels (such as mleader, style, mtext and mleaderstyle), and printing (such as plot and
pagesetup), among others. Besides understanding these commands and tools, the tasks also
aimed at determining how users understand and use shortcut keys.
User Testing of an Interactive System 9
Task descriptions
Importing layers is executed using the LAYER command, which comprises Layer
Properties Manager. The command can be accessed by either clicking Layer Properties tool icon
or entering LA or LAYER in the Command window. This displays all layers of the drawing,
including current layer, and shows those that are on or off. The user has to choose the layer that
he/she wants to work. In the Layer Properties Manger, the user clicks on Layer State then clicks
on Manage Layer States from the drop-down list that appears. The user then clicks Import from
the Layer States Manager drop-down list. From the dialog box of Import Layer State, the user
opens a file name extension that can be .dws, .dwg, or .dwt. The users selected three layer states
to import (one at a time) then clicked OK. The layer states that were imported included
dimension style, color style and text style.
Blocks in this exercise were inserted from another drawing. To do this, the user clicks on
Home tab then clicks on Block panel. The user chooses the INSERT command after which a
dialog box opens. From the dialog box, the user clicks o Browse button. He/she searches through
various options then selects the specific drawing from which to import the block. Thereafter, the
user uses the settings in dialog box to insert the block. Some of the section options in the dialog
box settings include: Insertion Point section, Scale section and Rotate section. Insertion Point
section is where the user specifies the coordinates or exact location where to insert the block.
Scale section is used to specify the scale to be used in the drawing. Rotate section is where the
user specifies the rotation angle of the block. There is also Explode command that can be used to
make other changes to the block (Finkelstein, 2012). After completing these tasks, the user clicks
on OK and the block insertion process is complete.
⊘ This is a preview!⊘
Do you want full access?
Subscribe today to unlock all pages.
Trusted by 1+ million students worldwide
User Testing of an Interactive System 10
Quantity estimation is this case use was executed by clicking on Vision Tools command
followed by Roombook panel then Calculate Room Quantities (for a building drawing). After
completing the calculation process, the user clicked on View/Edit Results button. This enabled
him/her to view subareas related to each of the room quantity that was calculated. This command
also helps in making some adjustments such as wall height, threshold area, window area, top
ceiling factor, etc. (Autodesk.Help, 2017). The list of materials and their volumes was generated
using Materiallist command. The user typed Materiallist in the command line. This was followed
by selecting the objects that the user wanted to be included in the material list. After selecting all
objects, the user pressed Enter. By pressing F2, the user was able to see the list of material
definitions in AutoCAD’s text window. It is possible to select the material definitions list and
copy paste it in MS Word document (Autodesk Inc., 2017).
Debriefing procedure
The methodology is this paper aims at determining the capabilities of different AutoCAD
users in three use cases. The user tasks are to import layers, insert blocks and estimate material
quantities in AutoCAD. These tasks or use cases will reveal a wide range of information about
AutoCAD users. At the end of each use case, the following questions will have been answered:
does the user understand the goals or expected results of the use case? Does the user know the
overall procedure of the task or use case? Can the user approximate the total time needed to
execute the task? Does the user know the required inputs in each task or use case? Does the user
know the commands that will be used in each of the tasks or use cases? Does the user understand
various shortcut keys that can be used in performing the task? Is the user able to identify various
icons and tools? Is the system layout too complex for the user? How many errors did the user
make? Were the tasks effectively and efficiently executed? How many times did the user request
Paraphrase This Document
Need a fresh take? Get an instant paraphrase of this document with our AI Paraphraser

User Testing of an Interactive System 11
for assistance? And did the user enjoy or find it easy to execute the tasks? The methodology used
in this paper was able to answer all these questions.
Part FOUR: The evaluation
Evaluation performance
In this study, a total of 30 students participated. The students were studying engineering
courses at the university. 10 of them were AutoCAD beginners, 10 were intermediate AutoCAD
users and 10 were advanced AutoCAD users. The tasks were performed in the university’s
computer lab using AutoCAD 2014 version. The participants were informed about the use cases
(tasks), the objectives of the study and the expected conduct during the exercise. There were also
two tutors present in the computer lab during the exercise to help students where necessary. The
tutors had advanced knowledge in AutoCAD use. Besides that, three engineering lecturers
assessed the student’s work. The students also filled a form to indicate various elements based on
the experience they had from performing the three tasks in AutoCAD. In general, evaluation of
this exercise was based on the following: students’ understanding of the expected results at the
end of each task, students’ understanding of the steps to be used in executing the tasks, ability to
estimate the total time needed to complete the three tasks, complexity of the AutoCAD system,
ability of students to outline inputs needed to complete the tasks, students’ ability to name the
commands used in performing each task, students’ ability to know the shortcut keys for various
command, number of errors made by the student, students’ efficiency and effectiveness to
perform the tasks, easiness or difficulty of executing the tasks, and overall satisfaction of the
students.
Evaluating results
Some of the results obtained from this study are as follows:
User Testing of an Interactive System 12
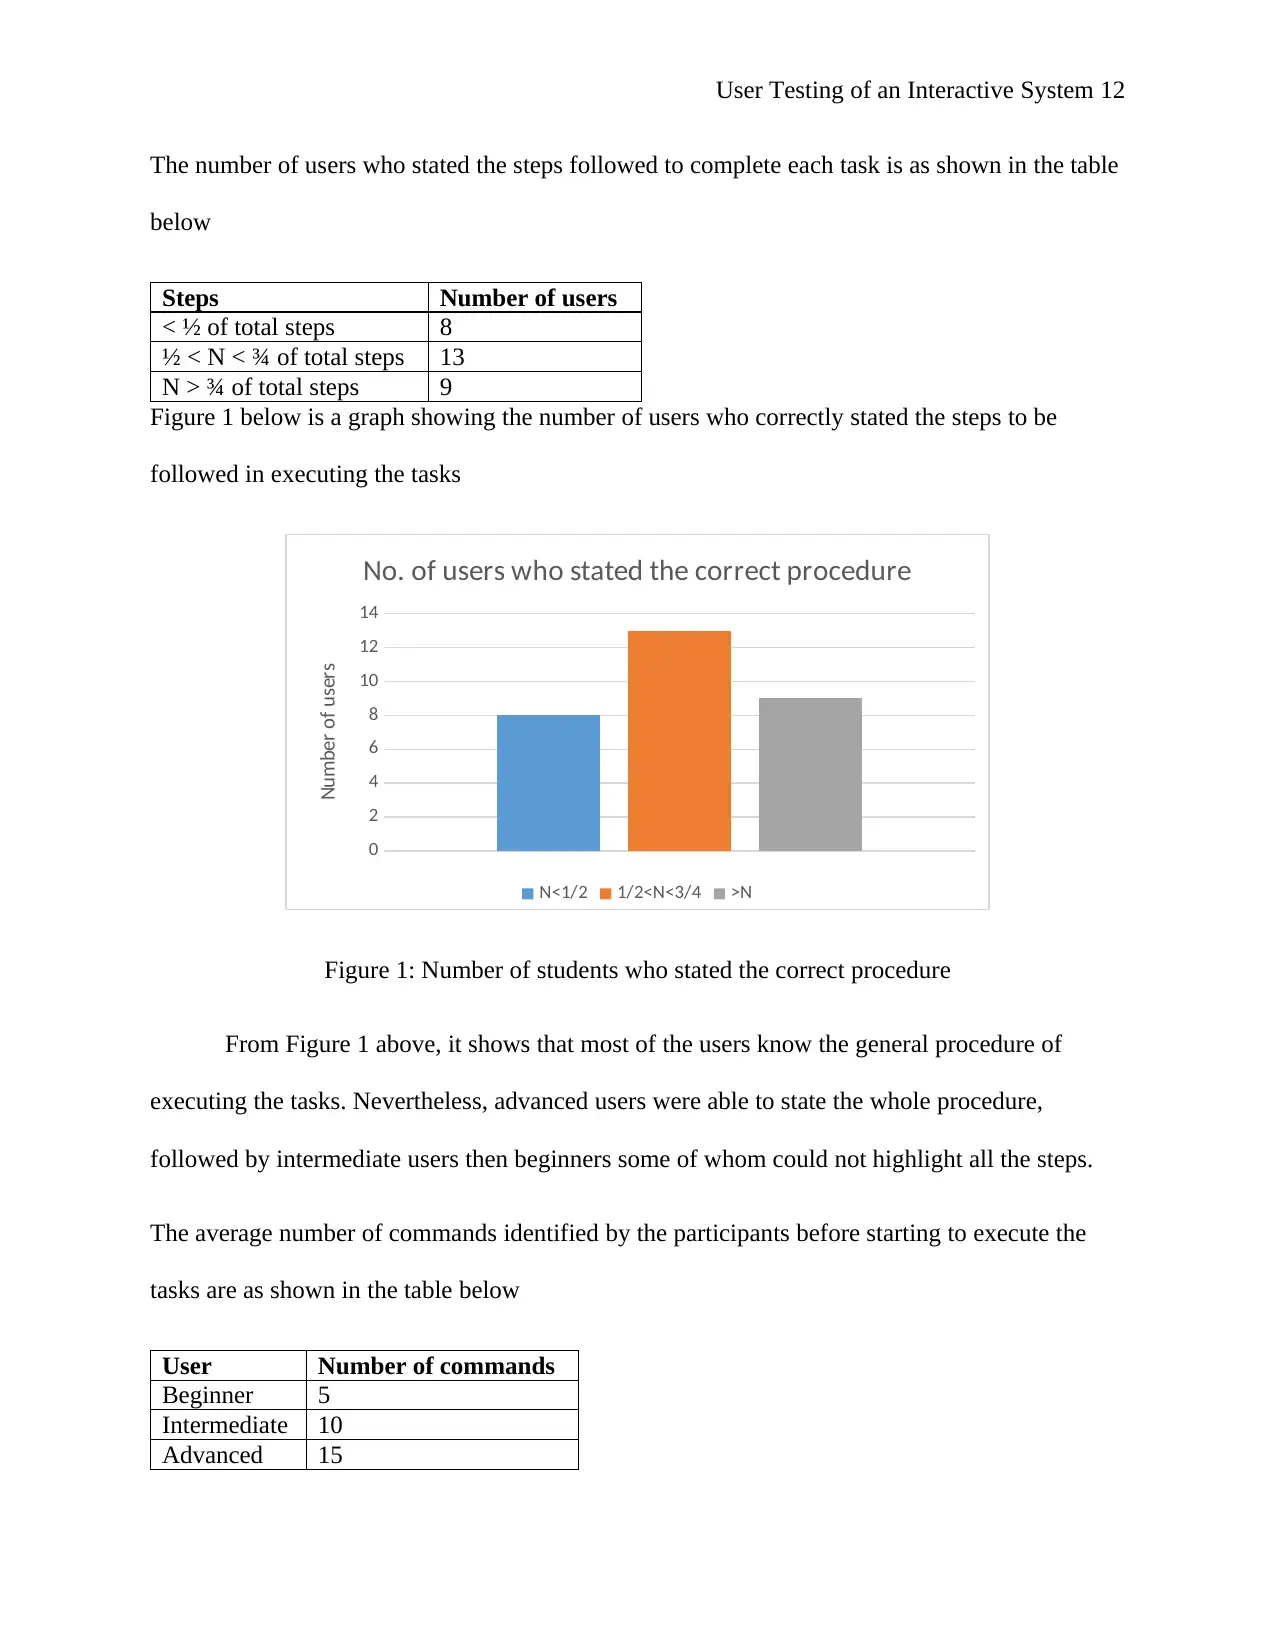
The number of users who stated the steps followed to complete each task is as shown in the table
below
Steps Number of users
< ½ of total steps 8
½ < N < ¾ of total steps 13
N > ¾ of total steps 9
Figure 1 below is a graph showing the number of users who correctly stated the steps to be
followed in executing the tasks
0
2
4
6
8
10
12
14
No. of users who stated the correct procedure
N<1/2 1/2<N<3/4 >N
Number of users
Figure 1: Number of students who stated the correct procedure
From Figure 1 above, it shows that most of the users know the general procedure of
executing the tasks. Nevertheless, advanced users were able to state the whole procedure,
followed by intermediate users then beginners some of whom could not highlight all the steps.
The average number of commands identified by the participants before starting to execute the
tasks are as shown in the table below
User Number of commands
Beginner 5
Intermediate 10
Advanced 15
⊘ This is a preview!⊘
Do you want full access?
Subscribe today to unlock all pages.
Trusted by 1+ million students worldwide
1 out of 25
Related Documents


Your All-in-One AI-Powered Toolkit for Academic Success.
+13062052269
info@desklib.com
Available 24*7 on WhatsApp / Email
![[object Object]](/_next/static/media/star-bottom.7253800d.svg)
Unlock your academic potential
Copyright © 2020–2026 A2Z Services. All Rights Reserved. Developed and managed by ZUCOL.