Intermediate Macroeconomics Analysis
VerifiedAdded on 2022/08/19
|15
|3259
|14
AI Summary
Contribute Materials
Your contribution can guide someone’s learning journey. Share your
documents today.

Running Head: INTERMEDIATE MACROECONOMICS ANALYSIS
Intermediate Macroeconomics Analysis
By [Name of Student]
Course Name
[Name of Affiliate Institution]
Professor’s Name
Date
Intermediate Macroeconomics Analysis
By [Name of Student]
Course Name
[Name of Affiliate Institution]
Professor’s Name
Date
Secure Best Marks with AI Grader
Need help grading? Try our AI Grader for instant feedback on your assignments.
INTERMEDIATE MACROECONOMICS ANALYSIS
Economics the Factors of Production, the Labor Market, and Aggregate Supply.
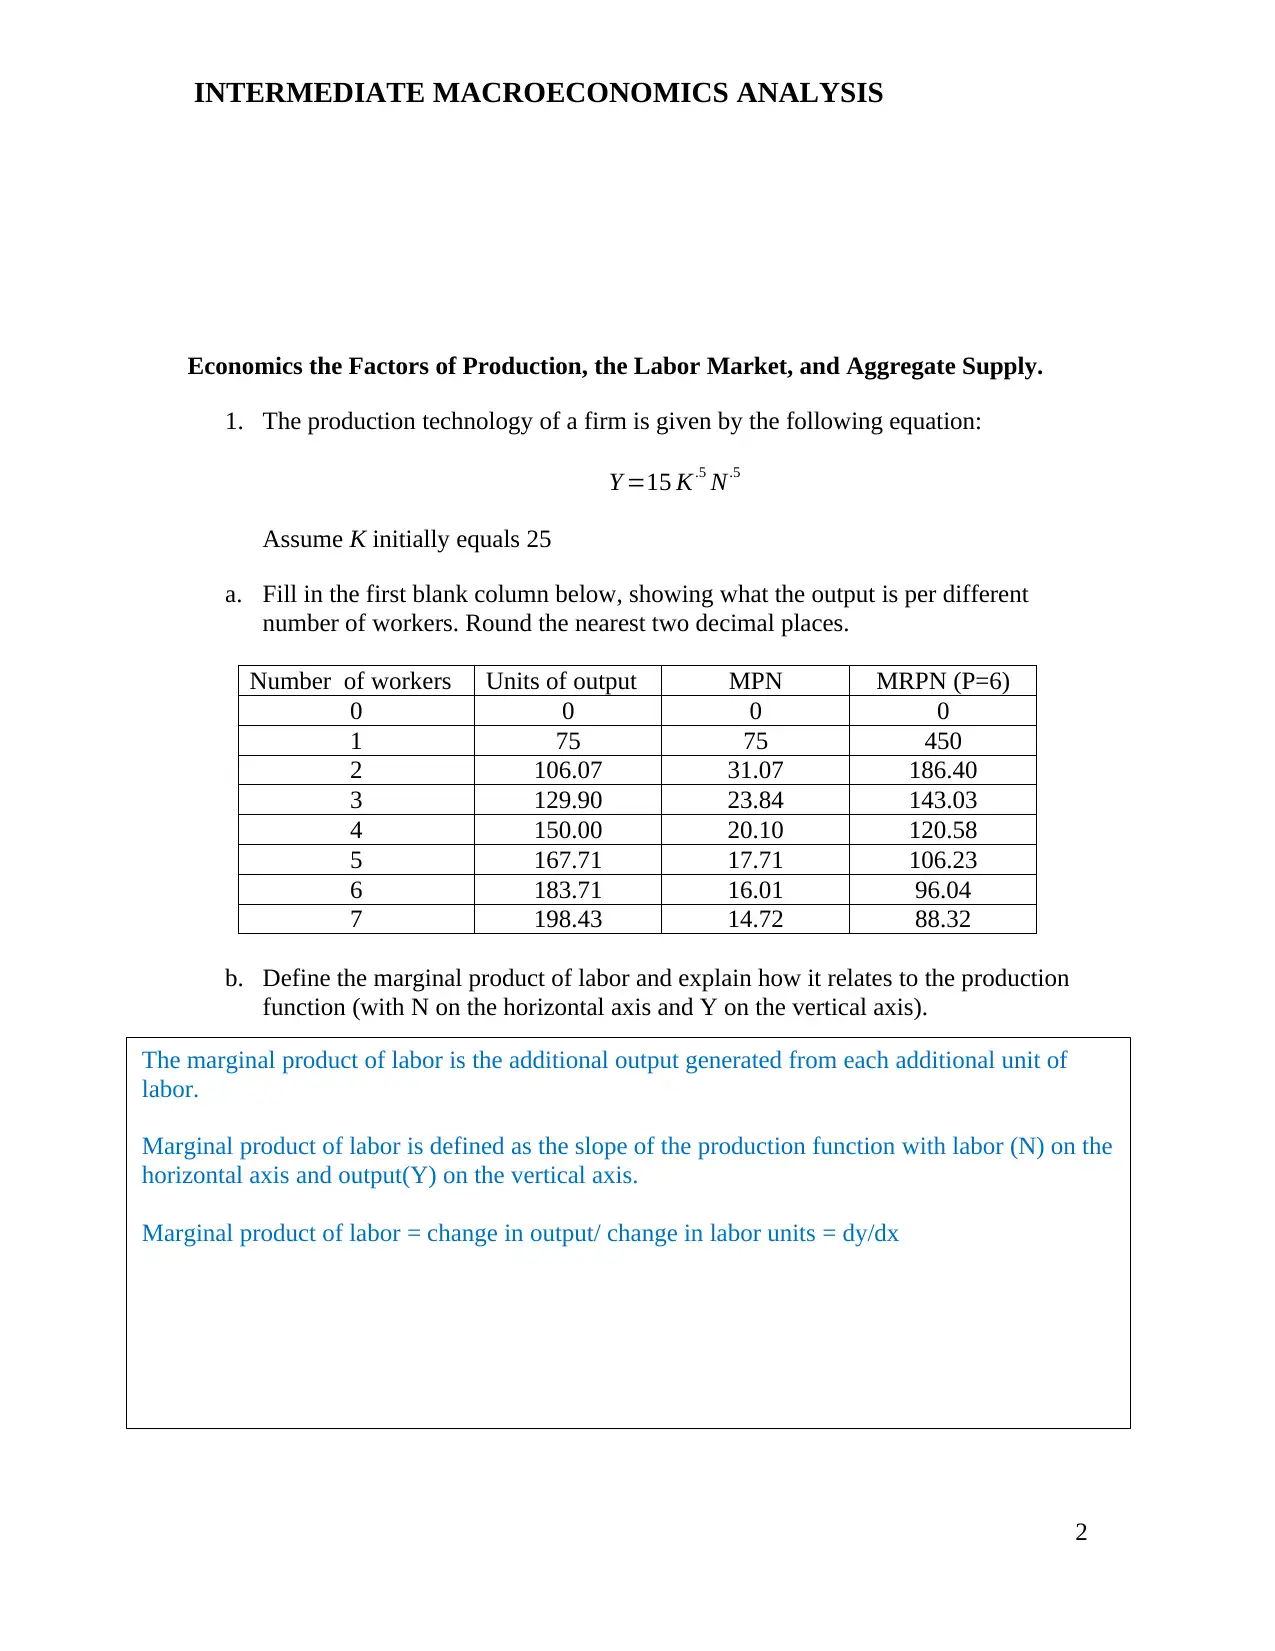
1. The production technology of a firm is given by the following equation:
Y =15 K.5 N.5
Assume K initially equals 25
a. Fill in the first blank column below, showing what the output is per different
number of workers. Round the nearest two decimal places.
Number of workers Units of output MPN MRPN (P=6)
0 0 0 0
1 75 75 450
2 106.07 31.07 186.40
3 129.90 23.84 143.03
4 150.00 20.10 120.58
5 167.71 17.71 106.23
6 183.71 16.01 96.04
7 198.43 14.72 88.32
b. Define the marginal product of labor and explain how it relates to the production
function (with N on the horizontal axis and Y on the vertical axis).
2
The marginal product of labor is the additional output generated from each additional unit of
labor.
Marginal product of labor is defined as the slope of the production function with labor (N) on the
horizontal axis and output(Y) on the vertical axis.
Marginal product of labor = change in output/ change in labor units = dy/dx
Economics the Factors of Production, the Labor Market, and Aggregate Supply.
1. The production technology of a firm is given by the following equation:
Y =15 K.5 N.5
Assume K initially equals 25
a. Fill in the first blank column below, showing what the output is per different
number of workers. Round the nearest two decimal places.
Number of workers Units of output MPN MRPN (P=6)
0 0 0 0
1 75 75 450
2 106.07 31.07 186.40
3 129.90 23.84 143.03
4 150.00 20.10 120.58
5 167.71 17.71 106.23
6 183.71 16.01 96.04
7 198.43 14.72 88.32
b. Define the marginal product of labor and explain how it relates to the production
function (with N on the horizontal axis and Y on the vertical axis).
2
The marginal product of labor is the additional output generated from each additional unit of
labor.
Marginal product of labor is defined as the slope of the production function with labor (N) on the
horizontal axis and output(Y) on the vertical axis.
Marginal product of labor = change in output/ change in labor units = dy/dx

INTERMEDIATE MACROECONOMICS ANALYSIS
c. Find the marginal product of labor (MPN) for each level of employment (fill in
the third column of the table above).
The filled table is shown above
d. Assume that the price of a unit of output is $6. Calculate the MRPN for each
worker and add it to the table above.
The filled table is shown above
e. Calculate the number of workers that will be hired if the nominal wage rate =
$140. Calculate the number of workers the firm will hire if the nominal wage is
$110. Calculate the number of workers that the firm will hire if the nominal wage
is $90. Please show your work.
The number of workers hired is when the nominal wage rate line crosses the MRPN line.
So, the number is when MRPN is equal to or just above the nominal wage rate.
When the wage rate is $140, the number of workers hired = 3. In this case, MRPN is
143.03 which is just above the nominal wage rate
When the wage rate is $110, the number of workers hired = 4. In this case, MRPN is
120.58 which is just above the nominal wage rate
When the wage rate is $90, the number of workers hired = 6. In this case, MRPN is 96.04
which is just above the nominal wage rate
If W = $140, N =
If W = $110, N =
3
3
4
INTERMEDIATE MACROECONOMICS ANALYSIS
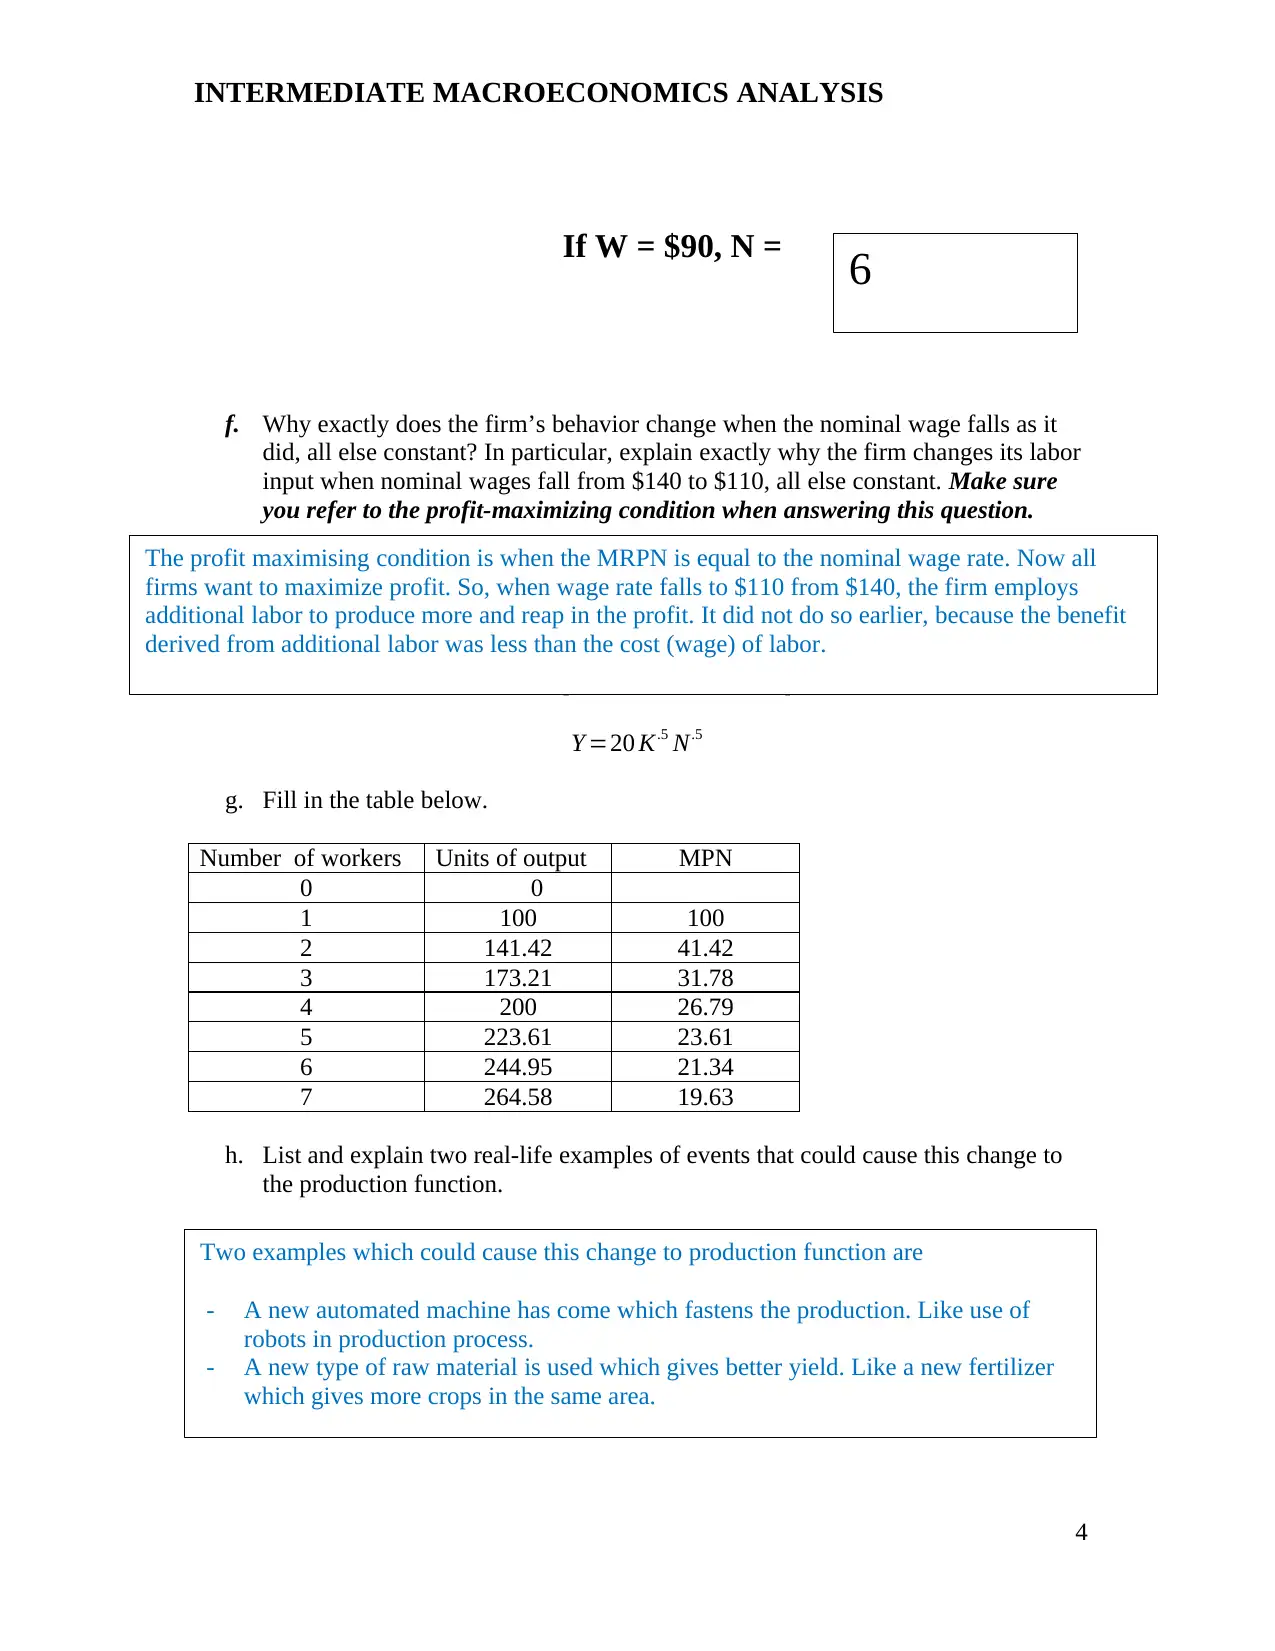
If W = $90, N =
f. Why exactly does the firm’s behavior change when the nominal wage falls as it
did, all else constant? In particular, explain exactly why the firm changes its labor
input when nominal wages fall from $140 to $110, all else constant. Make sure
you refer to the profit-maximizing condition when answering this question.
Assume that an event makes the new production function equal to:
Y =20 K.5 N.5
g. Fill in the table below.
Number of workers Units of output MPN
0 0
1 100 100
2 141.42 41.42
3 173.21 31.78
4 200 26.79
5 223.61 23.61
6 244.95 21.34
7 264.58 19.63
h. List and explain two real-life examples of events that could cause this change to
the production function.
4
6
Two examples which could cause this change to production function are
- A new automated machine has come which fastens the production. Like use of
robots in production process.
- A new type of raw material is used which gives better yield. Like a new fertilizer
which gives more crops in the same area.
The profit maximising condition is when the MRPN is equal to the nominal wage rate. Now all
firms want to maximize profit. So, when wage rate falls to $110 from $140, the firm employs
additional labor to produce more and reap in the profit. It did not do so earlier, because the benefit
derived from additional labor was less than the cost (wage) of labor.
Secure Best Marks with AI Grader
Need help grading? Try our AI Grader for instant feedback on your assignments.
INTERMEDIATE MACROECONOMICS ANALYSIS
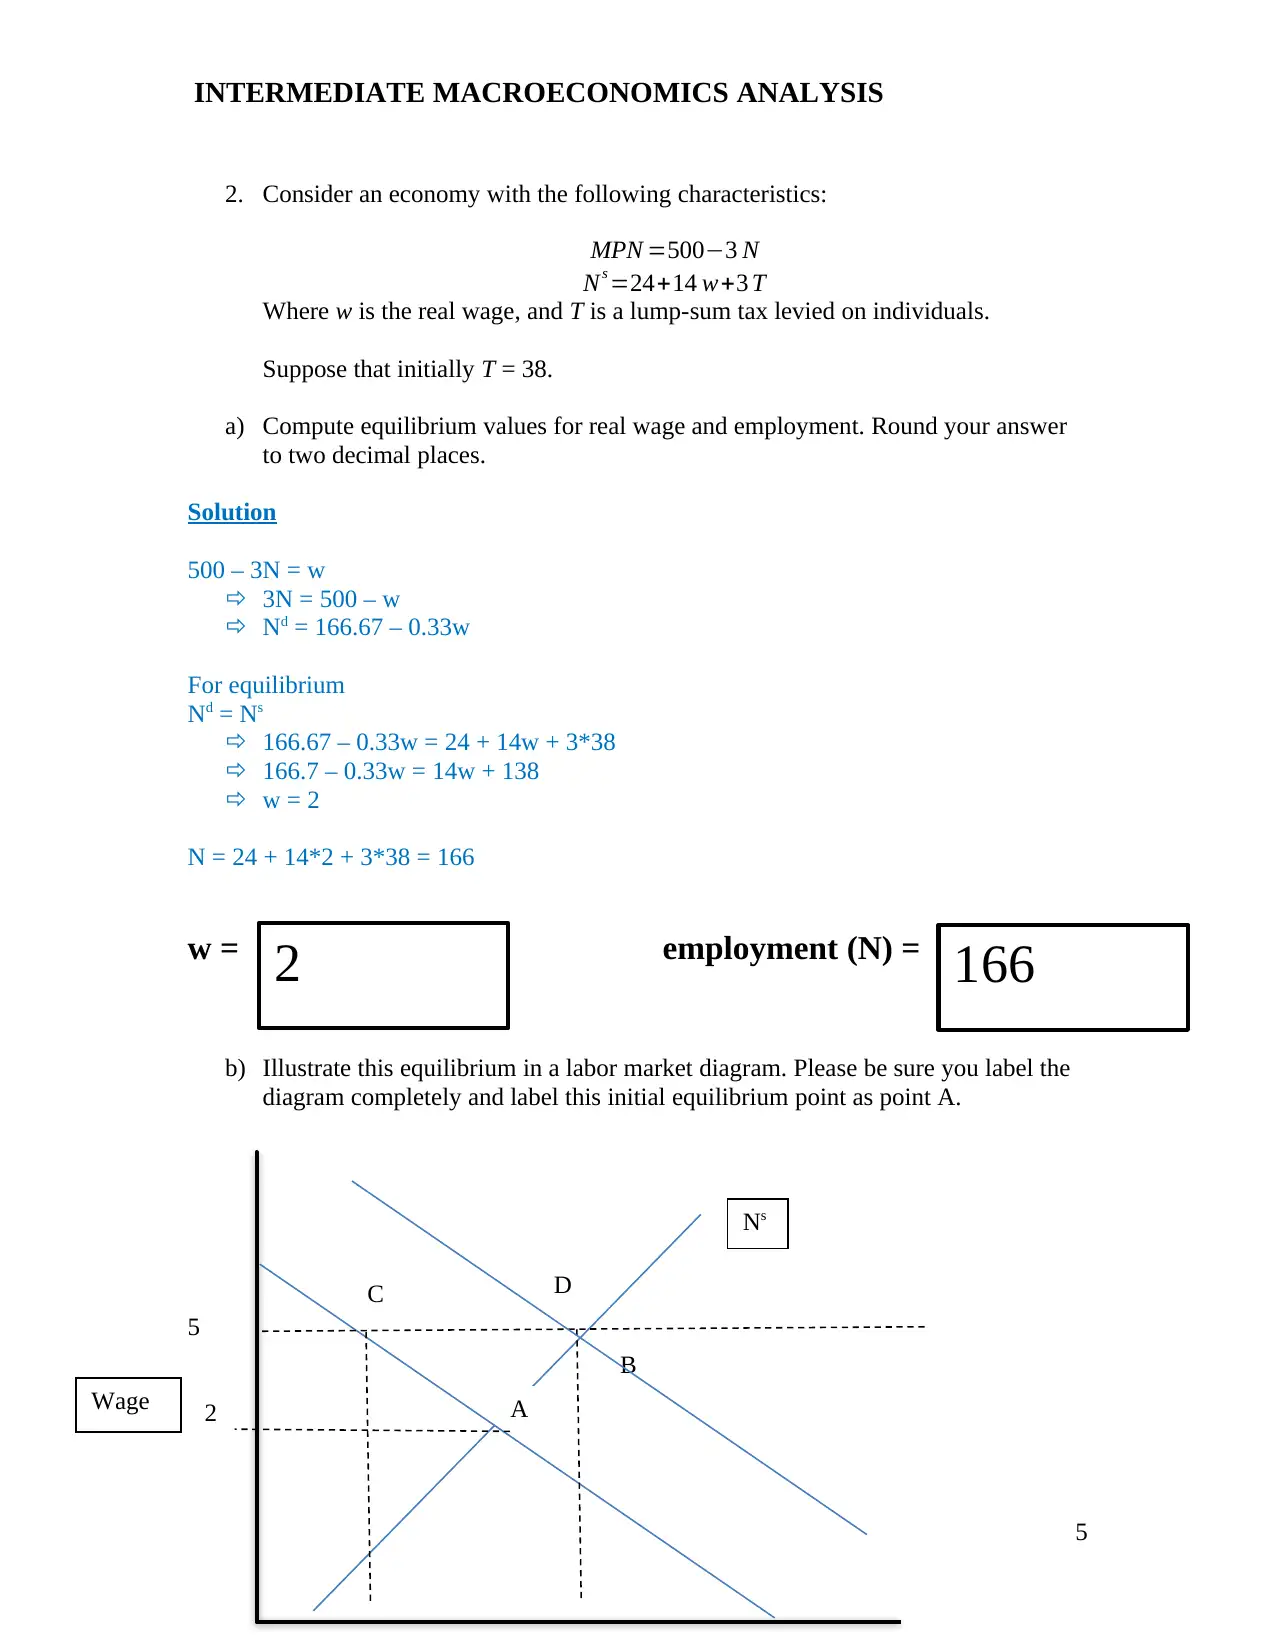
2. Consider an economy with the following characteristics:
MPN =500−3 N
Ns =24+14 w+3 T
Where w is the real wage, and T is a lump-sum tax levied on individuals.
Suppose that initially T = 38.
a) Compute equilibrium values for real wage and employment. Round your answer
to two decimal places.
Solution
500 – 3N = w
3N = 500 – w
Nd = 166.67 – 0.33w
For equilibrium
Nd = Ns
166.67 – 0.33w = 24 + 14w + 3*38
166.7 – 0.33w = 14w + 138
w = 2
N = 24 + 14*2 + 3*38 = 166
w = employment (N) =
b) Illustrate this equilibrium in a labor market diagram. Please be sure you label the
diagram completely and label this initial equilibrium point as point A.
5
2
5
Ns
A
2 166
Wage
C
B
D
INTERMEDIATE MACROECONOMICS ANALYSIS
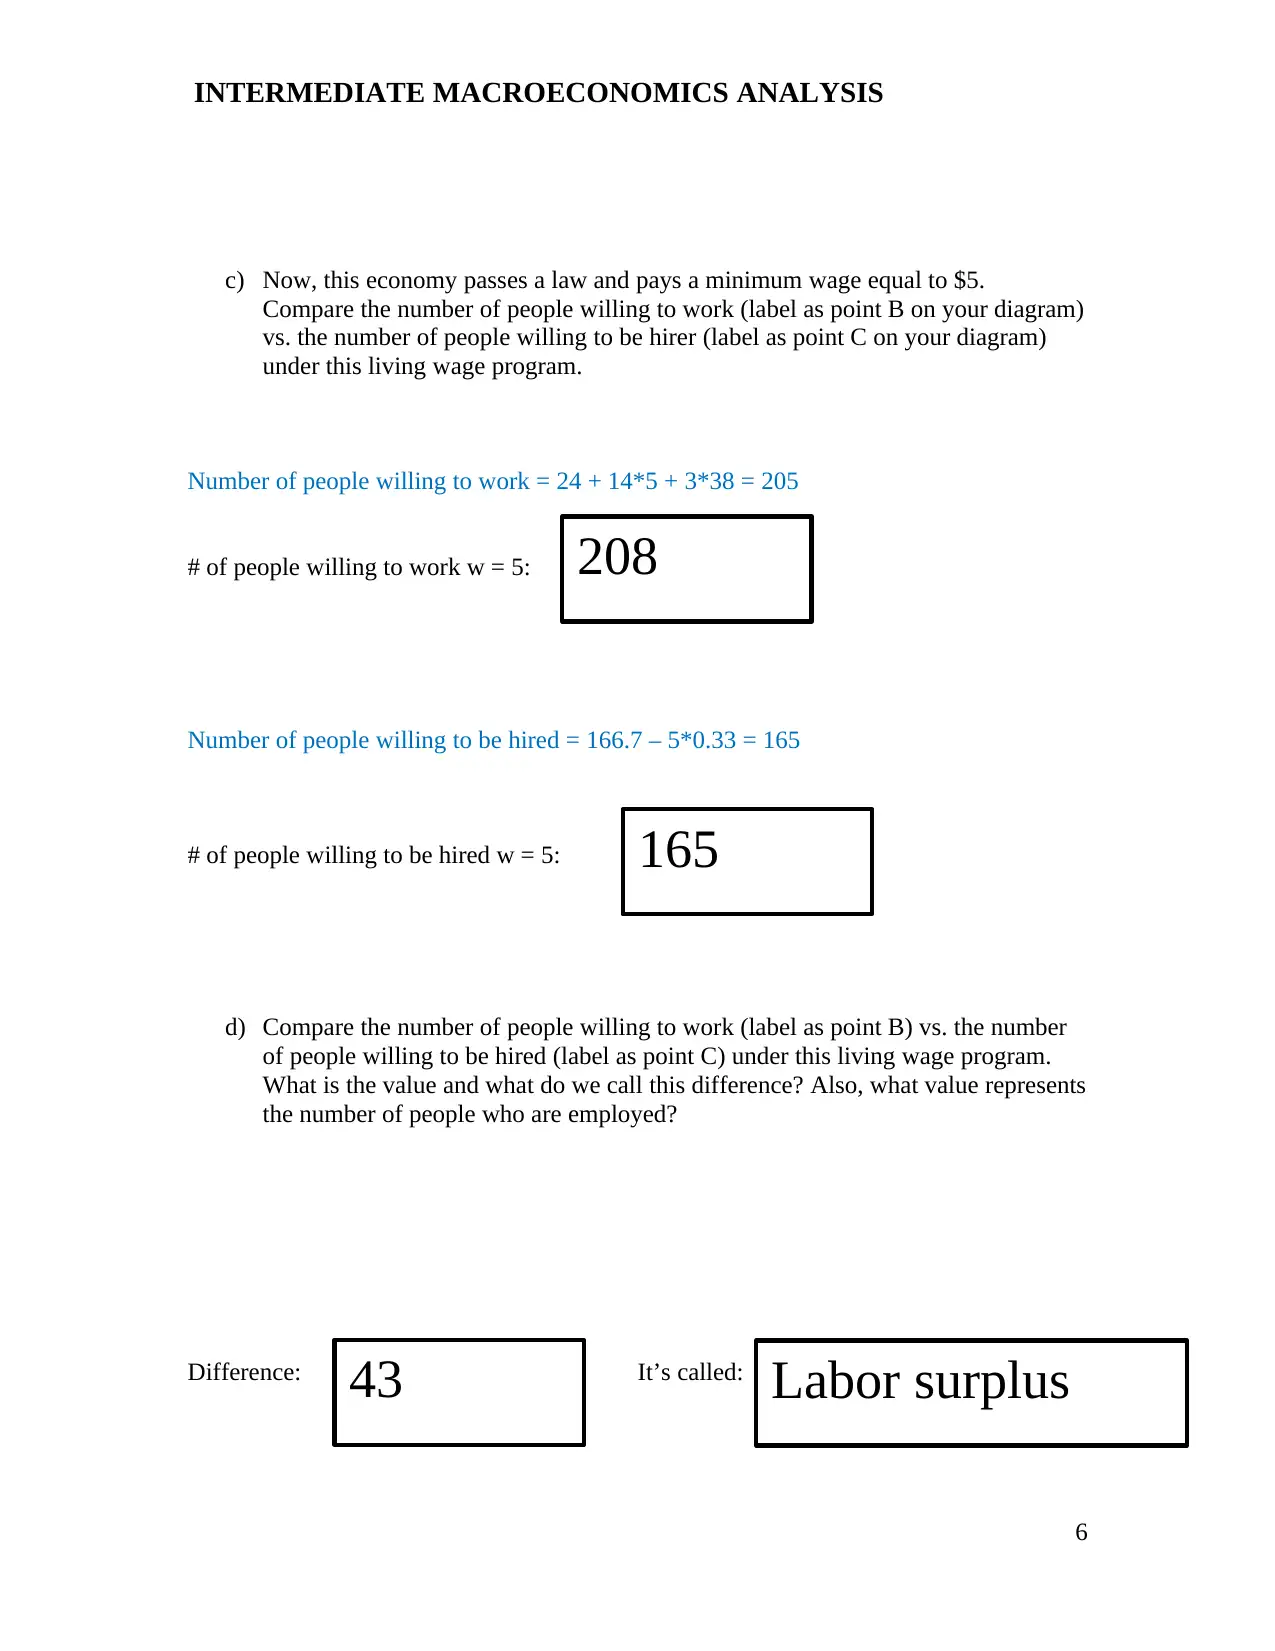
c) Now, this economy passes a law and pays a minimum wage equal to $5.
Compare the number of people willing to work (label as point B on your diagram)
vs. the number of people willing to be hirer (label as point C on your diagram)
under this living wage program.
Number of people willing to work = 24 + 14*5 + 3*38 = 205
# of people willing to work w = 5:
Number of people willing to be hired = 166.7 – 5*0.33 = 165
# of people willing to be hired w = 5:
d) Compare the number of people willing to work (label as point B) vs. the number
of people willing to be hired (label as point C) under this living wage program.
What is the value and what do we call this difference? Also, what value represents
the number of people who are employed?
Difference: It’s called:
6
208
165
43 Labor surplus

INTERMEDIATE MACROECONOMICS ANALYSIS
# of people employed:
e) Was this change in the number of people employed due to a shift or a movement
along the demand curve? (circle your answer)
Shift
f) Intuition: Why does the profit-maximizing level of labor input change with the
living wage program (make sure you write out the profit-maximizing condition
and explain why it has changed i.e., why does the hiring company rationally
change their quantity demanded of labor the way they did)?
g) Intuition. We also experience a movement along the labor supply curve. Explain
the intuition here as to why are more people are willing to work using and
explaining the substitution and income effects associated with labor supply.
Which effect dominates and what has happened to the price of leisure given the
living wage program?
7
165
The profit maximising condition is when wage rate is equal to or slightly less than the MRPN. Now
with the living wage program, the wage rate is higher, so companies tend to employ less labour in
order to maintain the profit maximising condition.
In this case the substitution effect dominates. This is because, people see a higher potential of
earning when the living wage program is initiated. So, they substitute their leisure with working. So,
more people join the labor force. Given the living wage program, the opportunity cost of leisure
increases. So, people substitute more leisure with labor. The price of leisure remains unchanged.
Movement Along
Paraphrase This Document
Need a fresh take? Get an instant paraphrase of this document with our AI Paraphraser
INTERMEDIATE MACROECONOMICS ANALYSIS
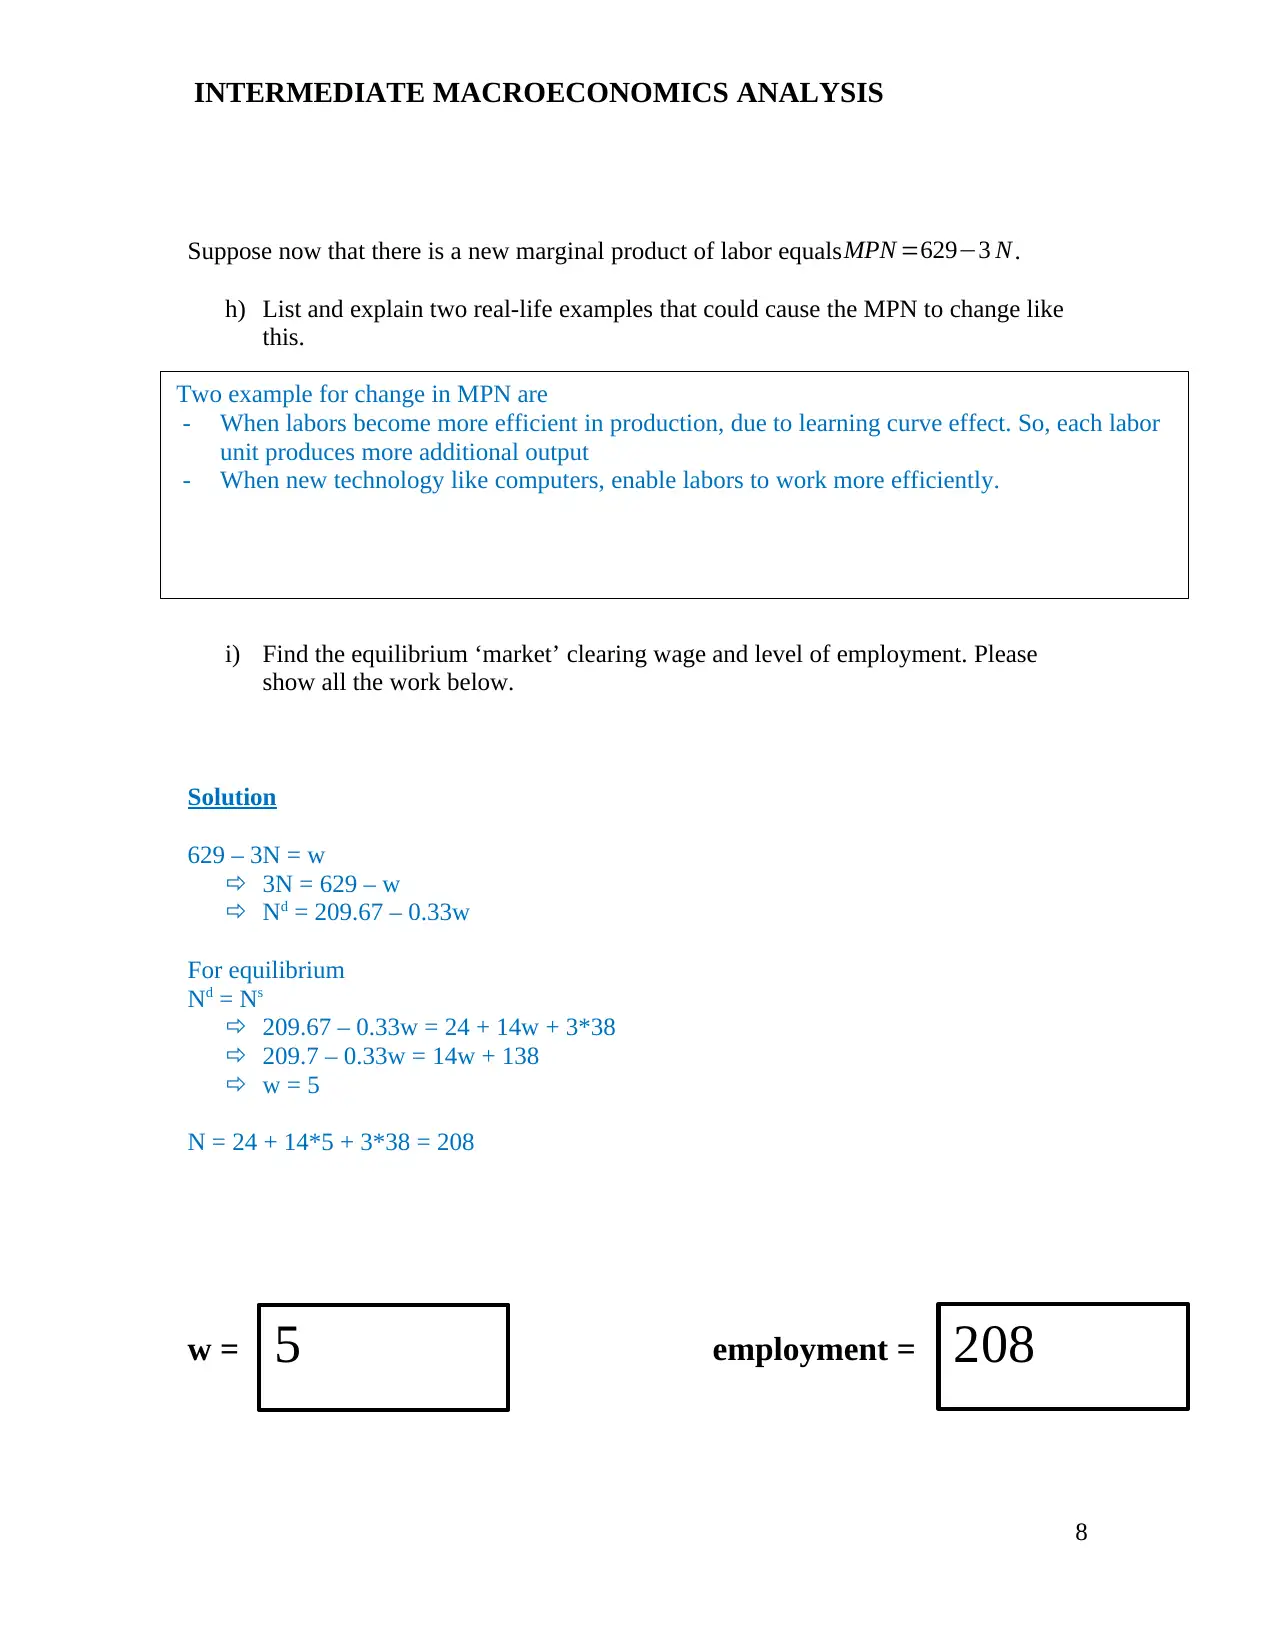
Suppose now that there is a new marginal product of labor equalsMPN =629−3 N.
h) List and explain two real-life examples that could cause the MPN to change like
this.
i) Find the equilibrium ‘market’ clearing wage and level of employment. Please
show all the work below.
Solution
629 – 3N = w
3N = 629 – w
Nd = 209.67 – 0.33w
For equilibrium
Nd = Ns
209.67 – 0.33w = 24 + 14w + 3*38
209.7 – 0.33w = 14w + 138
w = 5
N = 24 + 14*5 + 3*38 = 208
w = employment =
8
5 208
Two example for change in MPN are
- When labors become more efficient in production, due to learning curve effect. So, each labor
unit produces more additional output
- When new technology like computers, enable labors to work more efficiently.
INTERMEDIATE MACROECONOMICS ANALYSIS
j) Please depict this new development on your original diagram labeling this new
equilibrium point as point D in your diagram in part b.
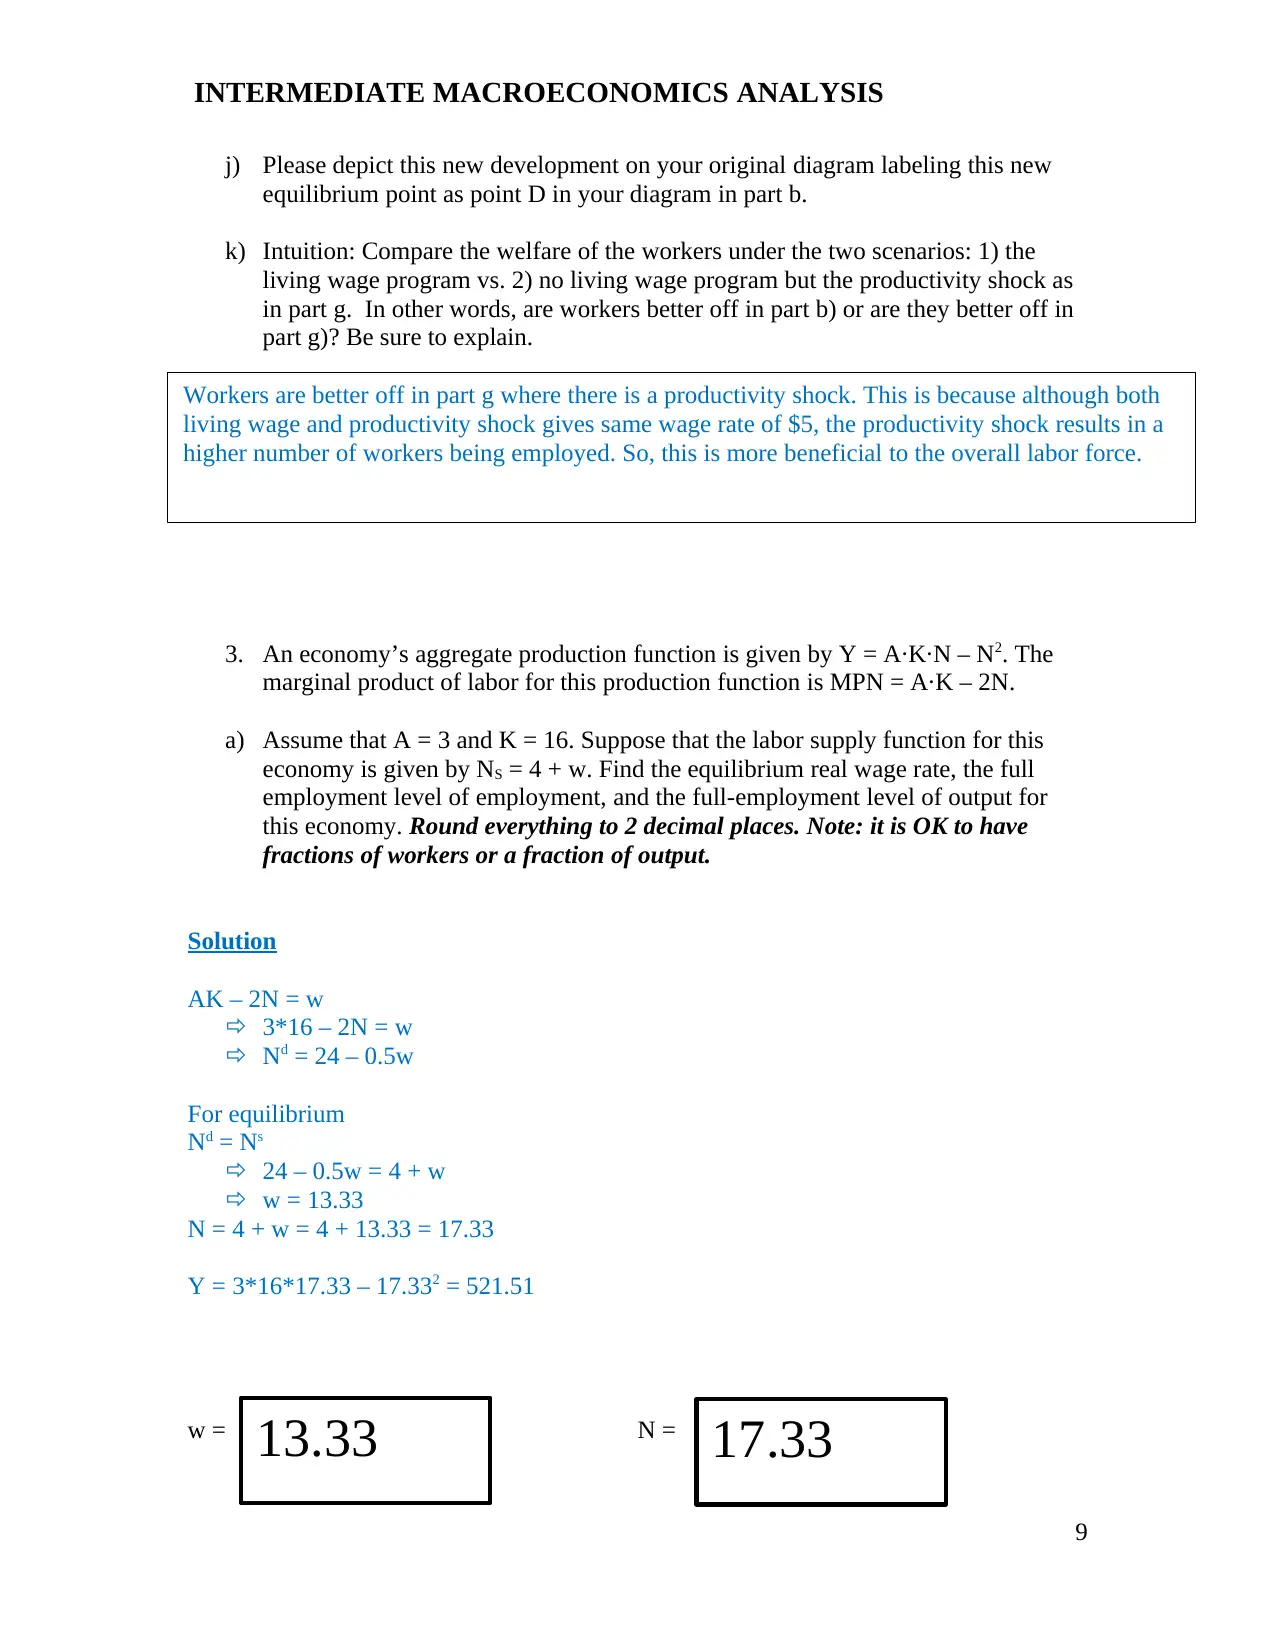
k) Intuition: Compare the welfare of the workers under the two scenarios: 1) the
living wage program vs. 2) no living wage program but the productivity shock as
in part g. In other words, are workers better off in part b) or are they better off in
part g)? Be sure to explain.
3. An economy’s aggregate production function is given by Y = A·K·N – N2. The
marginal product of labor for this production function is MPN = A·K – 2N.
a) Assume that A = 3 and K = 16. Suppose that the labor supply function for this
economy is given by NS = 4 + w. Find the equilibrium real wage rate, the full
employment level of employment, and the full-employment level of output for
this economy. Round everything to 2 decimal places. Note: it is OK to have
fractions of workers or a fraction of output.
Solution
AK – 2N = w
3*16 – 2N = w
Nd = 24 – 0.5w
For equilibrium
Nd = Ns
24 – 0.5w = 4 + w
w = 13.33
N = 4 + w = 4 + 13.33 = 17.33
Y = 3*16*17.33 – 17.332 = 521.51
w = N =
9
Workers are better off in part g where there is a productivity shock. This is because although both
living wage and productivity shock gives same wage rate of $5, the productivity shock results in a
higher number of workers being employed. So, this is more beneficial to the overall labor force.
13.33 17.33
j) Please depict this new development on your original diagram labeling this new
equilibrium point as point D in your diagram in part b.
k) Intuition: Compare the welfare of the workers under the two scenarios: 1) the
living wage program vs. 2) no living wage program but the productivity shock as
in part g. In other words, are workers better off in part b) or are they better off in
part g)? Be sure to explain.
3. An economy’s aggregate production function is given by Y = A·K·N – N2. The
marginal product of labor for this production function is MPN = A·K – 2N.
a) Assume that A = 3 and K = 16. Suppose that the labor supply function for this
economy is given by NS = 4 + w. Find the equilibrium real wage rate, the full
employment level of employment, and the full-employment level of output for
this economy. Round everything to 2 decimal places. Note: it is OK to have
fractions of workers or a fraction of output.
Solution
AK – 2N = w
3*16 – 2N = w
Nd = 24 – 0.5w
For equilibrium
Nd = Ns
24 – 0.5w = 4 + w
w = 13.33
N = 4 + w = 4 + 13.33 = 17.33
Y = 3*16*17.33 – 17.332 = 521.51
w = N =
9
Workers are better off in part g where there is a productivity shock. This is because although both
living wage and productivity shock gives same wage rate of $5, the productivity shock results in a
higher number of workers being employed. So, this is more beneficial to the overall labor force.
13.33 17.33
INTERMEDIATE MACROECONOMICS ANALYSIS
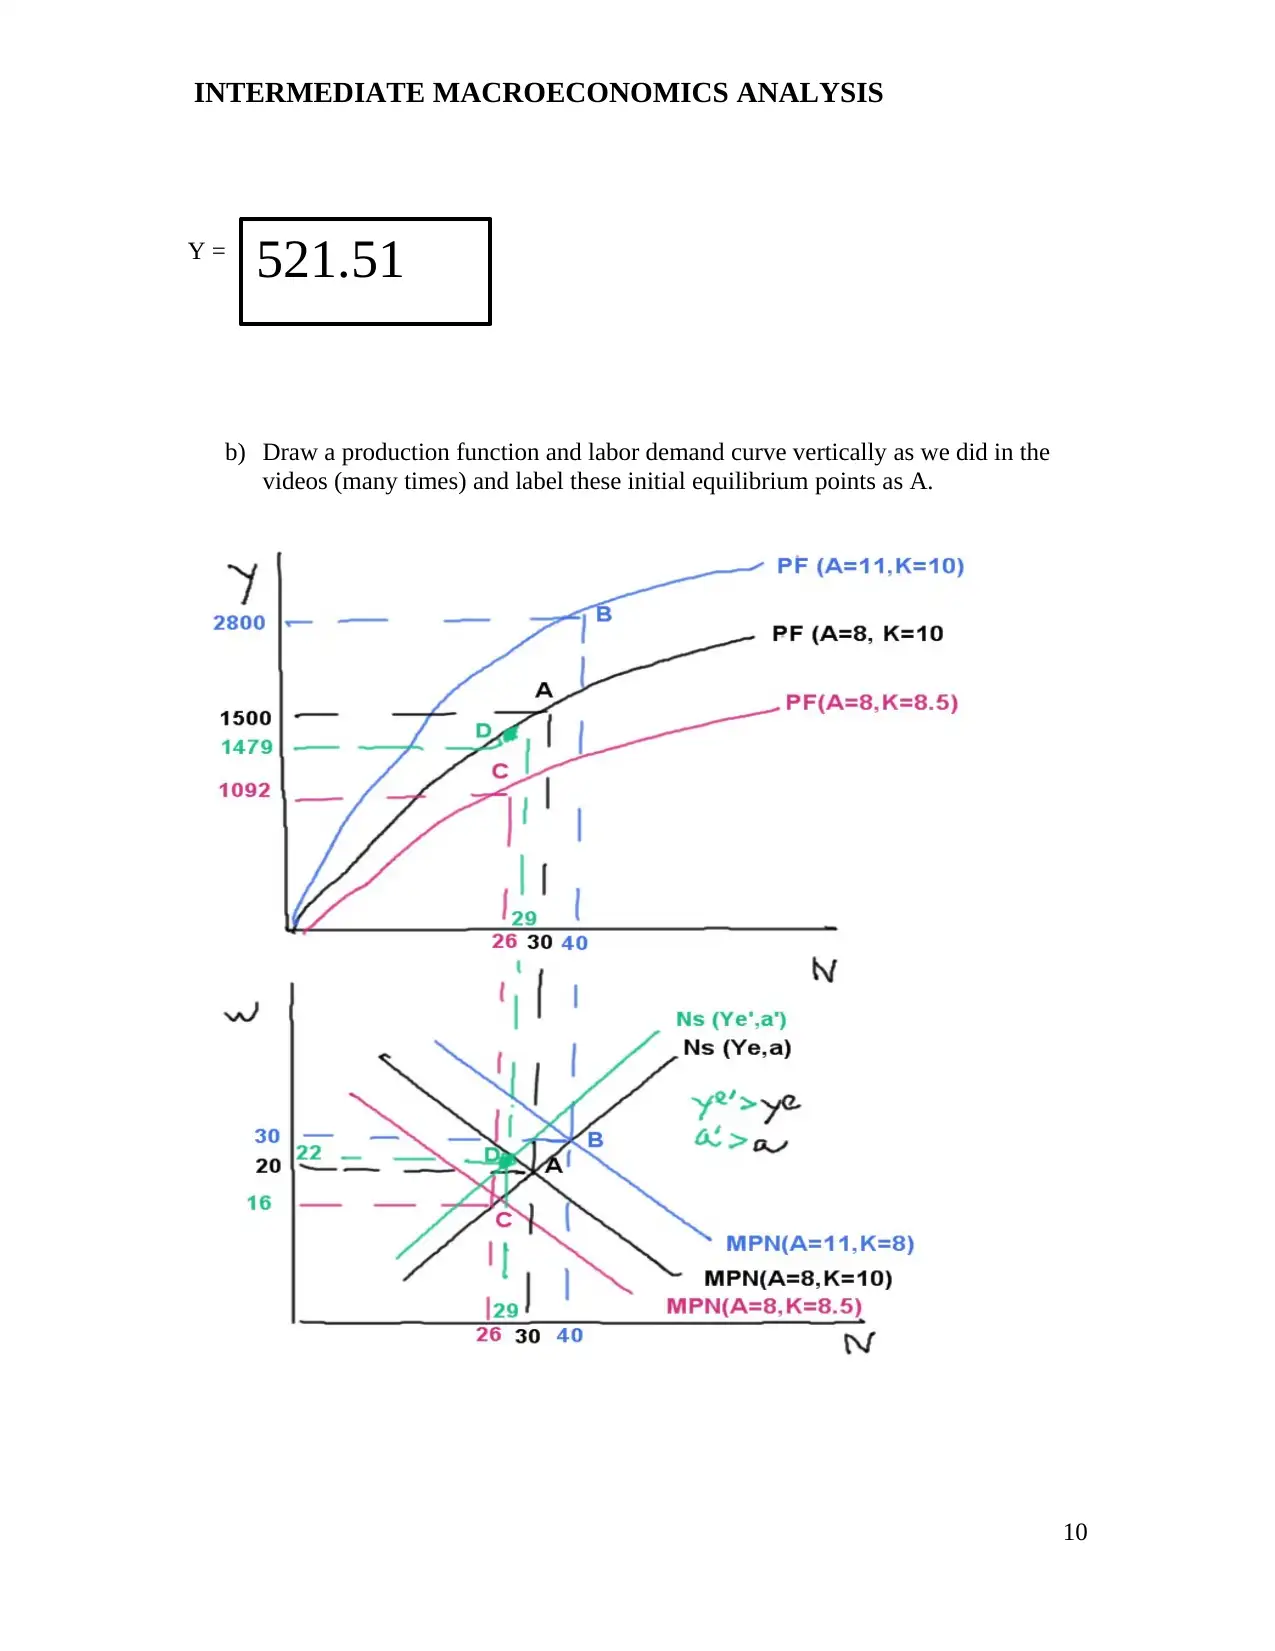
Y =
b) Draw a production function and labor demand curve vertically as we did in the
videos (many times) and label these initial equilibrium points as A.
10
521.51
Y =
b) Draw a production function and labor demand curve vertically as we did in the
videos (many times) and label these initial equilibrium points as A.
10
521.51
Secure Best Marks with AI Grader
Need help grading? Try our AI Grader for instant feedback on your assignments.
INTERMEDIATE MACROECONOMICS ANALYSIS
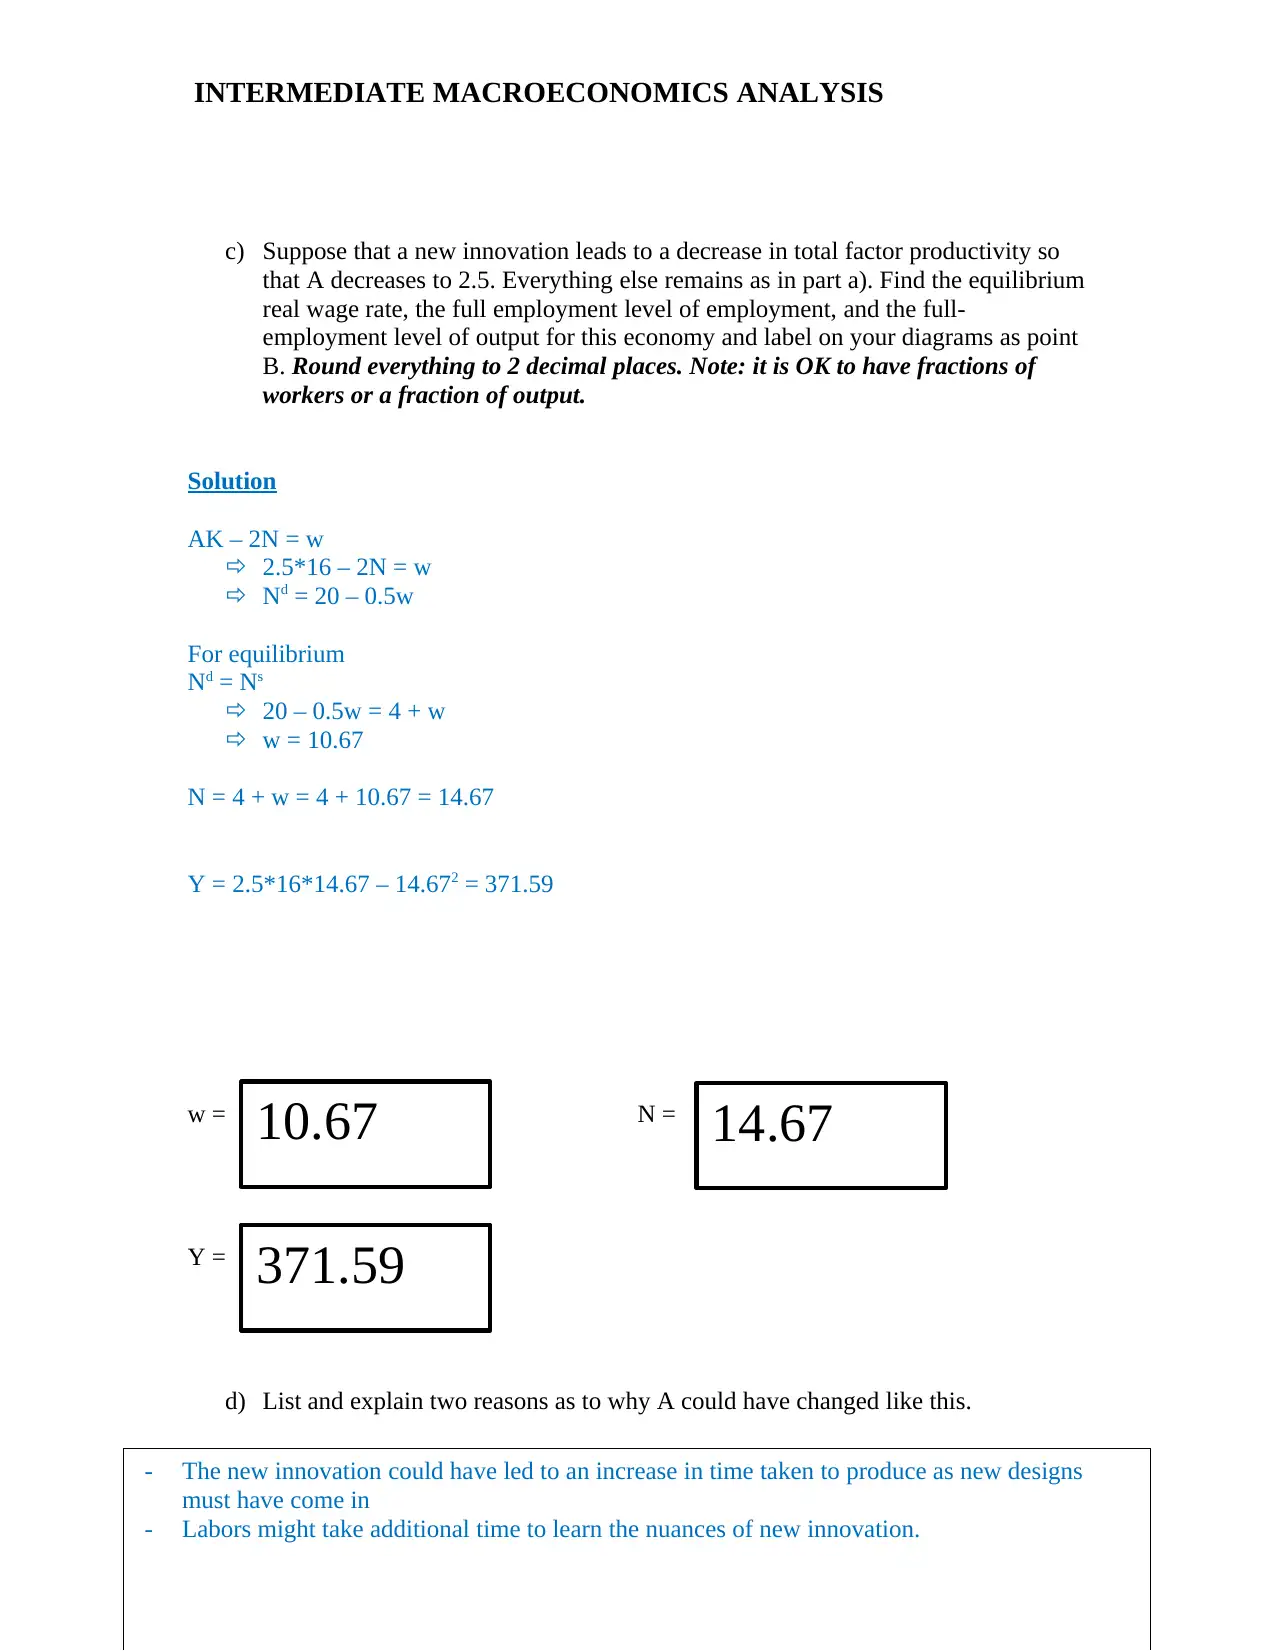
c) Suppose that a new innovation leads to a decrease in total factor productivity so
that A decreases to 2.5. Everything else remains as in part a). Find the equilibrium
real wage rate, the full employment level of employment, and the full-
employment level of output for this economy and label on your diagrams as point
B. Round everything to 2 decimal places. Note: it is OK to have fractions of
workers or a fraction of output.
Solution
AK – 2N = w
2.5*16 – 2N = w
Nd = 20 – 0.5w
For equilibrium
Nd = Ns
20 – 0.5w = 4 + w
w = 10.67
N = 4 + w = 4 + 10.67 = 14.67
Y = 2.5*16*14.67 – 14.672 = 371.59
w = N =
Y =
d) List and explain two reasons as to why A could have changed like this.
11
10.67
371.59
14.67
- The new innovation could have led to an increase in time taken to produce as new designs
must have come in
- Labors might take additional time to learn the nuances of new innovation.
INTERMEDIATE MACROECONOMICS ANALYSIS
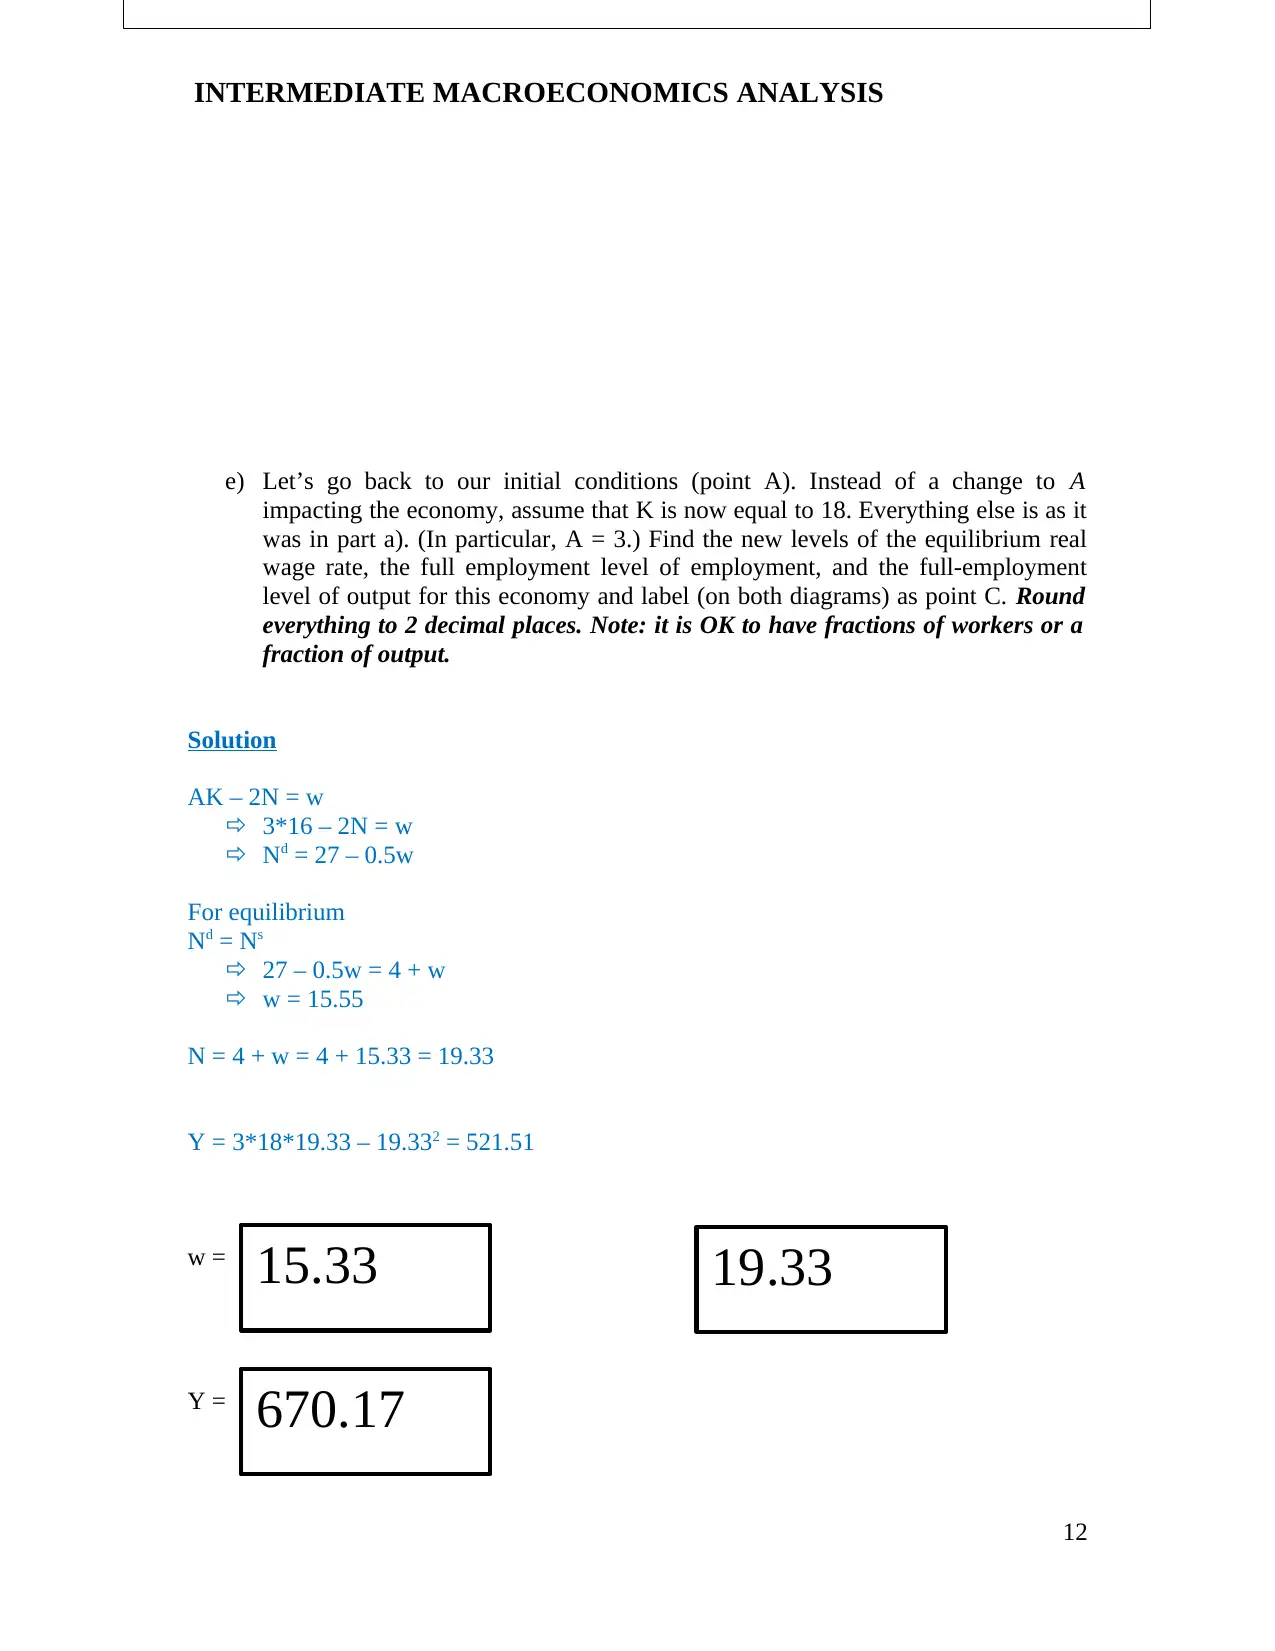
e) Let’s go back to our initial conditions (point A). Instead of a change to A
impacting the economy, assume that K is now equal to 18. Everything else is as it
was in part a). (In particular, A = 3.) Find the new levels of the equilibrium real
wage rate, the full employment level of employment, and the full-employment
level of output for this economy and label (on both diagrams) as point C. Round
everything to 2 decimal places. Note: it is OK to have fractions of workers or a
fraction of output.
Solution
AK – 2N = w
3*16 – 2N = w
Nd = 27 – 0.5w
For equilibrium
Nd = Ns
27 – 0.5w = 4 + w
w = 15.55
N = 4 + w = 4 + 15.33 = 19.33
Y = 3*18*19.33 – 19.332 = 521.51
w =
N =
Y =
12
15.33
670.17
19.33
INTERMEDIATE MACROECONOMICS ANALYSIS
f) List and explain two reasons as to why K could have changed like this.
g) Instead of a change to A or a change in K impacting the economy (we are back to
point A), suppose that there is a change in the supply of labor such that we have
NS = 3 + w (All else remains as in part a)). (In particular, A = 3 and K = 16.) Find
the new levels of the equilibrium real wage rate, the full employment level of
employment, and the full-employment level of output for this economy and label
on your diagrams as point D. Round everything to 2 decimal places. Note: it is
OK to have fractions of workers or a fraction of output.
Solution
AK – 2N = w
3*16 – 2N = w
Nd = 24 – 0.5w
For equilibrium
Nd = Ns
24 – 0.5w = 3 + w
w = 14
N = 3 + w = 3 + 14 = 17
Y = 3*16*17 – 172 = 527
13
- K can increase when additional capital has been invested which increases the productivity
- K can also increase because of new technology which facilitates production.
Paraphrase This Document
Need a fresh take? Get an instant paraphrase of this document with our AI Paraphraser
INTERMEDIATE MACROECONOMICS ANALYSIS
w = N =
Y =
h) Give two well-supported answers as to why Ns might have changed as it did in
part g) above.
J
References
14
14
527
17
- When price for leisure decreases, people can substitute leisure for labor, thereby reducing the
labor supply
- Lowering of wage floor can discourage workers, leading to reduction in labor supply.
INTERMEDIATE MACROECONOMICS ANALYSIS
Carlin, W., & Soskice, D. (2009). Teaching intermediate macroeconomics using the 3-
equation model. In Macroeconomic theory and macroeconomic pedagogy (pp. 13-35).
Palgrave Macmillan, London.
Froyen, R. T., & Perez, S. J. (1990). Macroeconomics: Theories and policies (No. 339 F7
2005.). Macmillan.
Hoover, K. D. (2011). Applied intermediate macroeconomics. Cambridge University
Press.
Millerd, F. W., & Robertson, A. R. (1987). Computer simulations as an integral part of
intermediate macroeconomics. The Journal of Economic Education, 18(3), 269-286.
Salemi, M. K. (1996). Microeconomic Concepts Students Should Learn Before
Intermediate Macroeconomics. The Journal of Economic Education, 27(2), 116-125.
Walsh, C. E. (2002). Teaching inflation targeting: An analysis for intermediate
macro. The Journal of Economic Education, 33(4), 333-346.
Weerapana, A. (2003). Intermediate macroeconomics without the IS-LM model. The
Journal of Economic Education, 34(3), 241-262.
15
1 out of 15
Your All-in-One AI-Powered Toolkit for Academic Success.
+13062052269
info@desklib.com
Available 24*7 on WhatsApp / Email
![[object Object]](/_next/static/media/star-bottom.7253800d.svg)
Unlock your academic potential
© 2024 | Zucol Services PVT LTD | All rights reserved.