International Economics Assignment 1 Solution - RMIT University
VerifiedAdded on 2023/04/07
|7
|893
|361
Homework Assignment
AI Summary
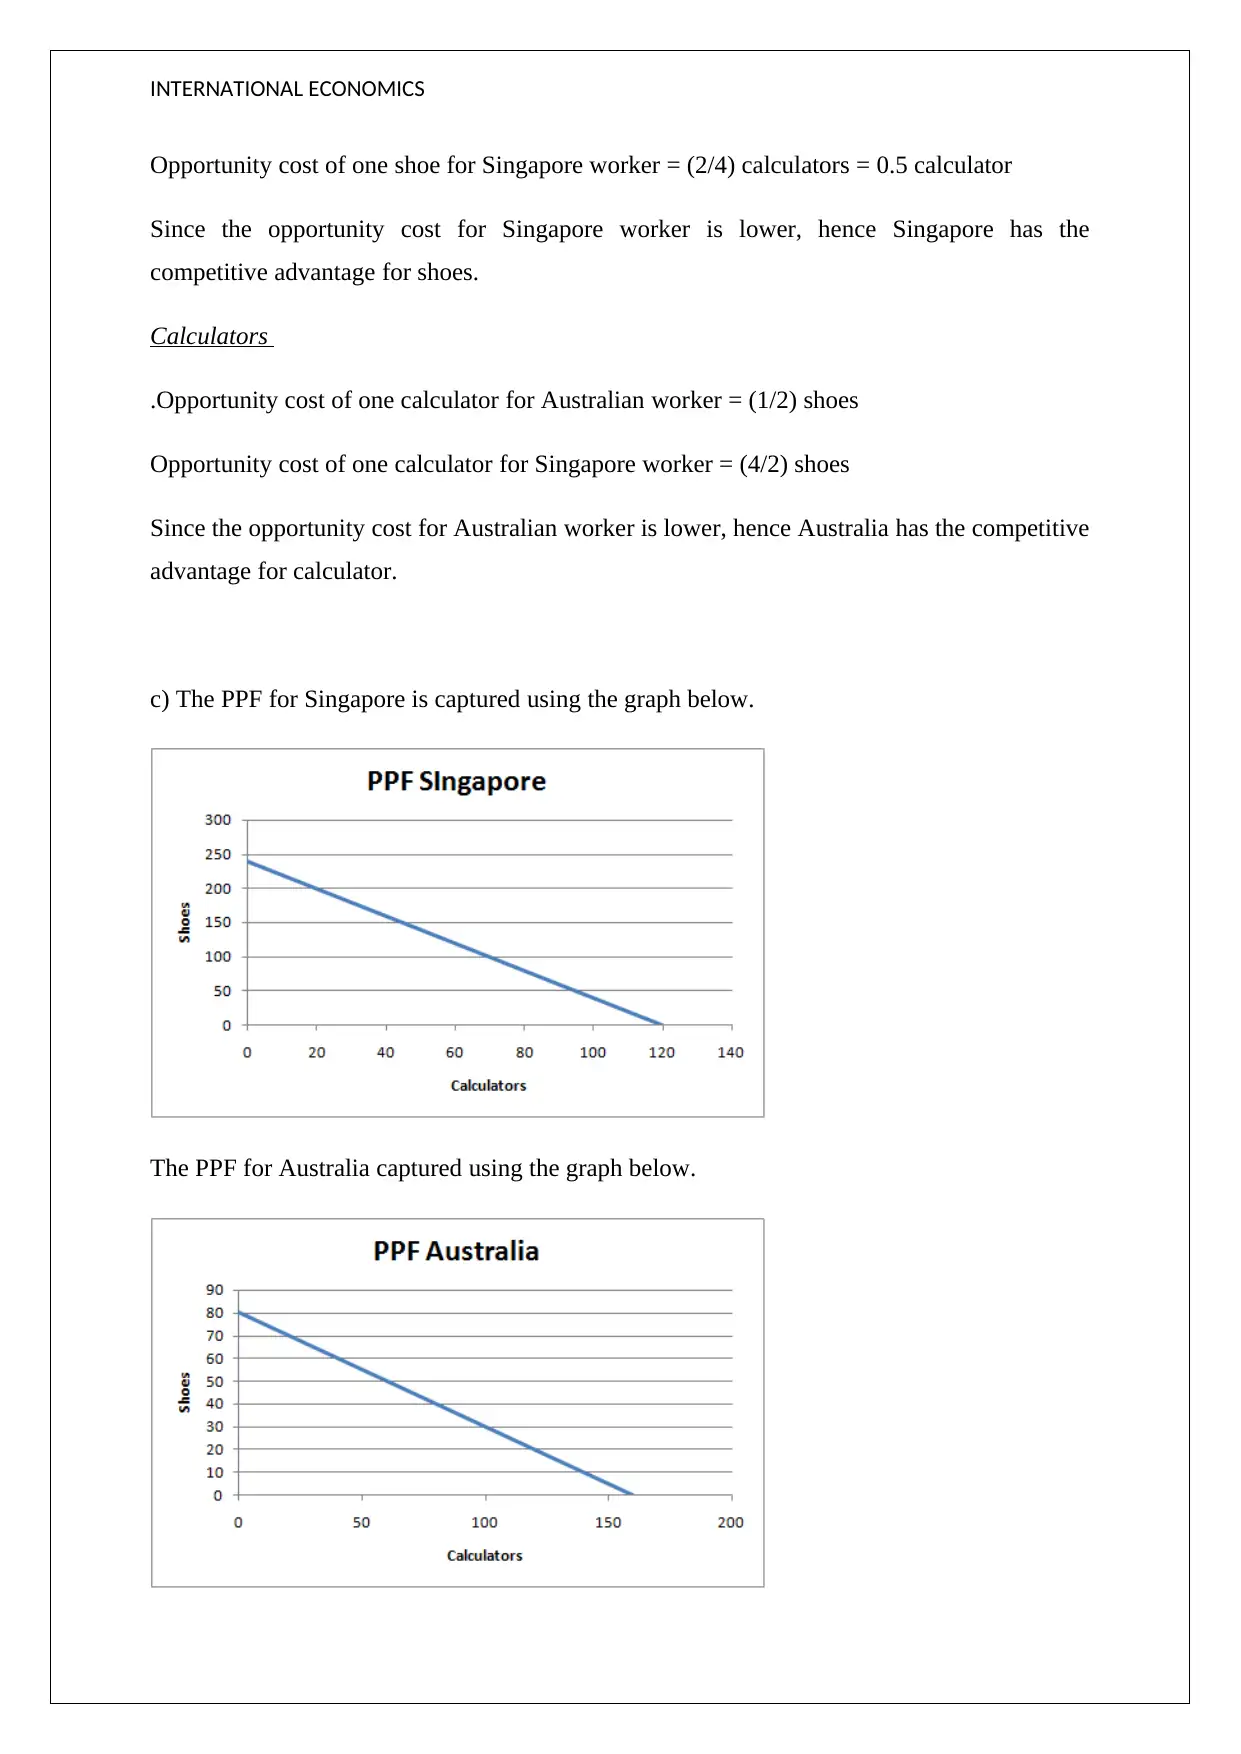
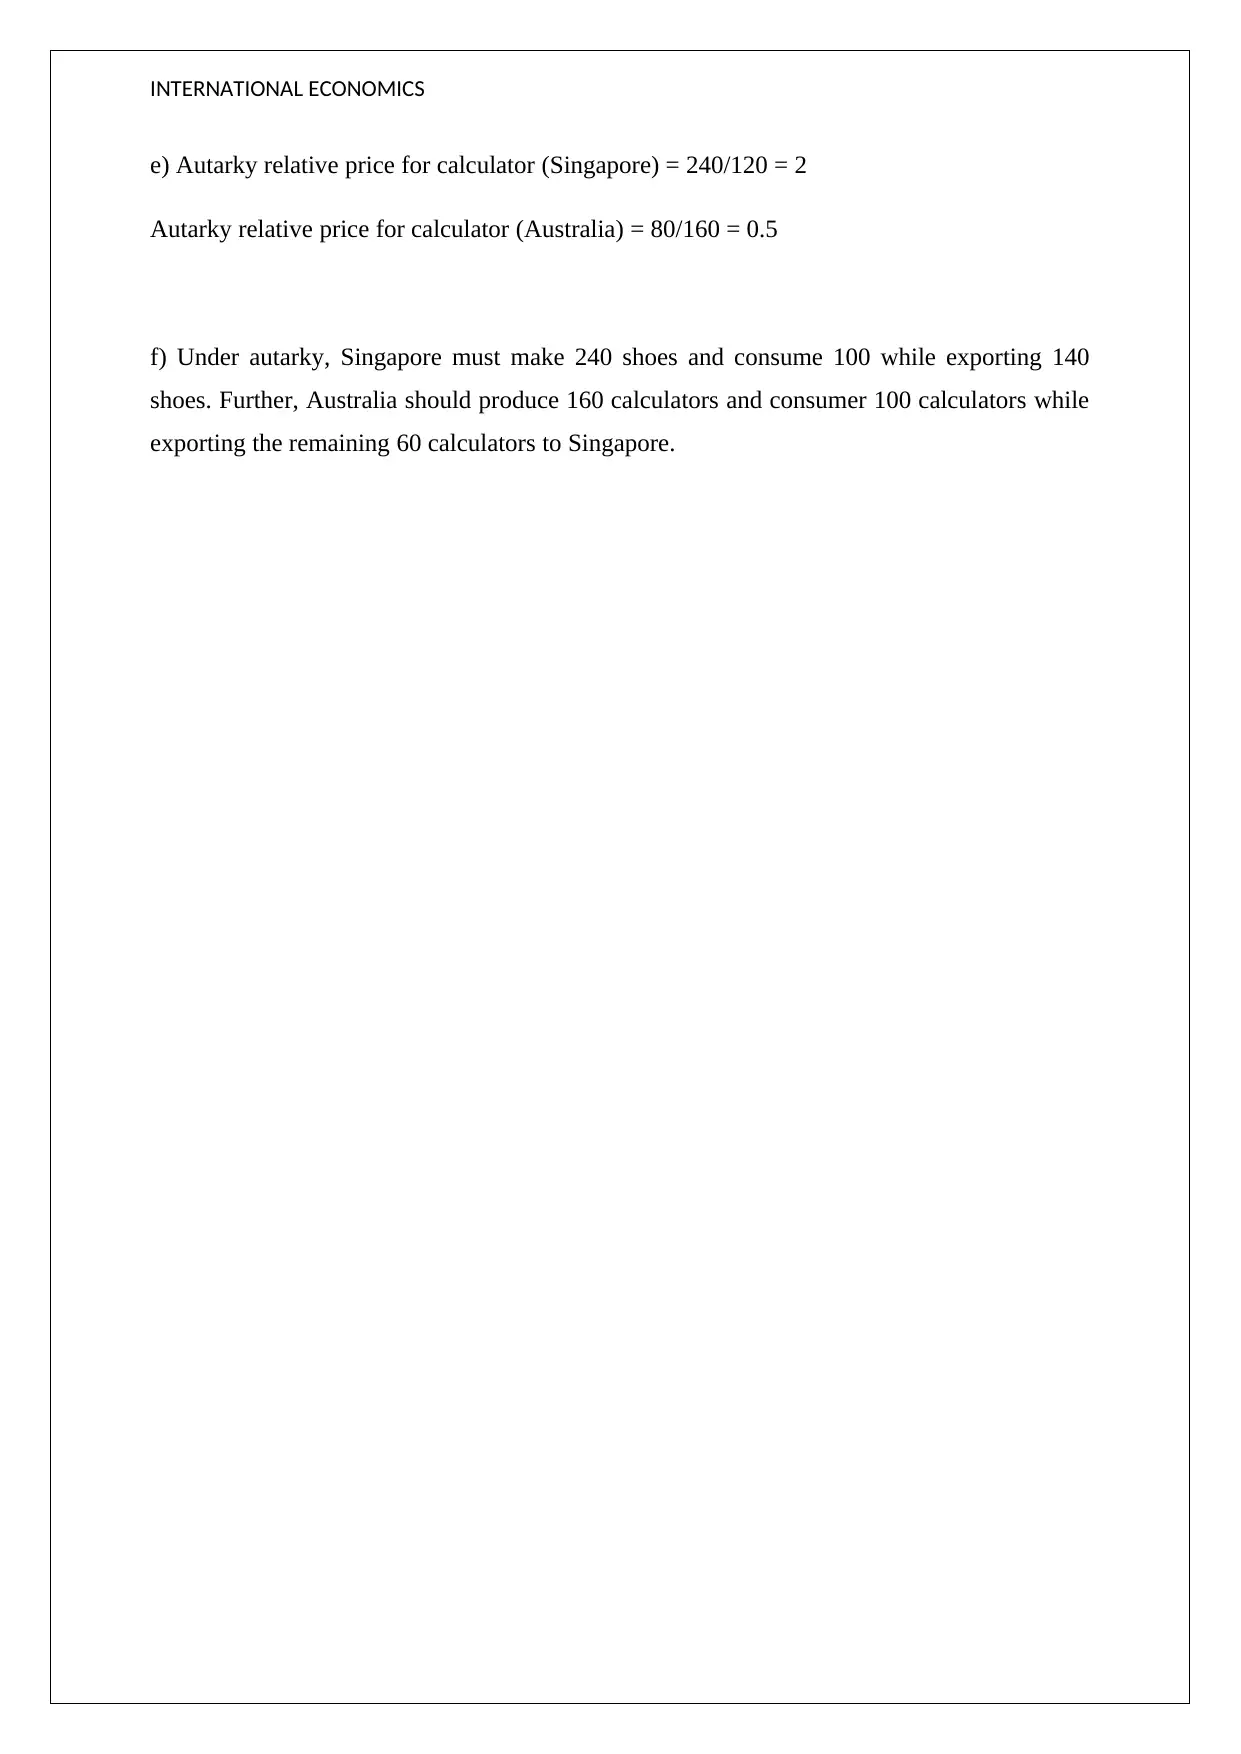
This International Economics assignment solution analyzes trade openness for Italy and Sweden from 2003-2015, calculating trade openness percentages and comparing their trends, including the impact of the 2008 financial crisis. It examines the correlation between trade openness and GDP per capita for both countries, revealing a positive relationship. The solution also explores the concepts of absolute and comparative advantage using a hypothetical scenario involving Singapore and Australia, calculating opportunity costs and constructing Production Possibility Frontiers (PPF). Finally, it determines autarky relative prices and trade scenarios under autarky, providing a comprehensive understanding of international trade principles. The assignment references relevant economic literature to support its analysis.
1 out of 7
Related Documents


Your All-in-One AI-Powered Toolkit for Academic Success.
+13062052269
info@desklib.com
Available 24*7 on WhatsApp / Email
![[object Object]](/_next/static/media/star-bottom.7253800d.svg)
Copyright © 2020–2026 A2Z Services. All Rights Reserved. Developed and managed by ZUCOL.