Financial Management Report: Risk and Investment Analysis
VerifiedAdded on 2022/12/14
|16
|3331
|401
Report
AI Summary
This report delves into the core concepts of International Financial Management, presenting a detailed analysis of financial management practices within enterprises. The report begins with an introduction to financial management, emphasizing its importance in planning, organizing, managing, and reporting financial capital. It then proceeds to address three key questions, primarily involving numerical tasks. The first question focuses on calculating the expected Net Present Value (NPV) and its standard deviation, essential for assessing investment viability under uncertainty. The subsequent questions explore NPV calculations under various scenarios to aid in decision-making, considering factors like cash inflows, probabilities, and discounting rates. The report includes detailed calculations and interpretations, providing insights into project rankings, the comparison of NPV and Internal Rate of Return (IRR), and the probability of achieving specific financial outcomes, such as avoiding liquidation or exceeding certain NPV thresholds. The analysis incorporates concepts of risk assessment, capital budgeting, and financial decision-making, offering a comprehensive overview of the subject.

International Financial Management
1
1
Paraphrase This Document
Need a fresh take? Get an instant paraphrase of this document with our AI Paraphraser

Contents
INTRODUCTION...........................................................................................................................3
MAIN BODY...................................................................................................................................3
Question 1........................................................................................................................................3
Question 2........................................................................................................................................5
Question 3......................................................................................................................................10
Conclusion.....................................................................................................................................14
References......................................................................................................................................16
2
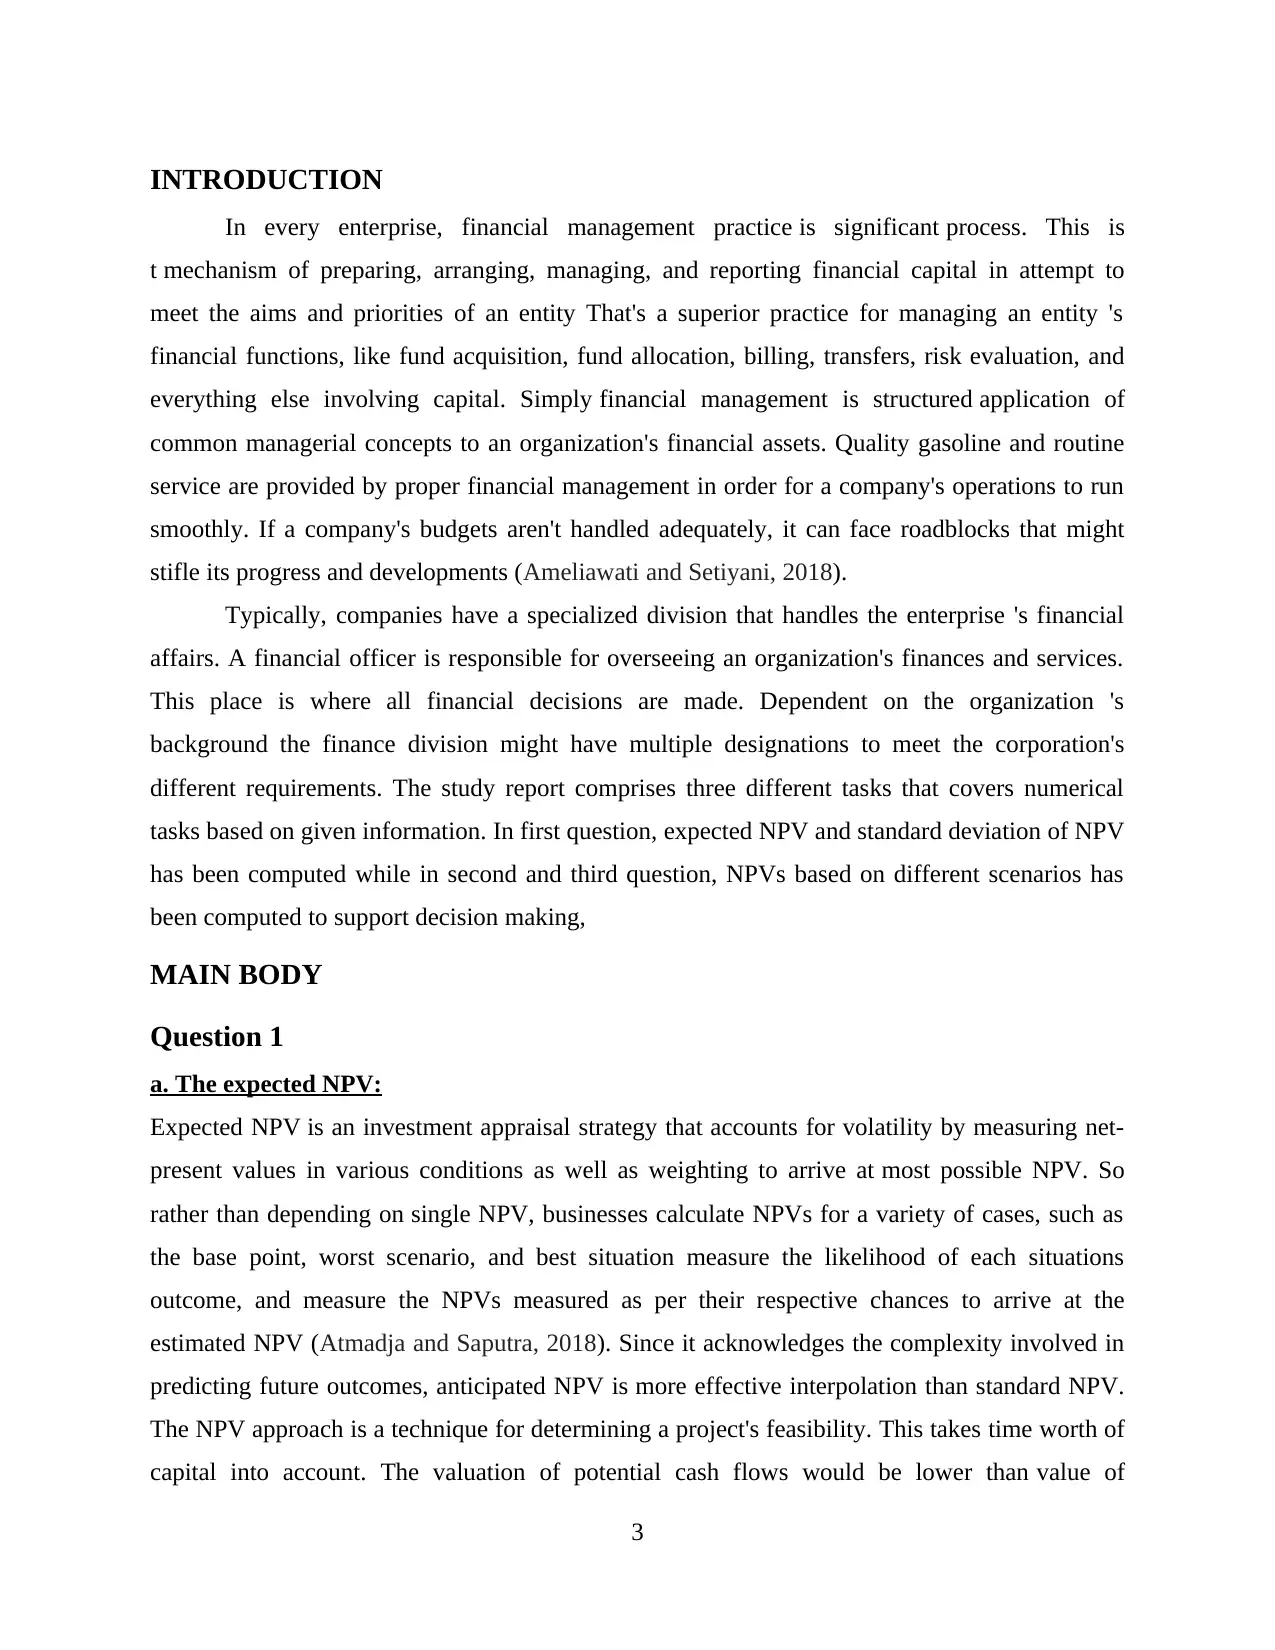
INTRODUCTION
In every enterprise, financial management practice is significant process. This is
t mechanism of preparing, arranging, managing, and reporting financial capital in attempt to
meet the aims and priorities of an entity That's a superior practice for managing an entity 's
financial functions, like fund acquisition, fund allocation, billing, transfers, risk evaluation, and
everything else involving capital. Simply financial management is structured application of
common managerial concepts to an organization's financial assets. Quality gasoline and routine
service are provided by proper financial management in order for a company's operations to run
smoothly. If a company's budgets aren't handled adequately, it can face roadblocks that might
stifle its progress and developments (Ameliawati and Setiyani, 2018).
Typically, companies have a specialized division that handles the enterprise 's financial
affairs. A financial officer is responsible for overseeing an organization's finances and services.
This place is where all financial decisions are made. Dependent on the organization 's
background the finance division might have multiple designations to meet the corporation's
different requirements. The study report comprises three different tasks that covers numerical
tasks based on given information. In first question, expected NPV and standard deviation of NPV
has been computed while in second and third question, NPVs based on different scenarios has
been computed to support decision making,
MAIN BODY
Question 1
a. The expected NPV:
Expected NPV is an investment appraisal strategy that accounts for volatility by measuring net-
present values in various conditions as well as weighting to arrive at most possible NPV. So
rather than depending on single NPV, businesses calculate NPVs for a variety of cases, such as
the base point, worst scenario, and best situation measure the likelihood of each situations
outcome, and measure the NPVs measured as per their respective chances to arrive at the
estimated NPV (Atmadja and Saputra, 2018). Since it acknowledges the complexity involved in
predicting future outcomes, anticipated NPV is more effective interpolation than standard NPV.
The NPV approach is a technique for determining a project's feasibility. This takes time worth of
capital into account. The valuation of potential cash flows would be lower than value of
3
⊘ This is a preview!⊘
Do you want full access?
Subscribe today to unlock all pages.
Trusted by 1+ million students worldwide
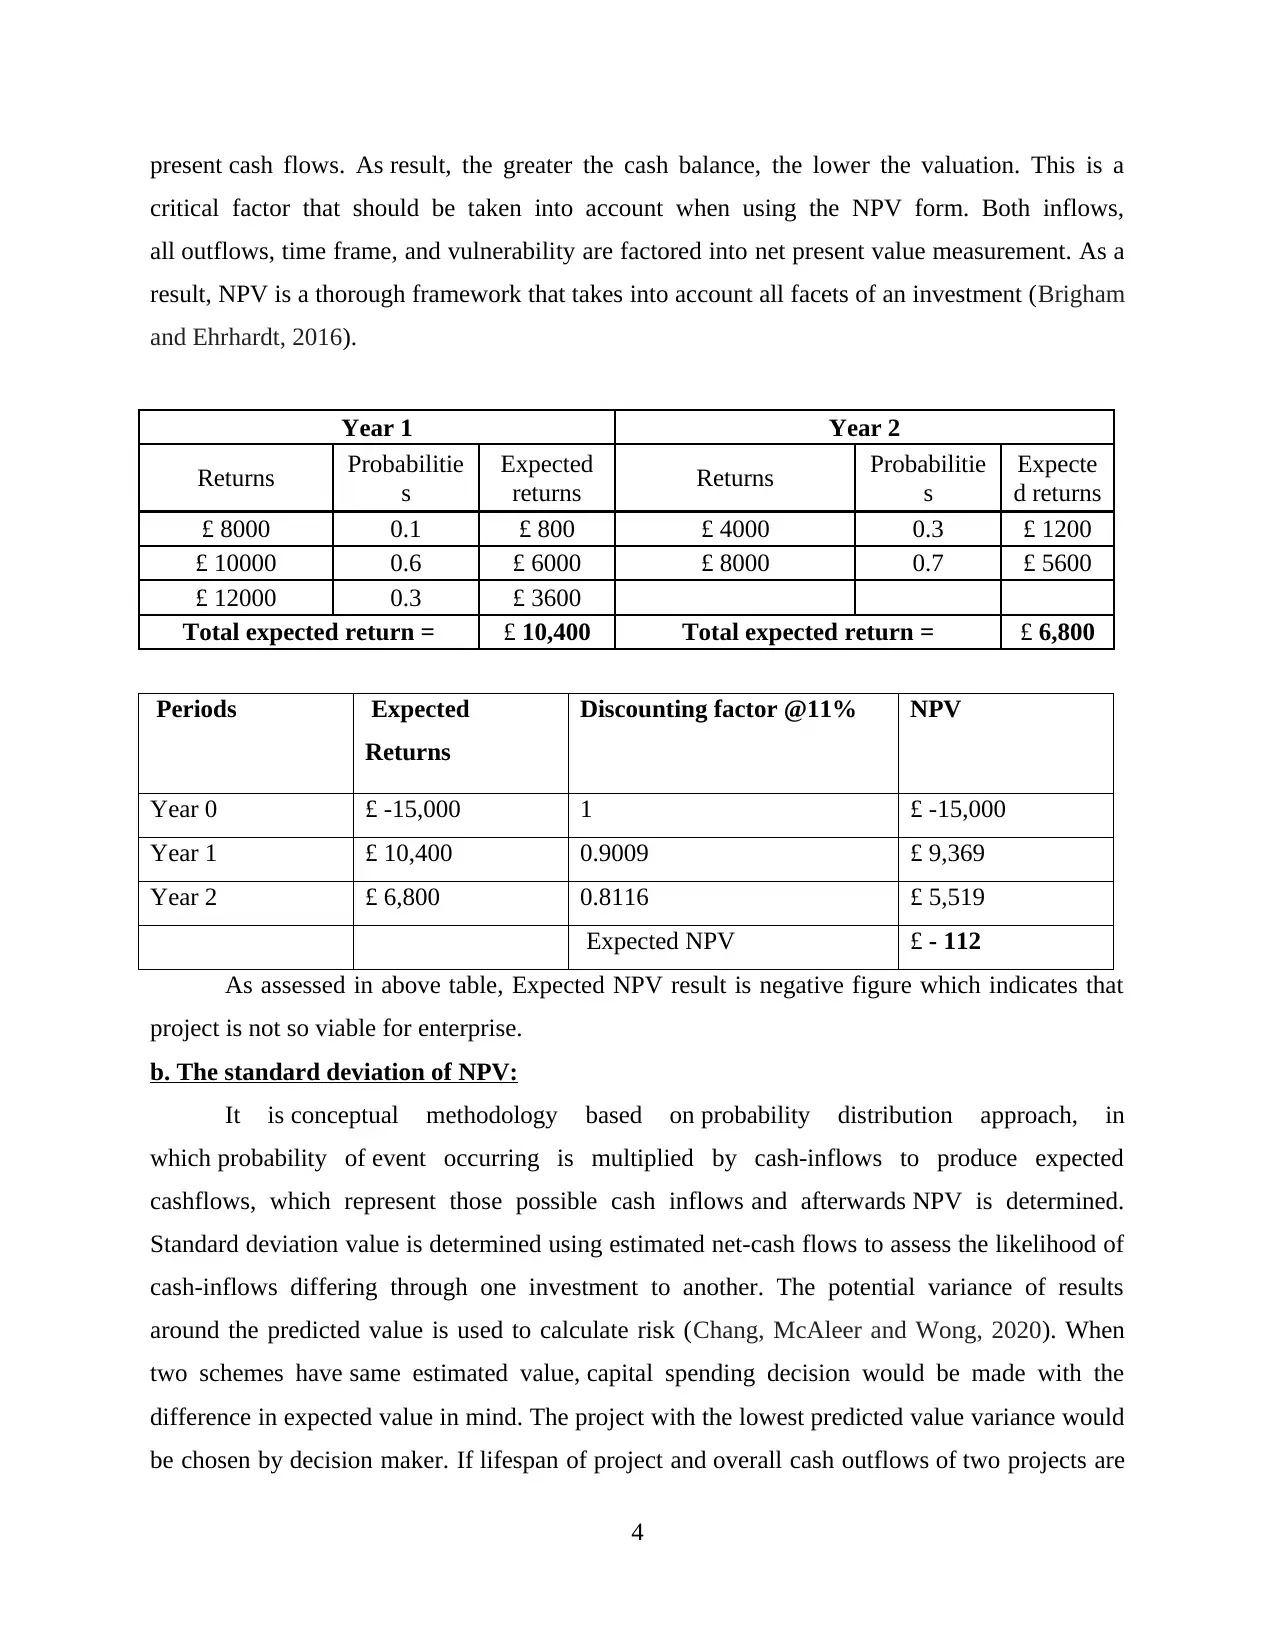
present cash flows. As result, the greater the cash balance, the lower the valuation. This is a
critical factor that should be taken into account when using the NPV form. Both inflows,
all outflows, time frame, and vulnerability are factored into net present value measurement. As a
result, NPV is a thorough framework that takes into account all facets of an investment (Brigham
and Ehrhardt, 2016).
Year 1 Year 2
Returns Probabilitie
s
Expected
returns Returns Probabilitie
s
Expecte
d returns
£ 8000 0.1 £ 800 £ 4000 0.3 £ 1200
£ 10000 0.6 £ 6000 £ 8000 0.7 £ 5600
£ 12000 0.3 £ 3600
Total expected return = £ 10,400 Total expected return = £ 6,800
Periods Expected
Returns
Discounting factor @11% NPV
Year 0 £ -15,000 1 £ -15,000
Year 1 £ 10,400 0.9009 £ 9,369
Year 2 £ 6,800 0.8116 £ 5,519
Expected NPV £ - 112
As assessed in above table, Expected NPV result is negative figure which indicates that
project is not so viable for enterprise.
b. The standard deviation of NPV:
It is conceptual methodology based on probability distribution approach, in
which probability of event occurring is multiplied by cash-inflows to produce expected
cashflows, which represent those possible cash inflows and afterwards NPV is determined.
Standard deviation value is determined using estimated net-cash flows to assess the likelihood of
cash-inflows differing through one investment to another. The potential variance of results
around the predicted value is used to calculate risk (Chang, McAleer and Wong, 2020). When
two schemes have same estimated value, capital spending decision would be made with the
difference in expected value in mind. The project with the lowest predicted value variance would
be chosen by decision maker. If lifespan of project and overall cash outflows of two projects are
4
Paraphrase This Document
Need a fresh take? Get an instant paraphrase of this document with our AI Paraphraser
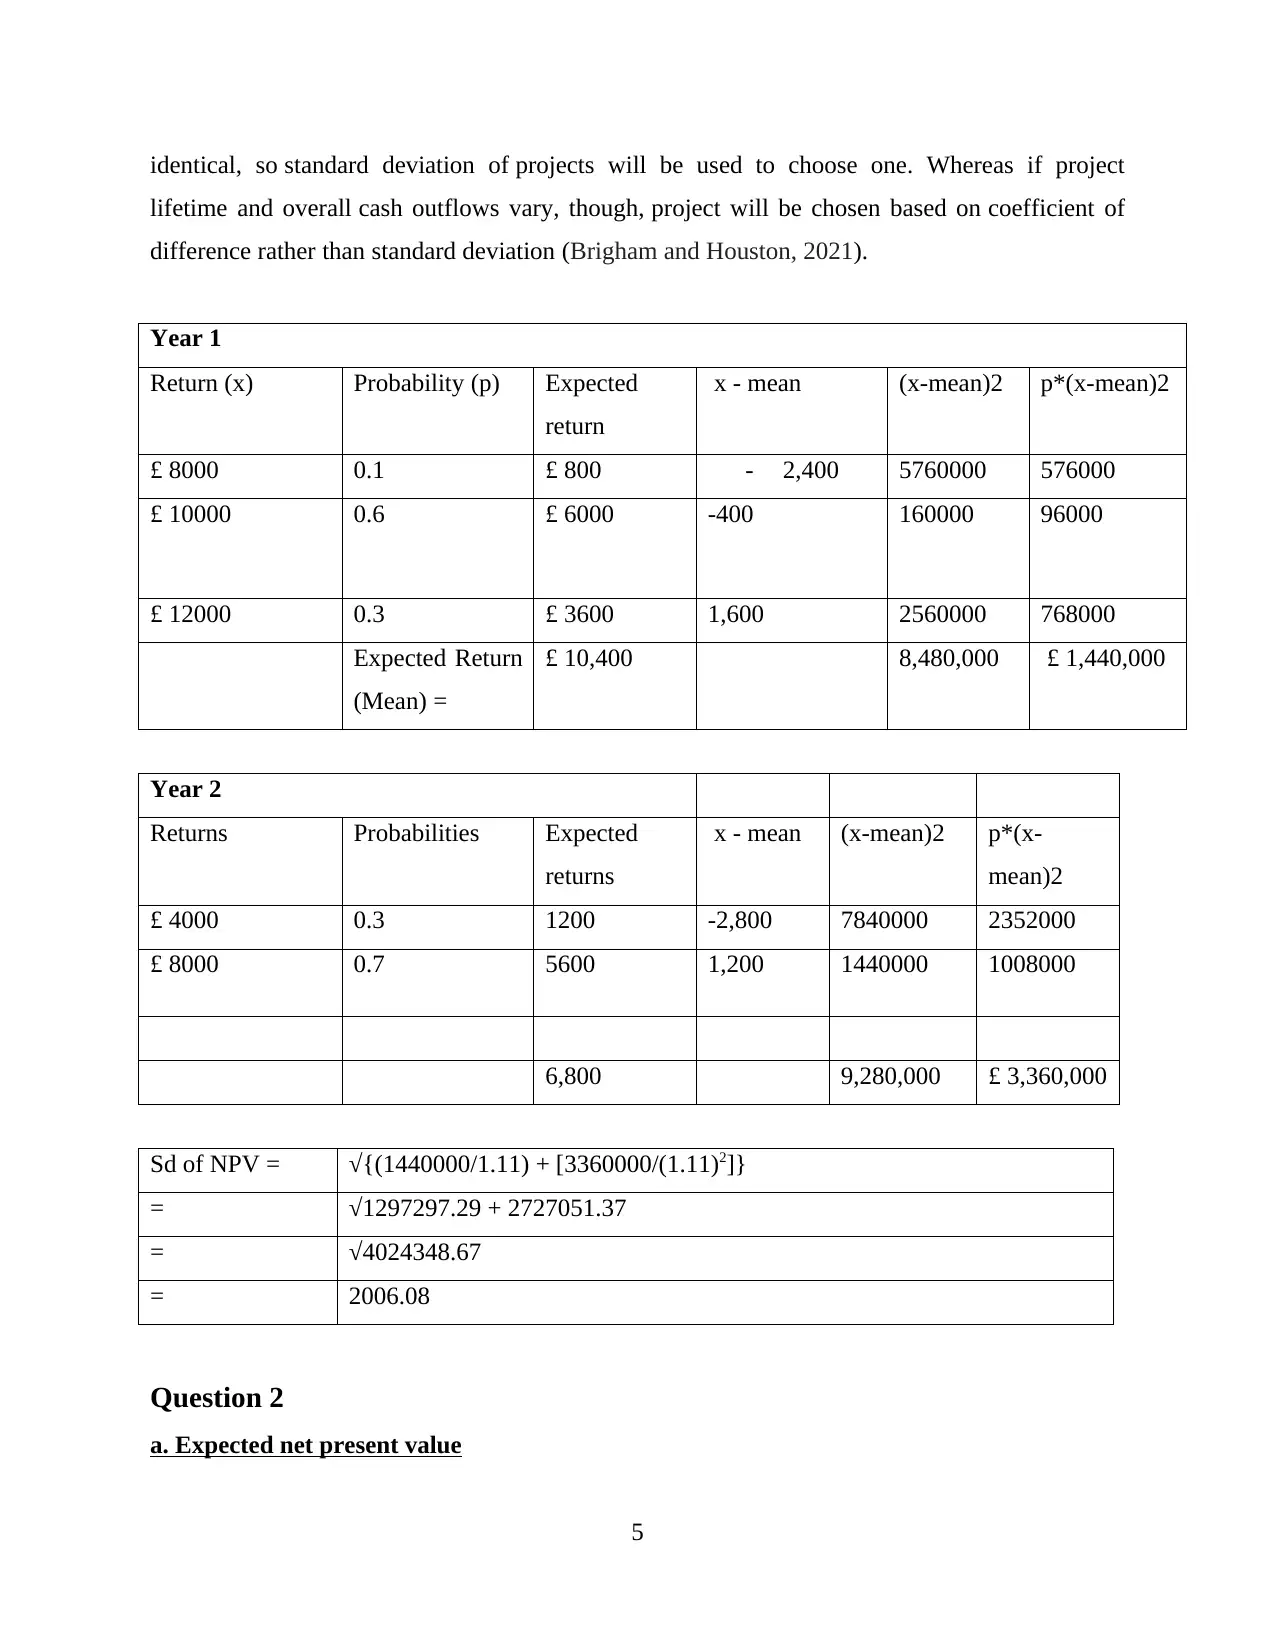
identical, so standard deviation of projects will be used to choose one. Whereas if project
lifetime and overall cash outflows vary, though, project will be chosen based on coefficient of
difference rather than standard deviation (Brigham and Houston, 2021).
Year 1
Return (x) Probability (p) Expected
return
x - mean (x-mean)2 p*(x-mean)2
£ 8000 0.1 £ 800 - 2,400 5760000 576000
£ 10000 0.6 £ 6000 -400 160000 96000
£ 12000 0.3 £ 3600 1,600 2560000 768000
Expected Return
(Mean) =
£ 10,400 8,480,000 £ 1,440,000
Year 2
Returns Probabilities Expected
returns
x - mean (x-mean)2 p*(x-
mean)2
£ 4000 0.3 1200 -2,800 7840000 2352000
£ 8000 0.7 5600 1,200 1440000 1008000
6,800 9,280,000 £ 3,360,000
Sd of NPV = √{(1440000/1.11) + [3360000/(1.11)2]}
= √1297297.29 + 2727051.37
= √4024348.67
= 2006.08
Question 2
a. Expected net present value
5
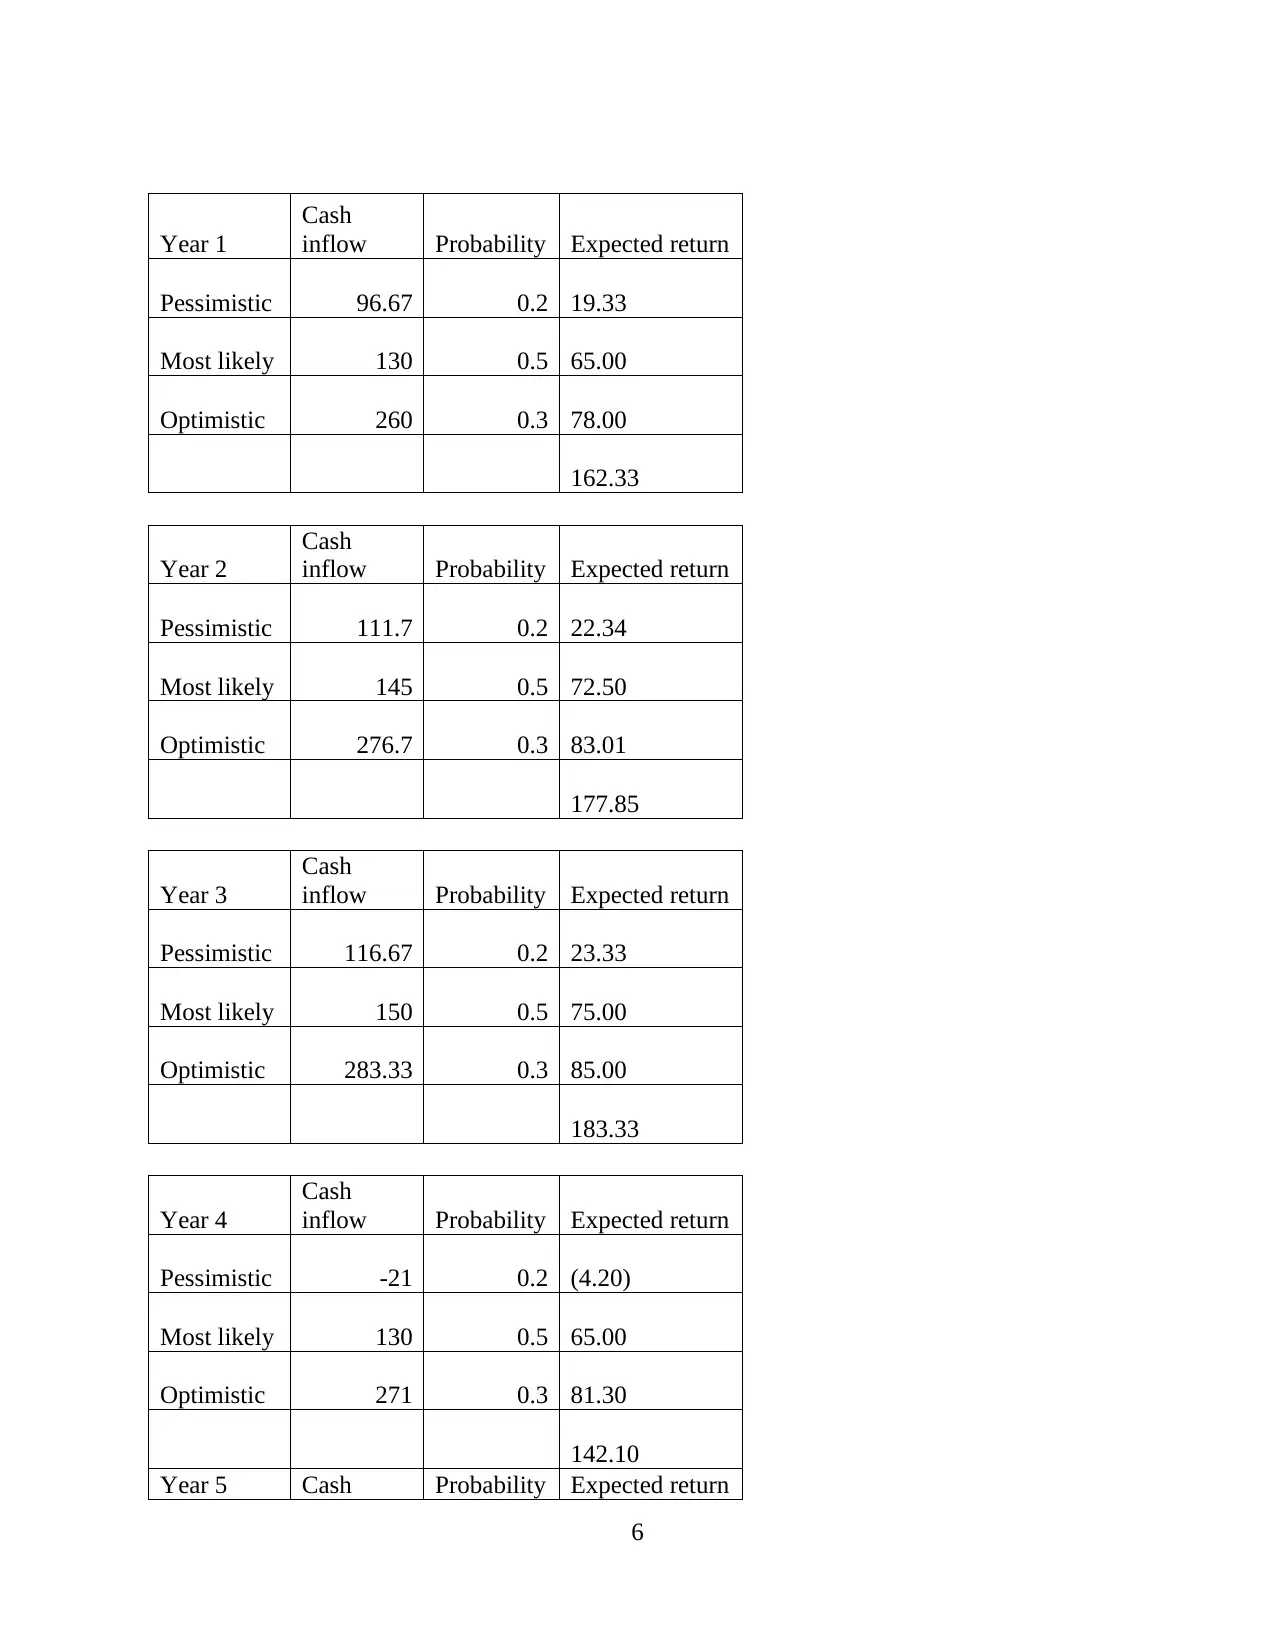
Year 1
Cash
inflow Probability Expected return
Pessimistic 96.67 0.2 19.33
Most likely 130 0.5 65.00
Optimistic 260 0.3 78.00
162.33
Year 2
Cash
inflow Probability Expected return
Pessimistic 111.7 0.2 22.34
Most likely 145 0.5 72.50
Optimistic 276.7 0.3 83.01
177.85
Year 3
Cash
inflow Probability Expected return
Pessimistic 116.67 0.2 23.33
Most likely 150 0.5 75.00
Optimistic 283.33 0.3 85.00
183.33
Year 4
Cash
inflow Probability Expected return
Pessimistic -21 0.2 (4.20)
Most likely 130 0.5 65.00
Optimistic 271 0.3 81.30
142.10
Year 5 Cash Probability Expected return
6
Cash
inflow Probability Expected return
Pessimistic 96.67 0.2 19.33
Most likely 130 0.5 65.00
Optimistic 260 0.3 78.00
162.33
Year 2
Cash
inflow Probability Expected return
Pessimistic 111.7 0.2 22.34
Most likely 145 0.5 72.50
Optimistic 276.7 0.3 83.01
177.85
Year 3
Cash
inflow Probability Expected return
Pessimistic 116.67 0.2 23.33
Most likely 150 0.5 75.00
Optimistic 283.33 0.3 85.00
183.33
Year 4
Cash
inflow Probability Expected return
Pessimistic -21 0.2 (4.20)
Most likely 130 0.5 65.00
Optimistic 271 0.3 81.30
142.10
Year 5 Cash Probability Expected return
6
⊘ This is a preview!⊘
Do you want full access?
Subscribe today to unlock all pages.
Trusted by 1+ million students worldwide
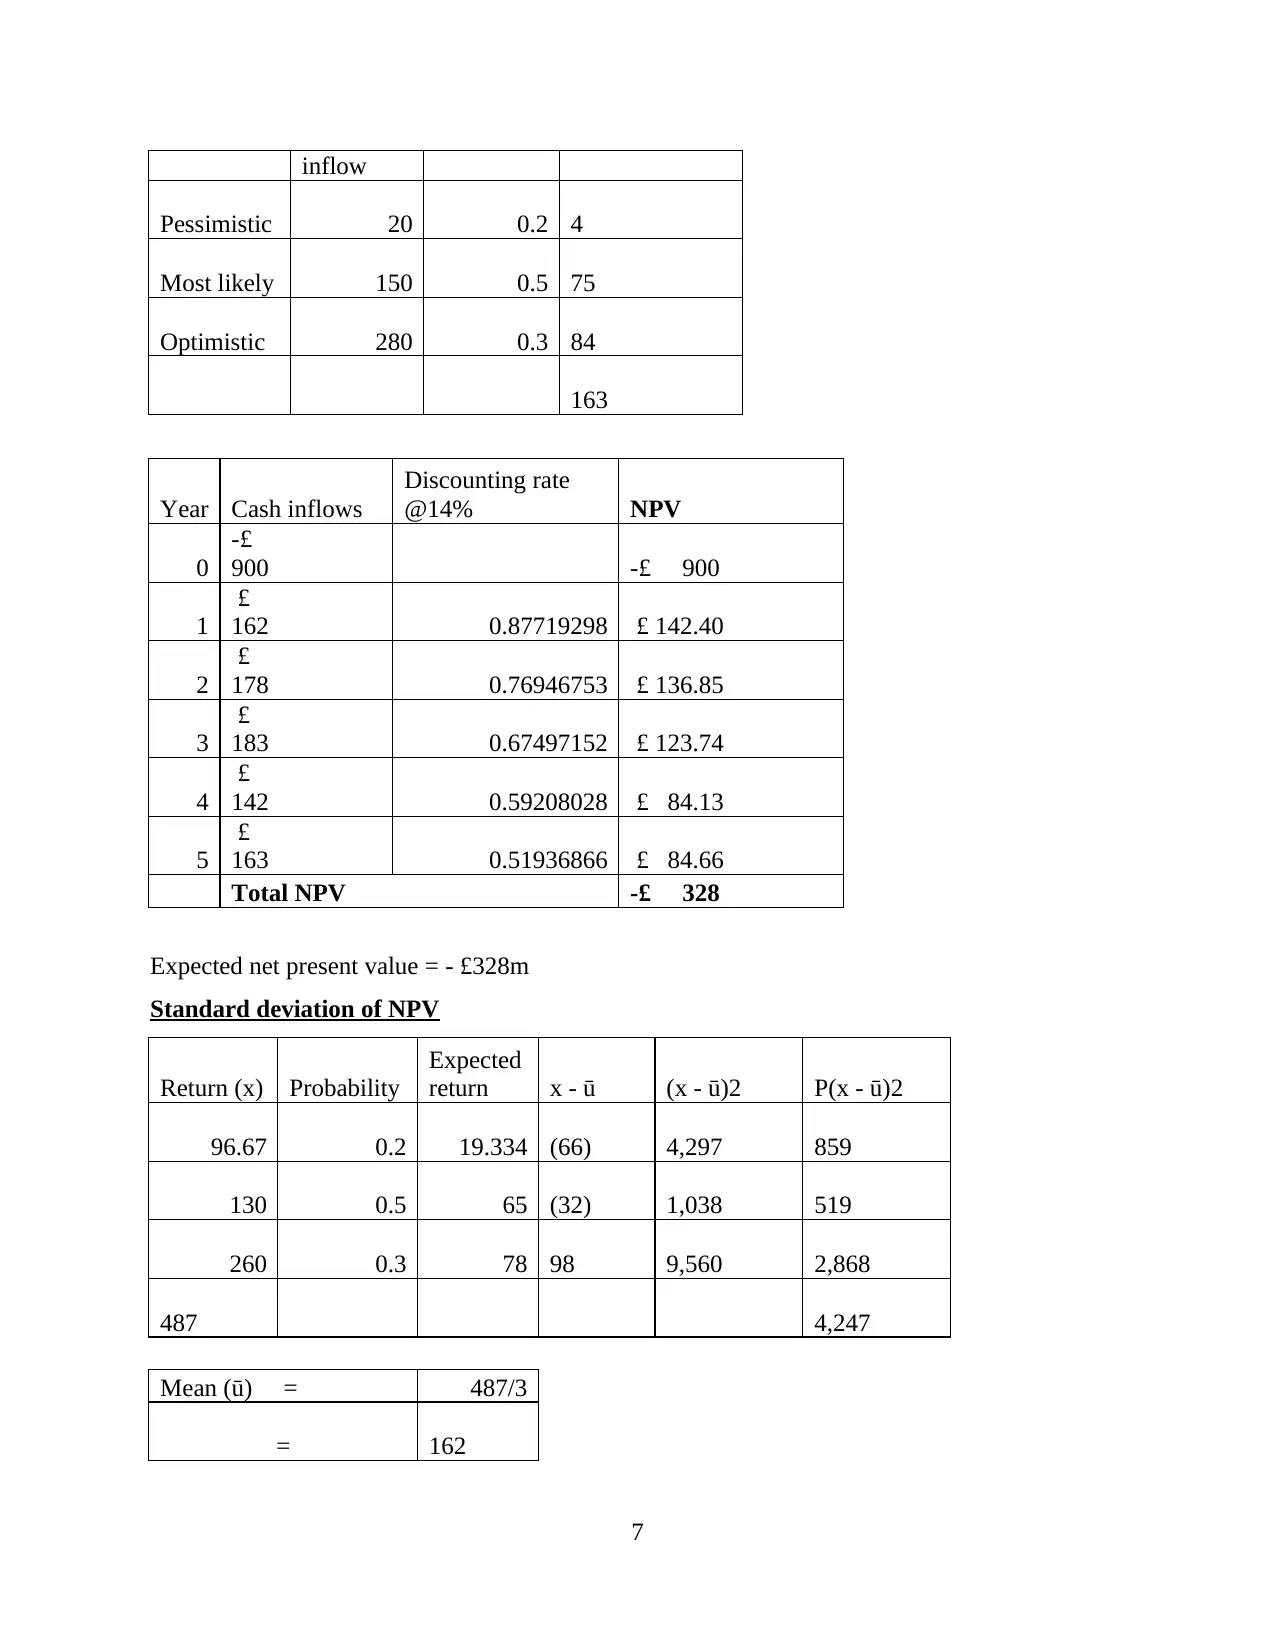
inflow
Pessimistic 20 0.2 4
Most likely 150 0.5 75
Optimistic 280 0.3 84
163
Year Cash inflows
Discounting rate
@14% NPV
0
-£
900 -£ 900
1
£
162 0.87719298 £ 142.40
2
£
178 0.76946753 £ 136.85
3
£
183 0.67497152 £ 123.74
4
£
142 0.59208028 £ 84.13
5
£
163 0.51936866 £ 84.66
Total NPV -£ 328
Expected net present value = - £328m
Standard deviation of NPV
Return (x) Probability
Expected
return x - ū (x - ū)2 P(x - ū)2
96.67 0.2 19.334 (66) 4,297 859
130 0.5 65 (32) 1,038 519
260 0.3 78 98 9,560 2,868
487 4,247
Mean (ū) = 487/3
= 162
7
Paraphrase This Document
Need a fresh take? Get an instant paraphrase of this document with our AI Paraphraser
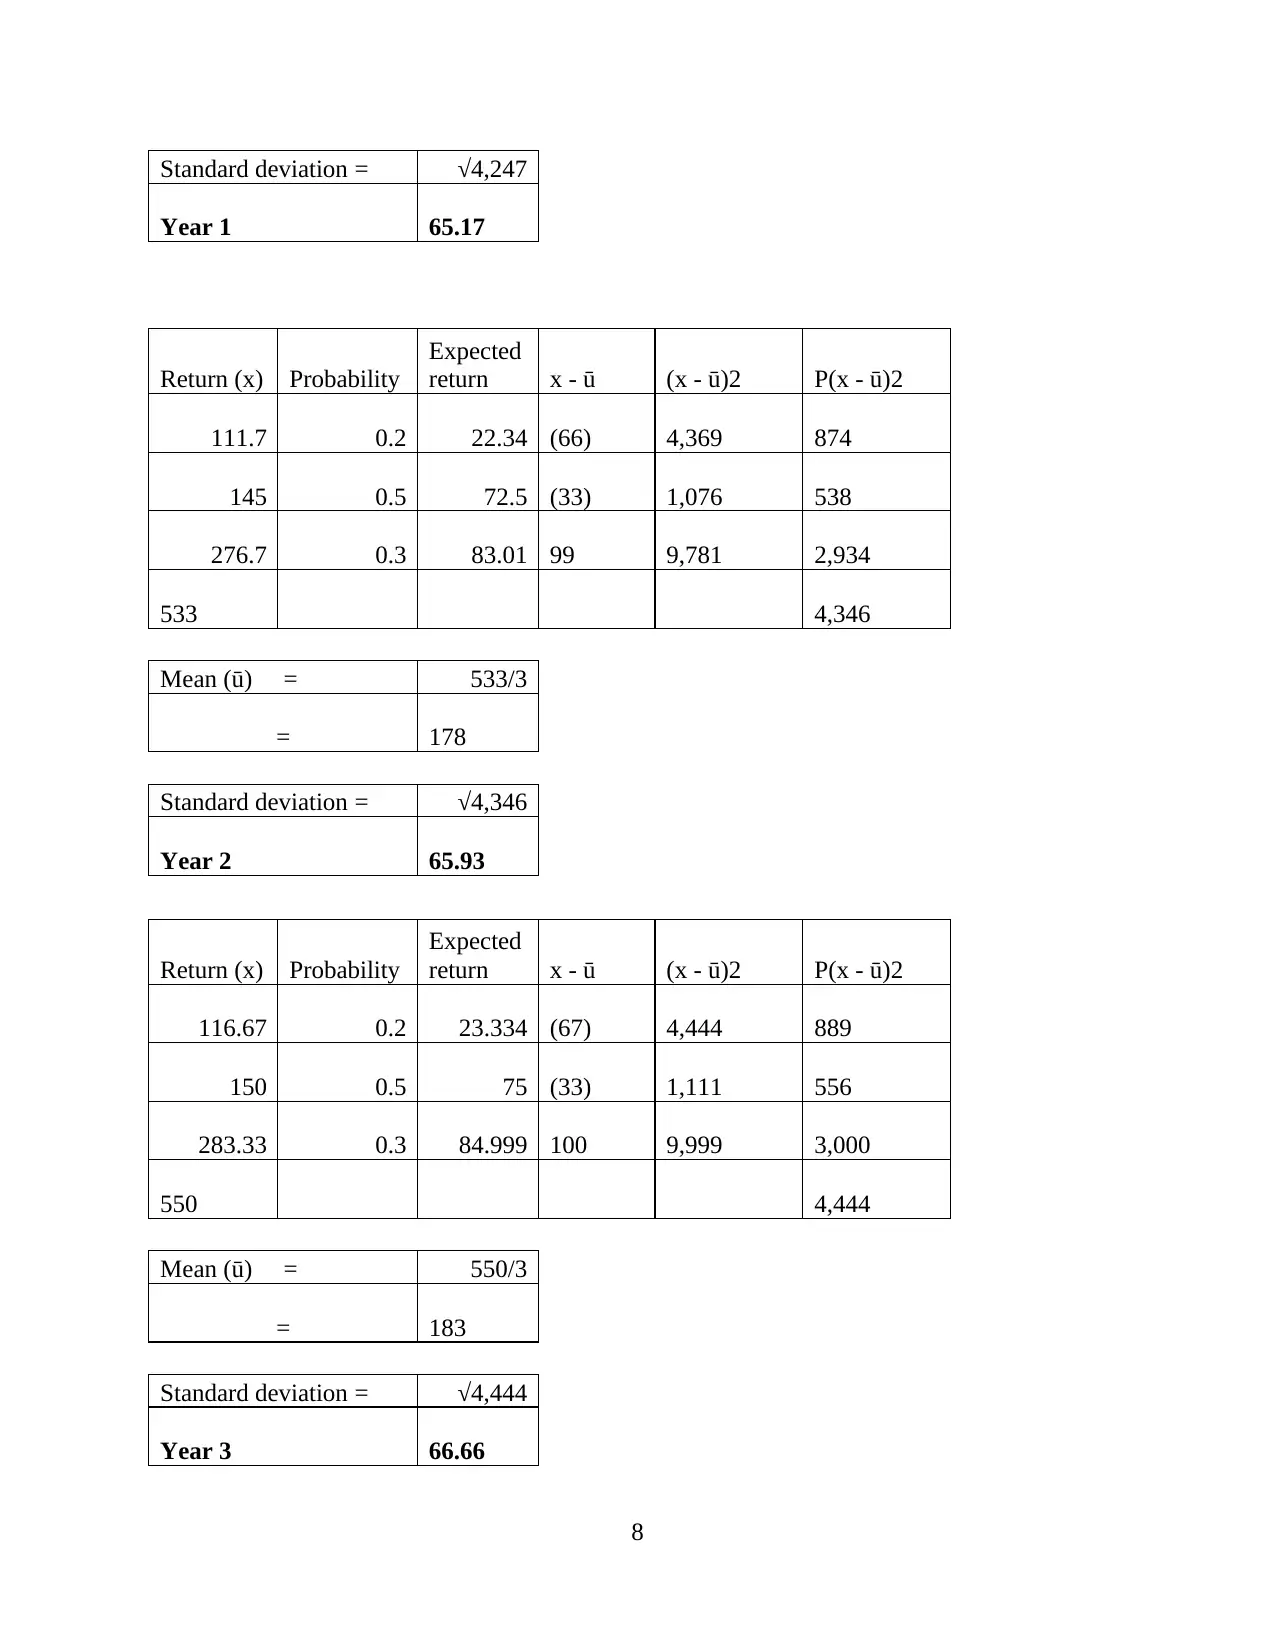
Standard deviation = √4,247
Year 1 65.17
Return (x) Probability
Expected
return x - ū (x - ū)2 P(x - ū)2
111.7 0.2 22.34 (66) 4,369 874
145 0.5 72.5 (33) 1,076 538
276.7 0.3 83.01 99 9,781 2,934
533 4,346
Mean (ū) = 533/3
= 178
Standard deviation = √4,346
Year 2 65.93
Return (x) Probability
Expected
return x - ū (x - ū)2 P(x - ū)2
116.67 0.2 23.334 (67) 4,444 889
150 0.5 75 (33) 1,111 556
283.33 0.3 84.999 100 9,999 3,000
550 4,444
Mean (ū) = 550/3
= 183
Standard deviation = √4,444
Year 3 66.66
8
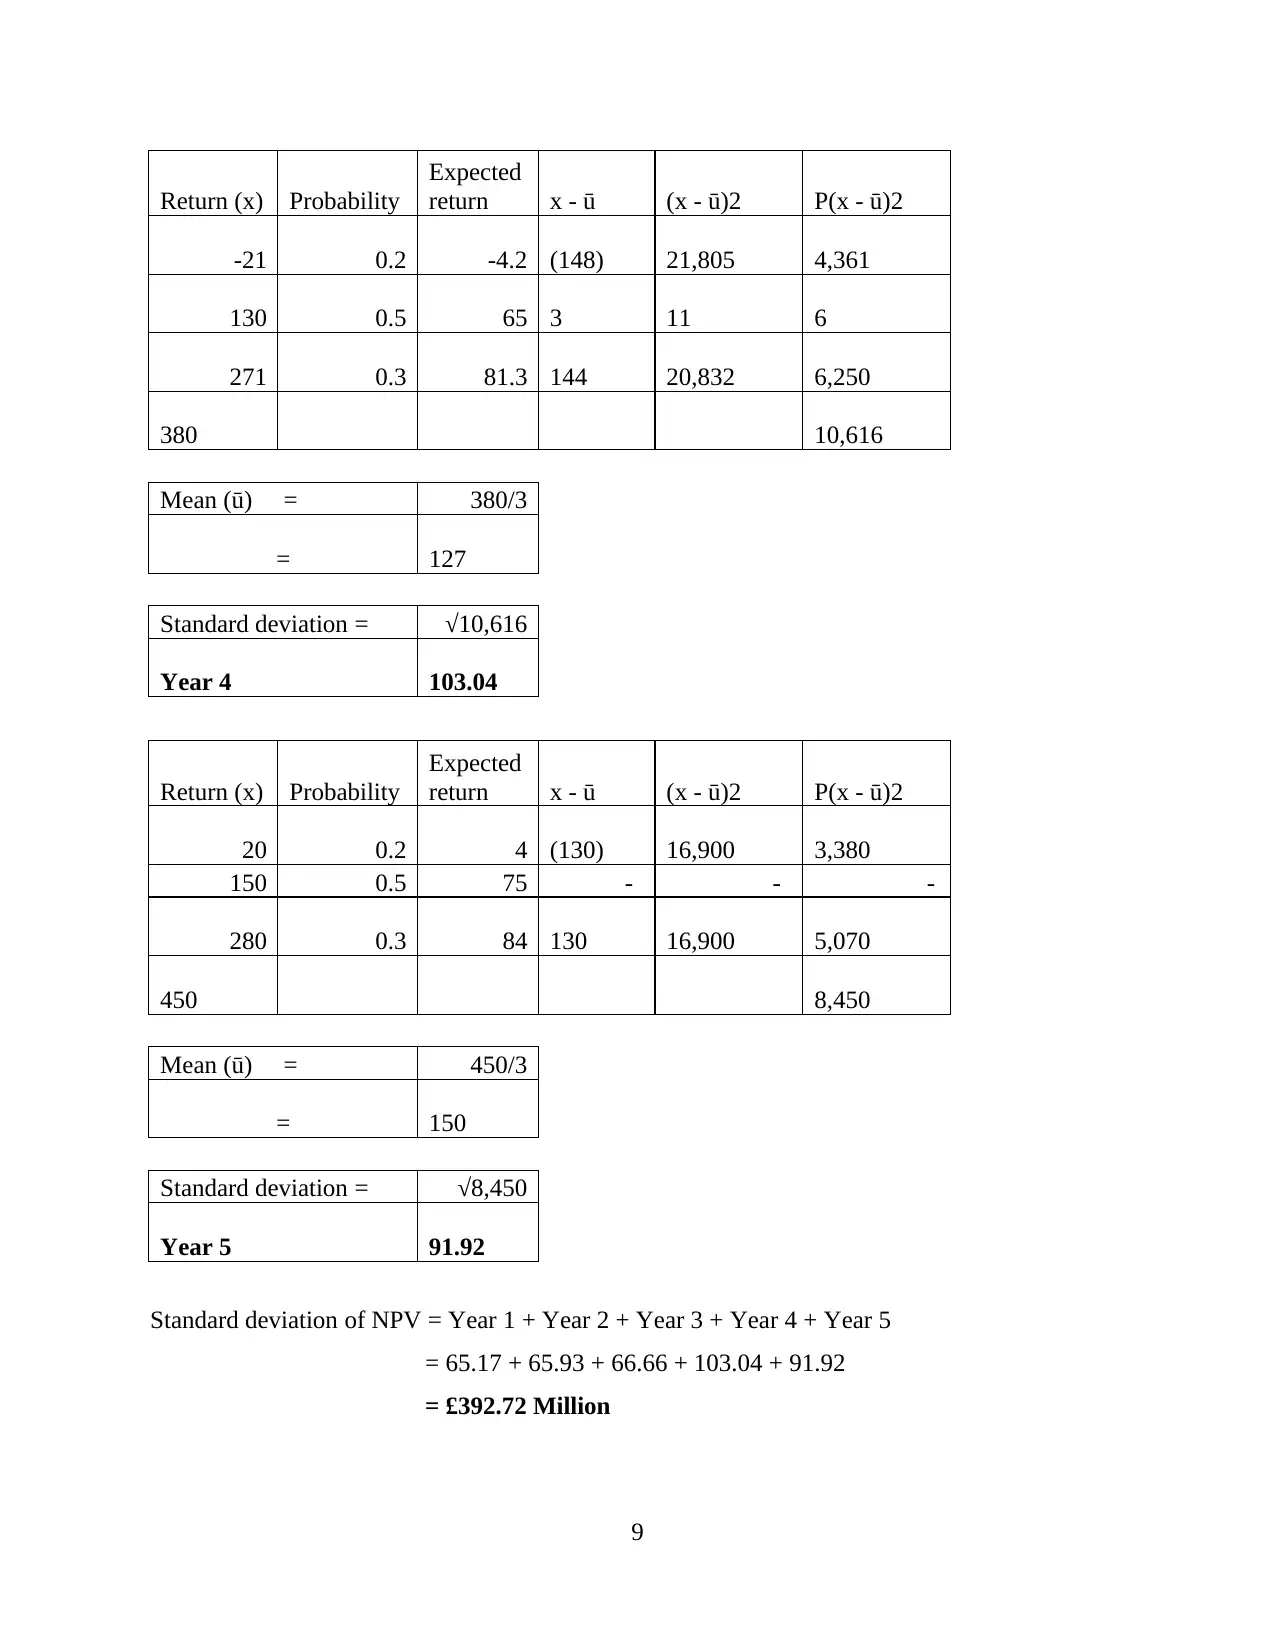
Return (x) Probability
Expected
return x - ū (x - ū)2 P(x - ū)2
-21 0.2 -4.2 (148) 21,805 4,361
130 0.5 65 3 11 6
271 0.3 81.3 144 20,832 6,250
380 10,616
Mean (ū) = 380/3
= 127
Standard deviation = √10,616
Year 4 103.04
Return (x) Probability
Expected
return x - ū (x - ū)2 P(x - ū)2
20 0.2 4 (130) 16,900 3,380
150 0.5 75 - - -
280 0.3 84 130 16,900 5,070
450 8,450
Mean (ū) = 450/3
= 150
Standard deviation = √8,450
Year 5 91.92
Standard deviation of NPV = Year 1 + Year 2 + Year 3 + Year 4 + Year 5
= 65.17 + 65.93 + 66.66 + 103.04 + 91.92
= £392.72 Million
9
Expected
return x - ū (x - ū)2 P(x - ū)2
-21 0.2 -4.2 (148) 21,805 4,361
130 0.5 65 3 11 6
271 0.3 81.3 144 20,832 6,250
380 10,616
Mean (ū) = 380/3
= 127
Standard deviation = √10,616
Year 4 103.04
Return (x) Probability
Expected
return x - ū (x - ū)2 P(x - ū)2
20 0.2 4 (130) 16,900 3,380
150 0.5 75 - - -
280 0.3 84 130 16,900 5,070
450 8,450
Mean (ū) = 450/3
= 150
Standard deviation = √8,450
Year 5 91.92
Standard deviation of NPV = Year 1 + Year 2 + Year 3 + Year 4 + Year 5
= 65.17 + 65.93 + 66.66 + 103.04 + 91.92
= £392.72 Million
9
⊘ This is a preview!⊘
Do you want full access?
Subscribe today to unlock all pages.
Trusted by 1+ million students worldwide
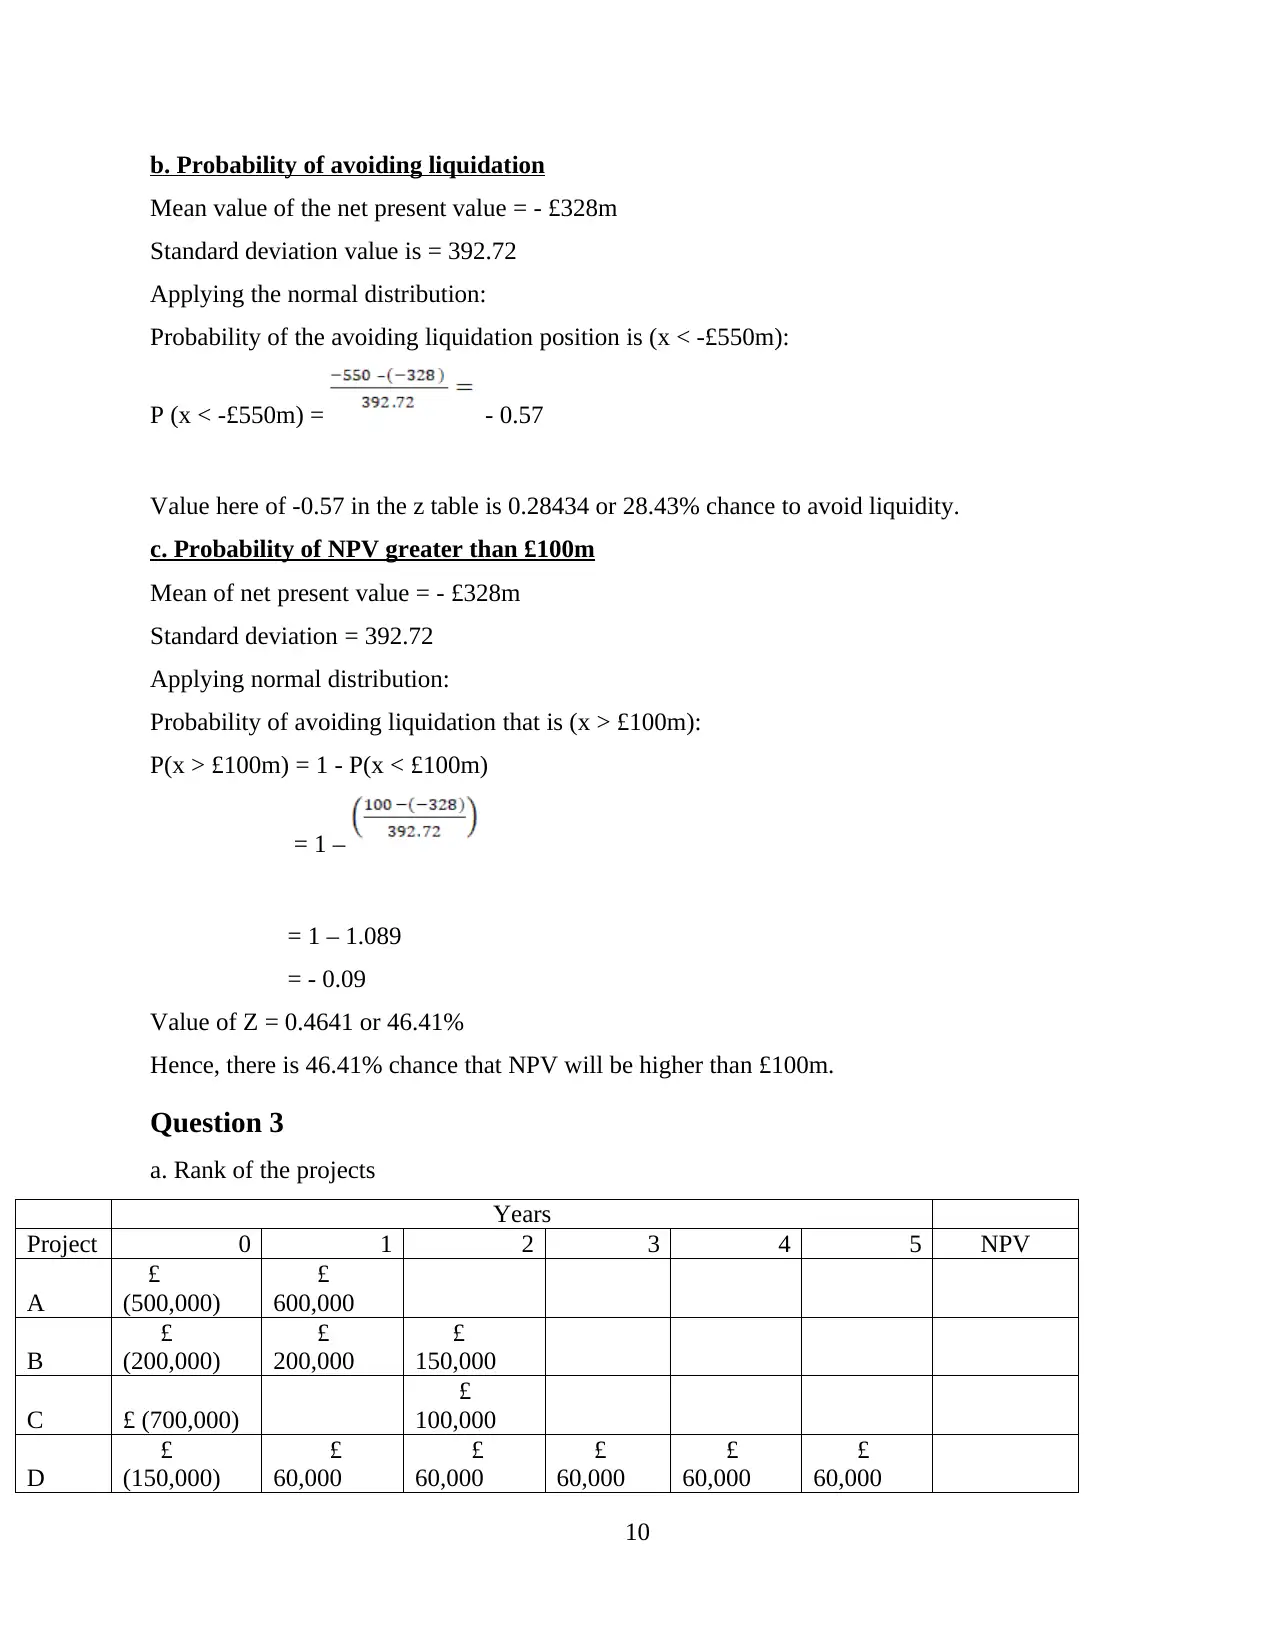
b. Probability of avoiding liquidation
Mean value of the net present value = - £328m
Standard deviation value is = 392.72
Applying the normal distribution:
Probability of the avoiding liquidation position is (x < -£550m):
P (x < -£550m) = - 0.57
Value here of -0.57 in the z table is 0.28434 or 28.43% chance to avoid liquidity.
c. Probability of NPV greater than £100m
Mean of net present value = - £328m
Standard deviation = 392.72
Applying normal distribution:
Probability of avoiding liquidation that is (x > £100m):
P(x > £100m) = 1 - P(x < £100m)
= 1 –
= 1 – 1.089
= - 0.09
Value of Z = 0.4641 or 46.41%
Hence, there is 46.41% chance that NPV will be higher than £100m.
Question 3
a. Rank of the projects
Years
Project 0 1 2 3 4 5 NPV
A
£
(500,000)
£
600,000
B
£
(200,000)
£
200,000
£
150,000
C £ (700,000)
£
100,000
D
£
(150,000)
£
60,000
£
60,000
£
60,000
£
60,000
£
60,000
10
Paraphrase This Document
Need a fresh take? Get an instant paraphrase of this document with our AI Paraphraser
Discou
nt
factor
@10% 0.90909091 0.82644628
0.751314
8 0.6830135 0.6209213
A
£
(500,000)
£
545,454.55
£
45,455
B
£
(200,000)
£
181,818.18
£
123,966.94
£
105,785
C
£
(700,000)
£
82,644.63
£
(617,355)
D
£
(150,000)
£
54,545.45
£
49,586.78
£
45,078.89
£
40,980.81
£
37,255.28
£
77,447
Ranks Project NPV
1 B £ 105,785
2 D £ 77,447
3 A £ 45,455
4 C £ (617,355)
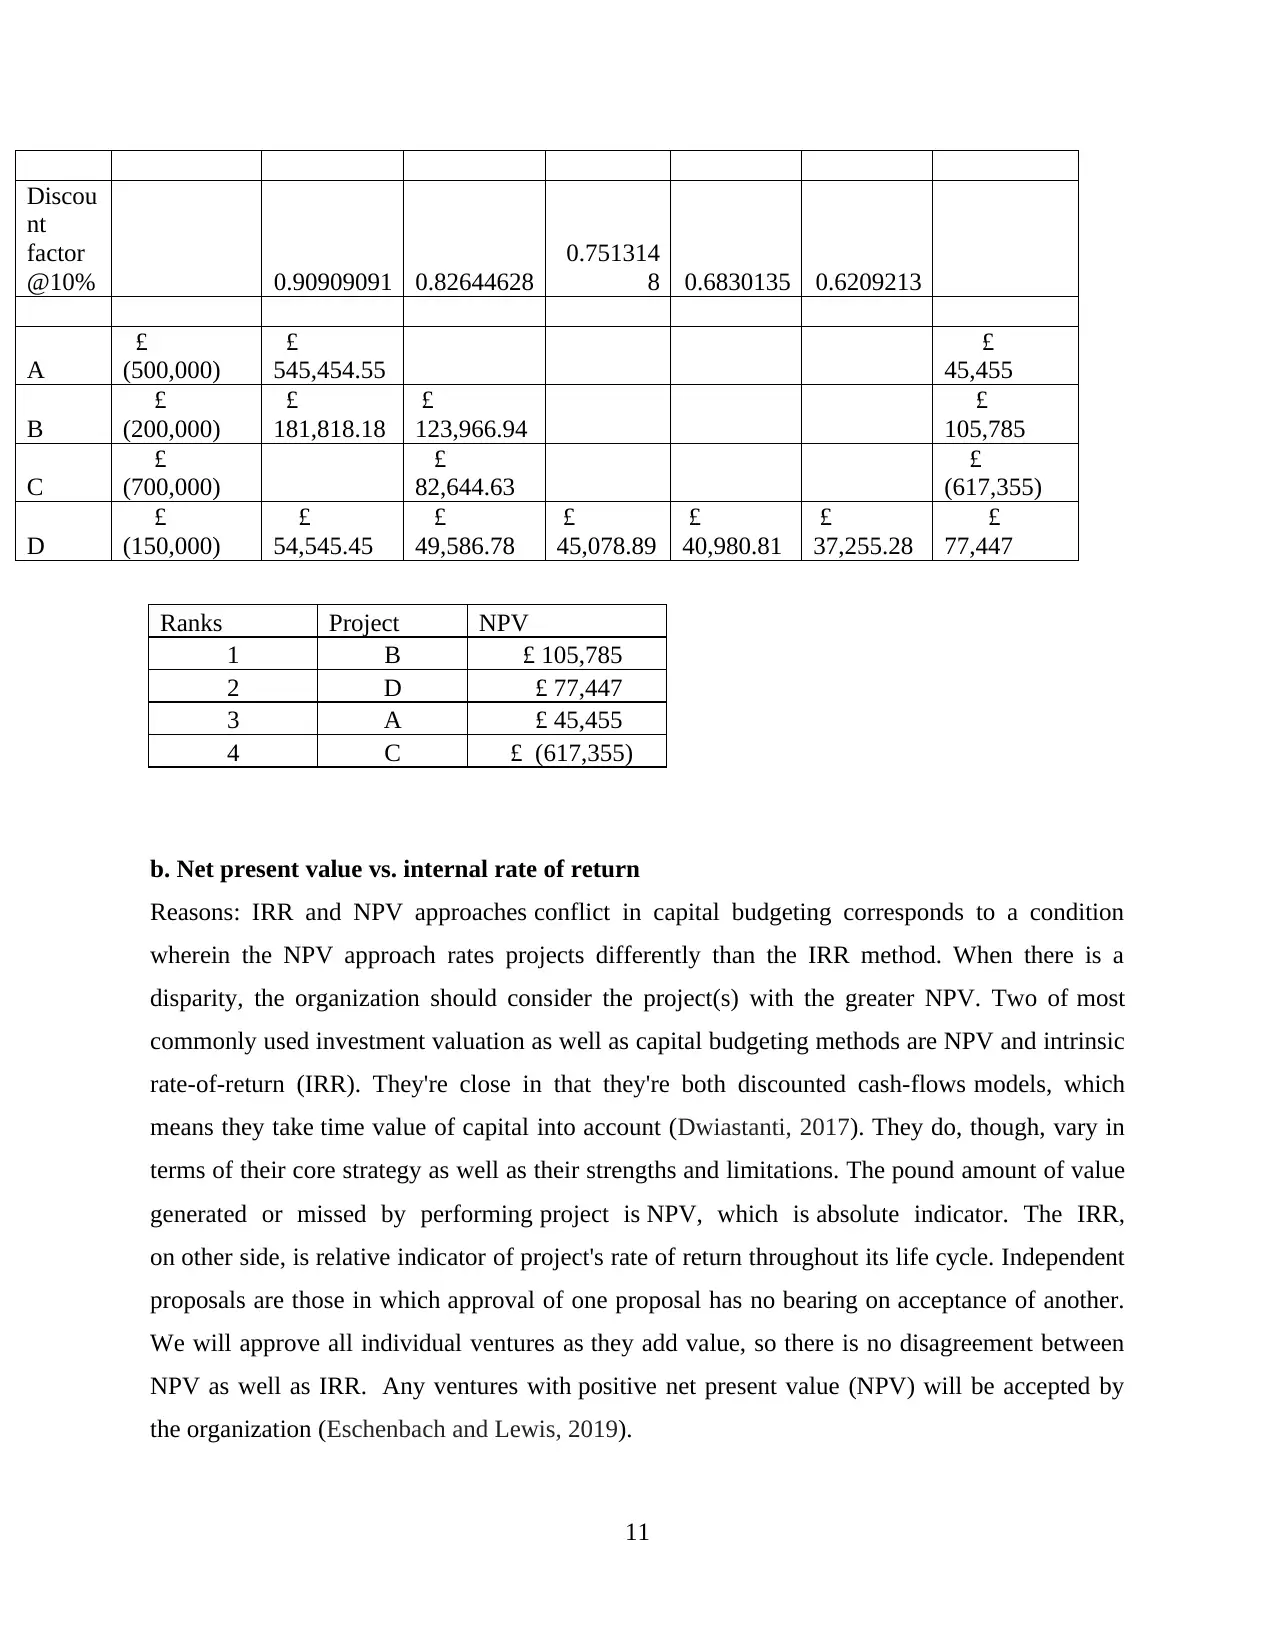
b. Net present value vs. internal rate of return
Reasons: IRR and NPV approaches conflict in capital budgeting corresponds to a condition
wherein the NPV approach rates projects differently than the IRR method. When there is a
disparity, the organization should consider the project(s) with the greater NPV. Two of most
commonly used investment valuation as well as capital budgeting methods are NPV and intrinsic
rate-of-return (IRR). They're close in that they're both discounted cash-flows models, which
means they take time value of capital into account (Dwiastanti, 2017). They do, though, vary in
terms of their core strategy as well as their strengths and limitations. The pound amount of value
generated or missed by performing project is NPV, which is absolute indicator. The IRR,
on other side, is relative indicator of project's rate of return throughout its life cycle. Independent
proposals are those in which approval of one proposal has no bearing on acceptance of another.
We will approve all individual ventures as they add value, so there is no disagreement between
NPV as well as IRR. Any ventures with positive net present value (NPV) will be accepted by
the organization (Eschenbach and Lewis, 2019).
11
nt
factor
@10% 0.90909091 0.82644628
0.751314
8 0.6830135 0.6209213
A
£
(500,000)
£
545,454.55
£
45,455
B
£
(200,000)
£
181,818.18
£
123,966.94
£
105,785
C
£
(700,000)
£
82,644.63
£
(617,355)
D
£
(150,000)
£
54,545.45
£
49,586.78
£
45,078.89
£
40,980.81
£
37,255.28
£
77,447
Ranks Project NPV
1 B £ 105,785
2 D £ 77,447
3 A £ 45,455
4 C £ (617,355)
b. Net present value vs. internal rate of return
Reasons: IRR and NPV approaches conflict in capital budgeting corresponds to a condition
wherein the NPV approach rates projects differently than the IRR method. When there is a
disparity, the organization should consider the project(s) with the greater NPV. Two of most
commonly used investment valuation as well as capital budgeting methods are NPV and intrinsic
rate-of-return (IRR). They're close in that they're both discounted cash-flows models, which
means they take time value of capital into account (Dwiastanti, 2017). They do, though, vary in
terms of their core strategy as well as their strengths and limitations. The pound amount of value
generated or missed by performing project is NPV, which is absolute indicator. The IRR,
on other side, is relative indicator of project's rate of return throughout its life cycle. Independent
proposals are those in which approval of one proposal has no bearing on acceptance of another.
We will approve all individual ventures as they add value, so there is no disagreement between
NPV as well as IRR. Any ventures with positive net present value (NPV) will be accepted by
the organization (Eschenbach and Lewis, 2019).
11
In scenario of mutually exclusive ventures, although, NPV and IRR dispute can occur,
where one proposal has greater NPV but higher IRR. Projects that are mutually exclusive are
those in which approval of one proposal precludes consideration of others. The disagreement
occurs either as result of project's relative scale or as result of projects' varying cash flow
allocation. As NPV is objective metric, a project that adds more pound value would be ranked
higher, irrespective of initial investment involved (Haydarov, 2020). IRR is relative metric, but
programs with the highest investment yield will be ranked better regardless of overall value
added. Accept project with higher NPV if an NPV and IRR dispute occurs. That's
because intrinsic rate of return means that all cash flows should be reinvested at same rate. This
theory is flawed since there's no certainty that similarly lucrative opportunities will become open
as quickly as cash flows become available. Reinvestment threat is risk of acquiring cash flows
but not getting adequate time to reinvest them. NPV, on other side, does not have this issue
because it expects reinvestment at cost of money, that is conservative and rational presumption
(Loke, 2017).
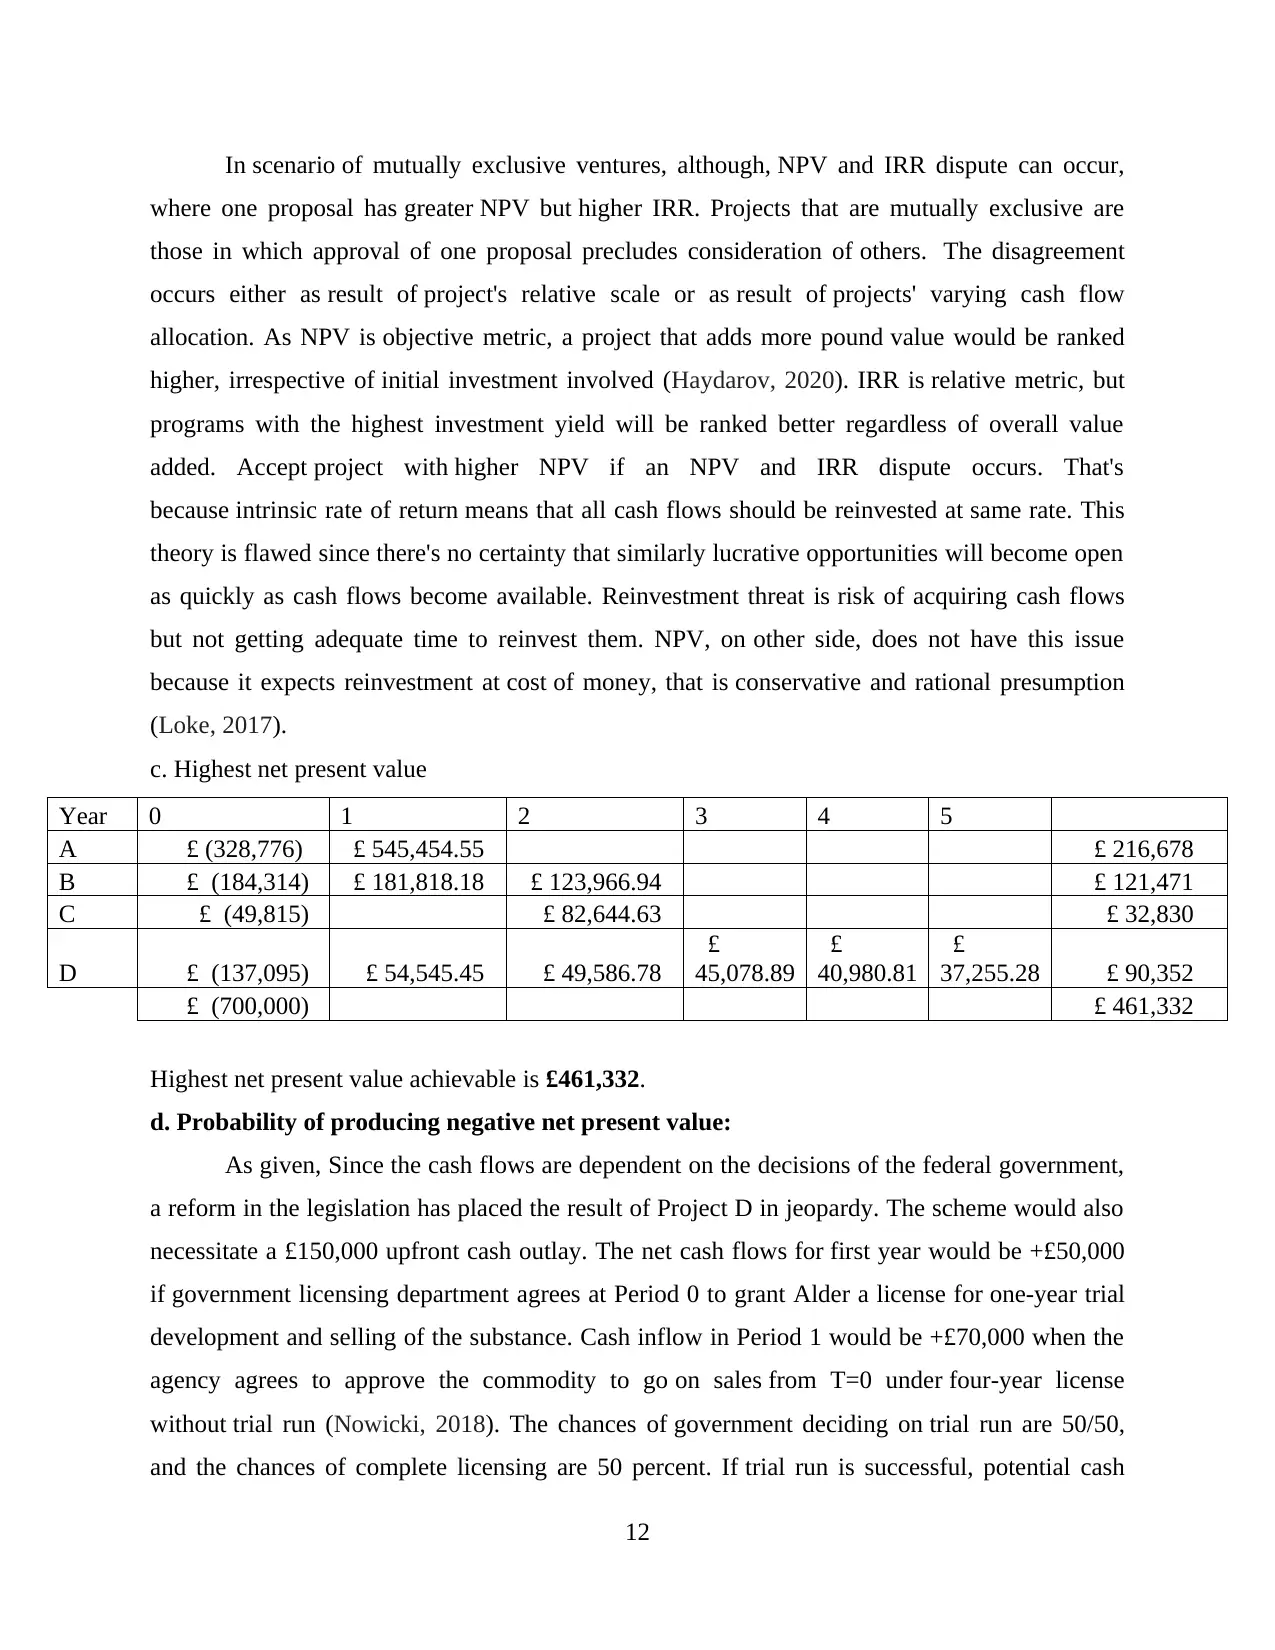
c. Highest net present value
Year 0 1 2 3 4 5
A £ (328,776) £ 545,454.55 £ 216,678
B £ (184,314) £ 181,818.18 £ 123,966.94 £ 121,471
C £ (49,815) £ 82,644.63 £ 32,830
D £ (137,095) £ 54,545.45 £ 49,586.78
£
45,078.89
£
40,980.81
£
37,255.28 £ 90,352
£ (700,000) £ 461,332
Highest net present value achievable is £461,332.
d. Probability of producing negative net present value:
As given, Since the cash flows are dependent on the decisions of the federal government,
a reform in the legislation has placed the result of Project D in jeopardy. The scheme would also
necessitate a £150,000 upfront cash outlay. The net cash flows for first year would be +£50,000
if government licensing department agrees at Period 0 to grant Alder a license for one-year trial
development and selling of the substance. Cash inflow in Period 1 would be +£70,000 when the
agency agrees to approve the commodity to go on sales from T=0 under four-year license
without trial run (Nowicki, 2018). The chances of government deciding on trial run are 50/50,
and the chances of complete licensing are 50 percent. If trial run is successful, potential cash
12
where one proposal has greater NPV but higher IRR. Projects that are mutually exclusive are
those in which approval of one proposal precludes consideration of others. The disagreement
occurs either as result of project's relative scale or as result of projects' varying cash flow
allocation. As NPV is objective metric, a project that adds more pound value would be ranked
higher, irrespective of initial investment involved (Haydarov, 2020). IRR is relative metric, but
programs with the highest investment yield will be ranked better regardless of overall value
added. Accept project with higher NPV if an NPV and IRR dispute occurs. That's
because intrinsic rate of return means that all cash flows should be reinvested at same rate. This
theory is flawed since there's no certainty that similarly lucrative opportunities will become open
as quickly as cash flows become available. Reinvestment threat is risk of acquiring cash flows
but not getting adequate time to reinvest them. NPV, on other side, does not have this issue
because it expects reinvestment at cost of money, that is conservative and rational presumption
(Loke, 2017).
c. Highest net present value
Year 0 1 2 3 4 5
A £ (328,776) £ 545,454.55 £ 216,678
B £ (184,314) £ 181,818.18 £ 123,966.94 £ 121,471
C £ (49,815) £ 82,644.63 £ 32,830
D £ (137,095) £ 54,545.45 £ 49,586.78
£
45,078.89
£
40,980.81
£
37,255.28 £ 90,352
£ (700,000) £ 461,332
Highest net present value achievable is £461,332.
d. Probability of producing negative net present value:
As given, Since the cash flows are dependent on the decisions of the federal government,
a reform in the legislation has placed the result of Project D in jeopardy. The scheme would also
necessitate a £150,000 upfront cash outlay. The net cash flows for first year would be +£50,000
if government licensing department agrees at Period 0 to grant Alder a license for one-year trial
development and selling of the substance. Cash inflow in Period 1 would be +£70,000 when the
agency agrees to approve the commodity to go on sales from T=0 under four-year license
without trial run (Nowicki, 2018). The chances of government deciding on trial run are 50/50,
and the chances of complete licensing are 50 percent. If trial run is successful, potential cash
12
⊘ This is a preview!⊘
Do you want full access?
Subscribe today to unlock all pages.
Trusted by 1+ million students worldwide
1 out of 16