Implementation of Lean Manufacturing in Malaysian Automotive Industry
VerifiedAdded on 2021/09/18
|7
|6412
|47
Report
AI Summary
This report presents an exploratory study on the implementation of lean manufacturing in the Malaysian automotive industry. The research, based on a questionnaire survey of sixty automotive component manufacturing firms, investigates the extent of lean practice adoption, the driving forces behind implementation, and the significant barriers encountered. Findings indicate that most respondent firms are in transition towards lean manufacturing, focusing more on internal operations than external relationships with suppliers and customers. Key drivers include a customer-centric approach and a commitment to continuous improvement. The study also highlights the lack of understanding of lean concepts and shop floor employee attitudes as major obstacles to successful implementation. The research contributes valuable insights for firms aiming to implement effective lean manufacturing systems by identifying critical issues and challenges specific to the Malaysian automotive sector. The study also references the Toyota Production System (TPS) and its impact on the evolution of lean manufacturing.
International Journal of Innovation, Management and Technology, Vol. 1, No. 4, October 2010
ISSN: 2010-0248
374
Abstract—This paper presents an exploratory study of lean
manufacturing implementation in Malaysian automotive
industries. A questionnaire survey is used to explore the extent
of lean manufacturing implementation. This paper also
examines the drivers and barriers that influence the
implementation of lean ma nufacturing. The survey was
performed on sixty Malaysian automotive components
manufacturing firms. The respondents were chosen from those
who are directly involved with lean manufacturing practices
such as production and quality personnel. The findings show
that most of the respondent firms are classified as in-transition
towards lean manufacturing practice. These in-transition firms
have moderate mean values for each of the five lean
manufacturing practice categories. It is also found that these
firms spend more attentions and resources in internal areas
such as firms’ operation and management, compared to
external relationships with suppliers and customers. These
firms believe that the factors that drive the implementation of
lean manufacturing are the desire to focus on customers and to
achieve the organisation’s continuous improvement. The results
from this survey also revealed the main barriers that prevent or
delay the lean implementation. The main barriers to implement
lean manufacturing system are the lack of understanding lean
concepts and shop floor employees’ attitude.
Index Terms—Lean manufacturing, automotive industry,
Malaysia
I. INTRODUCTION
Heightening challenges in today’s global competition have
prompted many manufacturing firms to adopt new
manufacturing management strategies in order to enhance the
firms’ efficiency and competitiveness. Manufacturing firms
has taken lean manufacturing (LM) system as a great
management tool and many of them have adopted lean
techniques in many different forms and names.
Now, LM has become a widely acceptable and adoptable
best manufacturing practice across countries and industries
[1]. The ultimate goal of a lean organisation is to create a
smooth and high quality organisation that is able to produce
finished products concerning the customers demand in the
quality looked-for with no waste. However, in reality, many
companies are not able to transform themselves to a lean
manufacturing organisation towards creating the world-class
companies. Actually the transformation towards LM is filled
with formidable challenges, most particularly to understand
the real essence of LM concept and philosophy [2], and also
to deal with the cultural differences issues either national or
organisational [3-6].
There are a few studies that have been done in Malaysia
based on lean manufacturing implementation. Study done by
Wong et al. [7] focussed to examine the adoption of lean
manufacturing in the Malaysian electrical and electronics
industries. From his study it is found that most of the
Malaysian manufacturing industries have been implemented
lean manufacturing system to some extent. However,
findings based on Malaysian manufacturing industries do not
indicate the holistic perspective of lean manufacturing
implementation. It is also found that the degree of lean
implementation in those industries was based on the average
mean score of individual keys of lean practices areas, not the
total average mean score.
Therefore, the purpose of this study is to further discuss
the LM implementation in Malaysian manufacturing
industries. The investigation focuses on the degree of LM
implementation in Malaysian automotive industries. In
addition, the factors that are capable to hinder or delay the
lean implementation process are also investigated. Hopefully
this study will help the firm’s management to identify the
problems to implement an effective LM system.
II. LITERATURE REVIEW
The concept of LM was pioneered by a Japanese
automotive company, Toyota, during 1950’s which was
famously known as Toyota Production System (TPS). The
primary goal of TPS were to reduce the cost and to improve
productivity by eliminating wastes or non-value added
activities [8]. During 1980’s there was an intense interest on
LM implementation among the western manufacturers
because of growing Japanese imports. It became a serious
concern to the western producers [1]. After the oil crises in
the early of 1990’s, in a published book named The Machine
that Changed the World [8] by International Motor Vehicle
Programme (IMVP), such intense interest of LM concept was
again aroused. Then, the concept of LM was transferred
across the countries and industries due to its global
superiority in cost, quality, flexibility and quick respond [9].
LM is a manufacturing strategy that aimed to achieve
smooth production flow by eliminating waste and by
increasing the activities value. Some analysts even pointed
out that if an organisation ignores the LM strategy, the
company would not be able to stand a chance against the
current global competition for higher quality, faster delivery
A Survey on Lean Manufacturing
Implementation in Malaysian Automotive
Industry
Norani Nordin, Baba Md Deros and Dzuraidah Abd Wahab
Paraphrase This Document
Need a fresh take? Get an instant paraphrase of this document with our AI Paraphraser
International Journal of Innovation, Management and Technology, Vol. 1, No. 4, October 2010
ISSN: 2010-0248
375
and lower costs [10, 11]. In a large cross-country analysis
done by Oliver et al. [12] proves that LM principles could
produce high performance firms.
LM consists of a large number of tools and techniques.
Shah and Ward [13] identified twenty two LM practices that
are frequently mentioned in literatures and categorised them
into four bundles associated with Just-in-Time, Total Quality
Management, Total Preventive Management and Human
Resource. Some other researchers also categorised the lean
tools and techniques according to the area of implementation
such as internally and externally oriented lean practices
[13-15]. For example Panizzolo [15] divided the lean
practices into six areas which are process and equipment;
manufacturing, planning and control; human resources;
product design; supplier relationships; and customer
relationships. The first four areas are grouped as internal
oriented lean practices, whereas supplier relationships and
customer relationships are under external oriented lean
practices. This study also confirms that, many firms seem to
have difficulty in adopting lean tools that concern with
external relationships with suppliers and customers even for
high performance firms. Empirical results from this study
also prove that lean tools in internal areas are adopted most
widely in the firms, where the operation and management
methods are more direct.
The change from traditional manufacturing system to lean
manufacturing is not an easy task. Achanga et al. [16]
suggested that the success of LM implementation depends on
four critical factors: leadership and management; finance;
skills and expertise; and supportive organisational culture of
the organisation. Some researchers also suggested that
applying the full set of lean principles and tools also
contribute to the successful LM transformation [4, 17].
Despite the huge benefits gained from LM implementation
is highlighted, in reality not many companies are successful
to implement this system [2, 18]. There are numerous
reported problems and issues regarding the failure of LM
implementation. Many researchers believed that the main
problem lies on the misunderstanding of the real concept and
purpose of LM [2, 9]. Some researcher identified the reason
of this misunderstanding is due to cultural differences that
occurs during transition or translation of LM [4, 17]. This
type of misunderstanding could lead to more major issues
such as piecemeal adoption of lean tools and techniques [17],
misapplication of lean tools [4, 19], and lack of development
of lean culture that support the lean development [5, 20].
Study done by Puvanasvaran et al. [21] showed that the
company which is in the early stage to become lean, must
keep its efforts for an effective communication process at all
levels in order to be successful in LM implementation. Good
communication process supports the lean practices in
manufacturing.
III. RESEARCH METHODOLOGY
A questionnaire was developed to collect data for this
study. In order to achieve the objectives of the study, the
Malaysian automotive manufacturing firms were selected as
the population. The database was obtained from the 2008
Federation of Malaysian Manufacturers (FMM) and SME
Corp Malaysia directories. This list of the manufacturing
firms consists of electrical, electronic, metal, plastic, rubber
and other automotive components. The manufacturing firms
involved in this study were ranged from medium to large
companies, with more than 50 employees. According to SME
Corp Malaysia [22], medium companies are those with full
time employees between 51-150, whereas large companies
are companies that have full time employees more than 151.
The decision made in this study is based on the studies done
by Shah and Ward [13, 23], Bonavia and Marin [24], and
Perez and Sanchez [25]. From their studies it is shown that
small manufacturing firms are less likely to implement LM
concepts due to certain limitations and barriers. The
personnel involved in the survey were those from managing
directors, manufacturing and/or production managers and
executives, and also quality managers and executives.
The questionnaire consisted of three parts; (a) the
background information of the organisation (year of
establishment, ownership, number of employees, and quality
system certification), (b) the lean manufacturing
implementation (lean practices implementation, lean drivers,
benefits and barriers), and (c) the respondent information
(job title, department and years of employment).
The items of lean manufacturing implementation section
were adapted from Shah and Ward [13] and Panizzolo [15].
The questions were set up on a five-point Likert scale to
measure the extent of implementation described by each of
the items. The scale was ranged from 1 to 5 where 1 = no
implementation, 2 = little implementation, 3 = some
implementation, 4 = extensive implementation, and 5 =
complete implementation. The prime consideration of the
design in this survey instrument was to keep it short and
focused in order to obtain an adequate response rate.
The process of developing the questionnaire also included
a pilot survey. This pilot survey was used to modify and
eliminate the number of variables. Experts from industries
and academics were also consulted. The comments and
feedback were analysed and a few minor modification were
made especially in questionnaire format. Majority of the
feedback from the experts gave positive remarks and certify
that the questionnaire was acceptable for data collection.
Although no new items were added for the data collection
phase, but many items were reworded or modified. The
questionnaire was then ready for data collection.
In the case of reliability test, Cronbach’s alpha was
employed to measure the internal consistency of the research
instrument. According to Sekaran [26], reliability
measurement is an indication of the stability and consistency
of the instrument. The generally agreed value of the lower
limit for Cronbach’s alpha is 0.70, although it may be as low
as 0.60 in exploratory research [27].
The internal consistency of the elements of lean practices
and lean barriers were tested by using SPSS reliability
analysis procedure. The analysis was performed separately
for the items of each factor. The summaries of the reliability
analysis are given in Table 1. All the results proved the
survey instrument ha high internal consistency with
International Journal of Innovation, Management and Technology, Vol. 1, No. 4, October 2010
ISSN: 2010-0248
376
Cronbach’s alpha values ≥0.70 and therefore it is reliable.
TABLE 1: RELIABILITY TEST RESULTS - LEAN PRACTICES AND LEAN BARRIERS
Description No. of items Alpha value Items for deletion Alpha if item deleted
Lean practices
1. Process and equipment 9 0.871 - 0.890
2. Manufacturing planning and control 5 0.865 - 0.865
3. Human resources 5 0.878 - 0.878
4. Supplier relationship 5 0.791 - 0.791
5. Customer relationship 3 0.809 - 0.809
Lean barriers 10 0.900 - 0.900
IV. RESULTS AND DISCUSSIONS
The initial email was sent to 250 target respondents. The
email addresses were obtained from the phone calls made to
each of the companies listed in the database. From the emails,
17 emails were failed to deliver. This may be due to the
reason that either the email addresses were wrong or the
person had been left that company. Another follow-up email
was sent after one week later to remind the respondents who
had not responded yet and thanks were given to those who
had already returned their questionnaire. A total of 19
responses were returned, 11 of them were online survey and
the remaining 7 were sent through email. This actually gave
quite a low response rate of 7.6%. However, since the initial
response rate was not satisfactory and for this reason another
method was seek. To increase the response rate the
questionnaire was send to the respondents through postage
mail. As a result of this, the number of responses was rose to
61 and consequently the response rate was reached to 24.4%.
A. Respondent profile
The first aspects to be investigated were the general
background of the respondents and the companies involved.
Table 2 shows the general background of the respondents
such as the job position and years of employment in the
company. It was found that the respondents were mainly
Production and QC/QA personnel. Most of them (36.1%)
have been working more than 10 years in that particular
company. They were selected because they have first hand
knowledge and experience and they were directly involved to
the implementation of lean manufacturing program in their
companies.
TABLE 2: GENERAL BACKGROUND OF THE RESPONDENTS IN THEIR
COMPANY (N = 61)
n %
Position in the company
Production Manager &
Executives
2
6
42.
6
QC/QA Manager & Executives 2
6
42.
6
Others 9 14.
8
Years of employment
<5 years 2
0
32.
8
5-9 years 1
8
29.
5
>10 years 2
2
36.
1
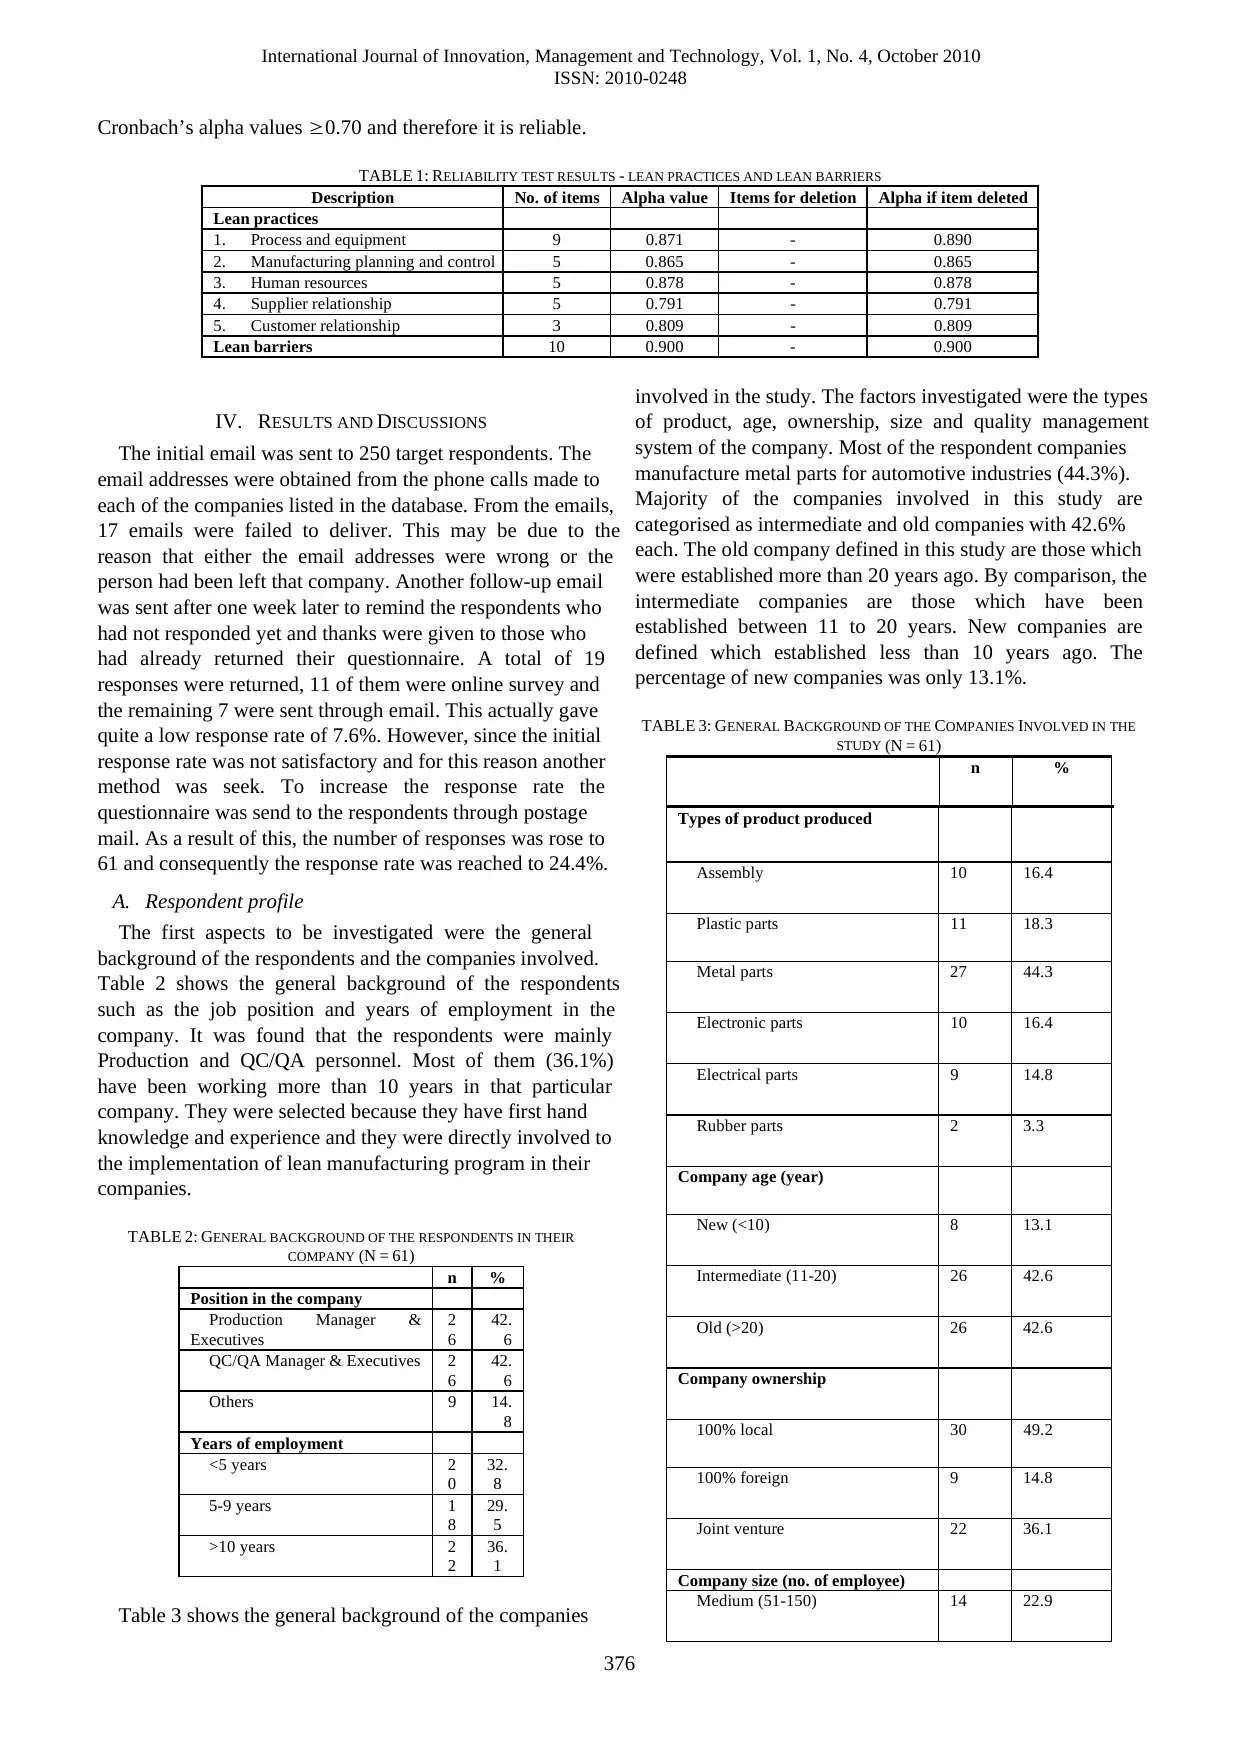
Table 3 shows the general background of the companies
involved in the study. The factors investigated were the types
of product, age, ownership, size and quality management
system of the company. Most of the respondent companies
manufacture metal parts for automotive industries (44.3%).
Majority of the companies involved in this study are
categorised as intermediate and old companies with 42.6%
each. The old company defined in this study are those which
were established more than 20 years ago. By comparison, the
intermediate companies are those which have been
established between 11 to 20 years. New companies are
defined which established less than 10 years ago. The
percentage of new companies was only 13.1%.
TABLE 3: GENERAL BACKGROUND OF THE COMPANIES INVOLVED IN THE
STUDY (N = 61)
n %
Types of product produced
Assembly 10 16.4
Plastic parts 11 18.3
Metal parts 27 44.3
Electronic parts 10 16.4
Electrical parts 9 14.8
Rubber parts 2 3.3
Company age (year)
New (<10) 8 13.1
Intermediate (11-20) 26 42.6
Old (>20) 26 42.6
Company ownership
100% local 30 49.2
100% foreign 9 14.8
Joint venture 22 36.1
Company size (no. of employee)
Medium (51-150) 14 22.9
ISSN: 2010-0248
376
Cronbach’s alpha values ≥0.70 and therefore it is reliable.
TABLE 1: RELIABILITY TEST RESULTS - LEAN PRACTICES AND LEAN BARRIERS
Description No. of items Alpha value Items for deletion Alpha if item deleted
Lean practices
1. Process and equipment 9 0.871 - 0.890
2. Manufacturing planning and control 5 0.865 - 0.865
3. Human resources 5 0.878 - 0.878
4. Supplier relationship 5 0.791 - 0.791
5. Customer relationship 3 0.809 - 0.809
Lean barriers 10 0.900 - 0.900
IV. RESULTS AND DISCUSSIONS
The initial email was sent to 250 target respondents. The
email addresses were obtained from the phone calls made to
each of the companies listed in the database. From the emails,
17 emails were failed to deliver. This may be due to the
reason that either the email addresses were wrong or the
person had been left that company. Another follow-up email
was sent after one week later to remind the respondents who
had not responded yet and thanks were given to those who
had already returned their questionnaire. A total of 19
responses were returned, 11 of them were online survey and
the remaining 7 were sent through email. This actually gave
quite a low response rate of 7.6%. However, since the initial
response rate was not satisfactory and for this reason another
method was seek. To increase the response rate the
questionnaire was send to the respondents through postage
mail. As a result of this, the number of responses was rose to
61 and consequently the response rate was reached to 24.4%.
A. Respondent profile
The first aspects to be investigated were the general
background of the respondents and the companies involved.
Table 2 shows the general background of the respondents
such as the job position and years of employment in the
company. It was found that the respondents were mainly
Production and QC/QA personnel. Most of them (36.1%)
have been working more than 10 years in that particular
company. They were selected because they have first hand
knowledge and experience and they were directly involved to
the implementation of lean manufacturing program in their
companies.
TABLE 2: GENERAL BACKGROUND OF THE RESPONDENTS IN THEIR
COMPANY (N = 61)
n %
Position in the company
Production Manager &
Executives
2
6
42.
6
QC/QA Manager & Executives 2
6
42.
6
Others 9 14.
8
Years of employment
<5 years 2
0
32.
8
5-9 years 1
8
29.
5
>10 years 2
2
36.
1
Table 3 shows the general background of the companies
involved in the study. The factors investigated were the types
of product, age, ownership, size and quality management
system of the company. Most of the respondent companies
manufacture metal parts for automotive industries (44.3%).
Majority of the companies involved in this study are
categorised as intermediate and old companies with 42.6%
each. The old company defined in this study are those which
were established more than 20 years ago. By comparison, the
intermediate companies are those which have been
established between 11 to 20 years. New companies are
defined which established less than 10 years ago. The
percentage of new companies was only 13.1%.
TABLE 3: GENERAL BACKGROUND OF THE COMPANIES INVOLVED IN THE
STUDY (N = 61)
n %
Types of product produced
Assembly 10 16.4
Plastic parts 11 18.3
Metal parts 27 44.3
Electronic parts 10 16.4
Electrical parts 9 14.8
Rubber parts 2 3.3
Company age (year)
New (<10) 8 13.1
Intermediate (11-20) 26 42.6
Old (>20) 26 42.6
Company ownership
100% local 30 49.2
100% foreign 9 14.8
Joint venture 22 36.1
Company size (no. of employee)
Medium (51-150) 14 22.9
⊘ This is a preview!⊘
Do you want full access?
Subscribe today to unlock all pages.
Trusted by 1+ million students worldwide
International Journal of Innovation, Management and Technology, Vol. 1, No. 4, October 2010
ISSN: 2010-0248
377
Large (> 151) 47 77.1
Quality management system
employed
ISO9001 35 57.4
QS9000 6 10.0
ISO/TS16949 43 70.5
ISO14000 38 62.3
OHSAS18001 12 19.7
Other than the company age, respondents were also asked
about the size and ownership of the companies. In Table 3, it
is shown that respondents were mostly from large companies
with more than 150 full-time employees, which exhibits
77.1%. In addition, half of the respondent companies have
local ownership (49.2%), whereas 36.1% of the total
respondent company have joint venture and the remaining
14.9% have fully foreign ownership. Regarding the quality
system certification, all respondent companies have at least
one certification in the relevant field. Examining the results
in more detail, it was found out that 70.5% of total respondent
companies are certified by ISO/TS16949. About 62.3% were
certified by ISO14000 and 57.4% certified by ISO9001.
Other types of quality certification such as OHSAS18001
and QS9000 were owned by 19.7% and 10% of respondent
companies respectively.
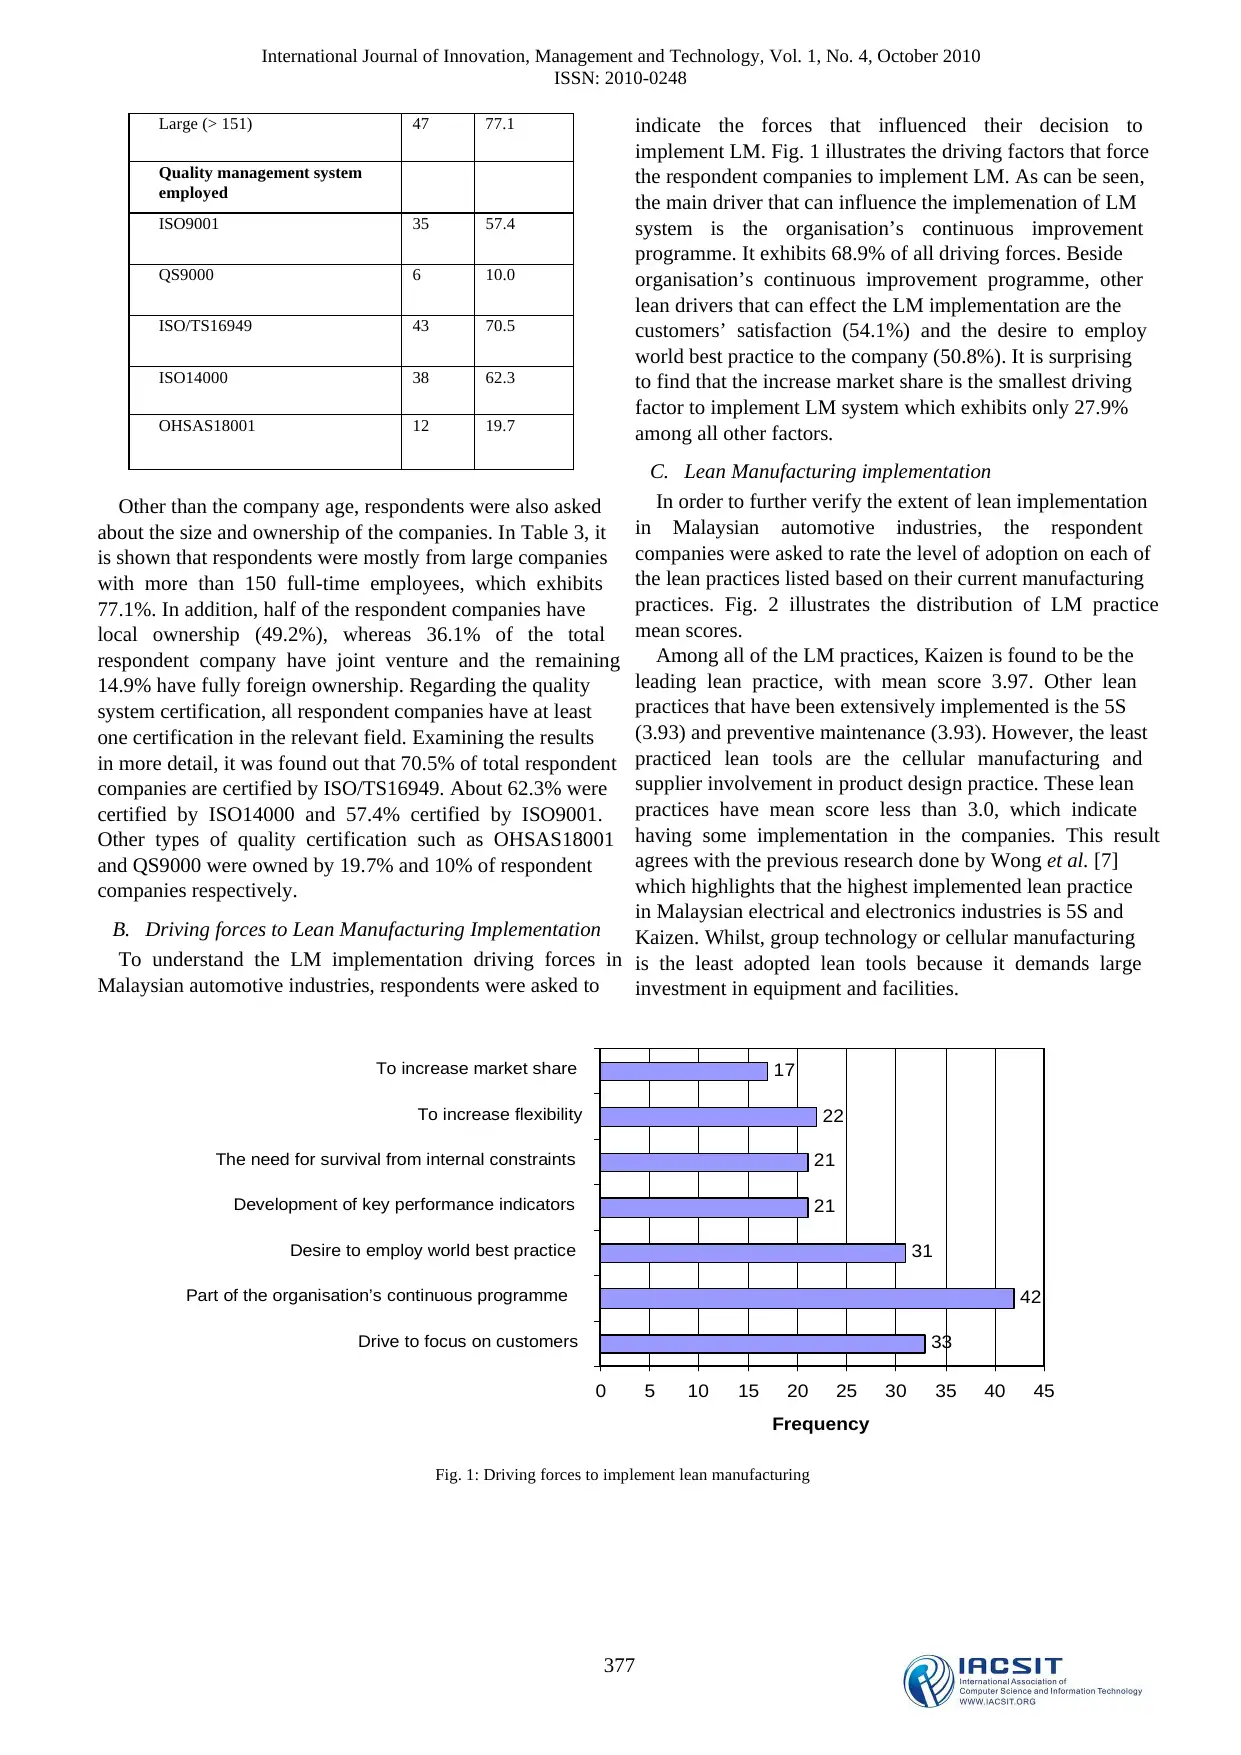
B. Driving forces to Lean Manufacturing Implementation
To understand the LM implementation driving forces in
Malaysian automotive industries, respondents were asked to
indicate the forces that influenced their decision to
implement LM. Fig. 1 illustrates the driving factors that force
the respondent companies to implement LM. As can be seen,
the main driver that can influence the implemenation of LM
system is the organisation’s continuous improvement
programme. It exhibits 68.9% of all driving forces. Beside
organisation’s continuous improvement programme, other
lean drivers that can effect the LM implementation are the
customers’ satisfaction (54.1%) and the desire to employ
world best practice to the company (50.8%). It is surprising
to find that the increase market share is the smallest driving
factor to implement LM system which exhibits only 27.9%
among all other factors.
C. Lean Manufacturing implementation
In order to further verify the extent of lean implementation
in Malaysian automotive industries, the respondent
companies were asked to rate the level of adoption on each of
the lean practices listed based on their current manufacturing
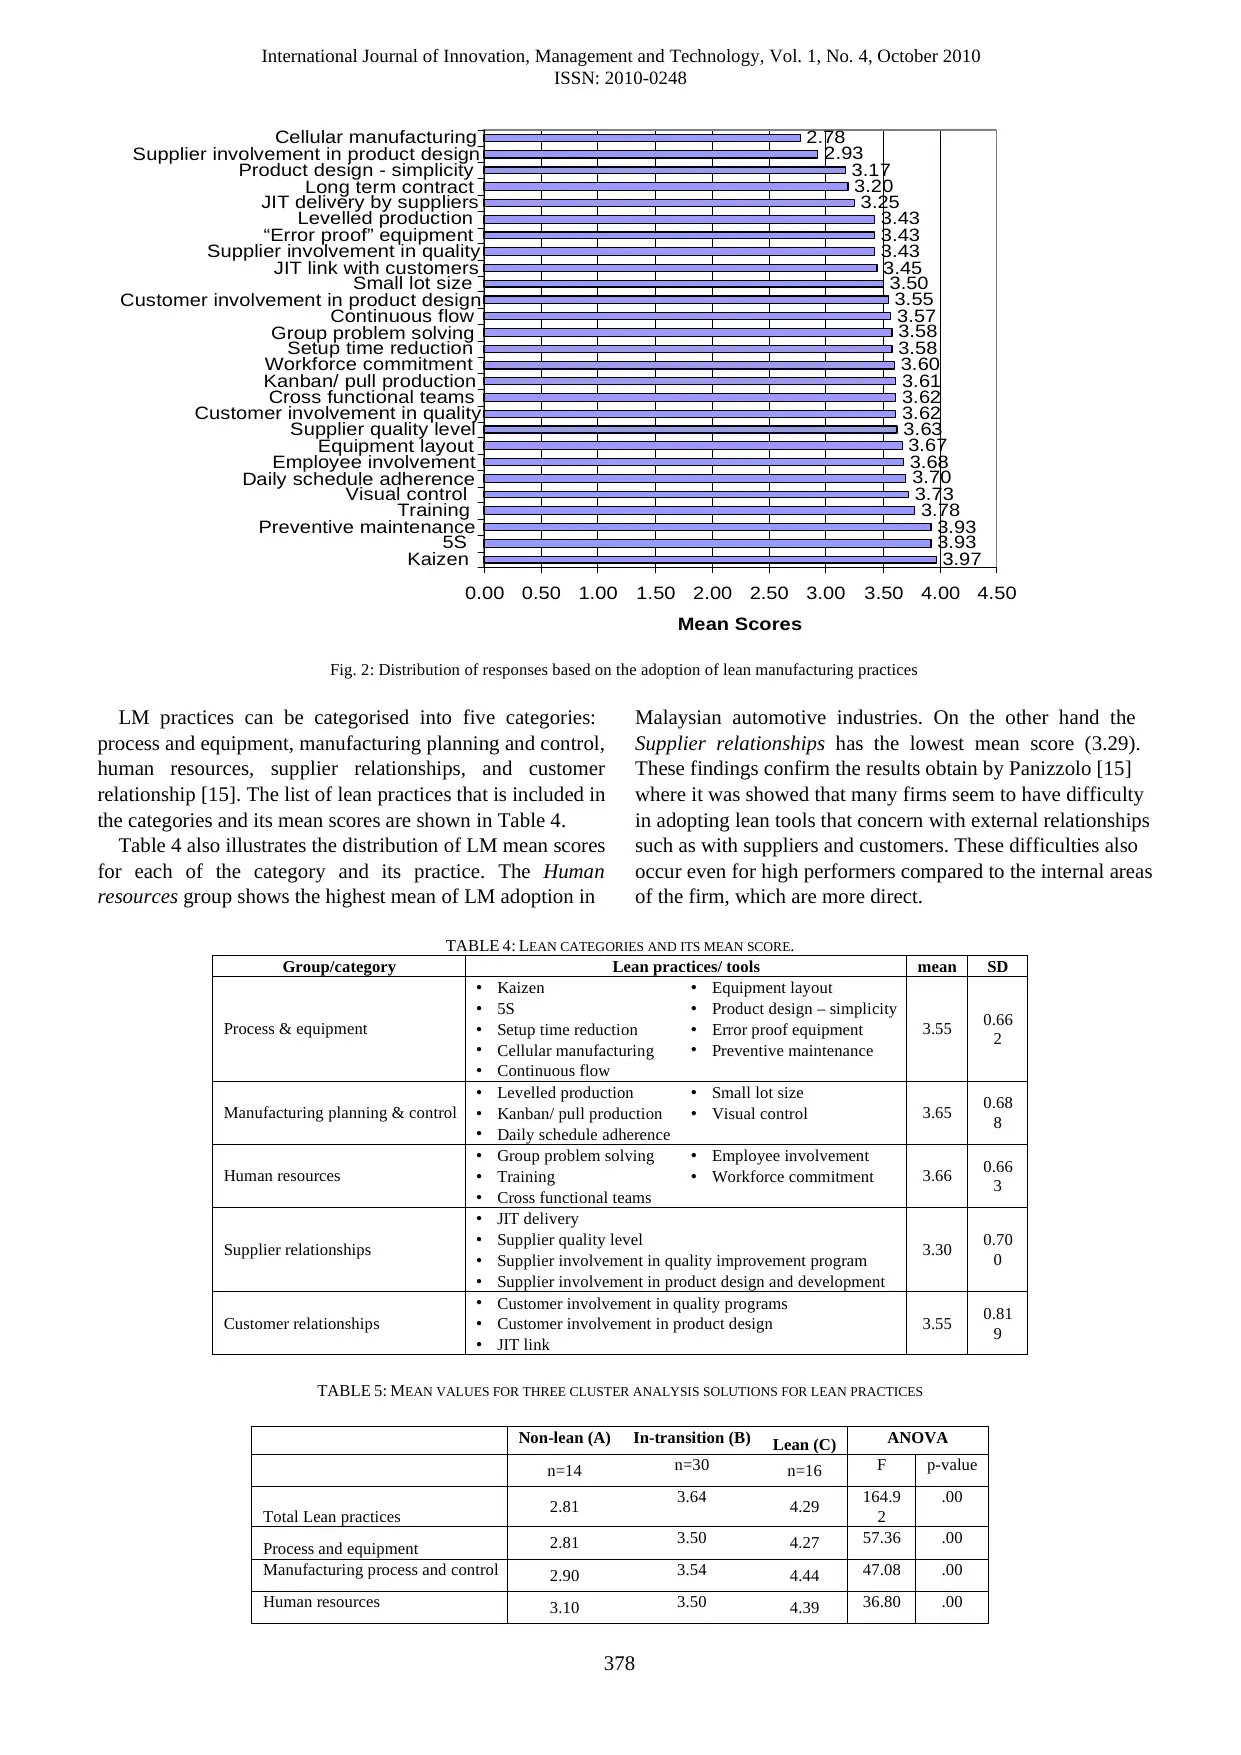
practices. Fig. 2 illustrates the distribution of LM practice
mean scores.
Among all of the LM practices, Kaizen is found to be the
leading lean practice, with mean score 3.97. Other lean
practices that have been extensively implemented is the 5S
(3.93) and preventive maintenance (3.93). However, the least
practiced lean tools are the cellular manufacturing and
supplier involvement in product design practice. These lean
practices have mean score less than 3.0, which indicate
having some implementation in the companies. This result
agrees with the previous research done by Wong et al. [7]
which highlights that the highest implemented lean practice
in Malaysian electrical and electronics industries is 5S and
Kaizen. Whilst, group technology or cellular manufacturing
is the least adopted lean tools because it demands large
investment in equipment and facilities.
33
42
31
21
21
22
17
0 5 10 15 20 25 30 35 40 45
Drive to focus on customers
Part of the organisation’s continuous programme
Desire to employ world best practice
Development of key performance indicators
The need for survival from internal constraints
To increase flexibility
To increase market share
Frequency
Fig. 1: Driving forces to implement lean manufacturing
ISSN: 2010-0248
377
Large (> 151) 47 77.1
Quality management system
employed
ISO9001 35 57.4
QS9000 6 10.0
ISO/TS16949 43 70.5
ISO14000 38 62.3
OHSAS18001 12 19.7
Other than the company age, respondents were also asked
about the size and ownership of the companies. In Table 3, it
is shown that respondents were mostly from large companies
with more than 150 full-time employees, which exhibits
77.1%. In addition, half of the respondent companies have
local ownership (49.2%), whereas 36.1% of the total
respondent company have joint venture and the remaining
14.9% have fully foreign ownership. Regarding the quality
system certification, all respondent companies have at least
one certification in the relevant field. Examining the results
in more detail, it was found out that 70.5% of total respondent
companies are certified by ISO/TS16949. About 62.3% were
certified by ISO14000 and 57.4% certified by ISO9001.
Other types of quality certification such as OHSAS18001
and QS9000 were owned by 19.7% and 10% of respondent
companies respectively.
B. Driving forces to Lean Manufacturing Implementation
To understand the LM implementation driving forces in
Malaysian automotive industries, respondents were asked to
indicate the forces that influenced their decision to
implement LM. Fig. 1 illustrates the driving factors that force
the respondent companies to implement LM. As can be seen,
the main driver that can influence the implemenation of LM
system is the organisation’s continuous improvement
programme. It exhibits 68.9% of all driving forces. Beside
organisation’s continuous improvement programme, other
lean drivers that can effect the LM implementation are the
customers’ satisfaction (54.1%) and the desire to employ
world best practice to the company (50.8%). It is surprising
to find that the increase market share is the smallest driving
factor to implement LM system which exhibits only 27.9%
among all other factors.
C. Lean Manufacturing implementation
In order to further verify the extent of lean implementation
in Malaysian automotive industries, the respondent
companies were asked to rate the level of adoption on each of
the lean practices listed based on their current manufacturing
practices. Fig. 2 illustrates the distribution of LM practice
mean scores.
Among all of the LM practices, Kaizen is found to be the
leading lean practice, with mean score 3.97. Other lean
practices that have been extensively implemented is the 5S
(3.93) and preventive maintenance (3.93). However, the least
practiced lean tools are the cellular manufacturing and
supplier involvement in product design practice. These lean
practices have mean score less than 3.0, which indicate
having some implementation in the companies. This result
agrees with the previous research done by Wong et al. [7]
which highlights that the highest implemented lean practice
in Malaysian electrical and electronics industries is 5S and
Kaizen. Whilst, group technology or cellular manufacturing
is the least adopted lean tools because it demands large
investment in equipment and facilities.
33
42
31
21
21
22
17
0 5 10 15 20 25 30 35 40 45
Drive to focus on customers
Part of the organisation’s continuous programme
Desire to employ world best practice
Development of key performance indicators
The need for survival from internal constraints
To increase flexibility
To increase market share
Frequency
Fig. 1: Driving forces to implement lean manufacturing
Paraphrase This Document
Need a fresh take? Get an instant paraphrase of this document with our AI Paraphraser
International Journal of Innovation, Management and Technology, Vol. 1, No. 4, October 2010
ISSN: 2010-0248
378
3.97
3.93
3.93
3.78
3.73
3.70
3.68
3.67
3.63
3.62
3.62
3.61
3.60
3.58
3.58
3.57
3.55
3.50
3.45
3.43
3.43
3.43
3.25
3.20
3.17
2.93
2.78
0.00 0.50 1.00 1.50 2.00 2.50 3.00 3.50 4.00 4.50
Kaizen
5S
Preventive maintenance
Training
Visual control
Daily schedule adherence
Employee involvement
Equipment layout
Supplier quality level
Customer involvement in quality
Cross functional teams
Kanban/ pull production
Workforce commitment
Setup time reduction
Group problem solving
Continuous flow
Customer involvement in product design
Small lot size
JIT link with customers
Supplier involvement in quality
“Error proof” equipment
Levelled production
JIT delivery by suppliers
Long term contract
Product design - simplicity
Supplier involvement in product design
Cellular manufacturing
Mean Scores
Fig. 2: Distribution of responses based on the adoption of lean manufacturing practices
LM practices can be categorised into five categories:
process and equipment, manufacturing planning and control,
human resources, supplier relationships, and customer
relationship [15]. The list of lean practices that is included in
the categories and its mean scores are shown in Table 4.
Table 4 also illustrates the distribution of LM mean scores
for each of the category and its practice. The Human
resources group shows the highest mean of LM adoption in
Malaysian automotive industries. On the other hand the
Supplier relationships has the lowest mean score (3.29).
These findings confirm the results obtain by Panizzolo [15]
where it was showed that many firms seem to have difficulty
in adopting lean tools that concern with external relationships
such as with suppliers and customers. These difficulties also
occur even for high performers compared to the internal areas
of the firm, which are more direct.
TABLE 4: LEAN CATEGORIES AND ITS MEAN SCORE.
Group/category Lean practices/ tools mean SD
Process & equipment
• Kaizen
• 5S
• Setup time reduction
• Cellular manufacturing
• Continuous flow
• Equipment layout
• Product design – simplicity
• Error proof equipment
• Preventive maintenance
3.55 0.66
2
Manufacturing planning & control
• Levelled production
• Kanban/ pull production
• Daily schedule adherence
• Small lot size
• Visual control 3.65 0.68
8
Human resources
• Group problem solving
• Training
• Cross functional teams
• Employee involvement
• Workforce commitment 3.66 0.66
3
Supplier relationships
• JIT delivery
• Supplier quality level
• Supplier involvement in quality improvement program
• Supplier involvement in product design and development
3.30 0.70
0
Customer relationships
• Customer involvement in quality programs
• Customer involvement in product design
• JIT link
3.55 0.81
9
TABLE 5: MEAN VALUES FOR THREE CLUSTER ANALYSIS SOLUTIONS FOR LEAN PRACTICES
Non-lean (A) In-transition (B) Lean (C) ANOVA
n=14 n=30 n=16 F p-value
Total Lean practices 2.81 3.64 4.29 164.9
2
.00
Process and equipment 2.81 3.50 4.27 57.36 .00
Manufacturing process and control 2.90 3.54 4.44 47.08 .00
Human resources 3.10 3.50 4.39 36.80 .00
International Journal of Innovation, Management and Technology, Vol. 1, No. 4, October 2010
ISSN: 2010-0248
379
Supplier relationship 2.47 3.25 4.05 57.54 .00
Customer relationship 2.74 3.47 4.35 36.51 .00
D. Lean Status
In order to identify the lean status of each respondent
company, cluster analysis was performed to classify whether
the companies are into lean, in-transition towards lean, or
non-lean. Cluster is a group that is computed from the
average values of the lean practices variables for all the firms
and signifies the extent of the lean manufacturing
implementation of that group. Companies were classified as
non-lean, in-transition towards lean or lean based on the
hierarchical cluster analysis of their mean scores for each
individual lean practice using the squared Euclidian distance
between variables. Ward’s method is used to optimize the
minimum variance between clusters. Table 5 shows the mean
scores for the three cluster solutions.
As a result of the cluster analysis, the first group (A) has 14
firms and it is characterised having low mean values for all
five lean practices variables. This suggests that the firms
forming this cluster implement little lean manufacturing
practices and for this reason they are categorised as non-lean
firms. The second group (B) has 30 firms, and is
characterised having moderate mean values for each of the
five variables. This group is categorised as in-transition
towards lean manufacturing system. Finally, the third group
(C), which has 17 firms, are classified as lean firms because
they have high mean values of each lean manufacturing
practices variables. The values suggest that in these firms
lean manufacturing practices are extensively implemented in
their organisation’s operation and management.
The results in Table 5 also show one-way independent
ANOVA to determine the significance of the difference
between means of cluster. The purpose of this test is to
examine the cluster predictive validity and consistency with
expected practice levels within groups. To test the
homogeneity of variance, Levene test is used for equality of
variances. The Levene’s test showed that all lean practices
are not significant (p>0.05) except for Process and
equipment. It is assumed in Levene’s test that the population
variances for each group are relatively equal. Again the
F-ratio is used to represent whether the group means are the
same. Results for all lean practice show that, p< 0.05, which
significantly states that the mean scores of lean
manufacturing practices were different across the lean groups.
This proves that the ANOVA results contribute to evaluate
the validity of the cluster analysis.
In order to further verify the LM implementation in
respondent companies, the implemented tools were also
analysed based on the firm status of lean implementation
(Table 5). It is found that non-lean firms show more emphasis
on human resources during lean tools implementation. On the
other hand firms which are in-transition towards lean and
lean spend more resources in manufacturing process and
control. According to Herron and Braiden [4], as the
companies become stable and become more knowledgeable
in their field, they can apply more advance lean tools in order
to support the end goal of the production system.
E. Lean barriers
To implement lean manufacturing system is not an easy
task. For any change in organisation to take hold and success,
the resistance forces or barriers need to be identified and
understood. Failure to access organisational and individual
change readiness may result the management to spend
significant time and energy. Dealing with resistance to
change requires a lot of risk and hard work [28, 29].
The lean barriers are analysed based on the status of lean
implementation by the respondent companies (Table 6),
which are indicated from the previous section. The three
main barriers in non-lean firms are the lack of lean
understanding, lack of senior management and middle
management attitudes. On the other hand firms which are
in-transition towards lean system, most of their barriers are in
the lack of lean understanding and employees’ attitude.
Again for lean firms, lack of lean understanding is identified
as the main barrier to implement LM system successfully.
Interestingly, all firms recognize the main barrier is the lack
of lean understanding. This is because LM requires new
knowledge and cultural change during the transition. LM
should be applied comprehensively and holistically in
principles and concepts [17, 30]. The ability of people to
respond and adapt is critical when they face any change in
situation. Appropriate communication and training on the
concept and basic principles of LM system would give
greater level of understanding about the system and
encourage motivation and innovation in the work culture and
employees attitudes [21].
TABLE 6: LEAN BARRIERS
Description Mean
Non
lean
In-transition Lean Total
Company culture 3.79 3.37 2.57 3.23
National culture 3.79 2.97 2.69 3.08
Attitude of shop floor
employees
4.00 3.50 2.88 3.45
Attitude of middle
management
3.86 3.37 2.75 3.32
Lack of senior
management
commitment
3.93 3.10 2.94 3.25
Nature of
manufacturing facility
3.36 2.97 2.44 2.92
Investment cost 3.71 3.37 2.69 3.27
Inability to quantify
benefits
3.36 3.37 2.44 3.12
Lack of communication 3.86 3.37 2.63 3.28
Lack of understanding
on LM concepts
4.14 3.70 3.25 3.68
⊘ This is a preview!⊘
Do you want full access?
Subscribe today to unlock all pages.
Trusted by 1+ million students worldwide
International Journal of Innovation, Management and Technology, Vol. 1, No. 4, October 2010
ISSN: 2010-0248
380
V. CONCLUSION
The purpose of this paper is to explore the extent of LM
implementation in Malaysian automotive manufacturing
firms. The results show that most of the respondent firms
have implemented lean manufacturing system up to a certain
extent. Cluster analysis is performed to classify the
respondent firms in groups to signify the extent of lean
manufacturing implementation or their status from five lean
manufacturing practice categories. Majority of the
respondent firms are classified as in-transition towards lean
because of having moderate mean values for each of the five
variables. The firms should aware and understand the lean
concept and purpose, because the main barriers of these firms
are the lack of real understanding of lean manufacturing
concept and employees’ attitude. This finding has
implication for the firms as it provide a mean to help them to
identify the factors that hinder or delay the implementation
process. The management should understand and emphasis
the importance to overcome these resistance for the
successful implementation of lean manufacturing system in
their firms.
REFERENCE
[1] Holweg, M., "The genealogy of lean production," Journal of
Operations Management, vol. 25, pp. 420-437, 2007.
[2] Balle, M., "Lean attitute - Lean application often fail to deliver the
expected benefits but could the missing link for successful
implementations be attitude?," Manufacturing Engineer, vol. 84, pp.
14-19, 2005.
[3] Fairris, D. and Tohyama, H., "Productive efficiency and the lean
production system in Japan and the United States," Economic and
Industrial Democracy, vol. 23, pp. 529-554, 2002.
[4] Herron, C. and Braiden, P. M., "Defining the foundation of lean
manufacturing in the context of its origins (Japan)," in IET
International Conference on Agile Manufacturing, 2007, p. 148-157.
[5] Liker, J. K. and Hoseus, M., Toyota Culture: the heart and soul of the
Toyota Way. New York: McGraw-Hill, 2008.
[6] Wong, M., "The role of culture in implementing lean production
system," in IFIP International Federation for Information Processing.
vol. 246, J. Olhager and F. Persson, Eds. Boston: Springer, 2007, pp.
413-422.
[7] Wong, Y. C., Wong, K. Y., and Ali, A., "A study on lean manufacturing
implementation in the Malaysian electrical and electronics industry,"
European Journal of Scientific Research, vol. 38, pp. 521-535, 2009.
[8] Womack, J. P., Jones, D. T., and Roos, D., The machine that changed
the World: The triumph of lean production. New York: Rawson
Macmillan, 1990.
[9] Schonberger, R. J., "Japanese production management: An evolution -
with mixed success," Journal of Operations Management, vol. 25, pp.
403-419, 2007.
[10] Flott, L. W., "Industry in transition," in Metal Finishing, 2002, pp.
77-82.
[11] Srinivasaraghavan, J. and Allada, V., "Application of mahalanobis
distance as a lean assessement metric," International Journal of
Advanced Manufacturing Technology, vol. 29, pp. 1159-1168, 2006.
[12] Oliver, N., Delbridge, R., and Lowe, J., "Lean production practices:
International comparisons in the auto components industry," British
Journal of Management, vol. 7, pp. s29-s44, 1996.
[13] Shah, R. and Ward, P. T., "Lean manufacturing: context, practice
bundles and performance," Journal of Operations Management, vol. 21,
pp. 129-149, 2003.
[14] Olsen, E. O., "Lean manufacturing management: the relationship
between practice and firm level financial performance," in Business
Administration. vol. Doctor of Philosophy Ohio: Ohio State University,
2004.
[15] Panizzolo, R., "Applying the lessons learned from 27 lean
manufacturers. The relevance of relationships management,"
International Journal of Production Economics, vol. 55, pp. 223-240,
1998.
[16] Achanga, P., Shehab, E., Roy, R., and Nelder, G., "Critical success
factors for lean implementation within SMEs," Journal of
Manufacturing Technology Management, vol. 17, pp. 460-471, 2006.
[17] James, T., "Wholeness as well leanness," in IET Manufacturing
Engineer, 2006, pp. 14-17.
[18] Papadopoulou, T. C. and Ozbayrak, M., "Leaness: experiences from
the journey to date," Journal of Manufacturing Technology
Management, vol. 16, pp. 784-807, 2005.
[19] Pavnaskar, S. J., Gershenson, J. K., and Jambekar, A. B.,
"Classification scheme for lean manufacturing tools," International
Journal of Production Research, vol. 41, pp. 3075-3090, 2003.
[20] Jorgensen, F., Matthiesen, R., Nielsen, J., and Johansen, J., "Lean
maturity, lean sustainability," in IFIP International Federation for
Information Precessing. vol. 246, J. Olhager and F. Persson, Eds.
Boston: Springer, 2007, pp. 371-378.
[21] Puvanasvaran, P., Megat, H., Hong, T. S., and Muhamad, M. R., "The
roles of communication process for an effective lean manufacturing
implementation," Journal of Industrial Engineering and Management,
vol. 2, pp. 128-152, 2009.
[22] SMECorp. (2010). Definition of SMEs. [Online]. Available:
http://www.smidec.gov.my/node/33
[23] Shah, R. and Ward, P. T., "Defining and developing measures of lean
production," Journal of Operations Management, vol. 25, pp. 785-805,
2007.
[24] Bonavia, T. and Marin, J. A., "An empirical study of lean production in
the ceramic tile industry in Spain," International Journal of Operation
& Production Management, vol. 26, pp. 505-531, 2006.
[25] Perez, M. P. and Sanchez, A. M., "Lean production and suplier
relations: a survey of practices in he Aragonese automotive industry,"
Technovation, vol. 20, pp. 665-676, 2000.
[26] Sekaran, U., Research Methods for Business: A skill building approach,
Fourth ed. Singapore: John Wiley & Sons Inc, 2005.
[27] Field, A., Discovering statistic using SPSS, 2nd ed. London: Sage
Publications, 2006.
[28] Stanleigh, M., "Effecting successful change management initiatives,"
Industrial and Commercial Training, vol. 40, pp. 34-37, 2008.
[29] Barker, B., "The identification of factors affecting change towards best
practice in manufacturing organisations," Management Decision, vol.
36, pp. 549-556, 1998.
[30] Crute, V., Ward, Y., Brown, S., and Graves, A., "Implementing lean in
aerospace - challenging the assumptions and understanding the
challenges," Technovation, vol. 23, pp. 917-928, 2003.
Norani Nordin is a lecturer with the Technology Management Department,
College of Business at Universiti Utara Malaysia. She has BEng and MSc
degrees in Manufacturing System Engineering. She is currently doing her
Phd in lean manufacturing. Her main research interests are lean
manufacturing, industrial engineering, and manufacturing management.
Norani Nordin can be contacted at rani@uum.edu.my.
Baba Md Deros is an Associate Professor at the Department of
Mechanical and Material Engineering, Faculty of Engineering and Built
Environment, Universiti Kebangsaan Malaysia. His research interests span
several fields of quality management, benchmarking and ergonomics. Baba
Md Deros can be contacted at hjbaba@eng.ukm.my
Dzuraidah Abd. Wahab is an Associate Professor at the Department of
Mechanical and Material Engineering, Faculty of Engineering and Built
Environment, Universiti Kebangsaan Malaysia. Currently she is the faculty’s
Coordinator of Graduate Studies. Her research interest are in the area
concurrent engineering and sustainable product design. Dzuraidah Abd
Wahab can be contacted at dzuraida@eng.ukm.my.
1 out of 7
Related Documents


Your All-in-One AI-Powered Toolkit for Academic Success.
+13062052269
info@desklib.com
Available 24*7 on WhatsApp / Email
![[object Object]](/_next/static/media/star-bottom.7253800d.svg)
Unlock your academic potential
Copyright © 2020–2026 A2Z Services. All Rights Reserved. Developed and managed by ZUCOL.