A Comparison of Bankruptcy Models
VerifiedAdded on 2023/04/21
|11
|4491
|275
AI Summary
This study analyzes and compares three bankruptcy models - Z-Score model, O-score model, and Zmijewski's model - to predict financial distress and bankruptcy in industrial corporations. The study aims to find the best predictor of bankruptcy and provide suggestions to improve financial performance. The data is collected from Texmo Industries, Coimbatore, and analyzed using Z-score analysis, Ohlson's O-score analysis, and Zmijewski's analysis.
Contribute Materials
Your contribution can guide someone’s learning journey. Share your
documents today.
INTERNATIONAL JOURNAL OF MARKETING,
FINANCIAL SERVICES & MANAGEMENT RESEARCH
Vol.1 No. 4, April 2012, ISSN 2277 3622
Online Available at indianresearchjournals.com
A COMPARISON OF BANKRUPTCY MODELS
*DR. RADHA GANESH KUMAR, **KISHORE KUMAR,
*Associate Professor, Department of Management Studies, Valliammai Engineering College, Kattankulathur
** Managemnet Trainee, Congruent solutions, Chennai
76
ABSTRACT
Financial analysis can be applied in a wide variety of situations to give business managers
the information they need to make crucial decisions. In Texmo there is a need for a pragmatic tool to ma
the prediction of financial distress with a single formula with implementation of information system. An
empirical comparison of Bankruptcy models is done to obtain it. This study analyses three of the venerable
models for assessing the distress of industrial corporations. These are the so-called Z-Score model, O-score
model and Zmijewski's model. Z-Scores, O-score and Zmijewski's model are used to predict the
profitability that a firm will go into bankruptcy within two years, forecast corporate defaults and an easy-
to-calculate control measure for the financial distress status of companies in academic studies.
Bankruptcy, models, distress, corporations, control measures.Keywords:
INTRODUCTION measure of the probability of bankruptcy with Traditional
Academics in the fields of accounting and finance havefinancial analysis. The most important conclusion that the
actively studied bankruptcy prediction since the work ofresults of this study point out is that it is possible to predict
Beaver (1966, 1968), Altman (1968), Ohlson (1980) andfinancial distress and bankruptcy more accurately using the
Zmijewski's (1984). With few exceptions, this literature hasdomestic data through the foundation of new models based
relied on accounting-basedmeasuresas the predictor on different combinationsof financial ratios, when
variables. More recent studies have used proxies for thecompared to the old and more prestigious model proposals.
probability of bankruptcy (PB) as an independent variableIt is so interesting and amazing to have produced a new
rather than as the dependent variable. These latter studiesmodel proposal with a slightly better prediction
frequentlyobtain their PB proxies from the existing performance using the binary logistic regression technique
bankruptcy prediction literature, and hence, have relied onagainst the existing model proposals of the past researchers.
accounting-based measures. Many of these studies have usedOur findings show that none of the existing prediction
compositemeasures that statisticallycombineseveral models could achieve a satisfactory level of prediction
different accountingvariables,with Altman's (1968), performance. The correct-classification percentages of the
Zmijewski's(1984) and an derived from Ohlson's (1980)existing models are all below 96 %. None could generate
Model being the most popular, the performance of theseaccuracy level. The best model among the existing financial
accounting-based composite measures in explaining thedistress prediction models is Ohlson's O-Score Model.
cross-sectionalvariation in the actual probability of Surprisingly, Altman's Z-score Model has produced lower
bankruptcy. levels of accuracy.
REVIEW OF LITERATUREThese models utilises multiple corporate income and balance
Edward I. Altman, Ph.D., a financialeconomistandsheet values to measure the financial health of a company.
professor at New York University's Stern School of Business,These models are still being used by practitioners
developed the Z-Score in 1968 says that Z-Score forecaststhroughout the world. The aim of the study is to assess
the probability of a company entering bankruptcy within awhether three popular accounting-based measures, Altman's
12-month period. Altman's model predicted with 95%(1968) , Ohlson's (1980) and Zmijewski's model (1992)
accuracy which sample companies filed bankruptcy withineffectively summarize publicly-available information about
12 months. In later studies, using broader samples ofthe probability of bankruptcy. The study compares the
companies analyzed during a variety of economic climates,relative information content of these to a market-based
Secure Best Marks with AI Grader
Need help grading? Try our AI Grader for instant feedback on your assignments.
the Z-Score accuracy rate remained in the 82% to 85%the traditional valuation model based on discounted future
range. dividends. Ohlson's O-score model is often referred to as the
residual income model since it expresses firm value as a
The model itself is not complicated. It combines fivefunction of the book value of net assets and the present value
financial ratios using reported accounting information andof expected residual earnings on those net assets. Gary Klein
equity values to produce an objective measure of a firm'smen express the application of the Zmijewski's model is
financial health. Altman's Z-Score remains popular afterslightly more complex due to the methodology used to
almost 30 years because it is easy to calculate. Othergenerate the parameters. Zmijewski's model is also known as
bankruptcy prediction models exist, some of which are moreprobit analysis, which is why two steps are required beyond
accurate, especially over a horizon greater than two years.those applied for discriminant analysis-based models such as
However, they are more complex and most are proprietary.the previously presented Altman Model. First, the constant
Bum J Kim says that while the model was developed toand each parameter of the model must be multiplied by
analyse manufacturing companies, it can also be applied to1.8138 and then multiplied by the financial measure. Two
non-manufacturingorganizations by modifying the alternative sets of parameters are provided, either of which
formula. To do so, the first four components of the formulacan be used for estimation weighted measures are based on
(Xl to X4) are used and the fifth component (x5) is omitted.varying proportions of bankrupt and non bankrupt firms.
The adjustedformula seemsto provide equally valid
OBJECTIVES OF THE STUDYpredictive result. Altman, Haldeman and Narayanan (1977)
• To perform a comparison of Bankruptcy models withconstructeda second generationmodel with several
traditional analysis in "Texmo Industries, Coimbatore"enhancementsto the original Z-Score approach.The
• To find out the probability of Bankruptcy throughpurpose of this study was to construct, analyze and test a
Altman Z-score, Ohlson's O-score, and Zmijewski'snew bankruptcyclassificationmodel which considers
model at Texmo Industries for the years 2005-2006explicitly recent developments with respect to business
to2009-2010.failures. The new study also incorporated refinements in the
• To compare the Z-score, O-score, and Zmijewski'sutilization of discriminant statistical techniques. Several
score with traditional financial parameters. To find outreasons for building a new model, despite the availability of
the model that is the best predictor of bankruptcy. Toseveral fairly impressive "old" models, are presented below
forecast the probability of bankruptcy for 2010-2011 toand the empirical results seem to substantiate the effort. The
2013-2014.To estimate correlation between net profitnew model, which we call ZETA, was effective in classifying
and probability of bankruptcy prediction model.bankrupt companies up to five years prior to failure on a
• To give suggestionsto improve the financialsample of corporations consisting of manufacturers and
performance of Texmo Industries.retailers. Since the ZETA model is a proprietary effort, I
cannot fully disclose the parameters of the market.
SCOPE OF THE STUDYKin Lo and Thomas Lys", says, review of the Ohlson's
The study is conducted at Texmo Industries. The duration ofModel suggests that it extends the literature on valuation.
the study was confined to about four months .This study isThe revival of residual income valuation is notable on its
based on the collected data for five years i.e., 2005-2006 toown. Added to that, the parsimoniousinformation
2009-2010.The major scope of the study are:dynamics translates expectations of the future to current
• To provide information about the financial position,observables. While the model's core has been known for
performance and changes in financial position of Texmomany decades, the OM is built upon the more solid
Industries that is useful to a wide range of users infoundation of Modigliani and Miller. Finally, the model is
making economic decision.elegant and lends itself to extensions that analyze accounting
• The study will help the company to understand whatissues such as conservatism and growth, as demonstrated by
sort of changes they should make in future.Feltham and Ohlson (1995).
• All the factors are studied based on the past data leavingOhlson (1995) and Feltham and Ohlson (1995)
scope for further research in the field which coulddemonstrate that equation is mathematically equivalent to
DR. RADHA GANESH KUMAR, KISHORE KUMAR
77
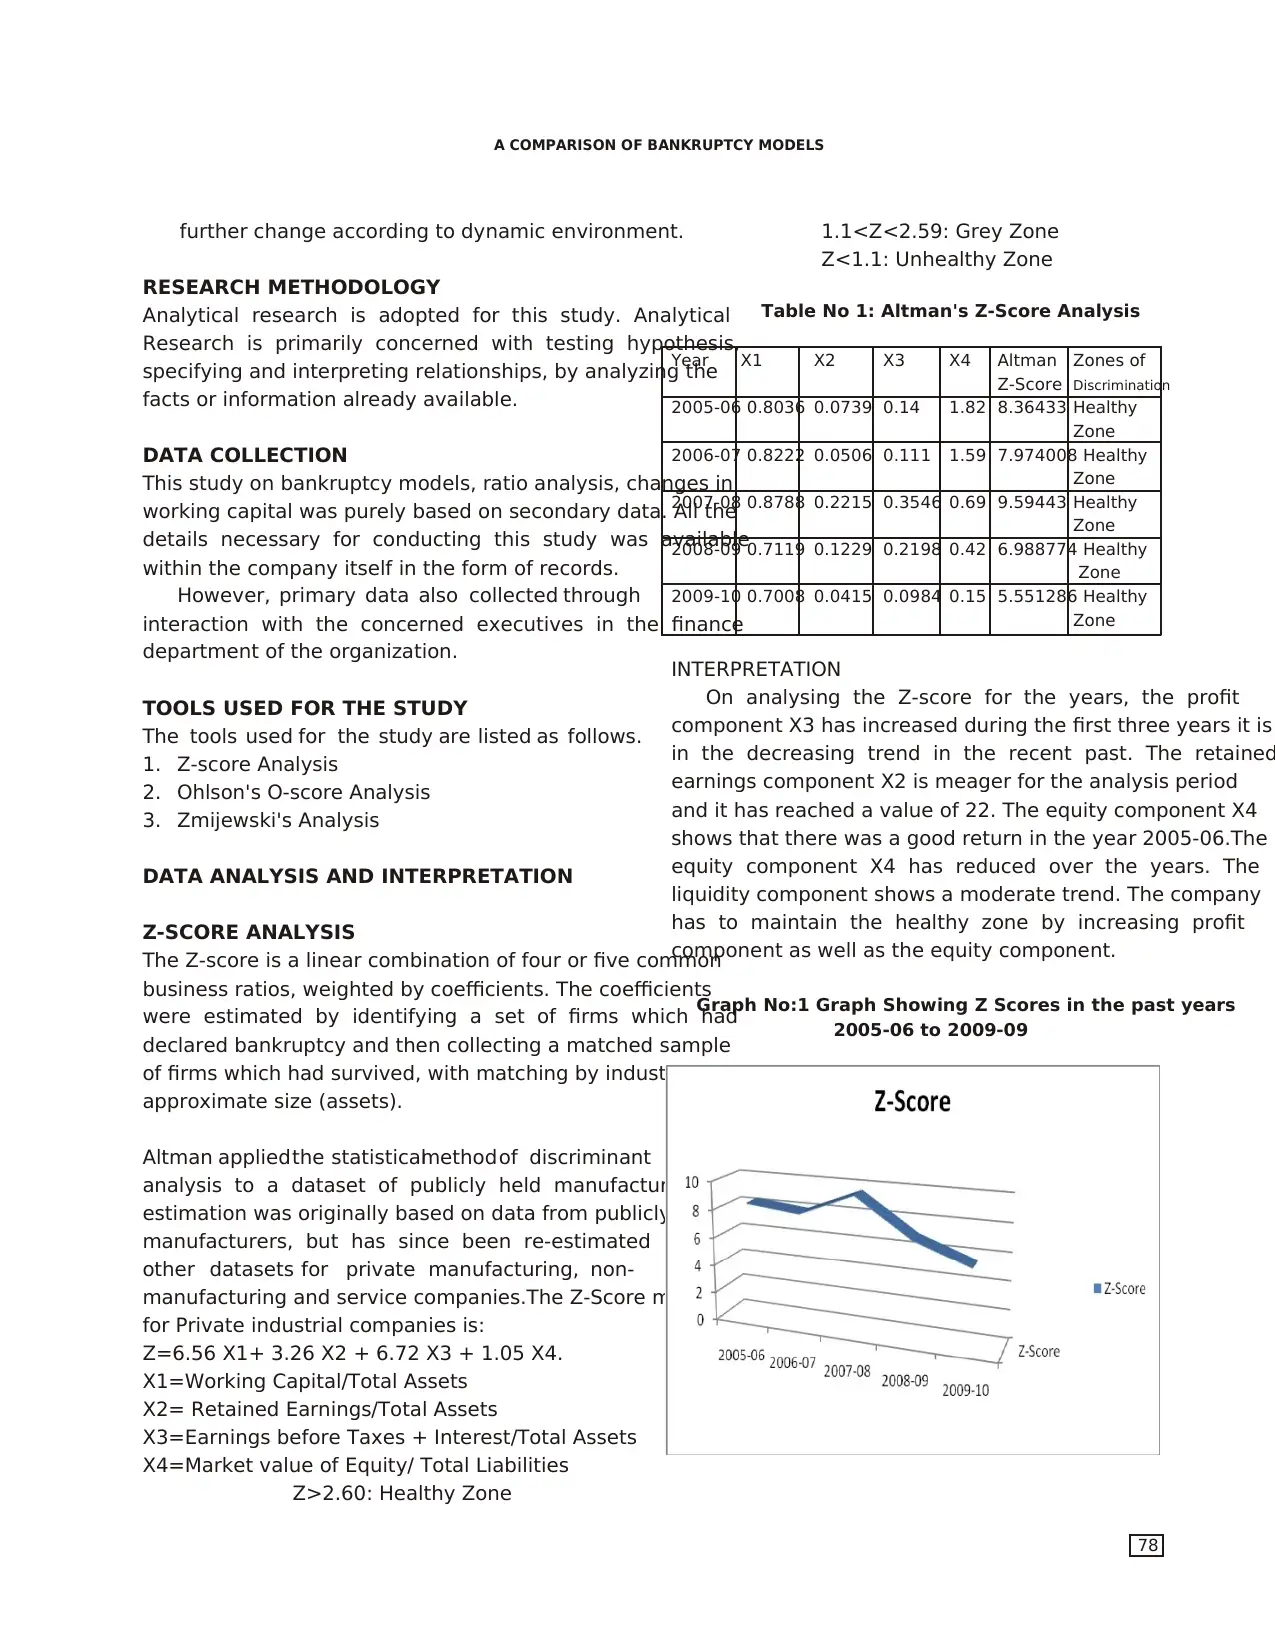
further change according to dynamic environment. 1.1<Z<2.59: Grey Zone
Z<1.1: Unhealthy Zone
RESEARCH METHODOLOGY
Table No 1: Altman's Z-Score AnalysisAnalytical research is adopted for this study. Analytical
Research is primarily concerned with testing hypothesis,
Year X1 X2 X3 X4 Altman Zones of
specifying and interpreting relationships, by analyzing the Z-Score Discrimination
facts or information already available. 2005-06 0.8036 0.0739 0.14 1.82 8.36433 Healthy
Zone
2006-07 0.8222 0.0506 0.111 1.59 7.974008 HealthyDATA COLLECTION
ZoneThis study on bankruptcy models, ratio analysis, changes in
2007-08 0.8788 0.2215 0.3546 0.69 9.59443 Healthy
working capital was purely based on secondary data. All the Zone
details necessary for conducting this study was available2008-09 0.7119 0.1229 0.2198 0.42 6.988774 Healthy
within the company itself in the form of records. Zone
However, primary data also collected through 2009-10 0.7008 0.0415 0.0984 0.15 5.551286 Healthy
Zoneinteraction with the concerned executives in the finance
department of the organization. INTERPRETATION
On analysing the Z-score for the years, the profit
TOOLS USED FOR THE STUDY component X3 has increased during the first three years it is
The tools used for the study are listed as follows. in the decreasing trend in the recent past. The retained
1. Z-score Analysis earnings component X2 is meager for the analysis period
2. Ohlson's O-score Analysis and it has reached a value of 22. The equity component X4
3. Zmijewski's Analysis shows that there was a good return in the year 2005-06.The
equity component X4 has reduced over the years. The
DATA ANALYSIS AND INTERPRETATION liquidity component shows a moderate trend. The company
has to maintain the healthy zone by increasing profit
Z-SCORE ANALYSIS component as well as the equity component.
The Z-score is a linear combination of four or five common
business ratios, weighted by coefficients. The coefficients
Graph No:1 Graph Showing Z Scores in the past years
were estimated by identifying a set of firms which had 2005-06 to 2009-09
declared bankruptcy and then collecting a matched sample
of firms which had survived, with matching by industry and
approximate size (assets).
Altman applied the statisticalmethod of discriminant
analysis to a dataset of publicly held manufacturers. The
estimation was originally based on data from publicly held
manufacturers, but has since been re-estimated based on
other datasets for private manufacturing, non-
manufacturing and service companies.The Z-Score model
for Private industrial companies is:
Z=6.56 X1+ 3.26 X2 + 6.72 X3 + 1.05 X4.
X1=Working Capital/Total Assets
X2= Retained Earnings/Total Assets
X3=Earnings before Taxes + Interest/Total Assets
X4=Market value of Equity/ Total Liabilities
Z>2.60: Healthy Zone
A COMPARISON OF BANKRUPTCY MODELS
78
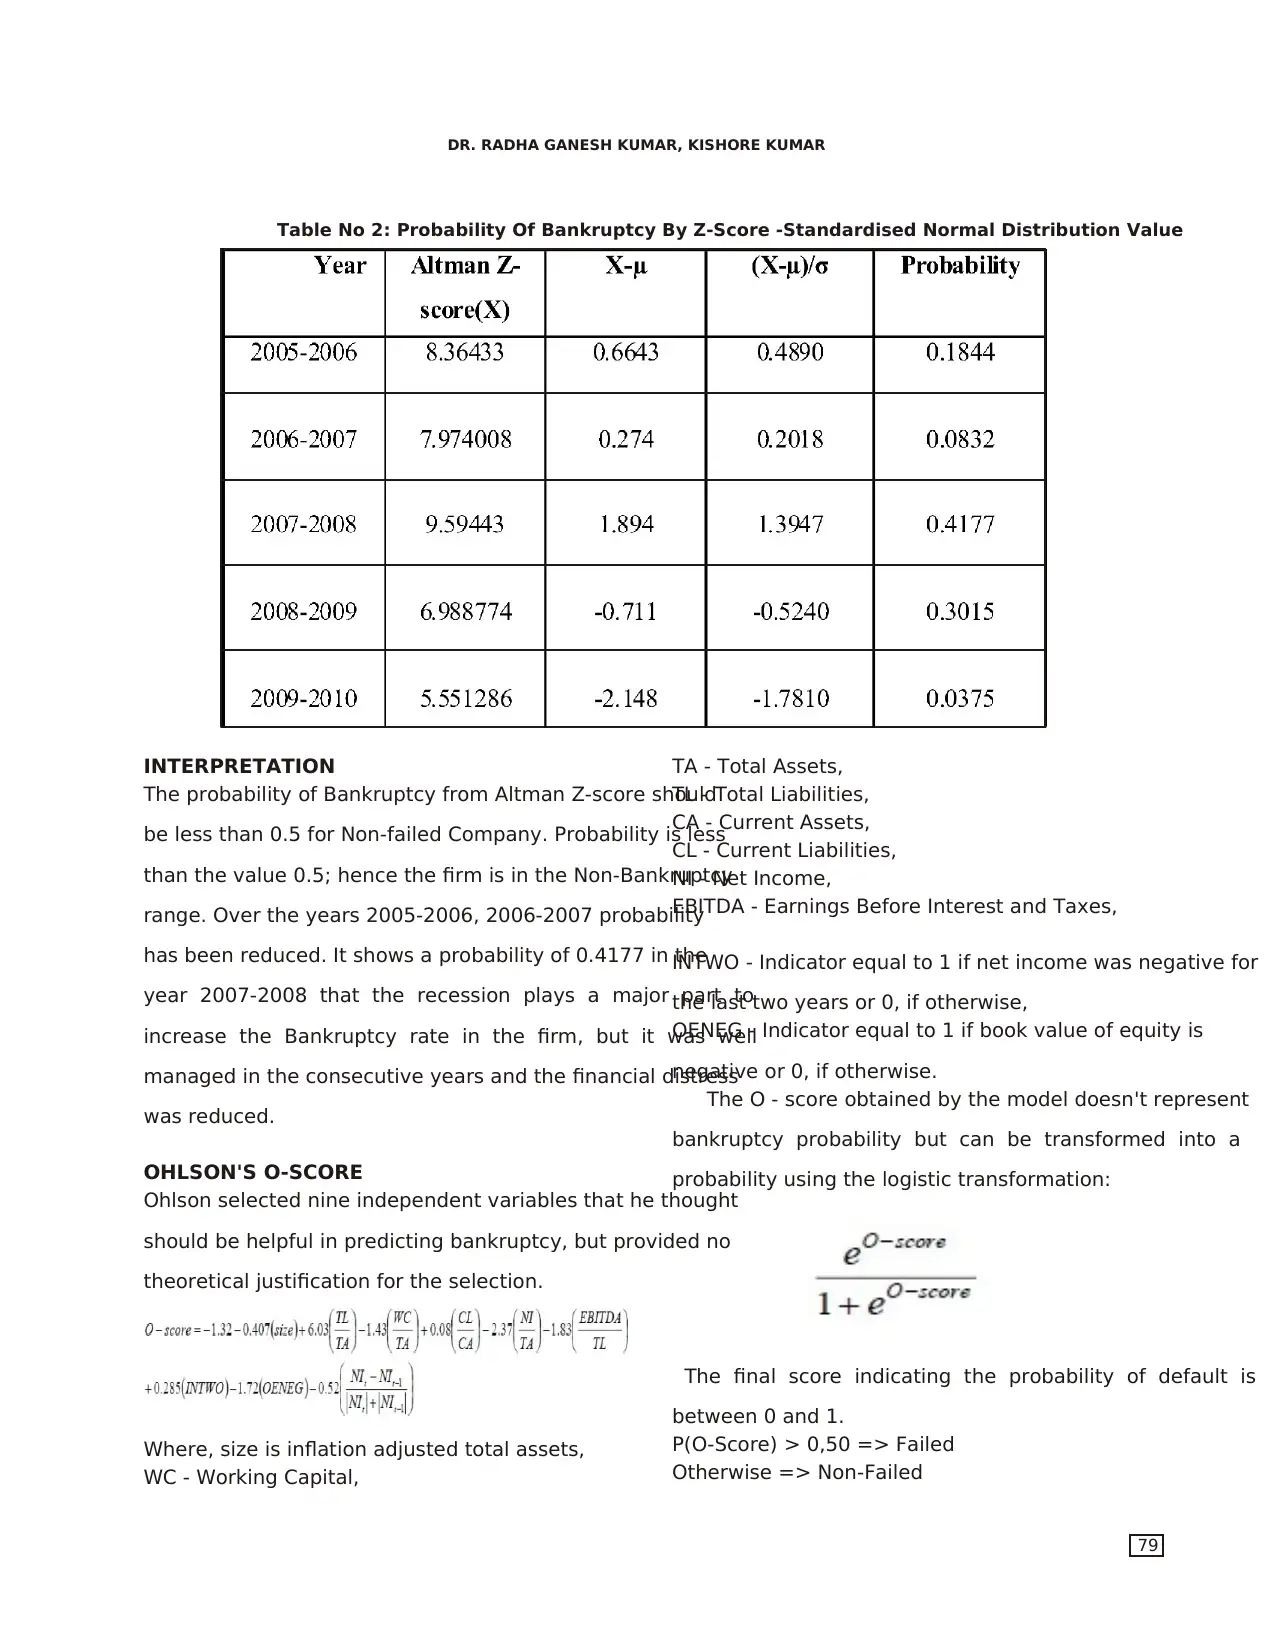
INTERPRETATION TA - Total Assets,
The probability of Bankruptcy from Altman Z-score shouldTL - Total Liabilities,
CA - Current Assets,
be less than 0.5 for Non-failed Company. Probability is less
CL - Current Liabilities,
than the value 0.5; hence the firm is in the Non-BankruptcyNI - Net Income,
EBITDA - Earnings Before Interest and Taxes,range. Over the years 2005-2006, 2006-2007 probability
has been reduced. It shows a probability of 0.4177 in theINTWO - Indicator equal to 1 if net income was negative for
year 2007-2008 that the recession plays a major part tothe last two years or 0, if otherwise,
OENEG - Indicator equal to 1 if book value of equity isincrease the Bankruptcy rate in the firm, but it was well
negative or 0, if otherwise.managed in the consecutive years and the financial distress
The O - score obtained by the model doesn't represent
was reduced.
bankruptcy probability but can be transformed into a
OHLSON'S O-SCORE probability using the logistic transformation:
Ohlson selected nine independent variables that he thought
should be helpful in predicting bankruptcy, but provided no
theoretical justification for the selection.
The final score indicating the probability of default is
between 0 and 1.
P(O-Score) > 0,50 => FailedWhere, size is inflation adjusted total assets,
Otherwise => Non-FailedWC - Working Capital,
Table No 2: Probability Of Bankruptcy By Z-Score -Standardised Normal Distribution Value
DR. RADHA GANESH KUMAR, KISHORE KUMAR
79
Secure Best Marks with AI Grader
Need help grading? Try our AI Grader for instant feedback on your assignments.
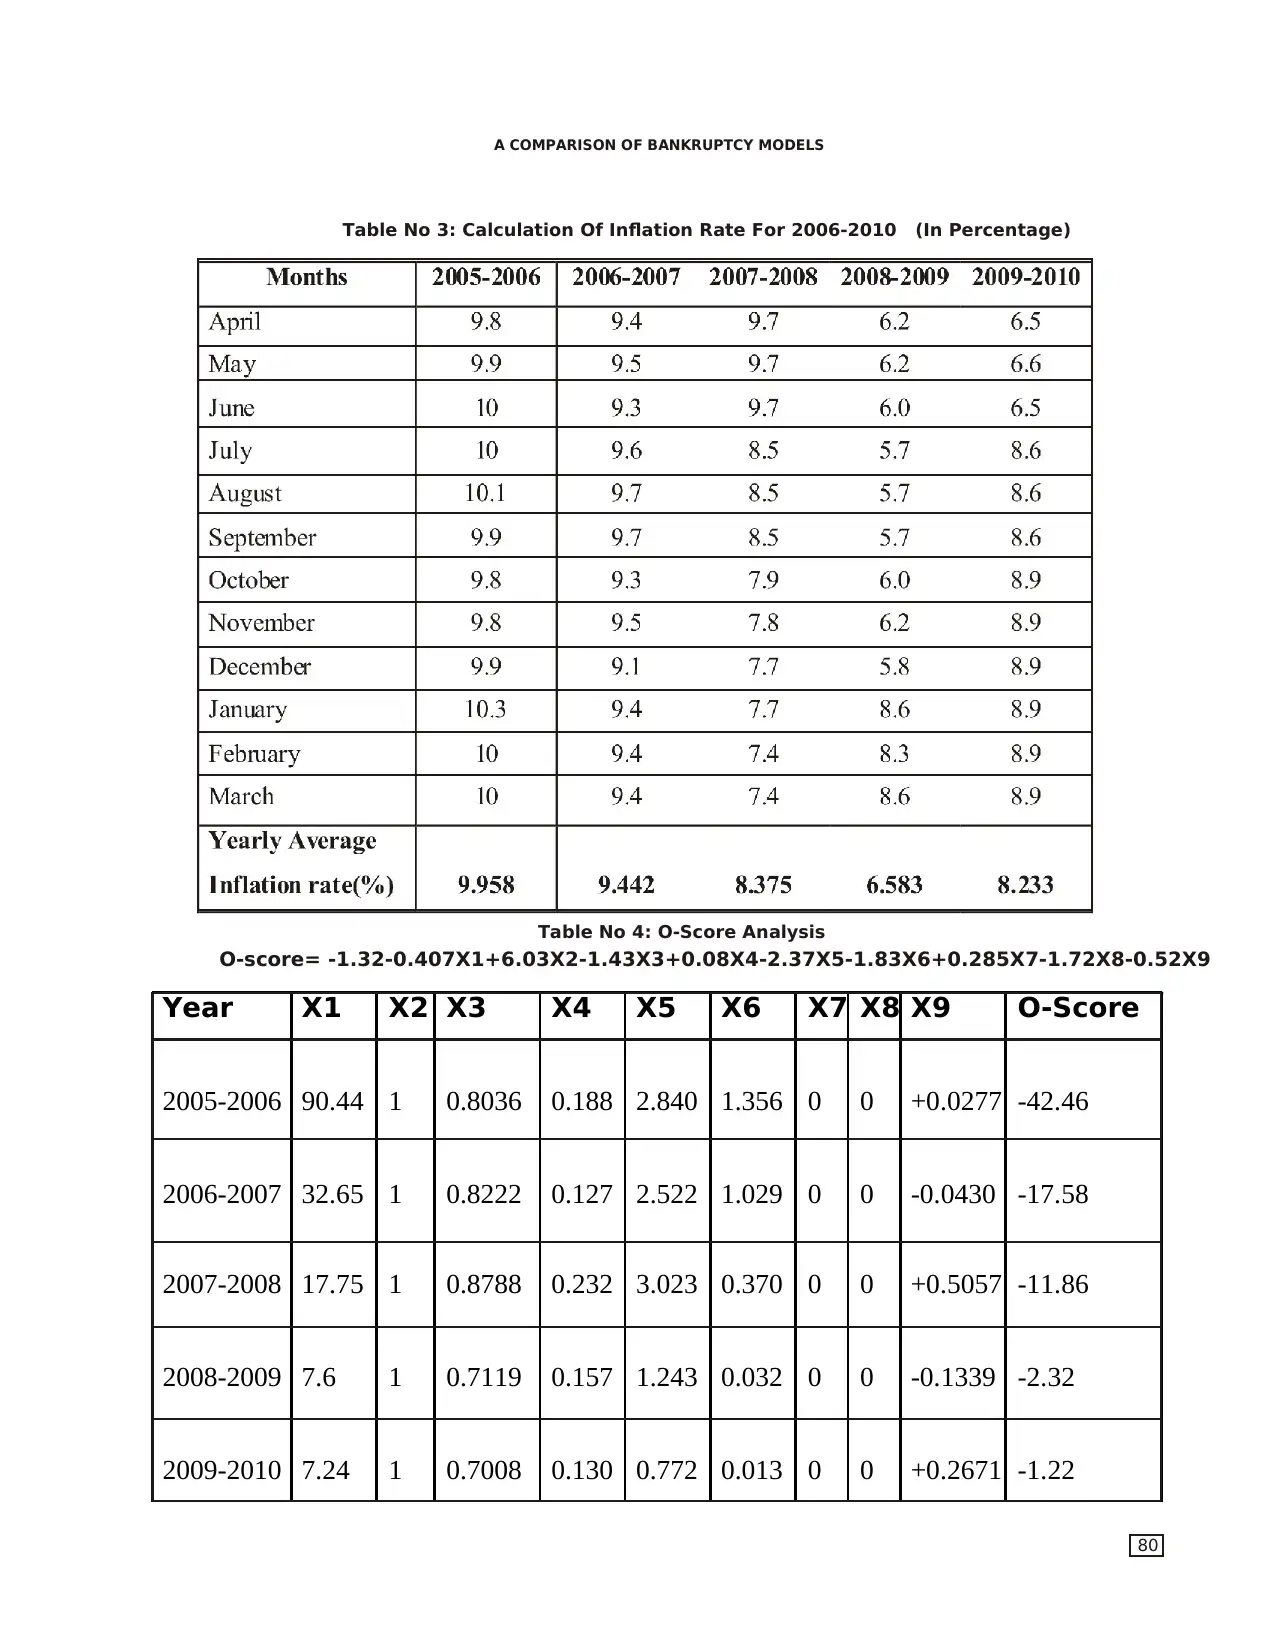
Table No 3: Calculation Of Inflation Rate For 2006-2010 (In Percentage)
Table No 4: O-Score Analysis
O-score= -1.32-0.407X1+6.03X2-1.43X3+0.08X4-2.37X5-1.83X6+0.285X7-1.72X8-0.52X9
Year X1 X2 X3 X4 X5 X6 X7 X8 X9 O-Score
2005-2006
2006-2007
2007-2008
2008-2009
2009-2010
90.44
32.65
17.75
7.6
7.24
1
1
1
1
1
0.8036
0.8222
0.8788
0.7119
0.7008
0.188
0.127
0.232
0.157
0.130
2.840
2.522
3.023
1.243
0.772
1.356
1.029
0.370
0.032
0.013
0
0
0
0
0
0
0
0
0
0
+0.0277
-0.0430
+0.5057
-0.1339
+0.2671
-42.46
-17.58
-11.86
-2.32
-1.22
A COMPARISON OF BANKRUPTCY MODELS
80
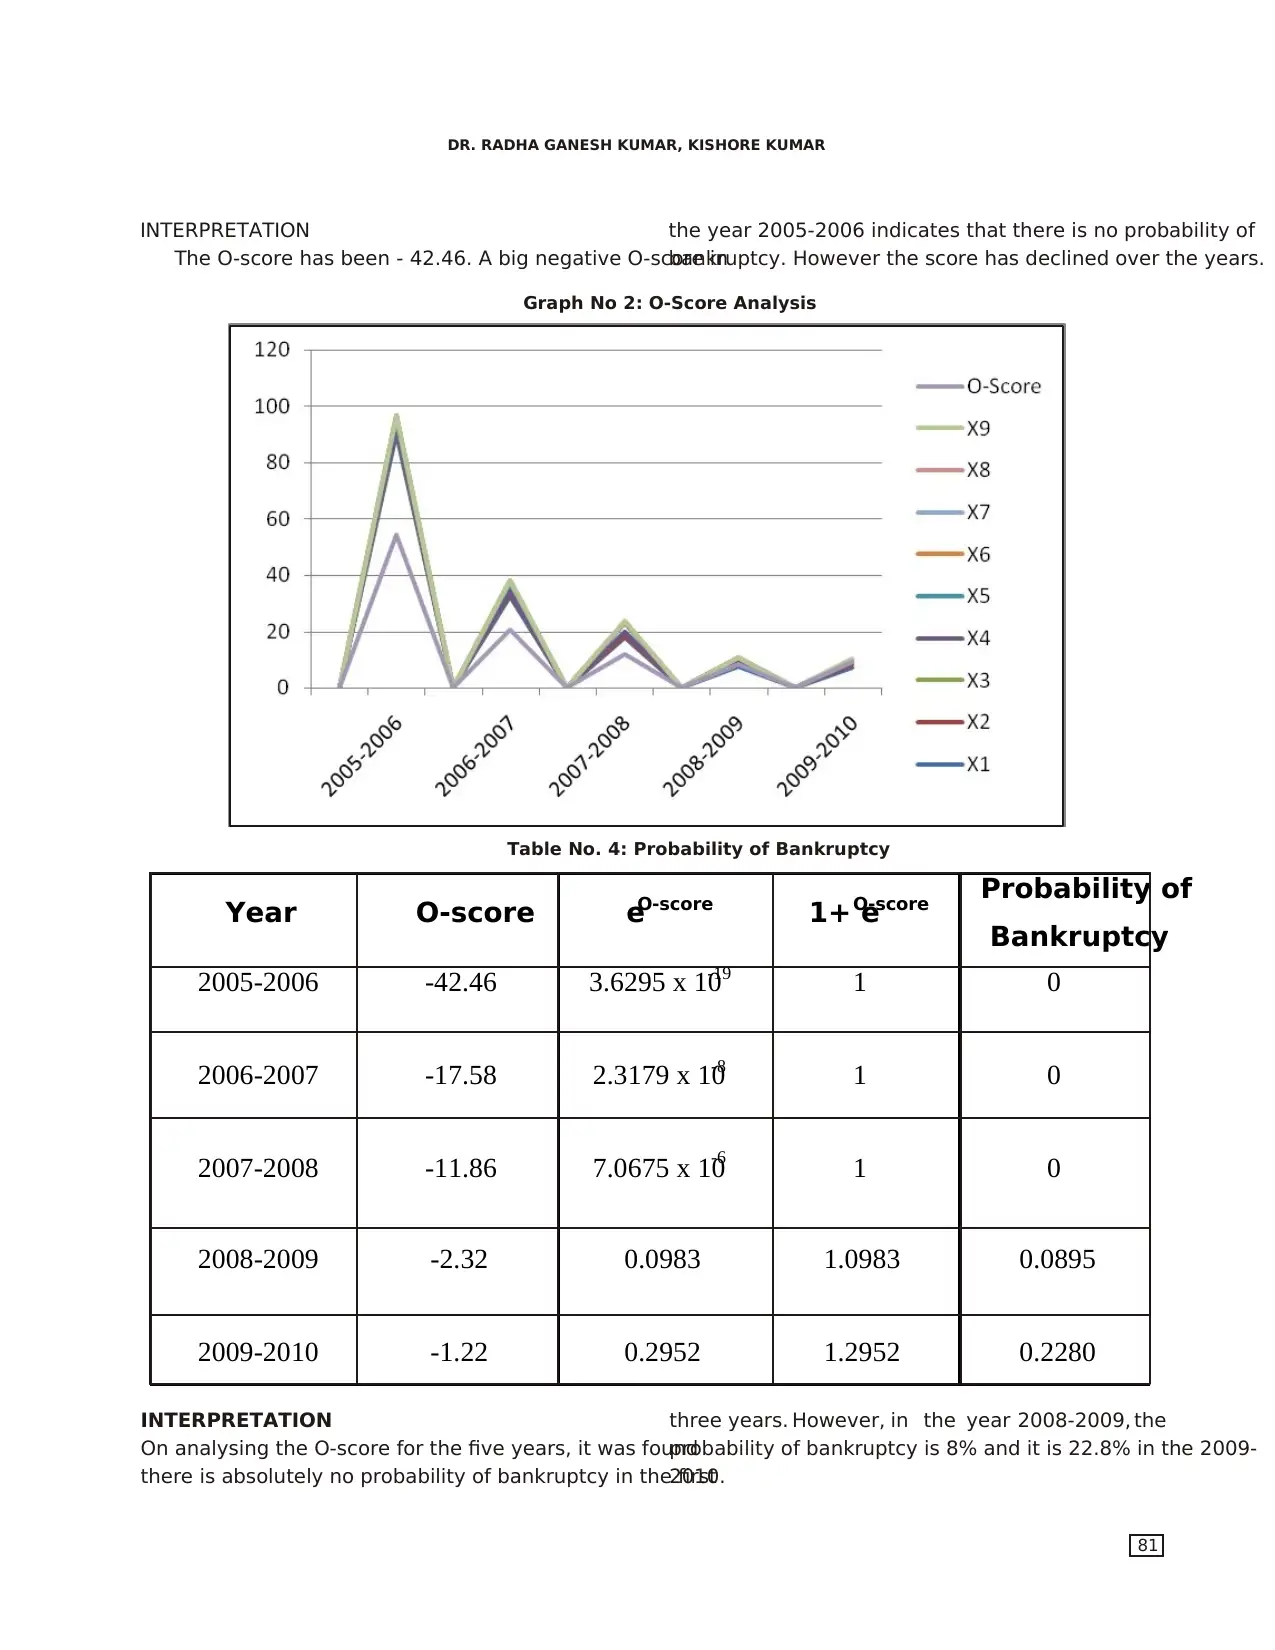
INTERPRETATION the year 2005-2006 indicates that there is no probability of
The O-score has been - 42.46. A big negative O-score inbankruptcy. However the score has declined over the years.
Graph No 2: O-Score Analysis
Year O-score eO-score 1+ eO-score Probability of
Bankruptcy
2005-2006
2006-2007
2007-2008
2008-2009
2009-2010
-42.46
-17.58
-11.86
-2.32
-1.22
3.6295 x 10⁻¹⁹
2.3179 x 10⁻⁸
7.0675 x 10
-6
0.0983
0.2952
1
1
1
1.0983
1.2952
0
0
0
0.0895
0.2280
Table No. 4: Probability of Bankruptcy
INTERPRETATION three years. However, in the year 2008-2009, the
On analysing the O-score for the five years, it was foundprobability of bankruptcy is 8% and it is 22.8% in the 2009-
there is absolutely no probability of bankruptcy in the first2010.
DR. RADHA GANESH KUMAR, KISHORE KUMAR
81
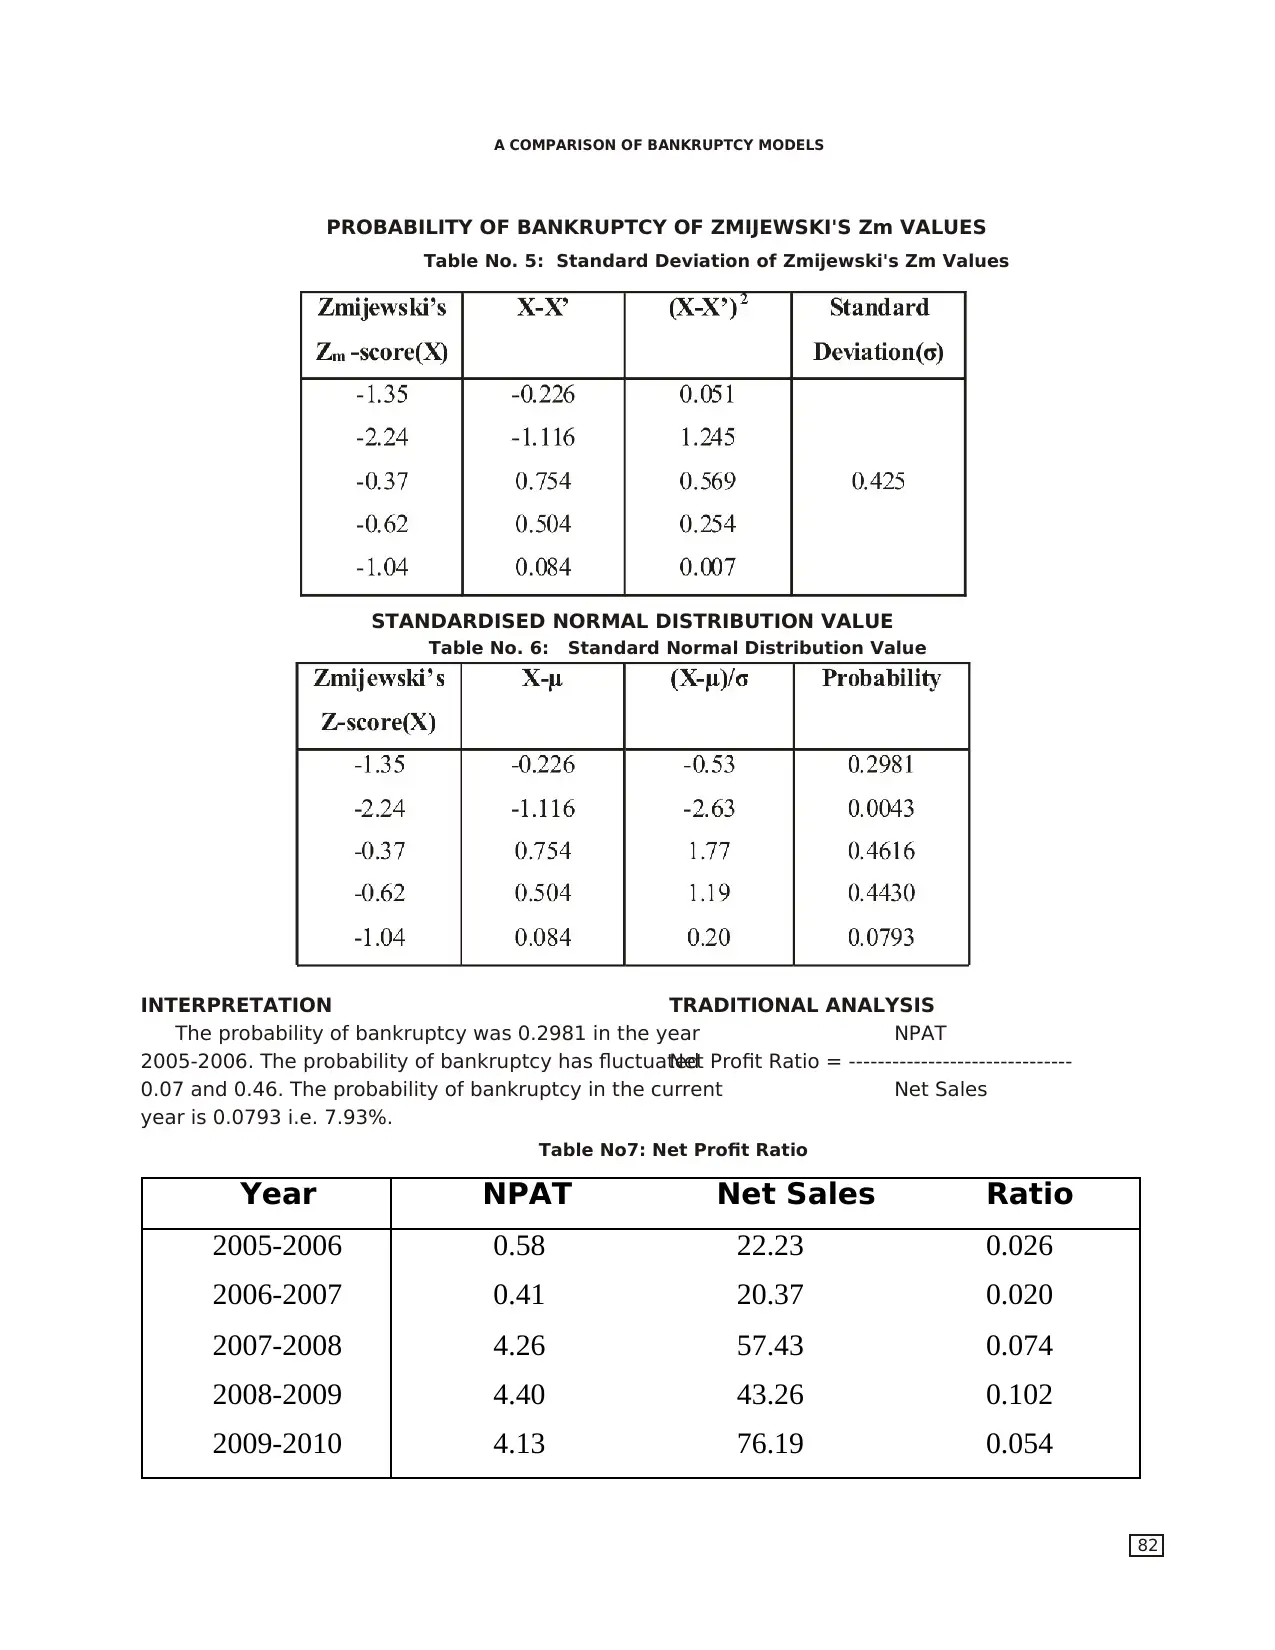
INTERPRETATION TRADITIONAL ANALYSIS
The probability of bankruptcy was 0.2981 in the year NPAT
2005-2006. The probability of bankruptcy has fluctuatedNet Profit Ratio = -------------------------------
0.07 and 0.46. The probability of bankruptcy in the current Net Sales
year is 0.0793 i.e. 7.93%.
PROBABILITY OF BANKRUPTCY OF ZMIJEWSKI'S Zm VALUES
Table No. 5: Standard Deviation of Zmijewski's Zm Values
STANDARDISED NORMAL DISTRIBUTION VALUE
Table No. 6: Standard Normal Distribution Value
Year NPAT Net Sales Ratio
2005-2006
2006-2007
2007-2008
2008-2009
2009-2010
0.58
0.41
4.26
4.40
4.13
22.23
20.37
57.43
43.26
76.19
0.026
0.020
0.074
0.102
0.054
Table No7: Net Profit Ratio
A COMPARISON OF BANKRUPTCY MODELS
82
Paraphrase This Document
Need a fresh take? Get an instant paraphrase of this document with our AI Paraphraser
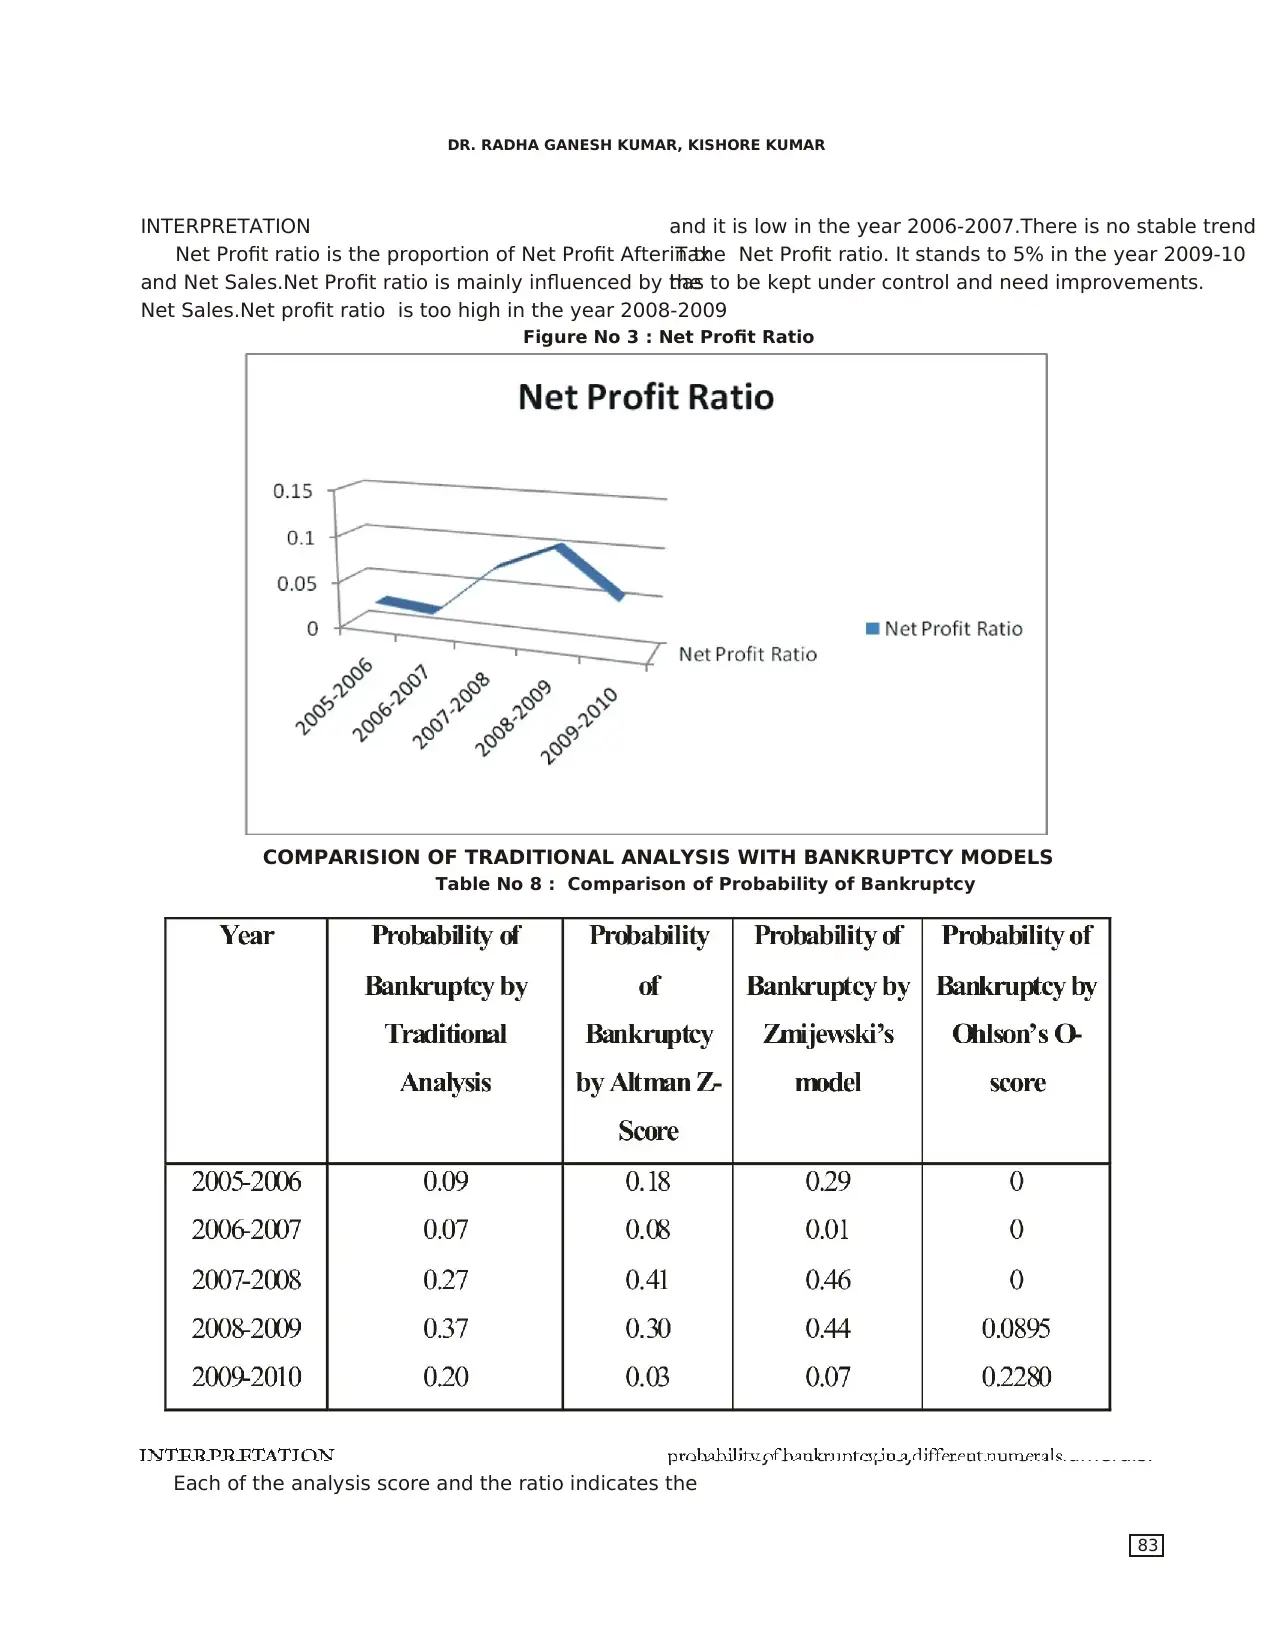
INTERPRETATION and it is low in the year 2006-2007.There is no stable trend
Net Profit ratio is the proportion of Net Profit After Taxin the Net Profit ratio. It stands to 5% in the year 2009-10
and Net Sales.Net Profit ratio is mainly influenced by thehas to be kept under control and need improvements.
Net Sales.Net profit ratio is too high in the year 2008-2009
INTERPRETATION probability of bankruptcy in a different numerals.
Each of the analysis score and the ratio indicates the
Figure No 3 : Net Profit Ratio
COMPARISION OF TRADITIONAL ANALYSIS WITH BANKRUPTCY MODELS
Table No 8 : Comparison of Probability of Bankruptcy
DR. RADHA GANESH KUMAR, KISHORE KUMAR
83
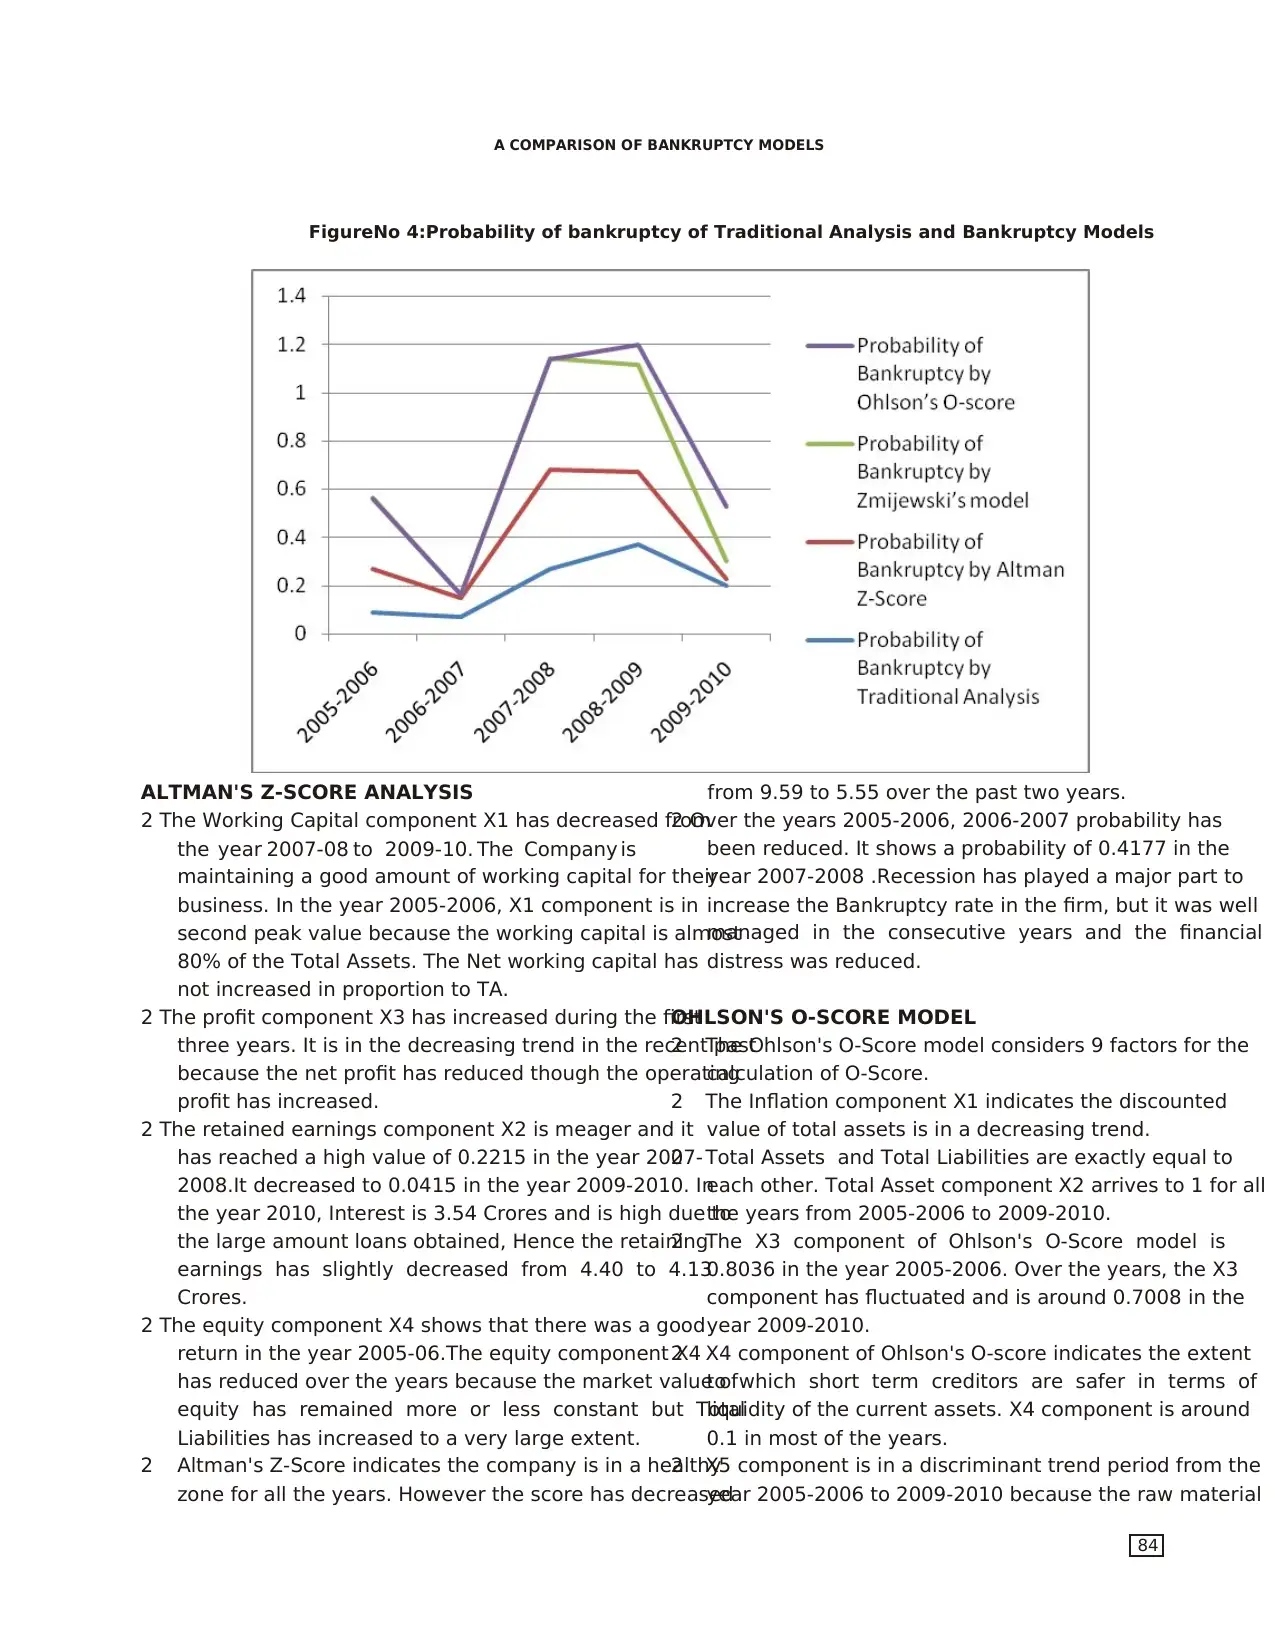
ALTMAN'S Z-SCORE ANALYSIS from 9.59 to 5.55 over the past two years.
2 The Working Capital component X1 has decreased from2 Over the years 2005-2006, 2006-2007 probability has
the year 2007-08 to 2009-10. The Company is been reduced. It shows a probability of 0.4177 in the
maintaining a good amount of working capital for theiryear 2007-2008 .Recession has played a major part to
business. In the year 2005-2006, X1 component is in increase the Bankruptcy rate in the firm, but it was well
second peak value because the working capital is almostmanaged in the consecutive years and the financial
80% of the Total Assets. The Net working capital has distress was reduced.
not increased in proportion to TA.
2 The profit component X3 has increased during the firstOHLSON'S O-SCORE MODEL
The Ohlson's O-Score model considers 9 factors for thethree years. It is in the decreasing trend in the recent past2
calculation of O-Score.because the net profit has reduced though the operating
The Inflation component X1 indicates the discountedprofit has increased. 2
value of total assets is in a decreasing trend.2 The retained earnings component X2 is meager and it
Total Assets and Total Liabilities are exactly equal tohas reached a high value of 0.2215 in the year 2007-2
each other. Total Asset component X2 arrives to 1 for all2008.It decreased to 0.0415 in the year 2009-2010. In
the years from 2005-2006 to 2009-2010.the year 2010, Interest is 3.54 Crores and is high due to
The X3 component of Ohlson's O-Score model isthe large amount loans obtained, Hence the retaining2
0.8036 in the year 2005-2006. Over the years, the X3earnings has slightly decreased from 4.40 to 4.13
component has fluctuated and is around 0.7008 in theCrores.
year 2009-2010.2 The equity component X4 shows that there was a good
X4 component of Ohlson's O-score indicates the extentreturn in the year 2005-06.The equity component X42
to which short term creditors are safer in terms ofhas reduced over the years because the market value of
liquidity of the current assets. X4 component is aroundequity has remained more or less constant but Total
0.1 in most of the years.Liabilities has increased to a very large extent.
X5 component is in a discriminant trend period from theAltman's Z-Score indicates the company is in a healthy22
year 2005-2006 to 2009-2010 because the raw materialzone for all the years. However the score has decreased
FigureNo 4:Probability of bankruptcy of Traditional Analysis and Bankruptcy Models
A COMPARISON OF BANKRUPTCY MODELS
84
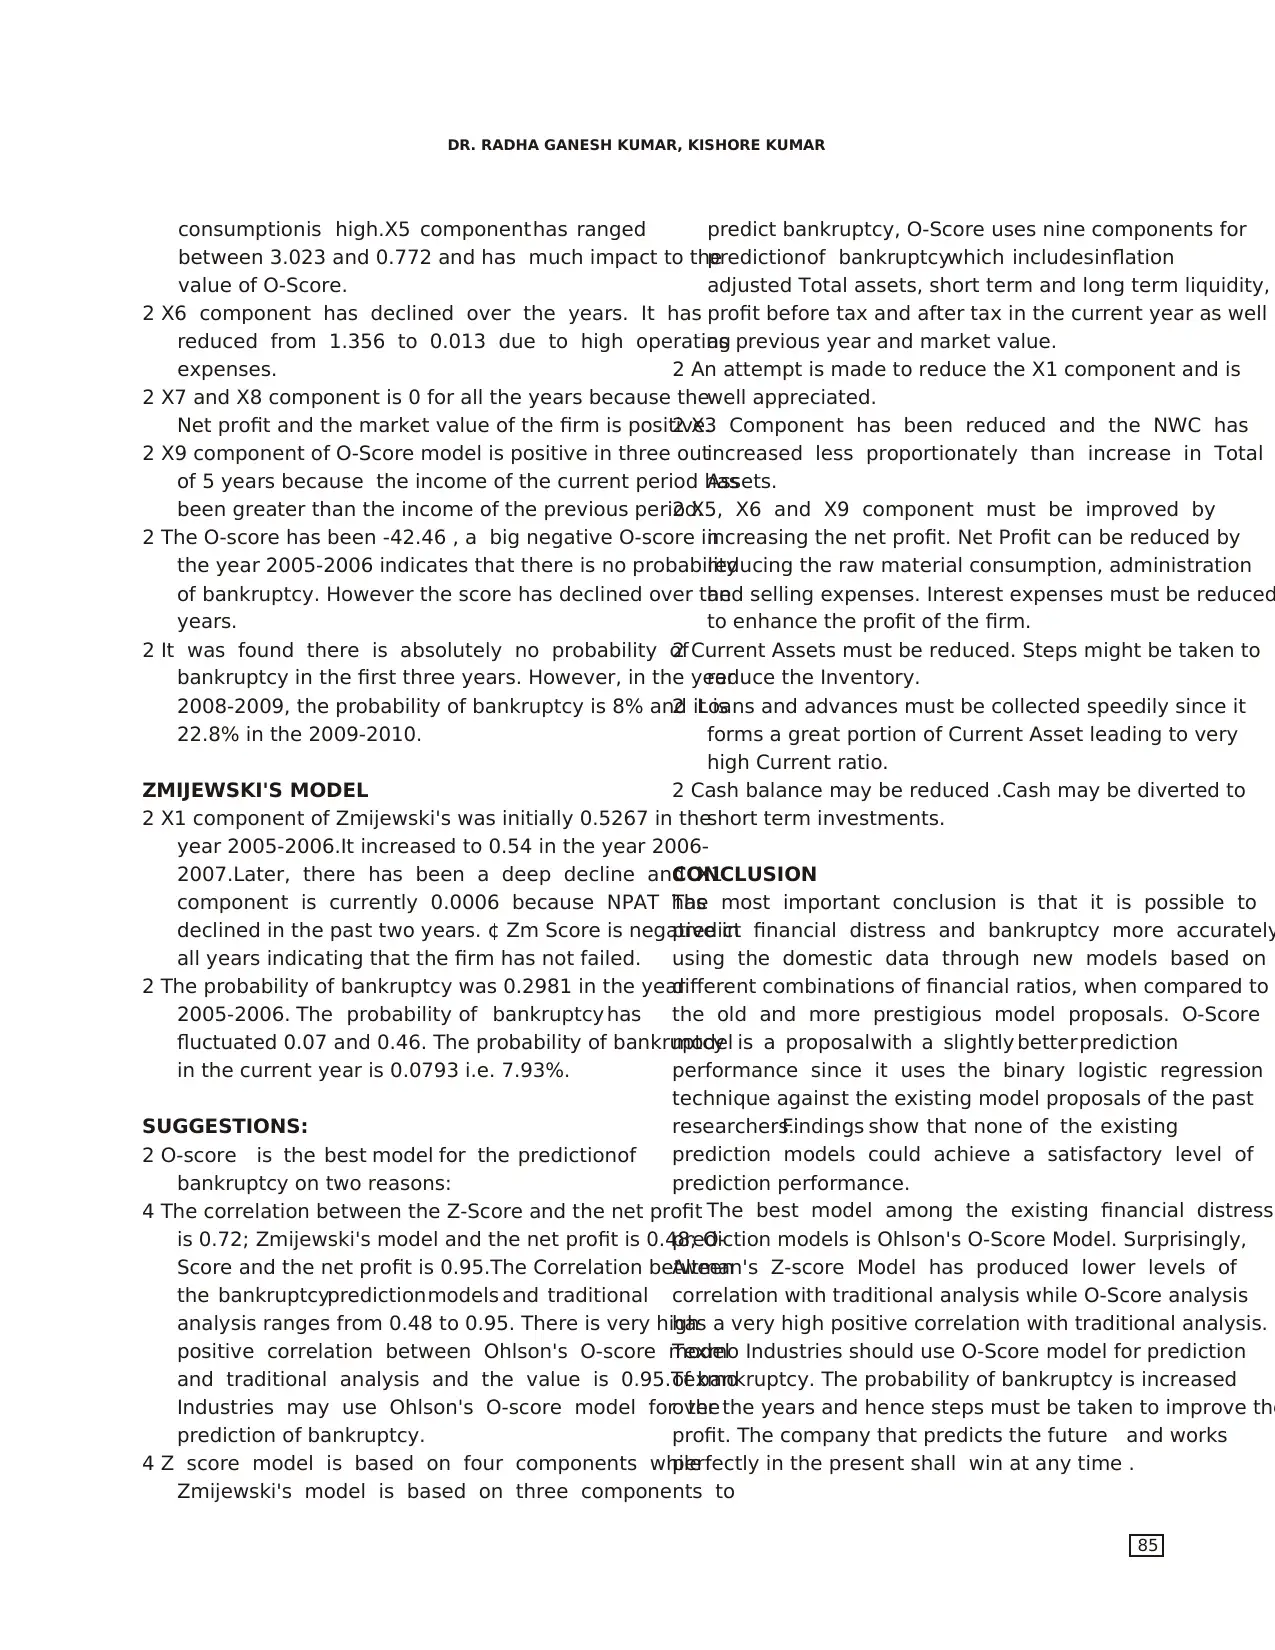
consumptionis high.X5 component has ranged predict bankruptcy, O-Score uses nine components for
between 3.023 and 0.772 and has much impact to thepredictionof bankruptcywhich includesinflation
value of O-Score. adjusted Total assets, short term and long term liquidity,
2 X6 component has declined over the years. It has profit before tax and after tax in the current year as well
reduced from 1.356 to 0.013 due to high operatingas previous year and market value.
expenses. 2 An attempt is made to reduce the X1 component and is
2 X7 and X8 component is 0 for all the years because thewell appreciated.
Net profit and the market value of the firm is positive.2 X3 Component has been reduced and the NWC has
2 X9 component of O-Score model is positive in three outincreased less proportionately than increase in Total
of 5 years because the income of the current period hasAssets.
been greater than the income of the previous period.2 X5, X6 and X9 component must be improved by
2 The O-score has been -42.46 , a big negative O-score inincreasing the net profit. Net Profit can be reduced by
the year 2005-2006 indicates that there is no probabilityreducing the raw material consumption, administration
of bankruptcy. However the score has declined over theand selling expenses. Interest expenses must be reduced
years. to enhance the profit of the firm.
2 It was found there is absolutely no probability of2 Current Assets must be reduced. Steps might be taken to
bankruptcy in the first three years. However, in the yearreduce the Inventory.
2008-2009, the probability of bankruptcy is 8% and it is2 Loans and advances must be collected speedily since it
22.8% in the 2009-2010. forms a great portion of Current Asset leading to very
high Current ratio.
ZMIJEWSKI'S MODEL 2 Cash balance may be reduced .Cash may be diverted to
2 X1 component of Zmijewski's was initially 0.5267 in theshort term investments.
year 2005-2006.It increased to 0.54 in the year 2006-
2007.Later, there has been a deep decline and X1CONCLUSION
component is currently 0.0006 because NPAT hasThe most important conclusion is that it is possible to
declined in the past two years. ¢ Zm Score is negative inpredict financial distress and bankruptcy more accurately
all years indicating that the firm has not failed. using the domestic data through new models based on
2 The probability of bankruptcy was 0.2981 in the yeardifferent combinations of financial ratios, when compared to
2005-2006. The probability of bankruptcy has the old and more prestigious model proposals. O-Score
fluctuated 0.07 and 0.46. The probability of bankruptcymodel is a proposalwith a slightly better prediction
in the current year is 0.0793 i.e. 7.93%. performance since it uses the binary logistic regression
technique against the existing model proposals of the past
SUGGESTIONS: researchers.Findings show that none of the existing
2 O-score is the best model for the predictionof prediction models could achieve a satisfactory level of
bankruptcy on two reasons: prediction performance.
4 The correlation between the Z-Score and the net profit The best model among the existing financial distress
is 0.72; Zmijewski's model and the net profit is 0.48; O-prediction models is Ohlson's O-Score Model. Surprisingly,
Score and the net profit is 0.95.The Correlation betweenAltman's Z-score Model has produced lower levels of
the bankruptcyprediction models and traditional correlation with traditional analysis while O-Score analysis
analysis ranges from 0.48 to 0.95. There is very highhas a very high positive correlation with traditional analysis.
positive correlation between Ohlson's O-score modelTexmo Industries should use O-Score model for prediction
and traditional analysis and the value is 0.95.Texmoof bankruptcy. The probability of bankruptcy is increased
Industries may use Ohlson's O-score model for theover the years and hence steps must be taken to improve the
prediction of bankruptcy. profit. The company that predicts the future and works
4 Z score model is based on four components whileperfectly in the present shall win at any time .
Zmijewski's model is based on three components to
DR. RADHA GANESH KUMAR, KISHORE KUMAR
85
Secure Best Marks with AI Grader
Need help grading? Try our AI Grader for instant feedback on your assignments.
BIBLIOGRAPHY 14. Pandey. I.M., Financial Management, 10th Ed., New
1. Altman, Edward I. (1968). Financial Ratios, Delhi: McGraw-Hill Publishing Co. Ltd.,1998
Discriminant Analysis, and Prediction of Corporate
Bankruptcy, Journal of Finance, Vol. 4, 1968, pp. 589 -
609
2. Altman, Edward I. (1993). Corporate Financial
Distress: A Complete Guide to Predicting, Avoiding,
and Dealing with Bankruptcy, 1st Edition, New York:
John Wiley and Sons.
3. Altman, Edward, R. Haldeman, and P. Narayanan.
(1977). ZETA Analysis: A New Model to Identify
Bankruptcy Risk of Corporations, Journal of Banking
and Finance, March, pp. 29 - 54
4. Argenti, J. (1991). PredictingCorporate Failure,
Accountants Digest, Vol. 138, p. 3
5. Beaver,William H. (1966). Financial Ratios as
Predictors of Failures, Journal of Accounting
Researchpp.71 - 111
6. Deakin, Edward B. (1972). A Discriminant Analysis of
Predictors of Business Failure, Journal of Accounting
Research, Vol. 10, No. 1, pp. 167 - 179
7. Keasey,K. and Robert Watson (1991). Financial
Distress Prediction Models: A Review of Their
Usefulness, British Journal of Management, Vol 2, pp.
89 - 102
8. Maddala, G.S. (2004). Introduction to Econometrics,
3rd Edition, Wiley, New York,
9. Ohlson, James A. (1980). Financial Ratios and the
Probabilistic Prediction of Bankruptcy, Journal of
Accounting Research, Vol. 18, No.1, pp. 109 - 131
10. Scott, J. (1981). The Probability of Bankruptcy: A
Comparison of Empirical Predictions and Theoretical
Models, Journal of Banking and Finance, Summer, pp.
317 - 344
11. Zavgren, Christine (1985). Assessing the Vulnerability
to Failure of American industrial Firms: A Logistic
Analysis, Journal of Business Finance & Accounting,
Vol. 12, No. 1, pp. 19 - 45
12. Zmijewski, Mark E. (1984). Methodological Issues
Related to the Estimation of Financial Distress
Prediction Models, Journal of Accounting Research,
Vol. 22 Supplement, pp. 59 - 82 Anadolu
ÜniversitesiSosyal Bilimler Dergisi
13. Khan M.Y and Jain P.K., Financial Management Text
and Problems, 3rd Edition, New Delhi: Tata McGraw-
Hill Publishing Co.Ltd. 1999.
A COMPARISON OF BANKRUPTCY MODELS
86
1 out of 11
Related Documents


Your All-in-One AI-Powered Toolkit for Academic Success.
+13062052269
info@desklib.com
Available 24*7 on WhatsApp / Email
![[object Object]](/_next/static/media/star-bottom.7253800d.svg)
Unlock your academic potential
© 2024 | Zucol Services PVT LTD | All rights reserved.