A Comparative Analysis of Trade Openness between Sweden and Italy
VerifiedAdded on 2023/04/21
|17
|3082
|131
AI Summary
This article provides a comparative analysis of trade openness between Sweden and Italy, examining the trade openness trends and their correlation with income inequality. It also discusses the Stolper-Samuelson theorem and its implications for the two countries.
Contribute Materials
Your contribution can guide someone’s learning journey. Share your
documents today.
Running head: INTERNATIONAL TRADE
INTERNATIONAL TRADE
Name of the Student
Name of the University
Author note
INTERNATIONAL TRADE
Name of the Student
Name of the University
Author note
Secure Best Marks with AI Grader
Need help grading? Try our AI Grader for instant feedback on your assignments.
1INTERNATIONAL TRADE
Table of Contents
Headline.....................................................................................................................................2
Data analysis..............................................................................................................................2
Step 4: Technical analysis..........................................................................................................8
Answer a)...............................................................................................................................8
Answer b)...............................................................................................................................9
Answer c).............................................................................................................................10
Answer d).............................................................................................................................10
Answer e).............................................................................................................................10
Reference list............................................................................................................................11
2INTERNATIONAL TRADE
Headline
A comparative analysis between the Trade Openness of Sweden and Italy
Data analysis
Step 1
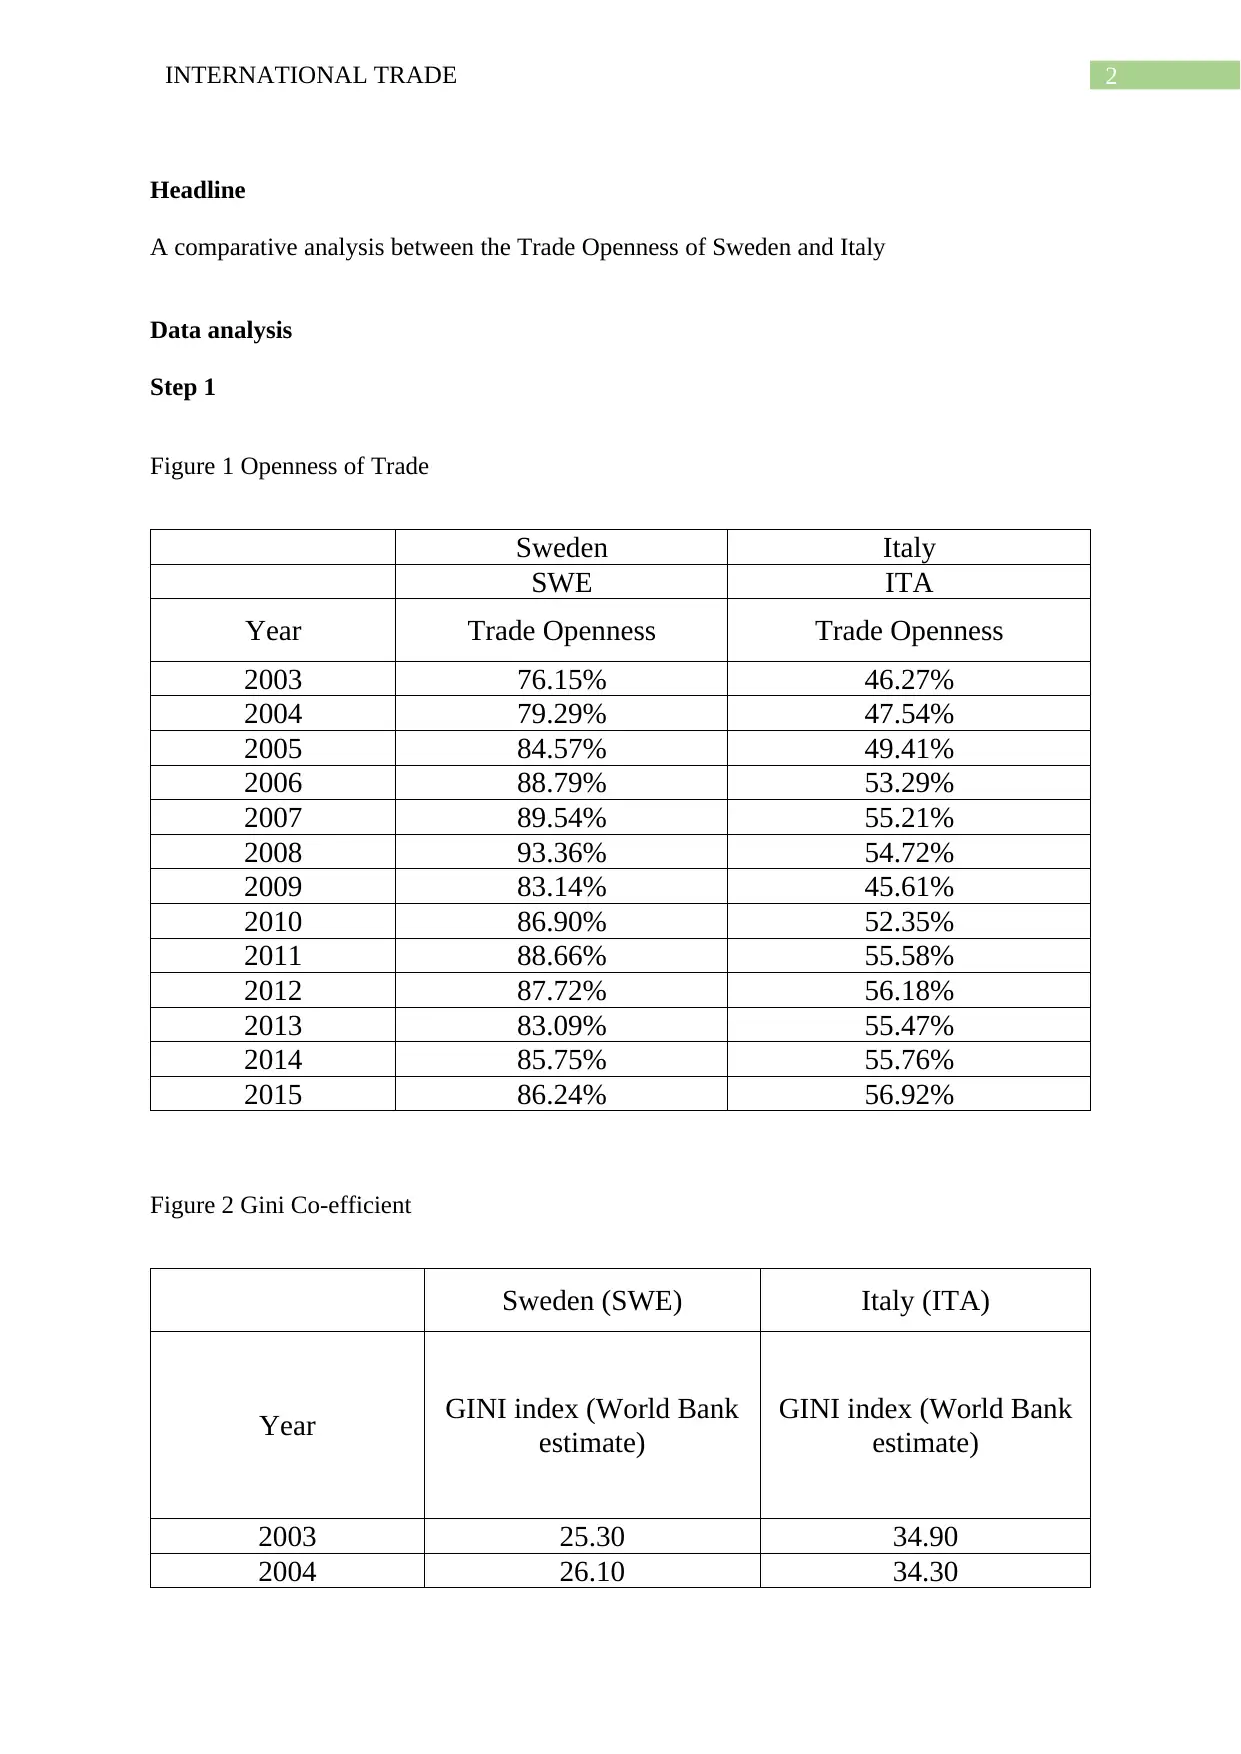
Figure 1 Openness of Trade
Sweden Italy
SWE ITA
Year Trade Openness Trade Openness
2003 76.15% 46.27%
2004 79.29% 47.54%
2005 84.57% 49.41%
2006 88.79% 53.29%
2007 89.54% 55.21%
2008 93.36% 54.72%
2009 83.14% 45.61%
2010 86.90% 52.35%
2011 88.66% 55.58%
2012 87.72% 56.18%
2013 83.09% 55.47%
2014 85.75% 55.76%
2015 86.24% 56.92%
Figure 2 Gini Co-efficient
Sweden (SWE) Italy (ITA)
Year GINI index (World Bank
estimate)
GINI index (World Bank
estimate)
2003 25.30 34.90
2004 26.10 34.30
Headline
A comparative analysis between the Trade Openness of Sweden and Italy
Data analysis
Step 1
Figure 1 Openness of Trade
Sweden Italy
SWE ITA
Year Trade Openness Trade Openness
2003 76.15% 46.27%
2004 79.29% 47.54%
2005 84.57% 49.41%
2006 88.79% 53.29%
2007 89.54% 55.21%
2008 93.36% 54.72%
2009 83.14% 45.61%
2010 86.90% 52.35%
2011 88.66% 55.58%
2012 87.72% 56.18%
2013 83.09% 55.47%
2014 85.75% 55.76%
2015 86.24% 56.92%
Figure 2 Gini Co-efficient
Sweden (SWE) Italy (ITA)
Year GINI index (World Bank
estimate)
GINI index (World Bank
estimate)
2003 25.30 34.90
2004 26.10 34.30
3INTERNATIONAL TRADE
2005 26.80 33.80
2006 26.40 33.70
2007 27.10 32.90
2008 28.10 33.80
2009 27.30 33.80
2010 27.70 34.70
2011 27.60 35.10
2012 27.60 35.20
2013 28.80 34.90
2014 28.40 34.70
2015 29.20 35.40
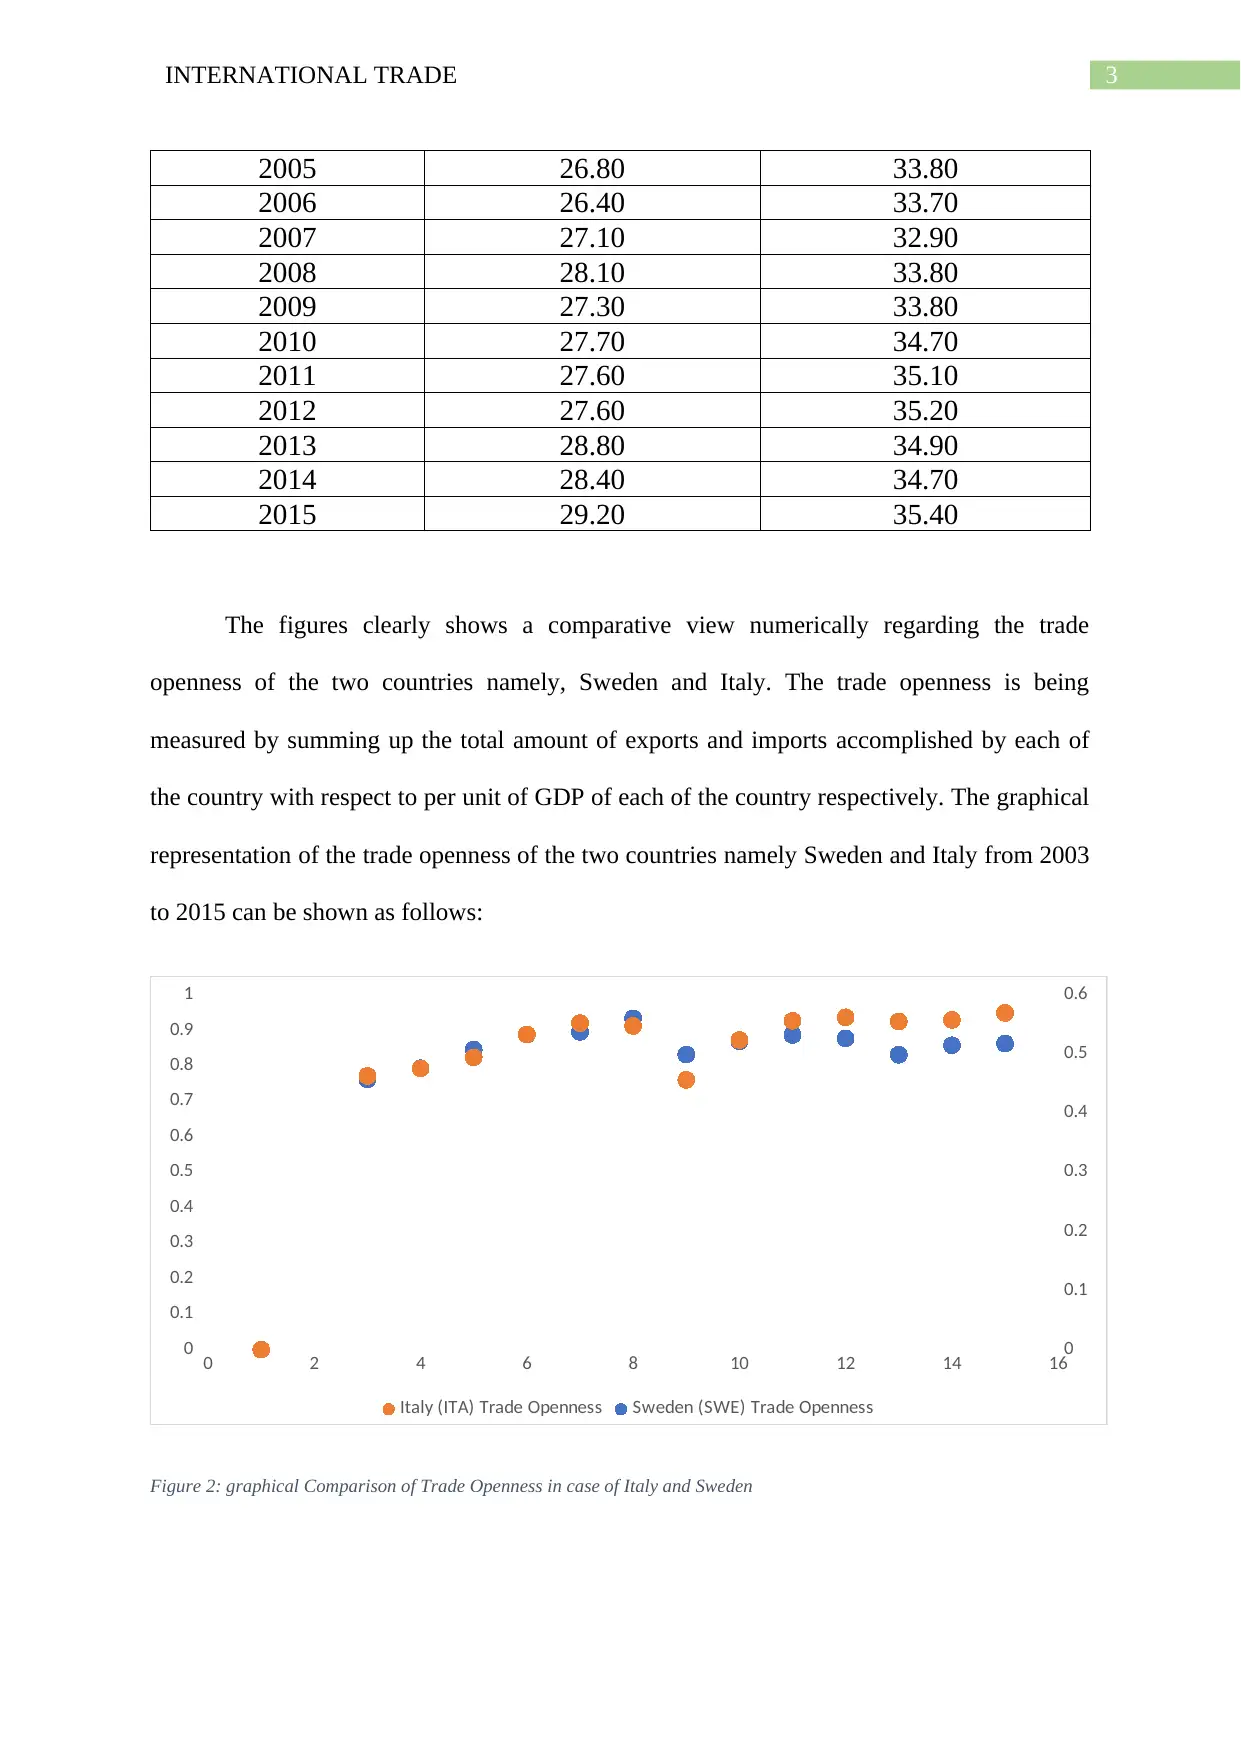
The figures clearly shows a comparative view numerically regarding the trade
openness of the two countries namely, Sweden and Italy. The trade openness is being
measured by summing up the total amount of exports and imports accomplished by each of
the country with respect to per unit of GDP of each of the country respectively. The graphical
representation of the trade openness of the two countries namely Sweden and Italy from 2003
to 2015 can be shown as follows:
0 2 4 6 8 10 12 14 160
0.1
0.2
0.3
0.4
0.5
0.6
0
0.1
0.2
0.3
0.4
0.5
0.6
0.7
0.8
0.9
1
Italy (ITA) Trade Openness Sweden (SWE) Trade Openness
Figure 2: graphical Comparison of Trade Openness in case of Italy and Sweden
2005 26.80 33.80
2006 26.40 33.70
2007 27.10 32.90
2008 28.10 33.80
2009 27.30 33.80
2010 27.70 34.70
2011 27.60 35.10
2012 27.60 35.20
2013 28.80 34.90
2014 28.40 34.70
2015 29.20 35.40
The figures clearly shows a comparative view numerically regarding the trade
openness of the two countries namely, Sweden and Italy. The trade openness is being
measured by summing up the total amount of exports and imports accomplished by each of
the country with respect to per unit of GDP of each of the country respectively. The graphical
representation of the trade openness of the two countries namely Sweden and Italy from 2003
to 2015 can be shown as follows:
0 2 4 6 8 10 12 14 160
0.1
0.2
0.3
0.4
0.5
0.6
0
0.1
0.2
0.3
0.4
0.5
0.6
0.7
0.8
0.9
1
Italy (ITA) Trade Openness Sweden (SWE) Trade Openness
Figure 2: graphical Comparison of Trade Openness in case of Italy and Sweden
Secure Best Marks with AI Grader
Need help grading? Try our AI Grader for instant feedback on your assignments.
4INTERNATIONAL TRADE
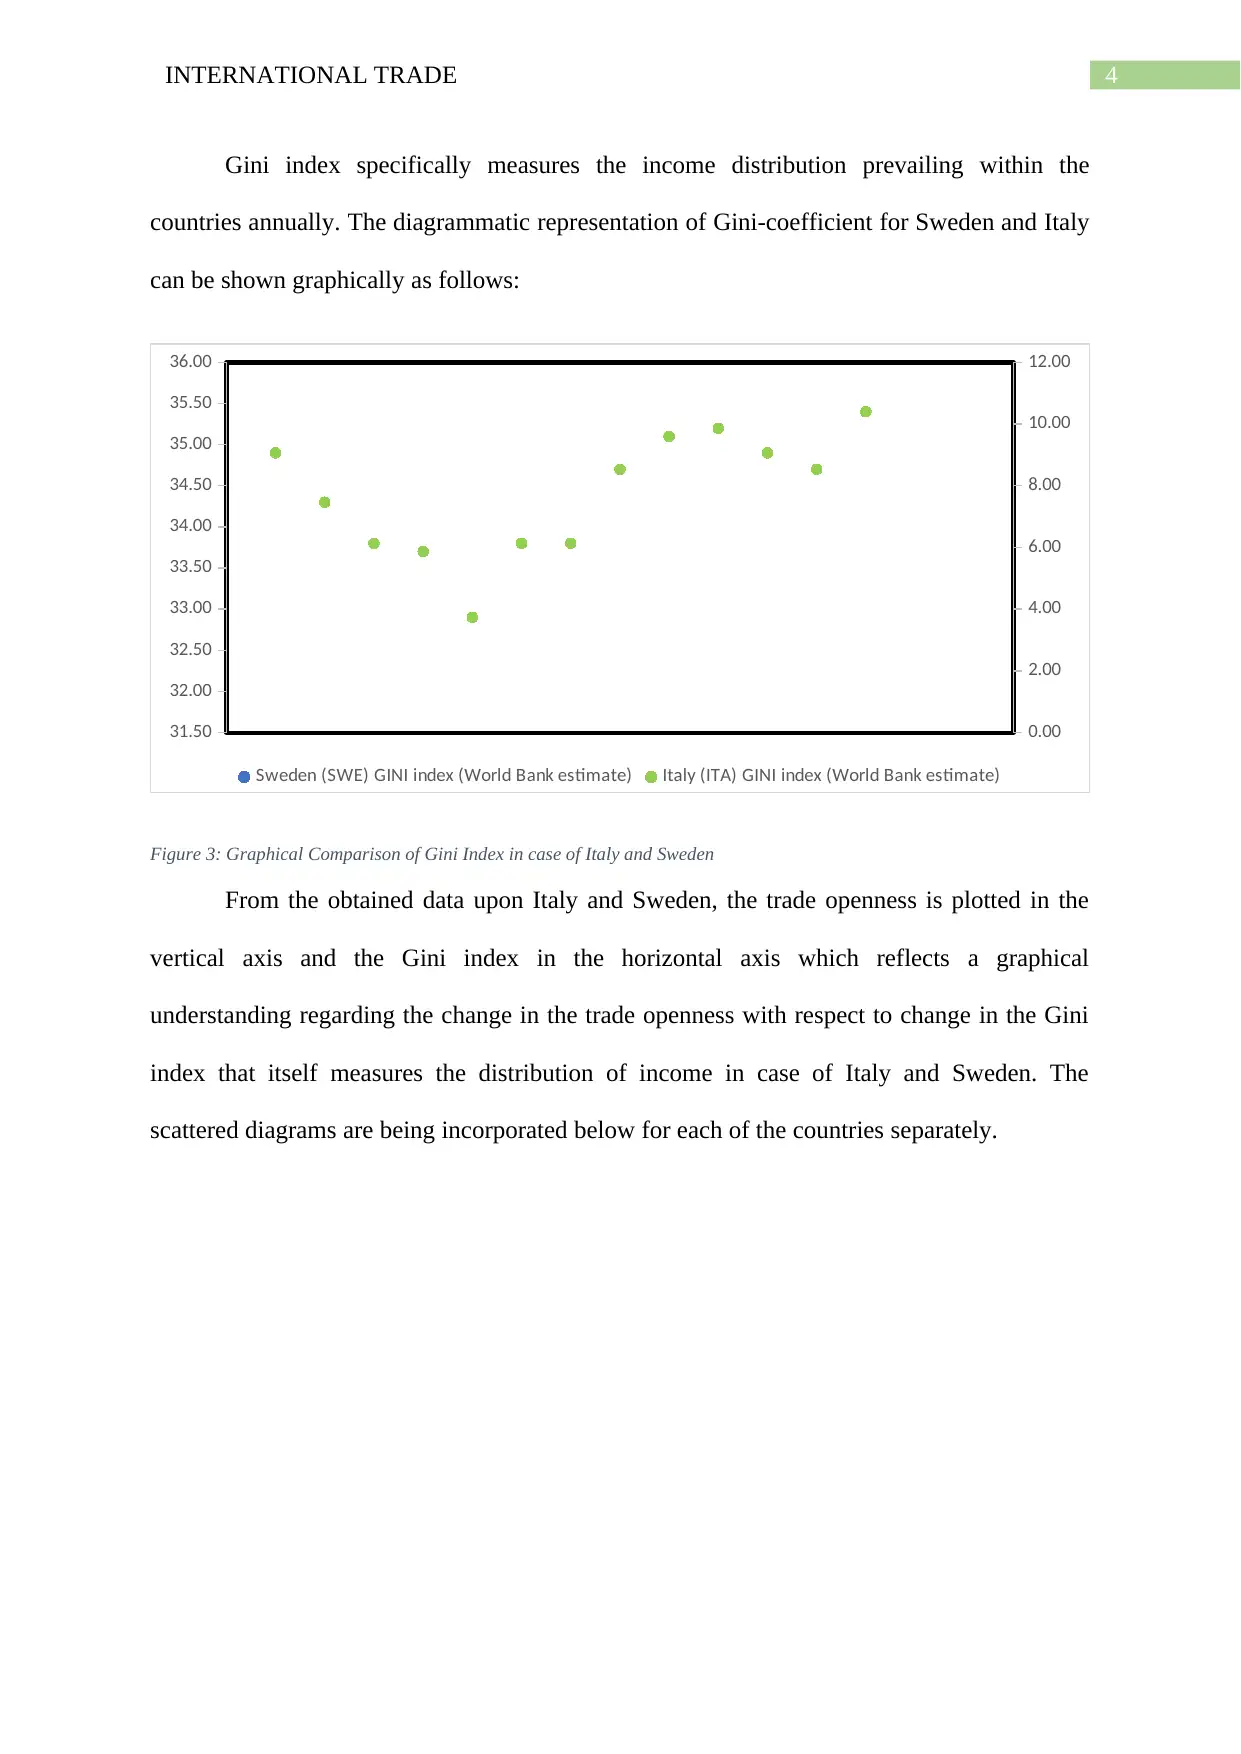
Gini index specifically measures the income distribution prevailing within the
countries annually. The diagrammatic representation of Gini-coefficient for Sweden and Italy
can be shown graphically as follows:
0.00
2.00
4.00
6.00
8.00
10.00
12.00
31.50
32.00
32.50
33.00
33.50
34.00
34.50
35.00
35.50
36.00
Sweden (SWE) GINI index (World Bank estimate) Italy (ITA) GINI index (World Bank estimate)
Figure 3: Graphical Comparison of Gini Index in case of Italy and Sweden
From the obtained data upon Italy and Sweden, the trade openness is plotted in the
vertical axis and the Gini index in the horizontal axis which reflects a graphical
understanding regarding the change in the trade openness with respect to change in the Gini
index that itself measures the distribution of income in case of Italy and Sweden. The
scattered diagrams are being incorporated below for each of the countries separately.

5INTERNATIONAL TRADE
0 2 4 6 8 10 12 14
23
24
25
26
27
28
29
30
0
0.1
0.2
0.3
0.4
0.5
0.6
0.7
0.8
0.9
1
Gini-Sweden Sweden Trade Openness
Figure 4: Gini index versus trade Openness of Sweden
0 2 4 6 8 10 12 14
31.5
32
32.5
33
33.5
34
34.5
35
35.5
36
0
0.1
0.2
0.3
0.4
0.5
0.6
Gini-Italy Italy Trade Openness
Figure 5: Gini Index versus trade Openness of Italy
It is been seen that with respect to rise in the income inequality as the Gini-coefficient
has been raised over time, the trade openness has not deviated much in case of Sweden.
However, in case of Italy it is been seen that, with the fall in the value of Gini-coefficient, the
Trade openness has increased overtime and when Gini-coefficient or income distribution
became unequal within the population, then the Trade openness have declined in value. Here
it is seen that Sweden have an absolute advantage in the production of Shoes while Italy have
0 2 4 6 8 10 12 14
23
24
25
26
27
28
29
30
0
0.1
0.2
0.3
0.4
0.5
0.6
0.7
0.8
0.9
1
Gini-Sweden Sweden Trade Openness
Figure 4: Gini index versus trade Openness of Sweden
0 2 4 6 8 10 12 14
31.5
32
32.5
33
33.5
34
34.5
35
35.5
36
0
0.1
0.2
0.3
0.4
0.5
0.6
Gini-Italy Italy Trade Openness
Figure 5: Gini Index versus trade Openness of Italy
It is been seen that with respect to rise in the income inequality as the Gini-coefficient
has been raised over time, the trade openness has not deviated much in case of Sweden.
However, in case of Italy it is been seen that, with the fall in the value of Gini-coefficient, the
Trade openness has increased overtime and when Gini-coefficient or income distribution
became unequal within the population, then the Trade openness have declined in value. Here
it is seen that Sweden have an absolute advantage in the production of Shoes while Italy have
6INTERNATIONAL TRADE
no absolute advantage. However, Italy have a comparative advantage in the production of
shoes while Sweden have a comparative advantage in the production of calculators. Italy is a
more labour intensive country that faces a higher relative supply of shoes and so the relative
prices for shoe is lower. When the supply of shoes fall there will be a complementary rise in
the price of shoes. Wages of skilled labour force increases as the country is labour intensive
and exports of shoes occurs with worsening of the income inequality as the Gini coefficients
reflected in case of Italy.
Step 2.
The computed correlation coefficient between Trade openness and Gini Index is 0.49
in case of Sweden and 0.25 in case of Italy. Since Gini –coefficient is considered as a
measured of the skilled and unskilled labour too hence the value also help to understand the
impact of income inequality upon international trade. Since in case of Sweden the correlation
co-efficient is positive and more close to 1 as compared to Italy, hence with the rise in trade
openness there will be a corresponding rise in the income inequality. Hence, it is not good for
the two countries to reach a state of international trade. Trade openness provides a better
measure regarding the economic benefits acquired by any country. It is inclusive of the
technology transfer, skill transfer along with increase in factor inputs like labour and capital,
which are all together as a whole are parameters of total productivity as well as growth and
development of any country. Trade openness provides a significant view regarding the
percentage of trade with respect to the GDP off the countries in case of Sweden and Italy
(Powell. 2015). The respective values of correlation between the trade openness and Gini co-
efficient for each of the countries Sweden and Italy can be incorporated as follows:
Paraphrase This Document
Need a fresh take? Get an instant paraphrase of this document with our AI Paraphraser
7INTERNATIONAL TRADE
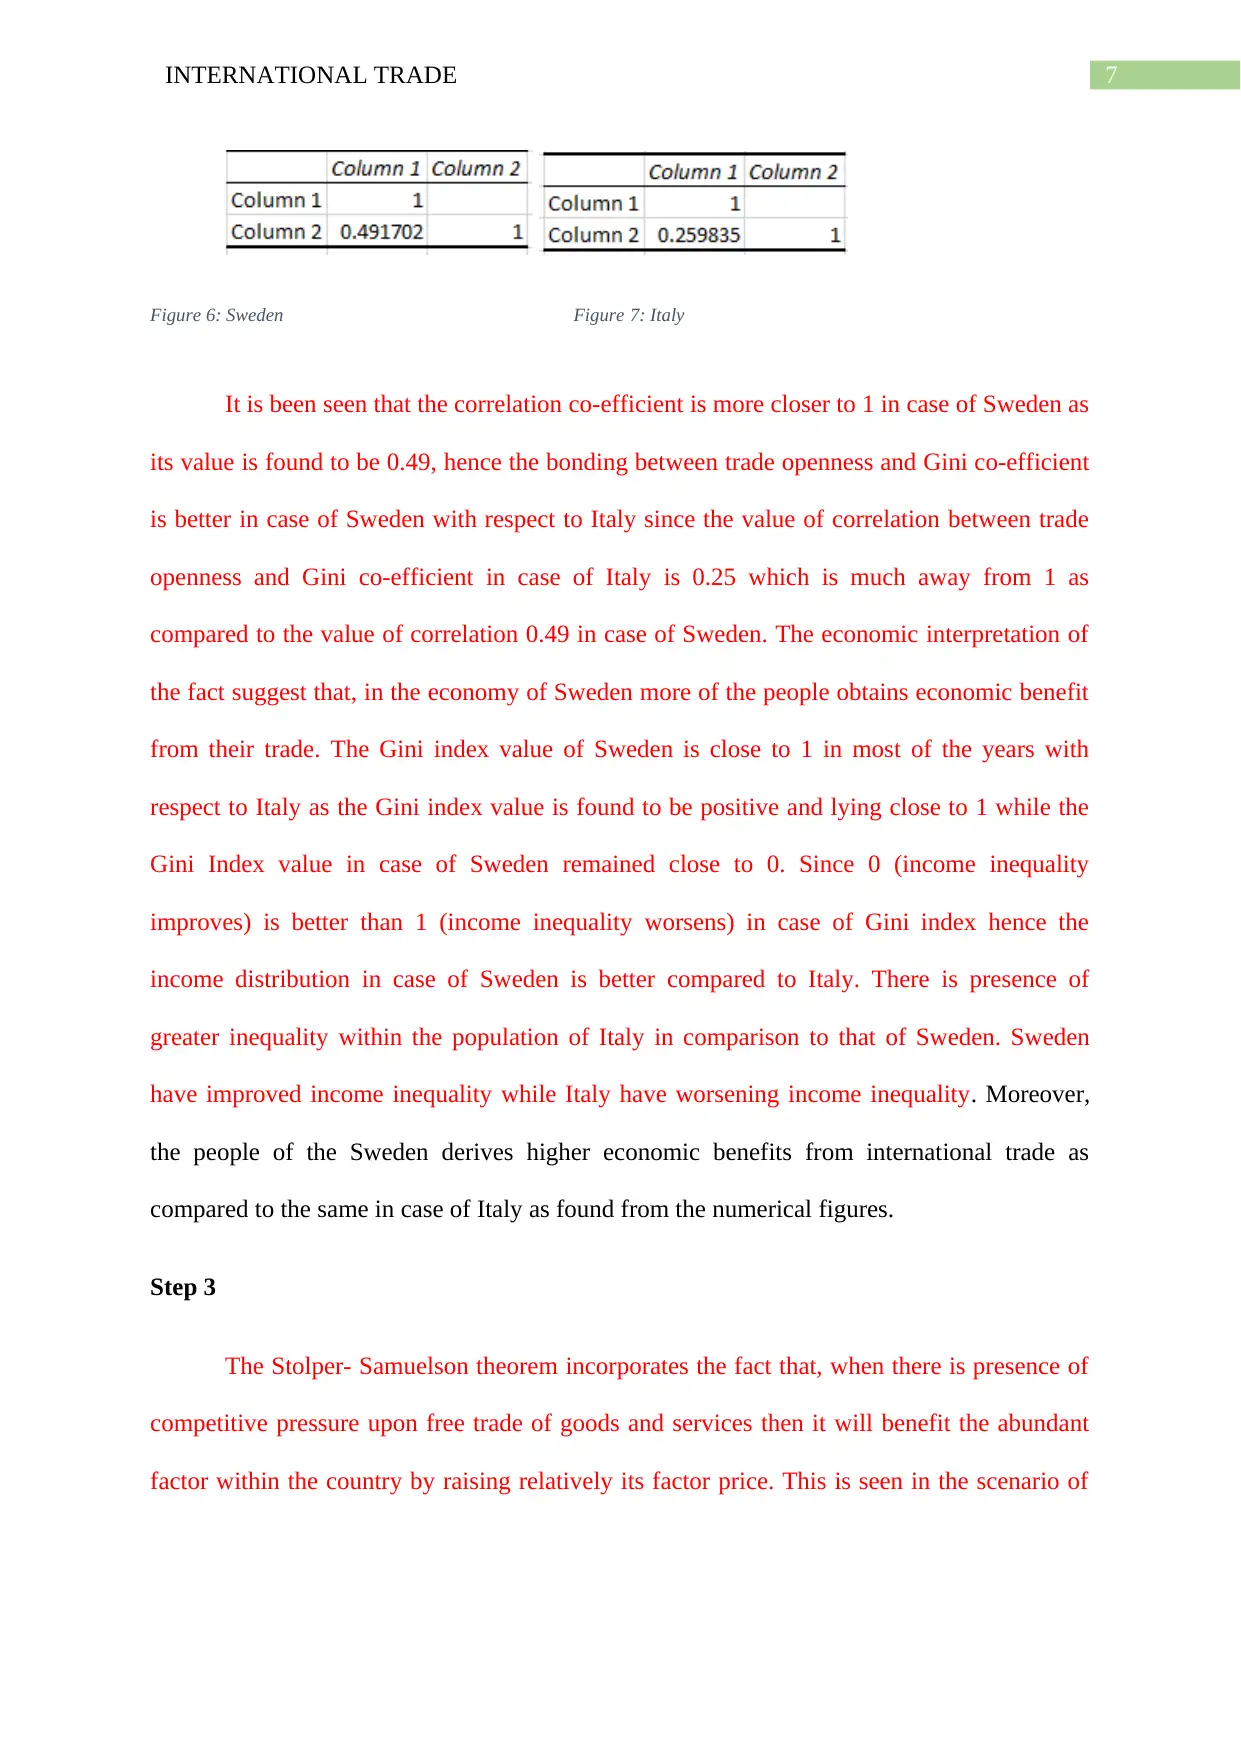
Figure 6: Sweden Figure 7: Italy
It is been seen that the correlation co-efficient is more closer to 1 in case of Sweden as
its value is found to be 0.49, hence the bonding between trade openness and Gini co-efficient
is better in case of Sweden with respect to Italy since the value of correlation between trade
openness and Gini co-efficient in case of Italy is 0.25 which is much away from 1 as
compared to the value of correlation 0.49 in case of Sweden. The economic interpretation of
the fact suggest that, in the economy of Sweden more of the people obtains economic benefit
from their trade. The Gini index value of Sweden is close to 1 in most of the years with
respect to Italy as the Gini index value is found to be positive and lying close to 1 while the
Gini Index value in case of Sweden remained close to 0. Since 0 (income inequality
improves) is better than 1 (income inequality worsens) in case of Gini index hence the
income distribution in case of Sweden is better compared to Italy. There is presence of
greater inequality within the population of Italy in comparison to that of Sweden. Sweden
have improved income inequality while Italy have worsening income inequality. Moreover,
the people of the Sweden derives higher economic benefits from international trade as
compared to the same in case of Italy as found from the numerical figures.
Step 3
The Stolper- Samuelson theorem incorporates the fact that, when there is presence of
competitive pressure upon free trade of goods and services then it will benefit the abundant
factor within the country by raising relatively its factor price. This is seen in the scenario of
8INTERNATIONAL TRADE
Sweden, that higher price of the exports has raised the return upon the factors that are used
intensively for production and these are also the abundant factors within the country.
It is been found that the results are in accordance with the Stolper- Samuelson
theorem due to the reason that, in the existing relationships between the relative factor
rewards and the relative price of output, a rise in the price of the commodity have led to
proportional rise in the return of the factor which are being used most intensively in the
production of those commodities in case of Sweden.
However, in case of Italy it is been seen that the country have not always specialized
in the production of those goods and services upon which it have greater factor endowment
for which it have faced trade deficit in the years of 2005 to 2011. After 2011 the country have
improved in terms of its trade situation along with trade liberalization followed by which it is
seen that with the fall in the value of Gini co-efficient and inequality of the income
distribution, the trade scenario has improved as per the trade ratio obtained from the data
analysis of Trade openness.
With taking under consideration that the constant return to scale exists followed by
perfect competition and equalization among the factor inputs where the factors are fully
employed in the economy of Sweden, the Stolper- Samuelson theorem holds generating
welfare within the economic condition of both the countries.
9INTERNATIONAL TRADE
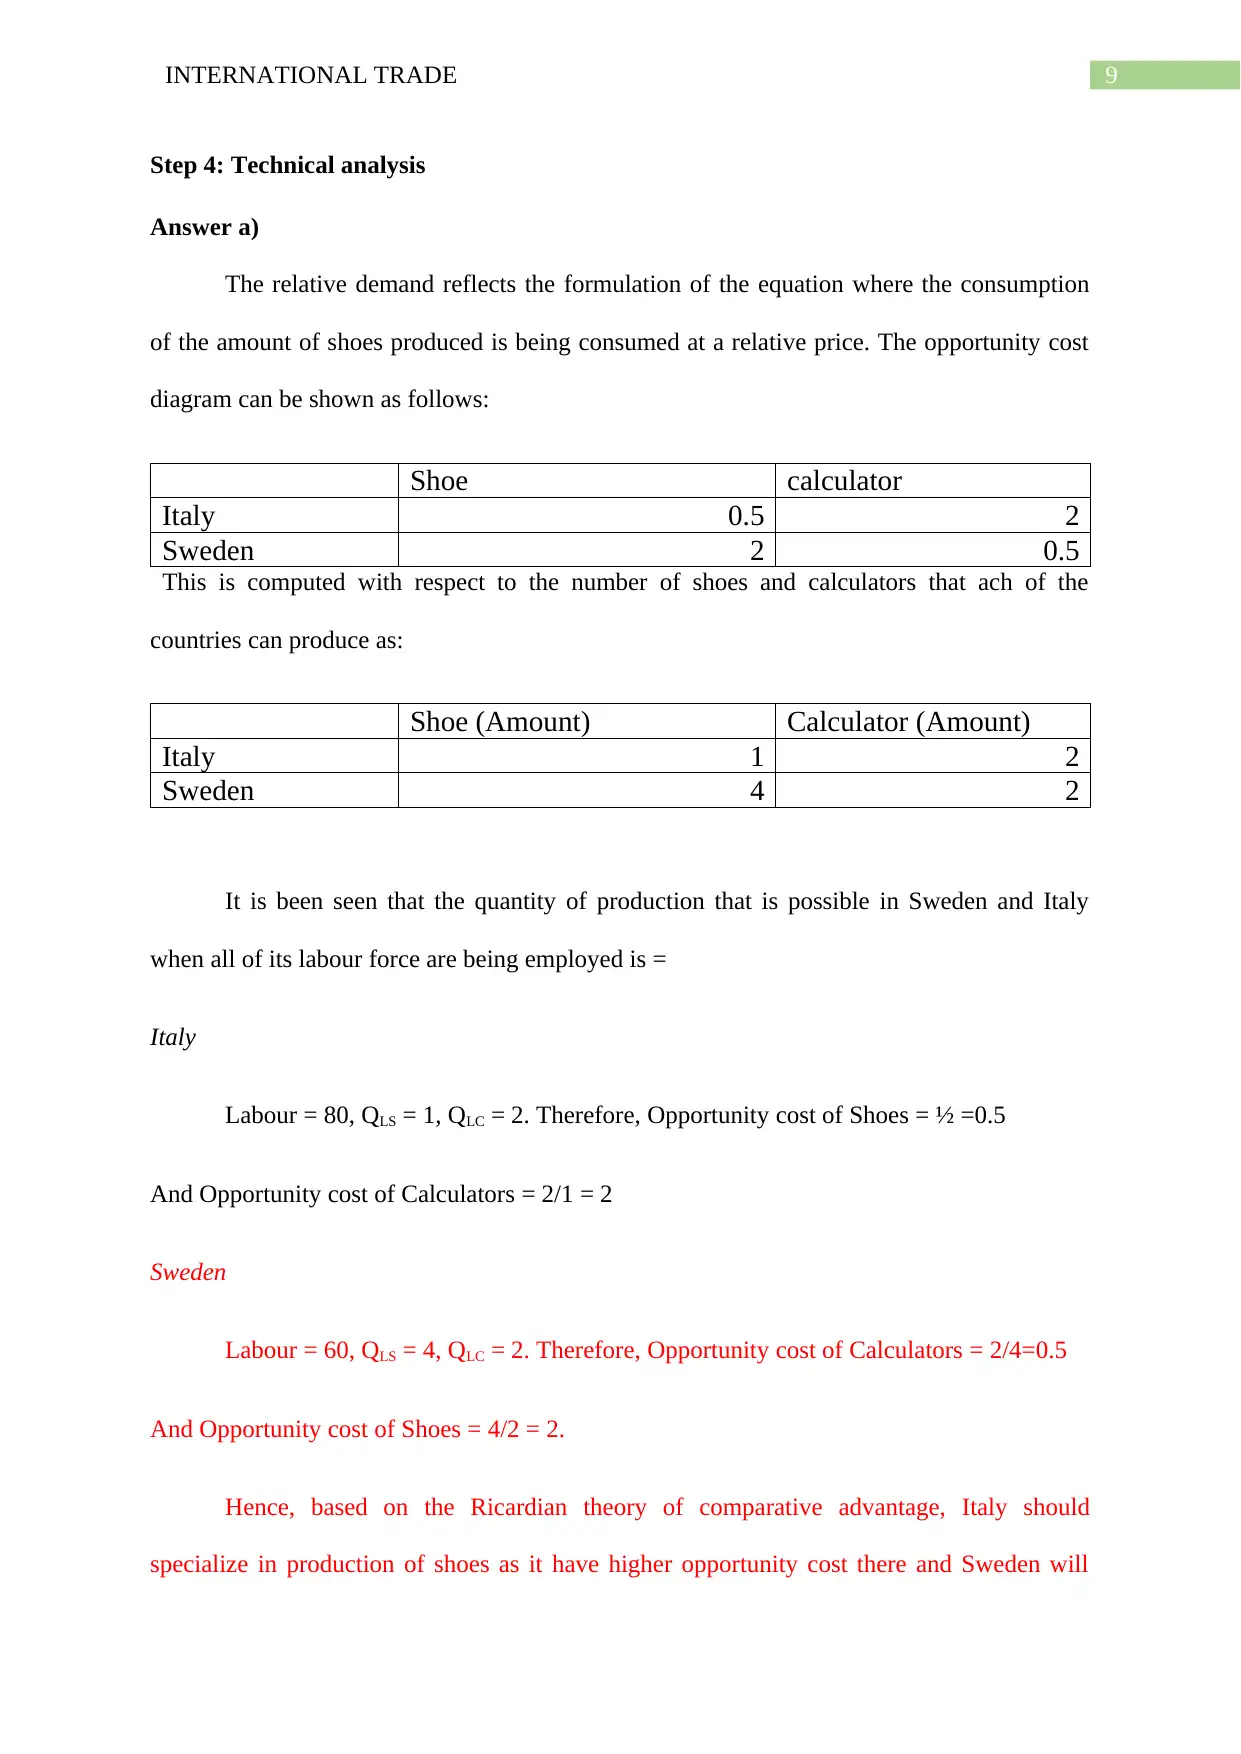
Step 4: Technical analysis
Answer a)
The relative demand reflects the formulation of the equation where the consumption
of the amount of shoes produced is being consumed at a relative price. The opportunity cost
diagram can be shown as follows:
Shoe calculator
Italy 0.5 2
Sweden 2 0.5
This is computed with respect to the number of shoes and calculators that ach of the
countries can produce as:
Shoe (Amount) Calculator (Amount)
Italy 1 2
Sweden 4 2
It is been seen that the quantity of production that is possible in Sweden and Italy
when all of its labour force are being employed is =
Italy
Labour = 80, QLS = 1, QLC = 2. Therefore, Opportunity cost of Shoes = ½ =0.5
And Opportunity cost of Calculators = 2/1 = 2
Sweden
Labour = 60, QLS = 4, QLC = 2. Therefore, Opportunity cost of Calculators = 2/4=0.5
And Opportunity cost of Shoes = 4/2 = 2.
Hence, based on the Ricardian theory of comparative advantage, Italy should
specialize in production of shoes as it have higher opportunity cost there and Sweden will
Secure Best Marks with AI Grader
Need help grading? Try our AI Grader for instant feedback on your assignments.
10INTERNATIONAL TRADE
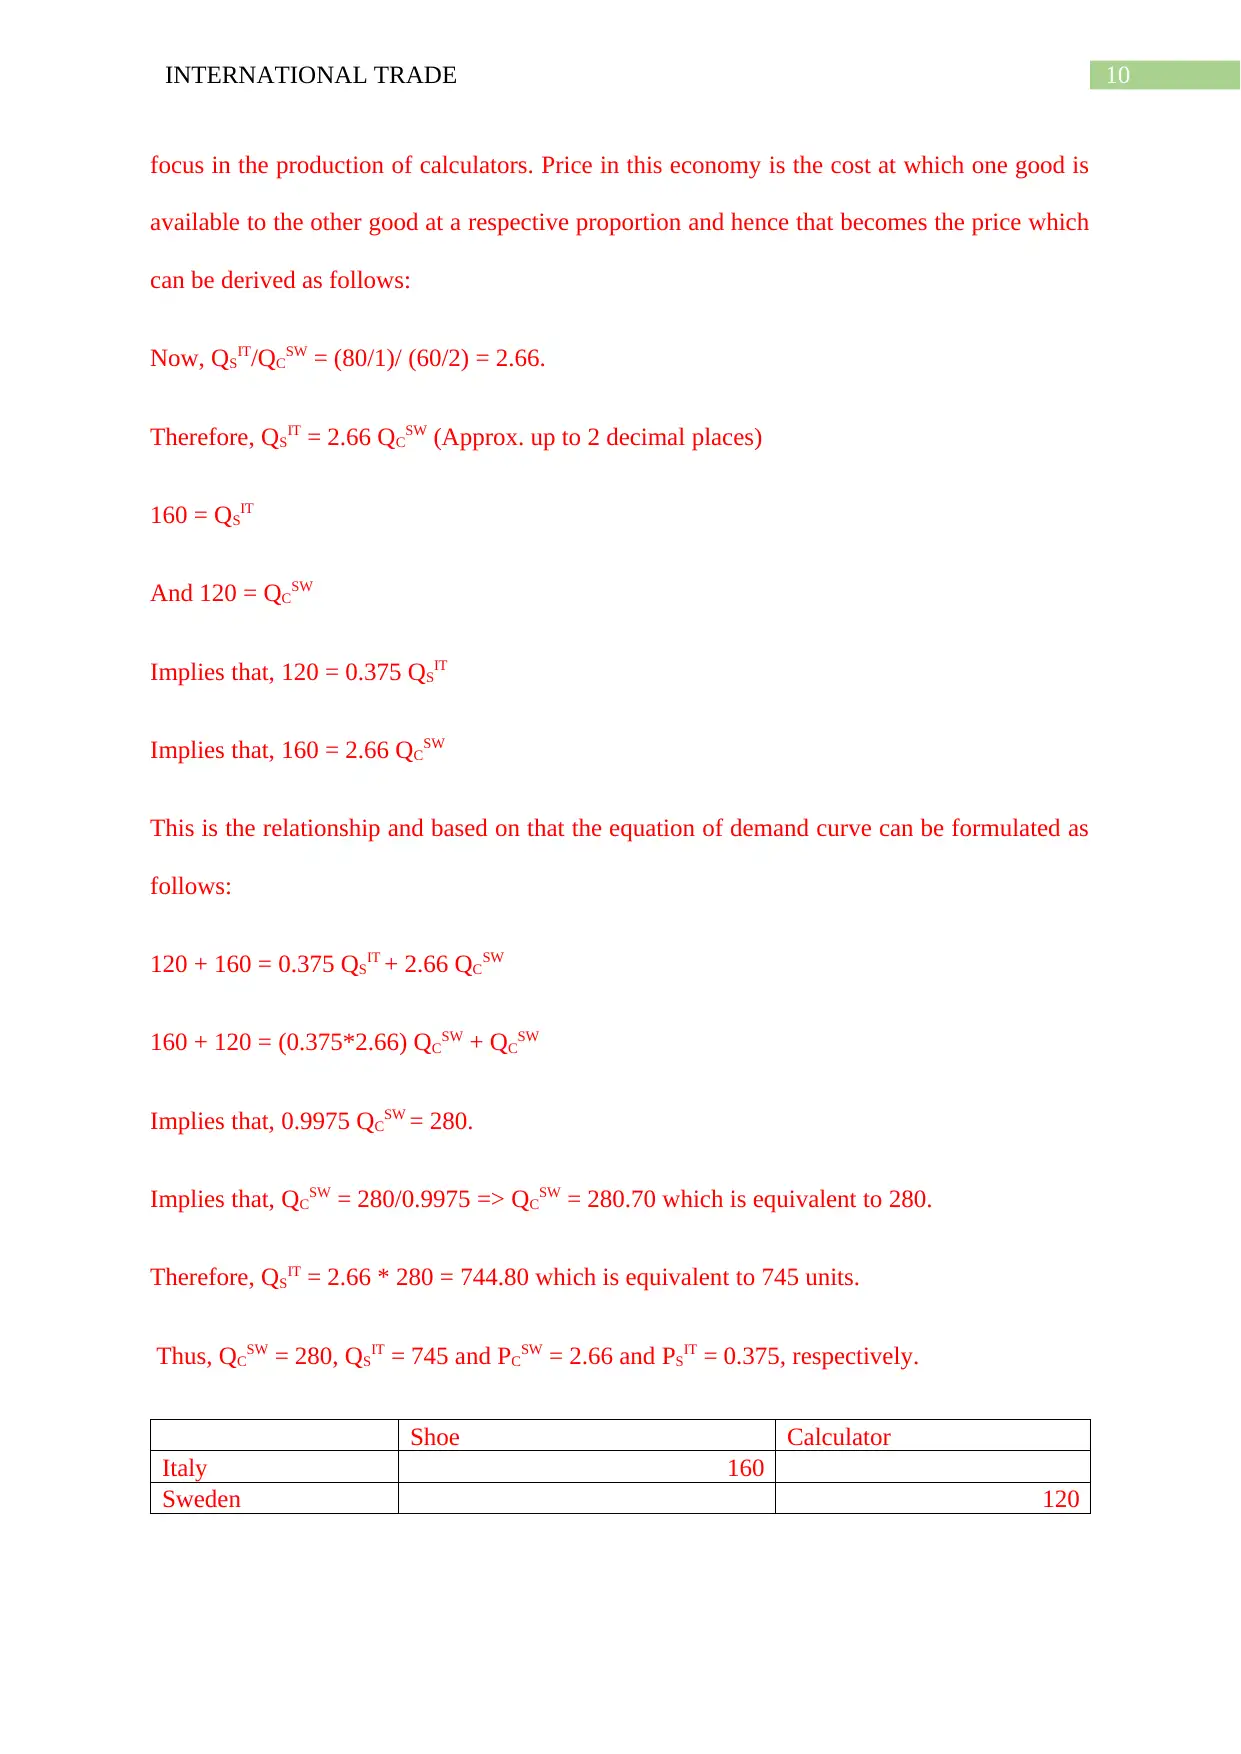
focus in the production of calculators. Price in this economy is the cost at which one good is
available to the other good at a respective proportion and hence that becomes the price which
can be derived as follows:
Now, QSIT/QCSW = (80/1)/ (60/2) = 2.66.
Therefore, QSIT = 2.66 QCSW (Approx. up to 2 decimal places)
160 = QSIT
And 120 = QCSW
Implies that, 120 = 0.375 QSIT
Implies that, 160 = 2.66 QCSW
This is the relationship and based on that the equation of demand curve can be formulated as
follows:
120 + 160 = 0.375 QSIT + 2.66 QCSW
160 + 120 = (0.375*2.66) QCSW + QCSW
Implies that, 0.9975 QCSW = 280.
Implies that, QCSW = 280/0.9975 => QCSW = 280.70 which is equivalent to 280.
Therefore, QSIT = 2.66 * 280 = 744.80 which is equivalent to 745 units.
Thus, QCSW = 280, QSIT = 745 and PCSW = 2.66 and PSIT = 0.375, respectively.
Shoe Calculator
Italy 160
Sweden 120
11INTERNATIONAL TRADE
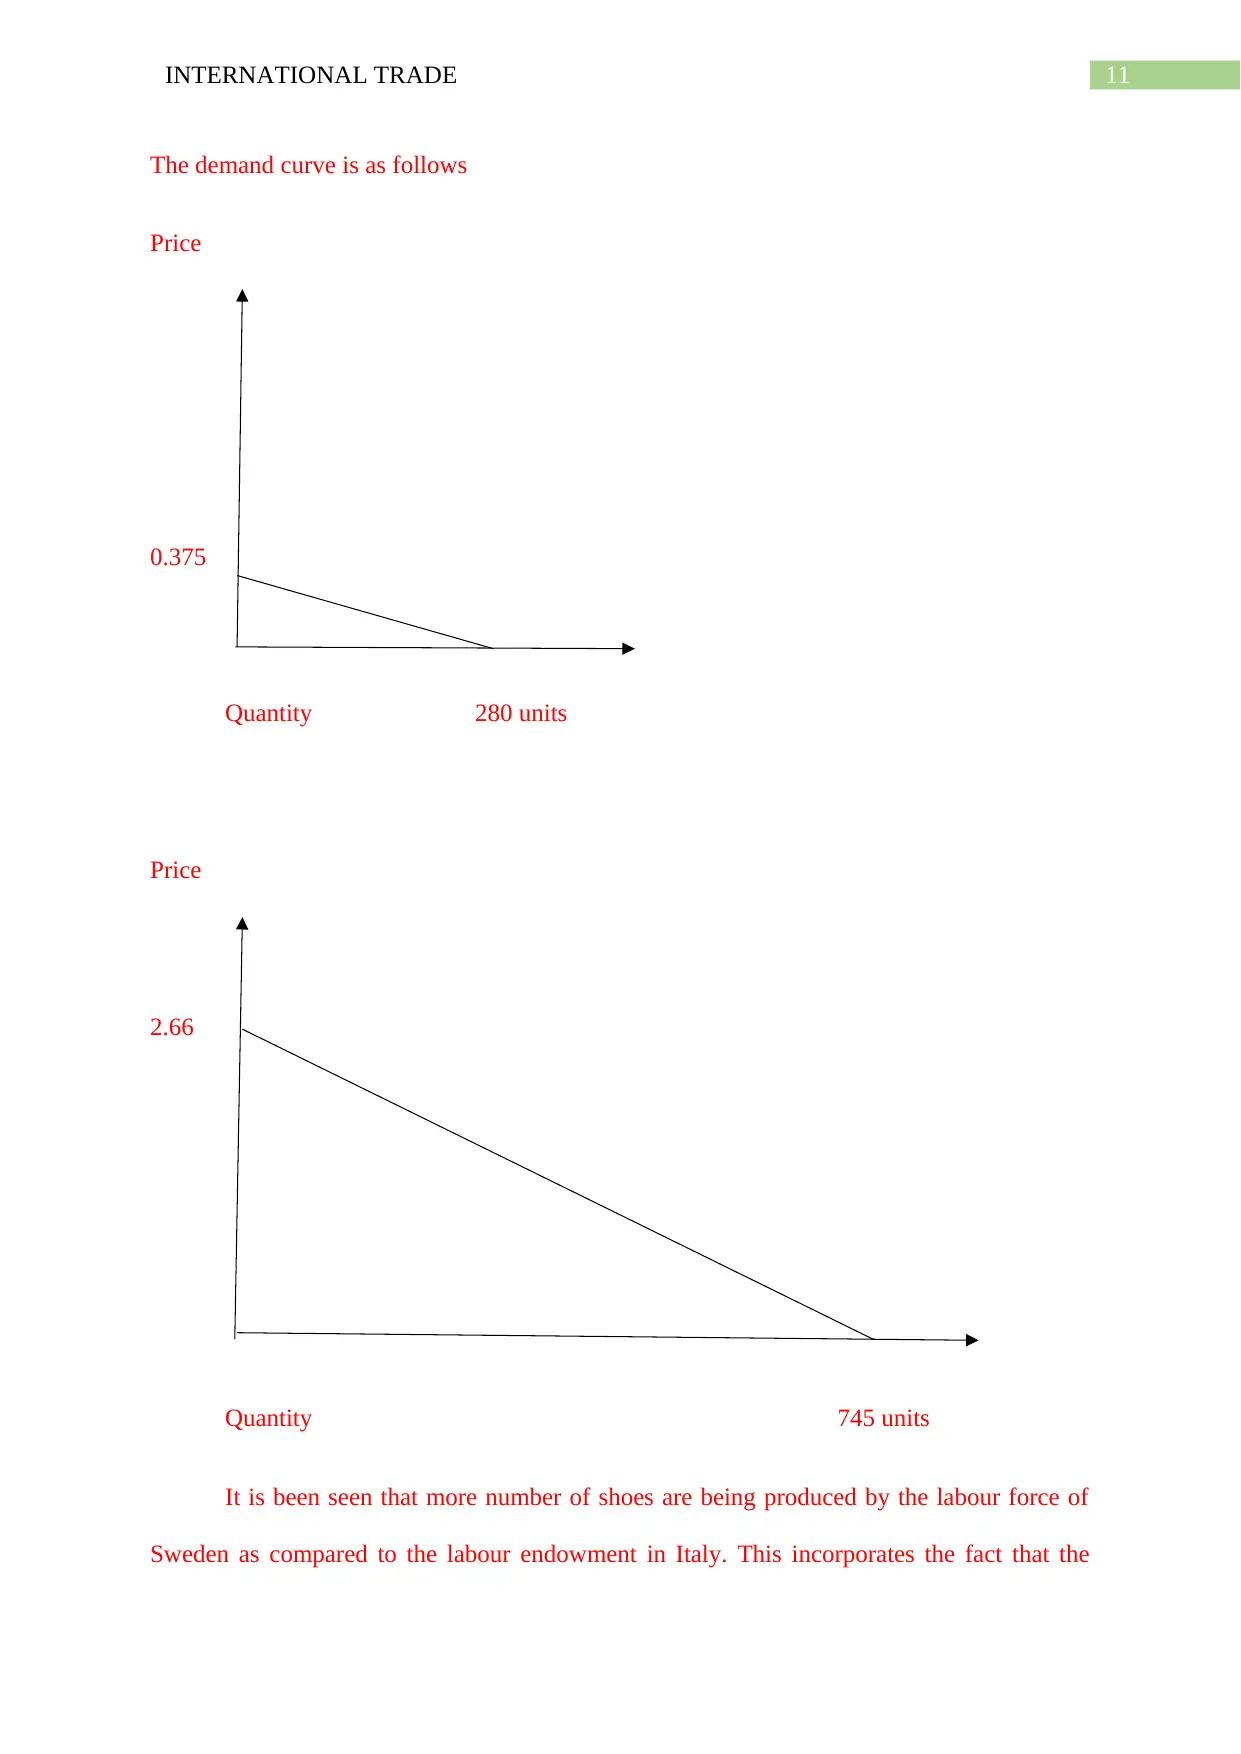
The demand curve is as follows
Price
0.375
Quantity 280 units
Price
2.66
Quantity 745 units
It is been seen that more number of shoes are being produced by the labour force of
Sweden as compared to the labour endowment in Italy. This incorporates the fact that the
The demand curve is as follows
Price
0.375
Quantity 280 units
Price
2.66
Quantity 745 units
It is been seen that more number of shoes are being produced by the labour force of
Sweden as compared to the labour endowment in Italy. This incorporates the fact that the
12INTERNATIONAL TRADE
workers of Sweden have an absolute advantage in the context of producing Shoes (Neary.
2016). On the other hand, same amount of calculators are being produced by both of the
countries. Hence as per the Ricardian model the countries should specialize in the production
of commodities where they have comparative advantage (Levchenko and Zhang. 2016). So as
per the model of comparative advantage provided by Ricardo, Sweden should specialize in
the production of calculators while Italy should specialize in the production of Shoes which
as both of the countries have higher opportunity cost in the production of the specified
commodities in terms of opportunity cost.
This will encourage the practice of international trade between the two respective
countries for the long term (De Benedictis and Tajoli. 2016).
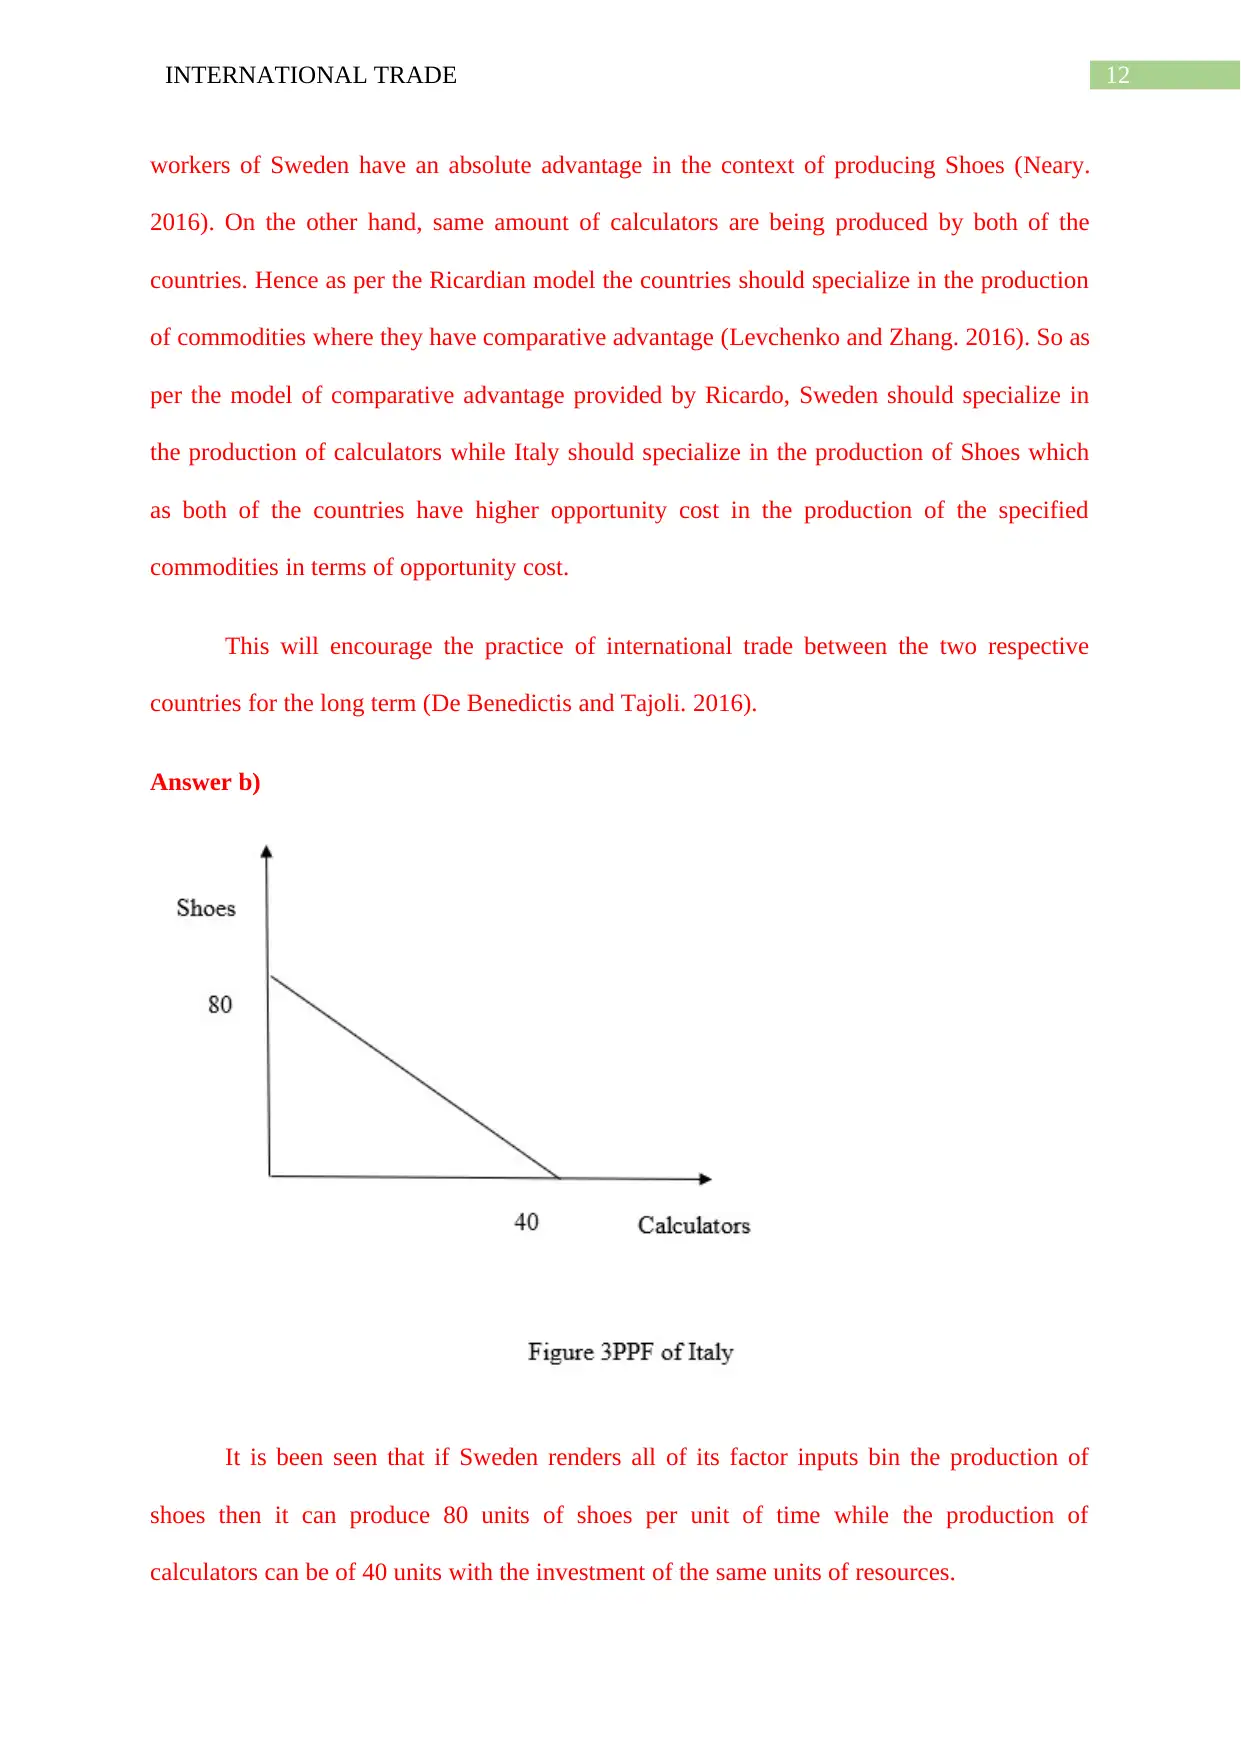
Answer b)
It is been seen that if Sweden renders all of its factor inputs bin the production of
shoes then it can produce 80 units of shoes per unit of time while the production of
calculators can be of 40 units with the investment of the same units of resources.
workers of Sweden have an absolute advantage in the context of producing Shoes (Neary.
2016). On the other hand, same amount of calculators are being produced by both of the
countries. Hence as per the Ricardian model the countries should specialize in the production
of commodities where they have comparative advantage (Levchenko and Zhang. 2016). So as
per the model of comparative advantage provided by Ricardo, Sweden should specialize in
the production of calculators while Italy should specialize in the production of Shoes which
as both of the countries have higher opportunity cost in the production of the specified
commodities in terms of opportunity cost.
This will encourage the practice of international trade between the two respective
countries for the long term (De Benedictis and Tajoli. 2016).
Answer b)
It is been seen that if Sweden renders all of its factor inputs bin the production of
shoes then it can produce 80 units of shoes per unit of time while the production of
calculators can be of 40 units with the investment of the same units of resources.
Paraphrase This Document
Need a fresh take? Get an instant paraphrase of this document with our AI Paraphraser
13INTERNATIONAL TRADE
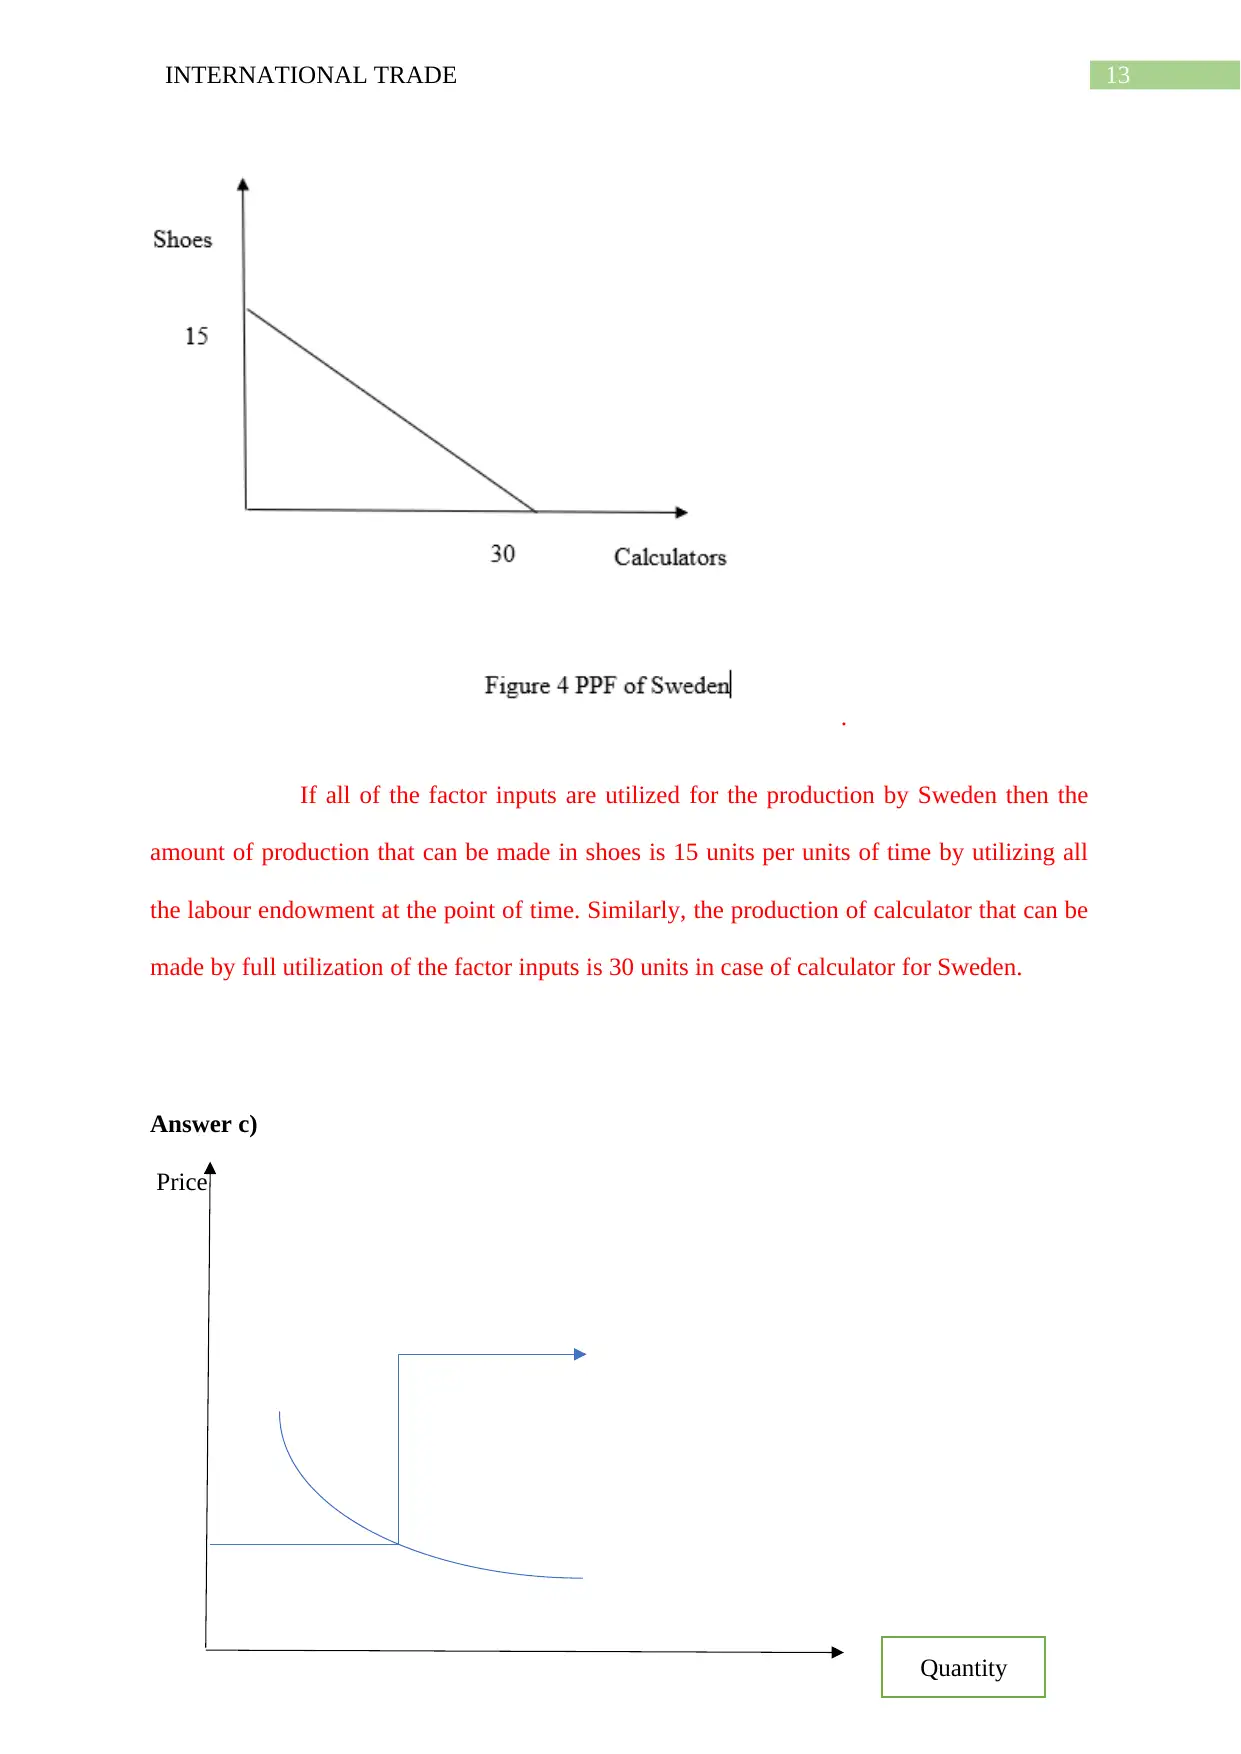
.
If all of the factor inputs are utilized for the production by Sweden then the
amount of production that can be made in shoes is 15 units per units of time by utilizing all
the labour endowment at the point of time. Similarly, the production of calculator that can be
made by full utilization of the factor inputs is 30 units in case of calculator for Sweden.
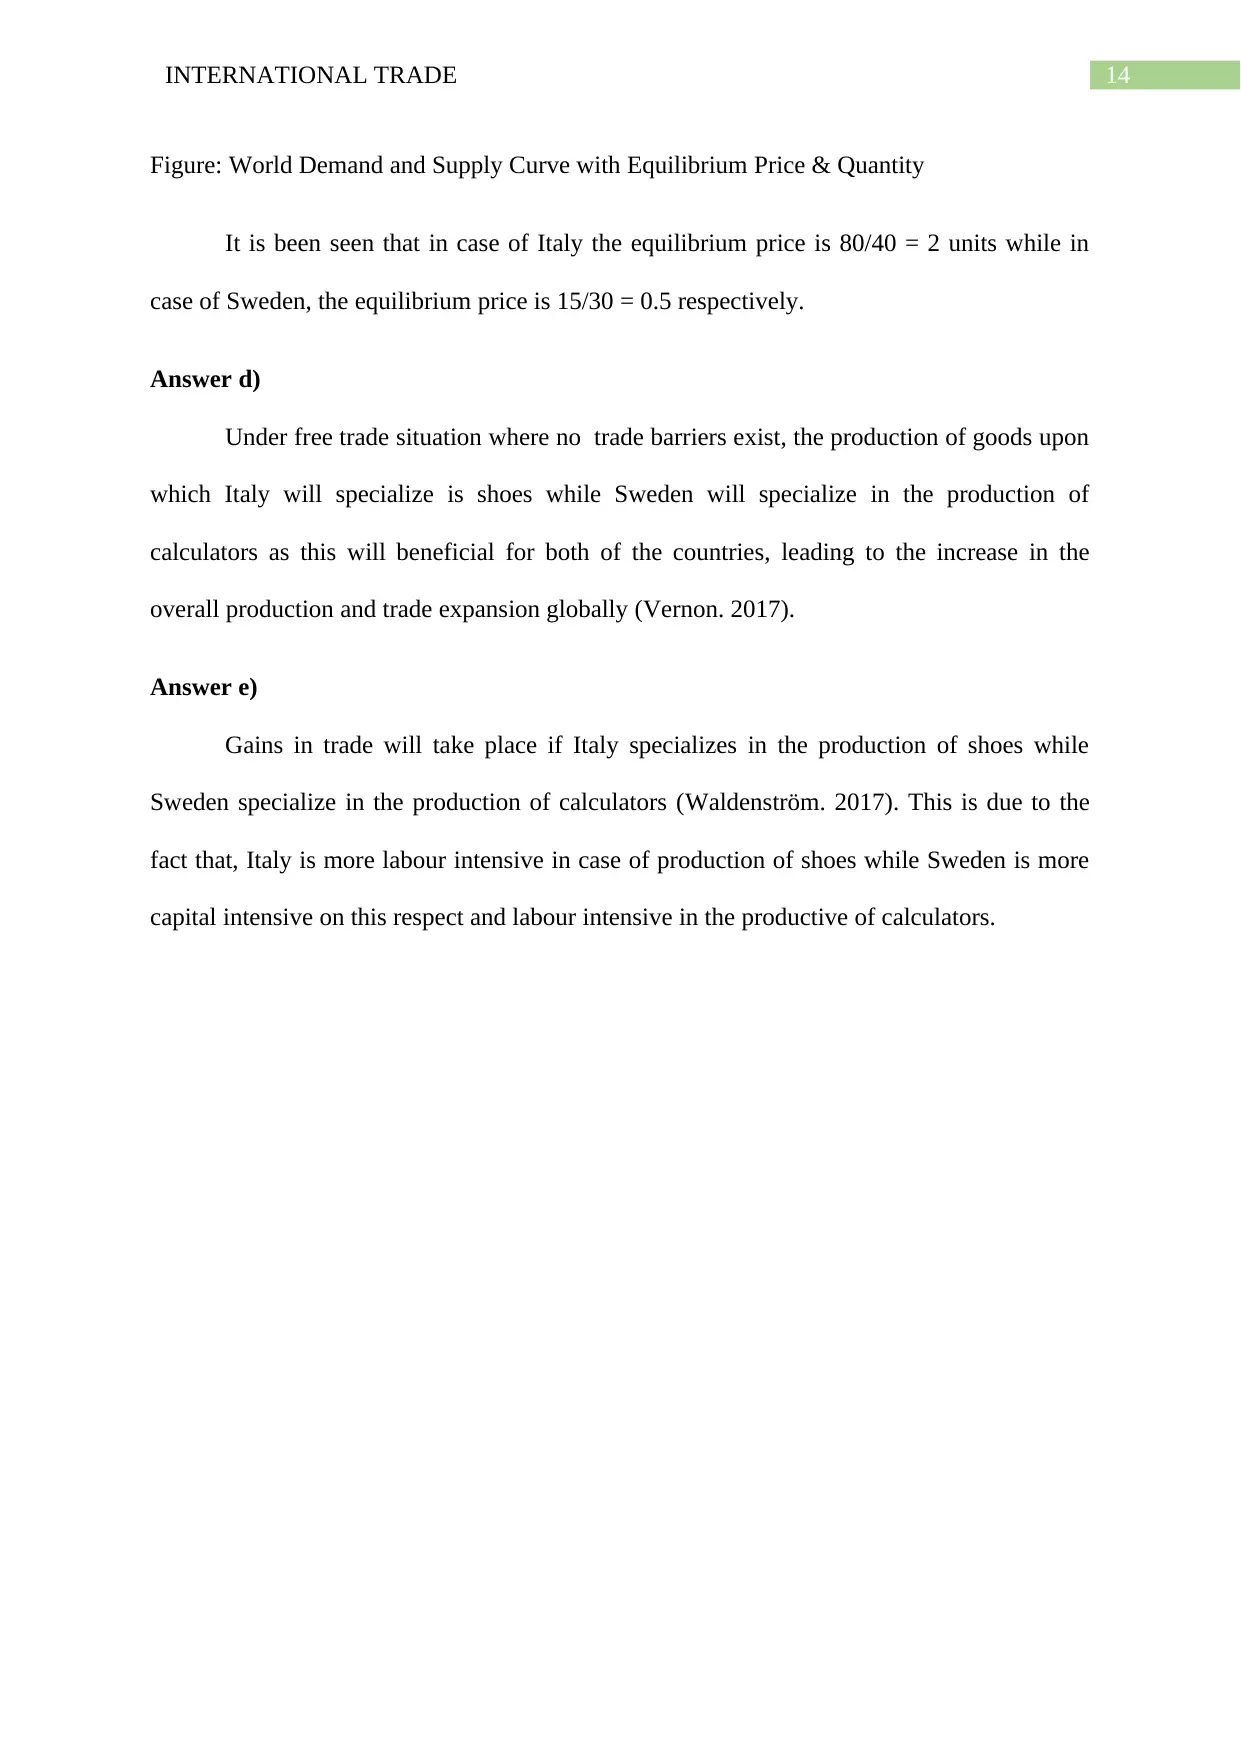
Answer c)
Price
Quantity
.
If all of the factor inputs are utilized for the production by Sweden then the
amount of production that can be made in shoes is 15 units per units of time by utilizing all
the labour endowment at the point of time. Similarly, the production of calculator that can be
made by full utilization of the factor inputs is 30 units in case of calculator for Sweden.
Answer c)
Price
Quantity
14INTERNATIONAL TRADE
Figure: World Demand and Supply Curve with Equilibrium Price & Quantity
It is been seen that in case of Italy the equilibrium price is 80/40 = 2 units while in
case of Sweden, the equilibrium price is 15/30 = 0.5 respectively.
Answer d)
Under free trade situation where no trade barriers exist, the production of goods upon
which Italy will specialize is shoes while Sweden will specialize in the production of
calculators as this will beneficial for both of the countries, leading to the increase in the
overall production and trade expansion globally (Vernon. 2017).
Answer e)
Gains in trade will take place if Italy specializes in the production of shoes while
Sweden specialize in the production of calculators (Waldenström. 2017). This is due to the
fact that, Italy is more labour intensive in case of production of shoes while Sweden is more
capital intensive on this respect and labour intensive in the productive of calculators.
15INTERNATIONAL TRADE
Reference list
Baldwin, R., 2017. Ricardo’s Comparative Advantage Has Been Denationalised. Cloth for
Wine? The Relevance of Ricardo’s Comparative Advantage in the 21st Century, pp.53-59.
Bernhofen, D.M. and Brown, J.C., 2018. Retrospectives: On the Genius Behind David
Ricardo's 1817 Formulation of Comparative Advantage. Journal of Economic
Perspectives, 32(4), pp.227-40.
Cai, J. and Stoyanov, A., 2016. Population aging and comparative advantage. Journal of
International Economics, 102, pp.1-21.
Calligaris, S., Del Gatto, M., Hassan, F., Ottaviano, G.I. and Schivardi, F., 2016. Italy’s
productivity conundrum. a study on resource misallocation in Italy (No. 030). Directorate
General Economic and Financial Affairs (DG ECFIN), European Commission.
Costinot, A., Donaldson, D., Vogel, J. and Werning, I., 2015. Comparative advantage and
optimal trade policy. The Quarterly Journal of Economics, 130(2), pp.659-702.
De Benedictis, L. and Tajoli, L., 2016. Comparative advantage and centrality in the world
network of trade and value added: an analysis of the Italian position. Rivista di Politica
Economica VII-IX, pp.1-36.
Fonte, M. and Cucco, I., 2015. 14. The political economy of alternative agriculture in
Italy. Handbook of the international political economy of agriculture and food, p.264.
Laursen, K., 2015. Revealed comparative advantage and the alternatives as measures of
international specialization. Eurasian Business Review, 5(1), pp.99-115.
Lawrence, P. and Spybey, T., 2018. Management and society in Sweden. Routledge.
Secure Best Marks with AI Grader
Need help grading? Try our AI Grader for instant feedback on your assignments.
16INTERNATIONAL TRADE
Levchenko, A.A. and Zhang, J., 2016. The evolution of comparative advantage:
Measurement and welfare implications. Journal of Monetary Economics, 78, pp.96-111.
Markovits, A., Gourevitch, P., Ross, G., Martin, A., Bornstein, S. and Allen, C.,
2016. Unions and Economic Crisis: Britain, West Germany and Sweden. Routledge.
Neary, J.P., 2016. International trade in general oligopolistic equilibrium. Review of
International Economics, 24(4), pp.669-698.
Powell, T., 2015. Comparative Advantage. Wiley Encyclopedia of Management, pp.1-1.
Rugman, A. and Verbeke, A., 2017. Global corporate strategy and trade policy. Routledge.
Spencer, N., Huws, U., Syrdal, D. and Holts, K., 2018. Work in the European Gig Economy:
Research Results from the UK, Sweden, Germany, Austria, the Netherlands, Switzerland and
Italy.
Vernon, R., 2017. International investment and international trade in the product cycle.
In International Business (pp. 99-116). Routledge.
Waldenström, D., 2017. Wealth-income ratios in a small, developing economy: Sweden,
1810–2014. The Journal of Economic History, 77(1), pp.285-313.
1 out of 17

Your All-in-One AI-Powered Toolkit for Academic Success.
+13062052269
info@desklib.com
Available 24*7 on WhatsApp / Email
![[object Object]](/_next/static/media/star-bottom.7253800d.svg)
Unlock your academic potential
© 2024 | Zucol Services PVT LTD | All rights reserved.