Analyzing International Trade Theories: Switzerland and Japan
VerifiedAdded on 2023/06/10
|22
|6831
|89
Essay
AI Summary
This essay provides an in-depth analysis of international trade theories and their application to current international trade practices, focusing on the economies of Switzerland and Japan. It begins by outlining the trade structure of both countries, including their export and import volumes, key trading partners, and GDP contributions. The analysis then delves into the theories of absolute and comparative advantage to explain the basis for trade between the two nations. Furthermore, the essay examines the Heckscher-Ohlin and Stolper-Samuelson models to understand factor endowment trade and income distribution. Finally, it considers new trade theories, exploring economies of scale, imperfect competition, and market power to portray the performance of both trade participating nations, highlighting their trade potential and economic indicators.
Running head: INTERNATIONAL ECONOMICS
Analysis of International Trade Theories and Their Application to Current International
Trade Practices
Name of the student:
Student ID number:
Author note
Analysis of International Trade Theories and Their Application to Current International
Trade Practices
Name of the student:
Student ID number:
Author note
Paraphrase This Document
Need a fresh take? Get an instant paraphrase of this document with our AI Paraphraser
1INTERNATIONAL ECONOMICS
Table of Contents
Introduction:...............................................................................................................................2
Trade structure of the chosen countries:....................................................................................3
Absolute advantage and comparative advantage of the chosen countries:................................7
a: Absolute advantage:...........................................................................................................8
b: Comparative advantage:...................................................................................................10
Factor endowment trade and income distribution:...................................................................11
a: Hecksher-Ohlin model:....................................................................................................11
b: Stolper-Samuelson model:...............................................................................................13
Context of new trade theories:.................................................................................................13
a: Economies of scale:..........................................................................................................13
b: Imperfect completion and market power:........................................................................15
Conclusion:..............................................................................................................................16
Reference:................................................................................................................................17
2INTERNATIONAL ECONOMICS
Introduction:
International trade is one such phenomenon that incorporate the exchange of the
goods and services as well as the capital, labour and others across the international border or
within the states. During the 21st century, there has been rise in the studies regarding the
international trade owing to its magnitude and far reaching impact on the social welfare
(Jones & Kierzkowski, 2018). International trade has been persistent event of the world
history that took place since the earlier human life when the tribes started to exchange goods
in lieu of other good that they cannot produce. Over the years, there has been rise in the
international trade through rise in the globalisation which is such a phenomenon that is aimed
to convert the world market into a single market. International trade is aimed to provide
higher amount of growth prospect to the trade participating nations through providing lower
cost goods and services and allowing them to export such goods and services in which said
economy expertise (Feenstra, 2015). In addition to this international trade provide rise to the
world economy where demand and supply, prices and global events are main factors that
plays crucial role. On the other hand, considering the domestic market, it can be seen that
these factors are also responsible for the influence on the domestic economy. With the rise in
the trade, there will be scope for the higher growth of the development that will allow the said
macroeconomic variables to fluctuate towards better growth prospect and future sustainability
of the economy (Low, 2016). For instance, if international trade between two economies take
place, then it can be seen that, trade participating nations face higher growth prospect through
the rise in the labour employment, skill development of the labour and transforming the same
from unskilled labour to the skilled labour that enhance the performance of the overall
economy (Brack, 2017).
It has been clear that international trade around the world and it provides large scale
of benefit to the trade participating nations, however, depending upon the economic condition
⊘ This is a preview!⊘
Do you want full access?
Subscribe today to unlock all pages.
Trusted by 1+ million students worldwide
3INTERNATIONAL ECONOMICS
of the trade participating nations, it can be seen that outcome of trading vary widely. In order
to trace the impact of the international trade in present date, this report is aimed to perform
analysis of International Trade Theories and Their Application to Current International Trade
Practices (Van & Lewer, 2015). For better understanding of the same, the report will consider
two economies, which are Switzerland and japan. In order perform the analysis of
international trade theories and apply the same to current international trade, the report will at
first state portray the trade structure of the chosen countries with the numerical values and
then portray why trade occur between the two country. For this purpose, the report will
consider the absolute advantage and comparative advantage theories, which are known as the
corner stone of the trade theory. Post this analysis, the report will portray the trading of the
chosen countries with the Hecksher-Ohlin model and Stolper-Samuelson model that will
define the factor endowment trade and income distribution of the trade participating nations.
Moreover, considering the new trade theories this report will define the economies of scale
and imperfect completion and market power which will portray the performance of both the
trade participating nations.
Trade structure of the chosen countries:
Selected economies for the report is Japan and Switzerland which are known for their
outstanding trade development during the recent past. Considering the export volume of
japan during 2017, the economy ranks 4th among all the trading nations; whereas, when it
comes to the Switzerland, then the economy is 15th in the list showcasing the high trade
potential of both the economies. The economy of japans is one of the highly developed and
open market economies around the world, which is the third largest economy as per the
nominal Gross Domestic Product (GDP) in the world. If the Purchasing Power Parity (PPP) is
considered, then the economy is the fourth largest nation. Japans is well known or its trade
surplus and additionally it has considerable net international investment surplus that
Paraphrase This Document
Need a fresh take? Get an instant paraphrase of this document with our AI Paraphraser
4INTERNATIONAL ECONOMICS
highlights the magnitude of the trade (Omri et al., 2015). As per the 2010 data, japans has
13.7% of world’s financial assets that showcase the trade openness of the said economy
(Gokmenoglu et al., 2015). In addition to this it can be seen that mineral abundance of the
Japanese economy has aided the domestic economy to survive the destruction during the
Second World War and transformed itself as one of the capital abundant economy. Trading
history of Japanese economy is well established and well developed since the 16th century,
when the economy came into contact with the European civilisations (Jebli & Youssef,
2015). Through the renaissance japan has perceived sophisticated feudal society which has
highly strong dominance over the peer nations in case of the technological advantage. Next to
this, during the time of 16th century to 18th century it can be seen that trading between the
various nations with japans eventually increased that has aided the economy to transform
itself as one of the developed nations (Laursen, 2015). Nowadays japan has variety of
industries ranging from handicrafts to large rockets and technologically upgraded equipment
that has made the economy into a well-established trading nations. Trade is one of the main
source of the total GDP income of the domestic economy and as per the statistics the
economy is accounted for the 12.5% GDP share out of total GDP of the country. Main
trading partners of japan is United States which is accounted for the 20.2% trade out of total
goods and services exported from japan and next to this comes China (Castinot et al., 2016).
Though presently japan and china, are going through the border dispute in South China Sea,
it can be seen that there is lot of trade between these two trading partners. As per the
statistics, china is accounted 17.6% trade share out of total trade of the japan making china
one of the best and well-weathered trading partner of the economy (Levchenko & Zhang,
2016). On the other hand, European Union (EU), South Korea and Taiwan are the other
nations that possess higher ranks in case of trade with japans. Considering the import volume
from the countries from where Thailand import varies widely. For instance, china is
5INTERNATIONAL ECONOMICS
accounted for the 25.8% goods and services out of total import, and EU is the second largest
exporter to Thailand with the 12.4% share of total imports. As the main source of the export
goods and service, japan sends motor vehicles by a large extent which is considered 14.9% of
total export (Hanson et al., 2015). On the other hand petroleum is the highest importing goods
that japan import from its trading partners. This large amount of trade has provided the
Japanese economy to possess 683.3 billion of export value as per the 2017 data and it can be
seen from the data of 2017 japan import 625.9 billion dollar of goods and services from its
trading partners providing a positive trade value at the end of the financial year (Davis &
Dingel, 2014).
Moving forward to the economy of Switzerland, it can be seen that, this economy is
another developed economy around the world, which is depended upon the trading for the
better growth prospect. Economy of Switzerland has a well-established service sector that
produces 71% of GDP of the economy, whereas agricultural sector provide only 1.3% of the
GDP and rest amount, which around 27.1% is sourced by the industrial sector making it one
of the highly developed economy (Castinot et al., 2015). Switzerland is the third richest
landlocked economy around world and as per the nominal GDP it is 19th largest economy.
When it comes to trade, then it export 3083 billion dollar of good and services as per the 201
data, which rose by 19.2% from 2010 (Do et al., 2014). Considering the import of the
economy, it can be seen that economy of Switzerland is accounted for 299.6 billion dollar of
goods and service import from its trading partners during 2011 that highlights a positive trade
balance by the end of 2011 (Bowen, 2018). One of the most important trading partner of
Switzerland is Germany, which is accounted for 21% of export for the country and 29%
import toward the country out of total export and import volumes from the economy
respectively (Vollrath, 2016). Second largest trading partner of Switzerland is US which is
accounted for 9.1% export of total goods an service and 6.7% of import out of total import
⊘ This is a preview!⊘
Do you want full access?
Subscribe today to unlock all pages.
Trusted by 1+ million students worldwide
6INTERNATIONAL ECONOMICS
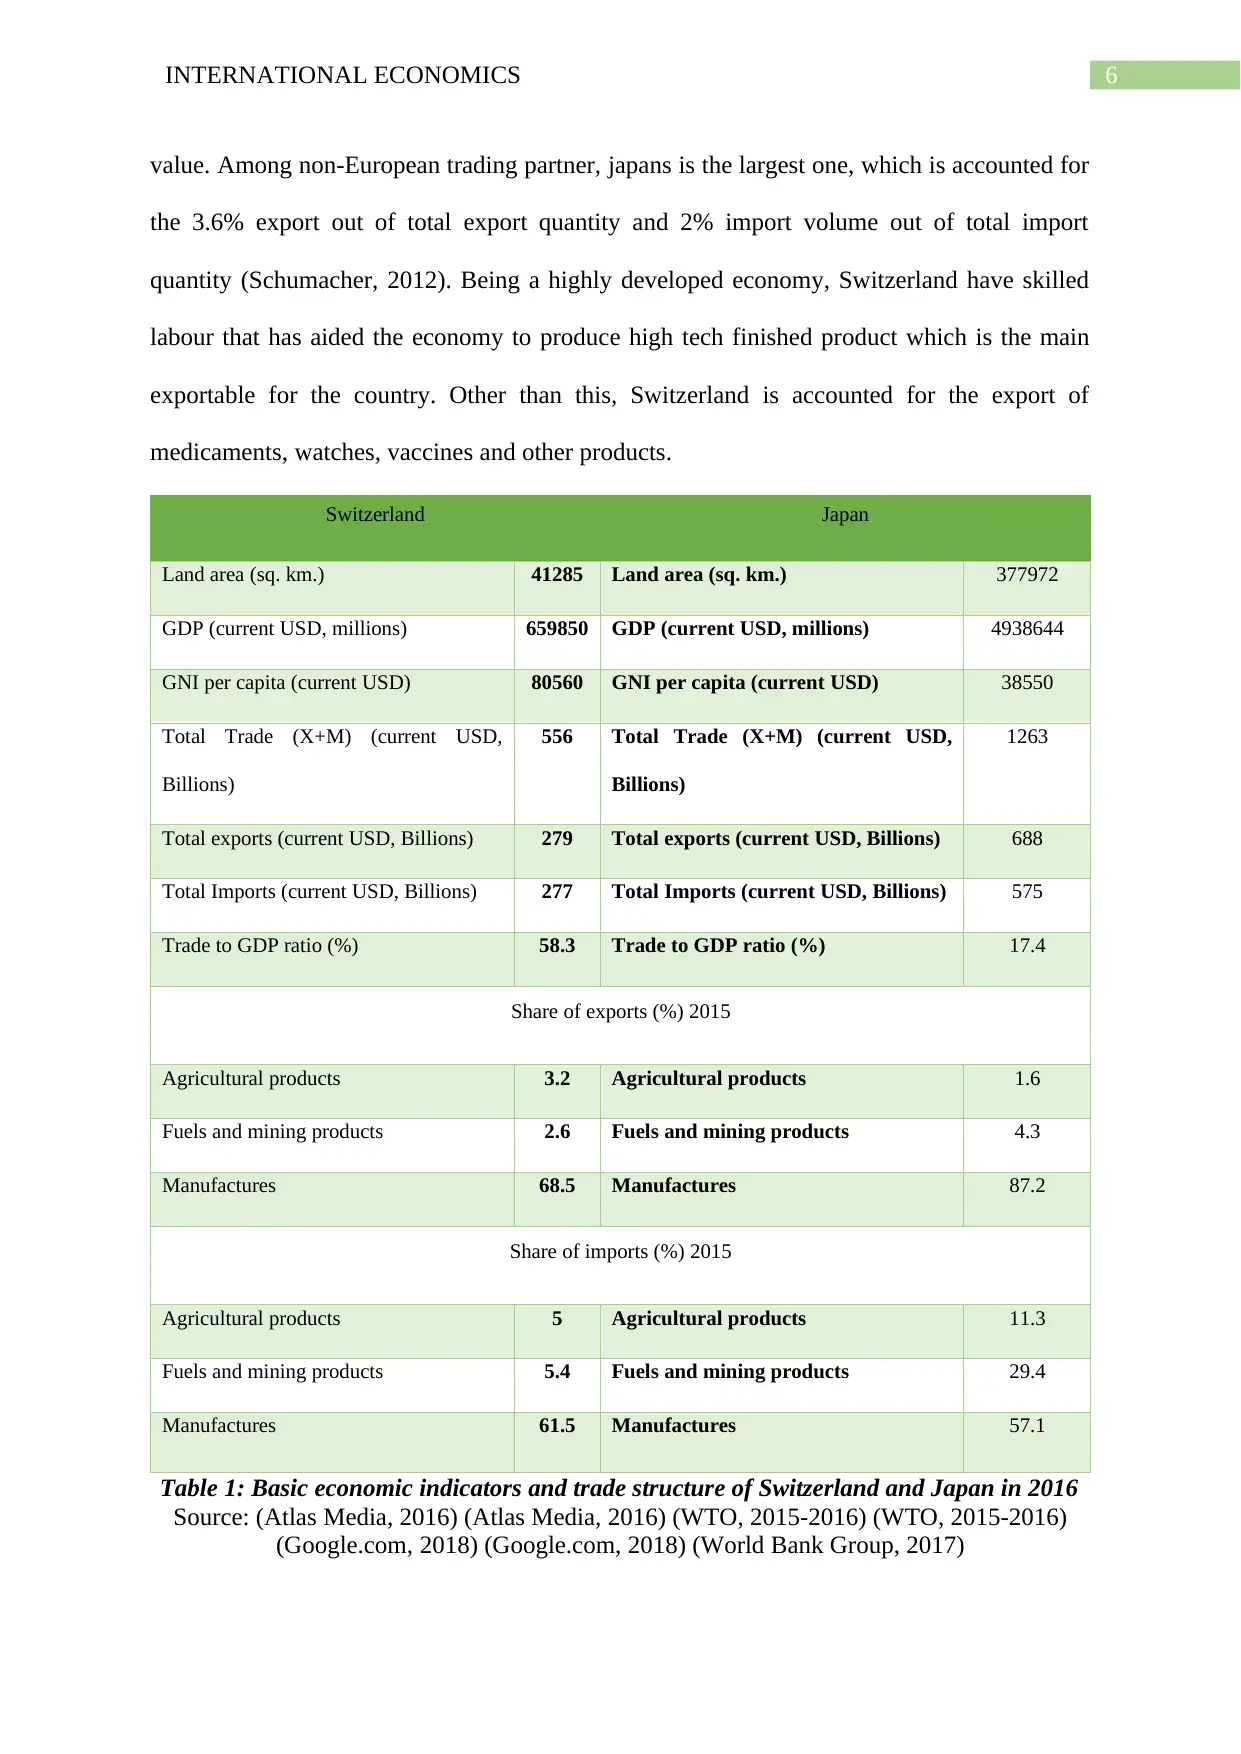
value. Among non-European trading partner, japans is the largest one, which is accounted for
the 3.6% export out of total export quantity and 2% import volume out of total import
quantity (Schumacher, 2012). Being a highly developed economy, Switzerland have skilled
labour that has aided the economy to produce high tech finished product which is the main
exportable for the country. Other than this, Switzerland is accounted for the export of
medicaments, watches, vaccines and other products.
Switzerland Japan
Land area (sq. km.) 41285 Land area (sq. km.) 377972
GDP (current USD, millions) 659850 GDP (current USD, millions) 4938644
GNI per capita (current USD) 80560 GNI per capita (current USD) 38550
Total Trade (X+M) (current USD,
Billions)
556 Total Trade (X+M) (current USD,
Billions)
1263
Total exports (current USD, Billions) 279 Total exports (current USD, Billions) 688
Total Imports (current USD, Billions) 277 Total Imports (current USD, Billions) 575
Trade to GDP ratio (%) 58.3 Trade to GDP ratio (%) 17.4
Share of exports (%) 2015
Agricultural products 3.2 Agricultural products 1.6
Fuels and mining products 2.6 Fuels and mining products 4.3
Manufactures 68.5 Manufactures 87.2
Share of imports (%) 2015
Agricultural products 5 Agricultural products 11.3
Fuels and mining products 5.4 Fuels and mining products 29.4
Manufactures 61.5 Manufactures 57.1
Table 1: Basic economic indicators and trade structure of Switzerland and Japan in 2016
Source: (Atlas Media, 2016) (Atlas Media, 2016) (WTO, 2015-2016) (WTO, 2015-2016)
(Google.com, 2018) (Google.com, 2018) (World Bank Group, 2017)
Paraphrase This Document
Need a fresh take? Get an instant paraphrase of this document with our AI Paraphraser
7INTERNATIONAL ECONOMICS
Considering the given data it can be seen that japans is the largest nation among the
two selected economy as per the land area. Switzerland have 41285 sq.km. of land, whereas
japans is accounted for the 377972 sq.km. of land. As per the GDP japan again stands higher
than the economy of Switzerland owing to the higher GDP at current price. It also showcase
that the economy of japan has higher trade potential compared to the economy of Switzerland
because, with higher GDP there will be higher job creation and the goods and service
production will be higher as well. When it comes to Gross National Income (GNI) per capita,
then it can be seen that Switzerland ranks first and japans has almost half of the GNI per
capita as compared to the economy of Switzerland. This showcase that standard of living in
Switzerland is higher than japan. Total trade value of japan is higher than Switzerland wing
to the fact that japan is a larger economy than Switzerland that has land abundance as well as
labour abundance compared to Switzerland. Higher total export of the Japanese economy
showcase better growth prospect of the domestic economy with better trade balance. As it has
been seen from the earlier discussion, japans exports manufacturing goods and services by
maximum amount, and Switzerland does the same due to availability of skilled labour and
capital. Both of the economies exports fuel by a small amount and agricultural output is the
least in the list showcasing dependence of both economy on the capital intensive goods for
the international trade (Samuelson, 1964). Owing to the fact that japans and Switzerland
exports high tech finished products, it can be said that both the economies imports large
amount of manufacturing goofs and the import of agricultural goods is also high.
With the comparative analysis of both the economies it can be said that japan and
Switzerland has almost identical trade structure.
Absolute advantage and comparative advantage of the chosen countries:
Since the development of the civilisation during the earlier human history trade began
among the different tribes and during 21st century it has become one of the main part of the
8INTERNATIONAL ECONOMICS
national income. Though the trading during initial days was subsistent in nature, however, in
present date it is one of the main source of income that not only enhance the public earning
rather enhance the production, performance and job creation as well. owing to the vast
magnitude of trade and its reach that can provide better growth to the trading partners, over
the decades there has been vast amount of research that has given rise to the modern trading
theories, however, most of them has failed to provide reason of occurrence of trade and how
trade flow from one trading partner to another one (Zhang, 2017). One of the major
breakthrough came with the help of the Adam Smith who bring in the theory of absolute
advantage and next to this David Ricardo introduced his theory of comparative advantage of
international trade that revamped the theory of international trade and described how trade
takes place between nations in present date. Details regarding these different types of
international trading theory are as follows:
a: Absolute advantage:
Absolute advantage of a country in case of international trade is the ability to produce
goods and services at a lower cost compared to other entities that are able to produce same
goods and services. Entities who poses absolute advantage can produce a good or service
utilising smaller amount of inputs that makes it efficient than its competitors who can
produce the same with higher amount of factor endowment. absolute advantage is one of the
predominant theory of international trade as per which a country that poses absolute
advantage in production of one goods or service specialises in the same that allow it to apply
small amount of factor of production in order to produce same amount of goods and service
as compared to its competitor (Lai & Bujang, 2016). between two trading partner if a country
possess absolute advantage in production of one good, and another one possess absolute
advantage in another good or service, then trade can take place between two nations. Though
Adam smith pioneered the idea of absolute advantage during the 18th century it is still present
⊘ This is a preview!⊘
Do you want full access?
Subscribe today to unlock all pages.
Trusted by 1+ million students worldwide
9INTERNATIONAL ECONOMICS
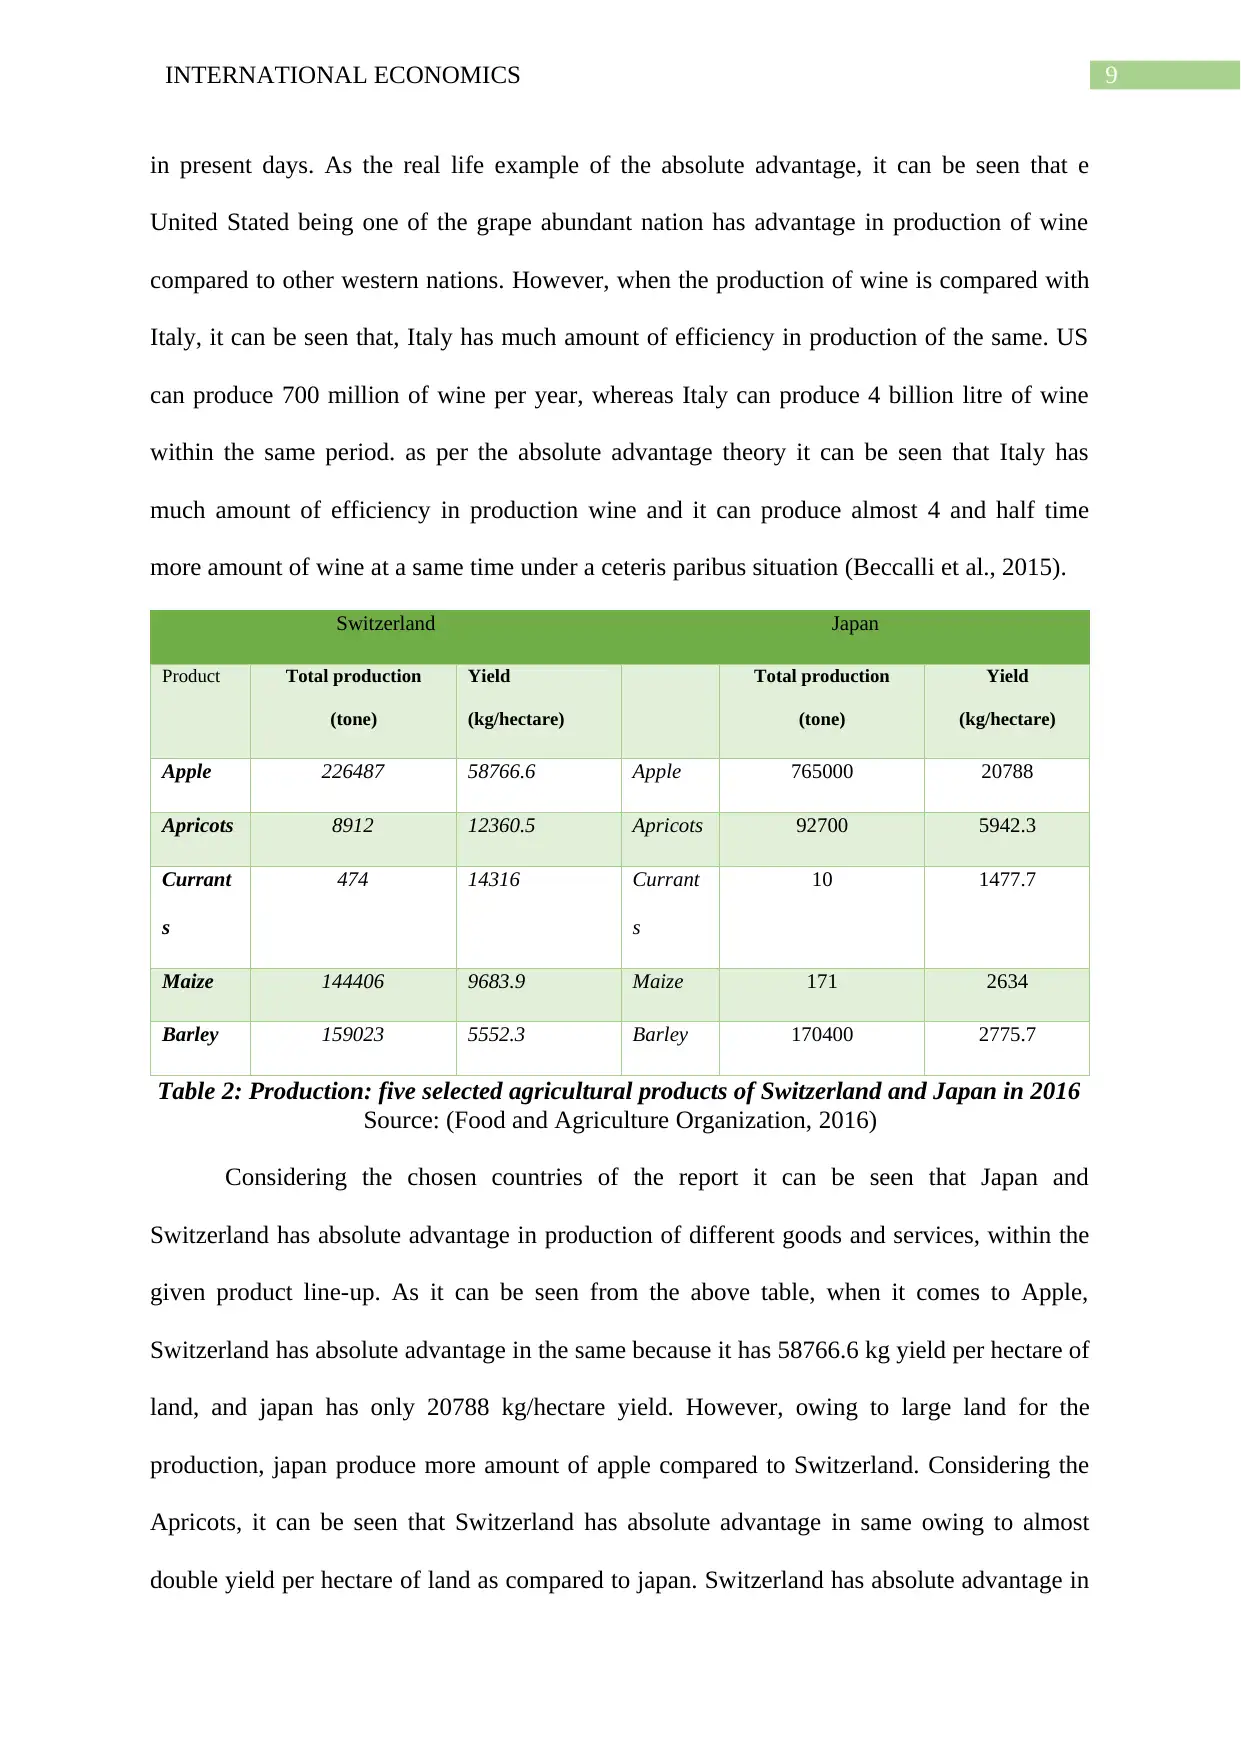
in present days. As the real life example of the absolute advantage, it can be seen that e
United Stated being one of the grape abundant nation has advantage in production of wine
compared to other western nations. However, when the production of wine is compared with
Italy, it can be seen that, Italy has much amount of efficiency in production of the same. US
can produce 700 million of wine per year, whereas Italy can produce 4 billion litre of wine
within the same period. as per the absolute advantage theory it can be seen that Italy has
much amount of efficiency in production wine and it can produce almost 4 and half time
more amount of wine at a same time under a ceteris paribus situation (Beccalli et al., 2015).
Switzerland Japan
Product Total production
(tone)
Yield
(kg/hectare)
Total production
(tone)
Yield
(kg/hectare)
Apple 226487 58766.6 Apple 765000 20788
Apricots 8912 12360.5 Apricots 92700 5942.3
Currant
s
474 14316 Currant
s
10 1477.7
Maize 144406 9683.9 Maize 171 2634
Barley 159023 5552.3 Barley 170400 2775.7
Table 2: Production: five selected agricultural products of Switzerland and Japan in 2016
Source: (Food and Agriculture Organization, 2016)
Considering the chosen countries of the report it can be seen that Japan and
Switzerland has absolute advantage in production of different goods and services, within the
given product line-up. As it can be seen from the above table, when it comes to Apple,
Switzerland has absolute advantage in the same because it has 58766.6 kg yield per hectare of
land, and japan has only 20788 kg/hectare yield. However, owing to large land for the
production, japan produce more amount of apple compared to Switzerland. Considering the
Apricots, it can be seen that Switzerland has absolute advantage in same owing to almost
double yield per hectare of land as compared to japan. Switzerland has absolute advantage in
Paraphrase This Document
Need a fresh take? Get an instant paraphrase of this document with our AI Paraphraser
10INTERNATIONAL ECONOMICS
case of Currants because it has ten times larger productivity than japan and in case of also the
Switzerland possess absolute advantage too (Atack, 2018). In case of barley, Japans fails to
dominate the market because Switzerland has higher productivity per hectare of land.
absolute advantage theory by large scale is a supply sided theory that define the international
trading with the help of production, however, it fails to define the flow of trade if a country
has absolute advantage in production of both goods and service under a 2x2 model. Thus,
over the year of evaluation of trade theories David Ricardo bring in the comparative
advantage theory of international trade (Ferrufino & Robertson, 2014).
b: Comparative advantage:
Comparative advantage is the developed version of the absolute advantage that
defines trade can occur between two nations depending upon their relative cost advantage in
production. Ricardo explained, if one country has comparative advantage in production in
one good due to the relative advantage of price, then it will export the same and import the
other good in which it has comparative disadvantage in production (David, 2015). As per the
theory of Ricardo, if there is two countries, who operate under perfectly competitive market,
and the cost of production is expressed in terms of labour, then a country will exercise
comparative advantage in production of one good in which it has lower opportunity cost and
the other nation will produce that good in which that country enjoys lower opportunity cost
(Michael, 2016). Owing to the availability of difference in opportunity cost, there will be
trade between the nations and one country out of two will export the same in which it has
comparative advantage and import the same in which it has comparative disadvantage.
11INTERNATIONAL ECONOMICS
Switzerland Japan
Product Price per tone, USD) Price per tone, USD)
Apricots 2588.2 Apricots 2644.5
Barley 305.5 Barley 1243.5
Beans, green 1140.8 Beans, green 5751.3
Cabbages and
other
brassicas
1485.9 Cabbages and
other
brassicas
729.8
Cherries 3614.4 Cherries 17331.1
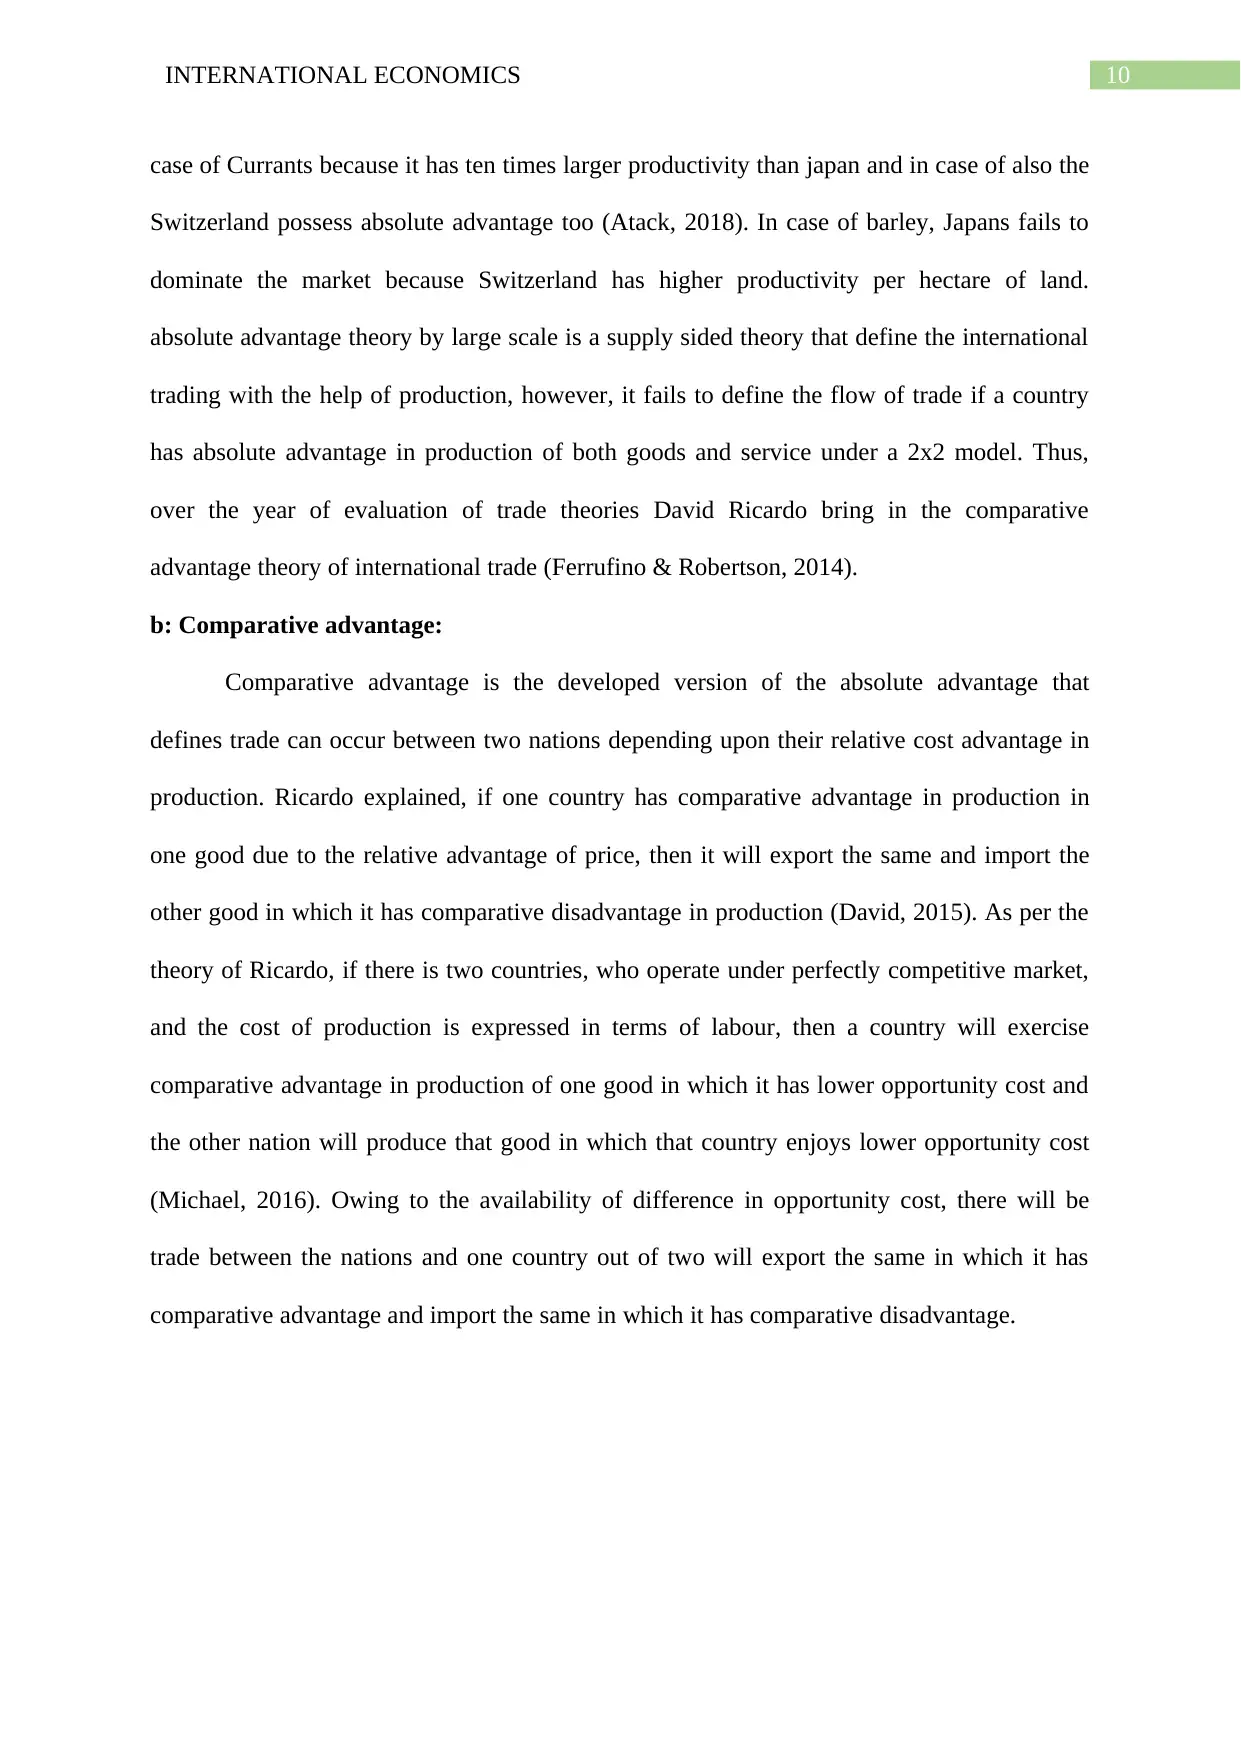
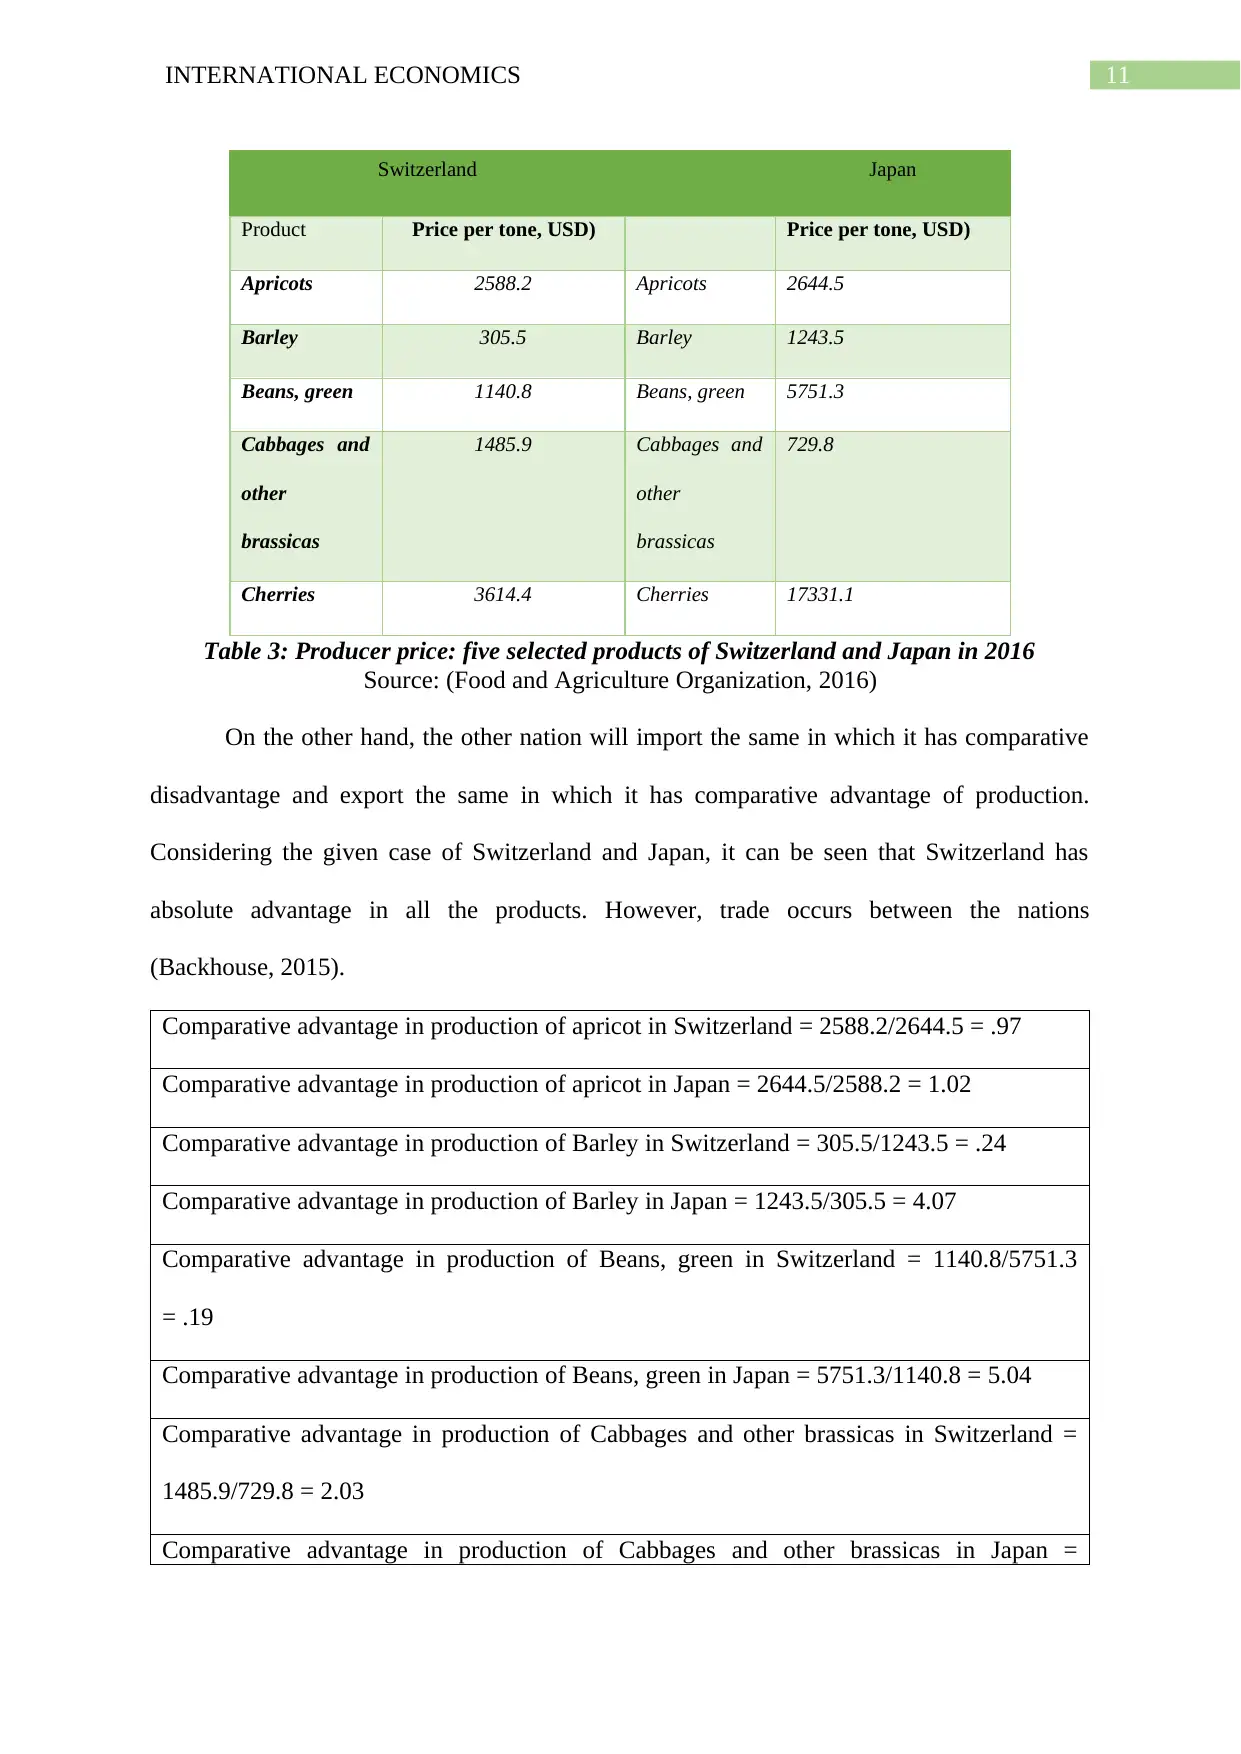
Table 3: Producer price: five selected products of Switzerland and Japan in 2016
Source: (Food and Agriculture Organization, 2016)
On the other hand, the other nation will import the same in which it has comparative
disadvantage and export the same in which it has comparative advantage of production.
Considering the given case of Switzerland and Japan, it can be seen that Switzerland has
absolute advantage in all the products. However, trade occurs between the nations
(Backhouse, 2015).
Comparative advantage in production of apricot in Switzerland = 2588.2/2644.5 = .97
Comparative advantage in production of apricot in Japan = 2644.5/2588.2 = 1.02
Comparative advantage in production of Barley in Switzerland = 305.5/1243.5 = .24
Comparative advantage in production of Barley in Japan = 1243.5/305.5 = 4.07
Comparative advantage in production of Beans, green in Switzerland = 1140.8/5751.3
= .19
Comparative advantage in production of Beans, green in Japan = 5751.3/1140.8 = 5.04
Comparative advantage in production of Cabbages and other brassicas in Switzerland =
1485.9/729.8 = 2.03
Comparative advantage in production of Cabbages and other brassicas in Japan =
Switzerland Japan
Product Price per tone, USD) Price per tone, USD)
Apricots 2588.2 Apricots 2644.5
Barley 305.5 Barley 1243.5
Beans, green 1140.8 Beans, green 5751.3
Cabbages and
other
brassicas
1485.9 Cabbages and
other
brassicas
729.8
Cherries 3614.4 Cherries 17331.1
Table 3: Producer price: five selected products of Switzerland and Japan in 2016
Source: (Food and Agriculture Organization, 2016)
On the other hand, the other nation will import the same in which it has comparative
disadvantage and export the same in which it has comparative advantage of production.
Considering the given case of Switzerland and Japan, it can be seen that Switzerland has
absolute advantage in all the products. However, trade occurs between the nations
(Backhouse, 2015).
Comparative advantage in production of apricot in Switzerland = 2588.2/2644.5 = .97
Comparative advantage in production of apricot in Japan = 2644.5/2588.2 = 1.02
Comparative advantage in production of Barley in Switzerland = 305.5/1243.5 = .24
Comparative advantage in production of Barley in Japan = 1243.5/305.5 = 4.07
Comparative advantage in production of Beans, green in Switzerland = 1140.8/5751.3
= .19
Comparative advantage in production of Beans, green in Japan = 5751.3/1140.8 = 5.04
Comparative advantage in production of Cabbages and other brassicas in Switzerland =
1485.9/729.8 = 2.03
Comparative advantage in production of Cabbages and other brassicas in Japan =
⊘ This is a preview!⊘
Do you want full access?
Subscribe today to unlock all pages.
Trusted by 1+ million students worldwide
1 out of 22
Related Documents


Your All-in-One AI-Powered Toolkit for Academic Success.
+13062052269
info@desklib.com
Available 24*7 on WhatsApp / Email
![[object Object]](/_next/static/media/star-bottom.7253800d.svg)
Unlock your academic potential
Copyright © 2020–2026 A2Z Services. All Rights Reserved. Developed and managed by ZUCOL.