Interpretation of Correlation Matrix: Leadership and Employee Outcomes
VerifiedAdded on 2023/01/11
|5
|1342
|2
Report
AI Summary
This report provides an interpretation of a correlation matrix derived from a study examining the effects of transformational leadership on employee outcomes. The analysis focuses on the relationships between variables such as transformational leadership needed and received, positive and n...
Running head: INTERPRETATION OF CORRELATION MATRIX
Interpretation of Correlation Matrix
Name of the Student:
Name of the University:
Author Note:
Interpretation of Correlation Matrix
Name of the Student:
Name of the University:
Author Note:
Paraphrase This Document
Need a fresh take? Get an instant paraphrase of this document with our AI Paraphraser
1FOUNDATION SKILLS IN DATA SKILLS
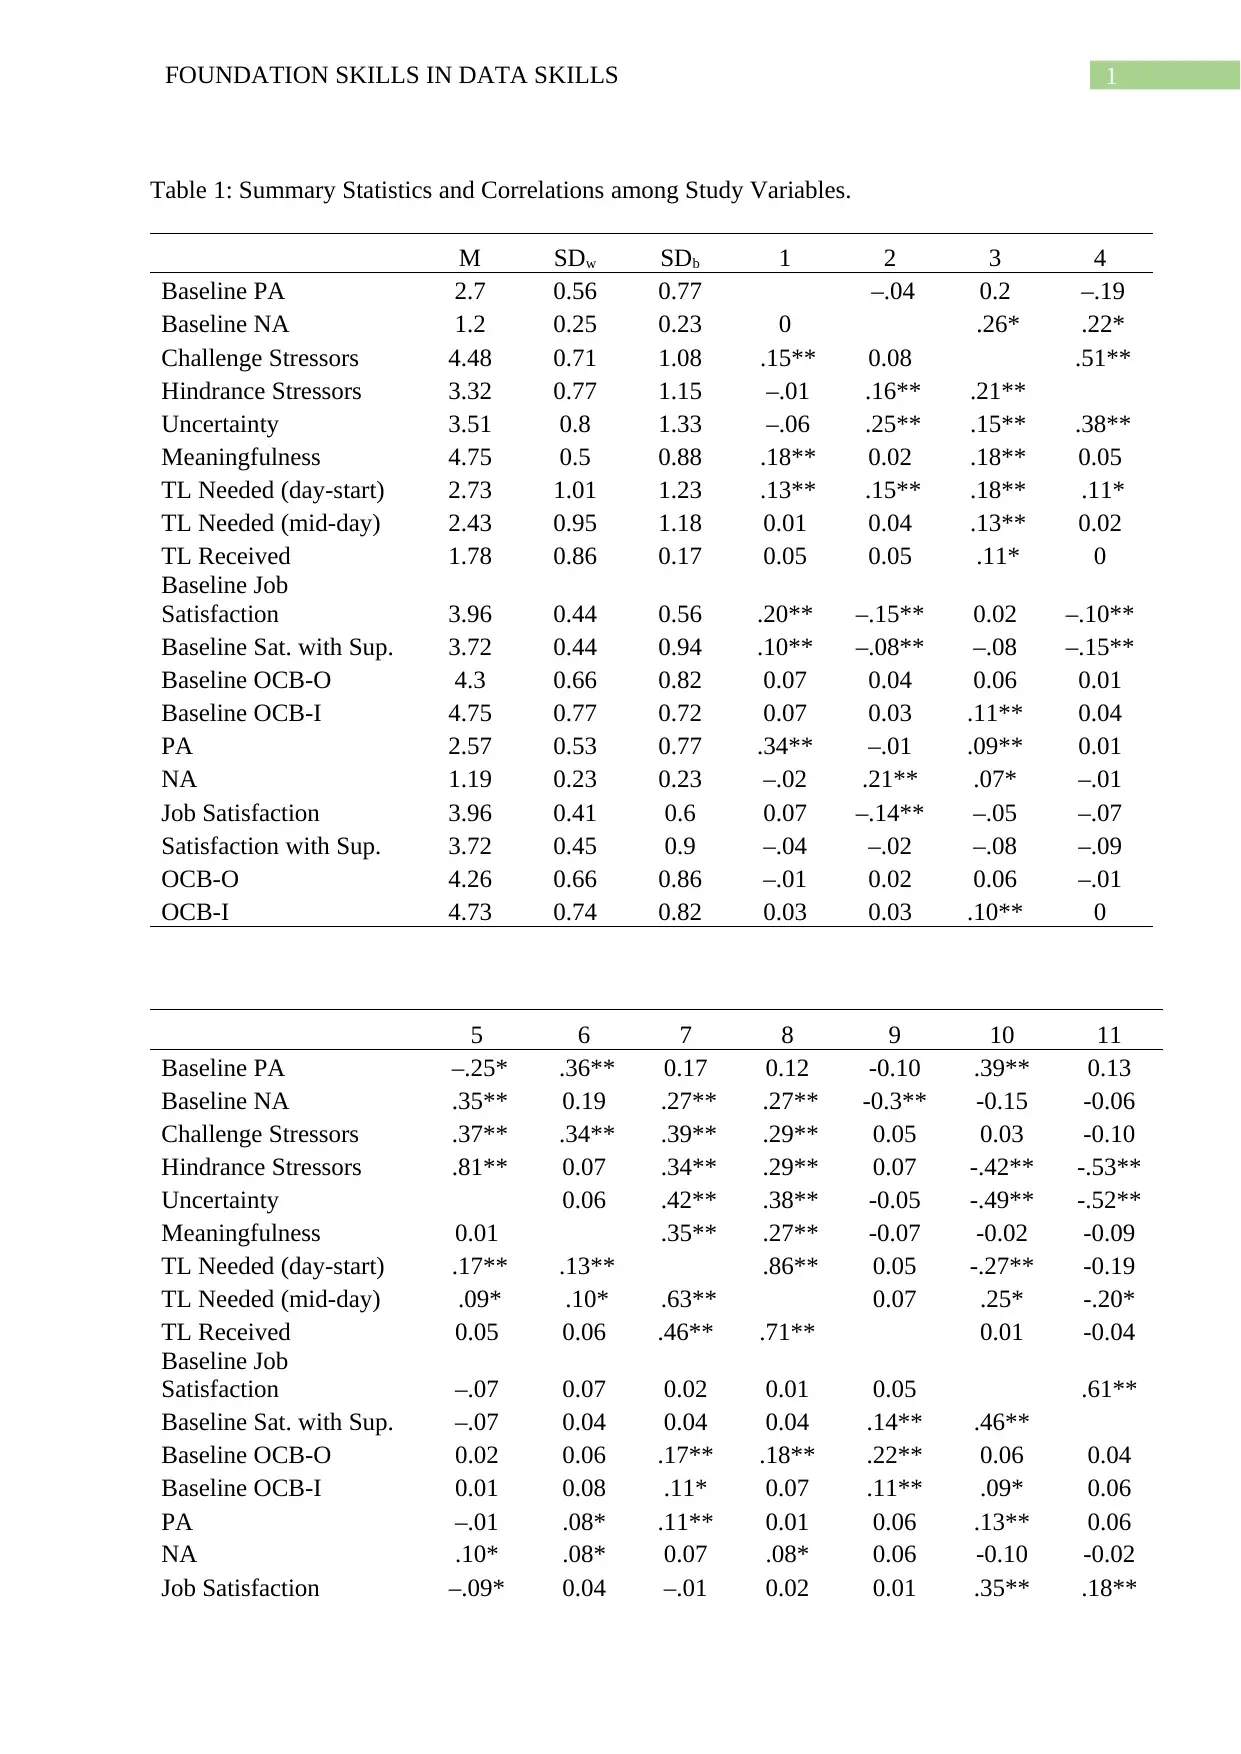
Table 1: Summary Statistics and Correlations among Study Variables.
M SDw SDb 1 2 3 4
Baseline PA 2.7 0.56 0.77 –.04 0.2 –.19
Baseline NA 1.2 0.25 0.23 0 .26* .22*
Challenge Stressors 4.48 0.71 1.08 .15** 0.08 .51**
Hindrance Stressors 3.32 0.77 1.15 –.01 .16** .21**
Uncertainty 3.51 0.8 1.33 –.06 .25** .15** .38**
Meaningfulness 4.75 0.5 0.88 .18** 0.02 .18** 0.05
TL Needed (day-start) 2.73 1.01 1.23 .13** .15** .18** .11*
TL Needed (mid-day) 2.43 0.95 1.18 0.01 0.04 .13** 0.02
TL Received 1.78 0.86 0.17 0.05 0.05 .11* 0
Baseline Job
Satisfaction 3.96 0.44 0.56 .20** –.15** 0.02 –.10**
Baseline Sat. with Sup. 3.72 0.44 0.94 .10** –.08** –.08 –.15**
Baseline OCB-O 4.3 0.66 0.82 0.07 0.04 0.06 0.01
Baseline OCB-I 4.75 0.77 0.72 0.07 0.03 .11** 0.04
PA 2.57 0.53 0.77 .34** –.01 .09** 0.01
NA 1.19 0.23 0.23 –.02 .21** .07* –.01
Job Satisfaction 3.96 0.41 0.6 0.07 –.14** –.05 –.07
Satisfaction with Sup. 3.72 0.45 0.9 –.04 –.02 –.08 –.09
OCB-O 4.26 0.66 0.86 –.01 0.02 0.06 –.01
OCB-I 4.73 0.74 0.82 0.03 0.03 .10** 0
5 6 7 8 9 10 11
Baseline PA –.25* .36** 0.17 0.12 -0.10 .39** 0.13
Baseline NA .35** 0.19 .27** .27** -0.3** -0.15 -0.06
Challenge Stressors .37** .34** .39** .29** 0.05 0.03 -0.10
Hindrance Stressors .81** 0.07 .34** .29** 0.07 -.42** -.53**
Uncertainty 0.06 .42** .38** -0.05 -.49** -.52**
Meaningfulness 0.01 .35** .27** -0.07 -0.02 -0.09
TL Needed (day-start) .17** .13** .86** 0.05 -.27** -0.19
TL Needed (mid-day) .09* .10* .63** 0.07 .25* -.20*
TL Received 0.05 0.06 .46** .71** 0.01 -0.04
Baseline Job
Satisfaction –.07 0.07 0.02 0.01 0.05 .61**
Baseline Sat. with Sup. –.07 0.04 0.04 0.04 .14** .46**
Baseline OCB-O 0.02 0.06 .17** .18** .22** 0.06 0.04
Baseline OCB-I 0.01 0.08 .11* 0.07 .11** .09* 0.06
PA –.01 .08* .11** 0.01 0.06 .13** 0.06
NA .10* .08* 0.07 .08* 0.06 -0.10 -0.02
Job Satisfaction –.09* 0.04 –.01 0.02 0.01 .35** .18**
2FOUNDATION SKILLS IN DATA SKILLS
Satisfaction with Sup. –.09* 0.04 0 –.01 0.02 0.08 .38**
OCB-O 0 0.04 .15** .14** .11* -0.02 -0.02
OCB-I 0.04 .07* 0.08 0.06 0.06 -0.02 -0.06
12 13 14 15 16 17 18 19
Baseline PA .25* 0.18 .87** 0.00 .37** 0.12 .28** 0.15
Baseline NA 0.12 0.07 0.01 .81** -.22* -0.08 .32** 0.14
Challenge Stressors .53** .53** .32** .33** -0.02 -0.17 .59** .60**
Hindrance Stressors .36** .36** -0.08 0.20 -.44** -.56** .42** .40**
Uncertainty .29** .22* -0.11 .31** -.56** -.56** .34** .27**
Meaningfulness .30** 0.19 .38** 0.20 -0.09 -0.11 .34** 0.17
TL Needed (day-
start) .36** .27** .23* .34** -.28** -.24* .38** .29**
TL Needed (mid-day) .31** .21* 0.18 .33** -.23* -.25* .35** .30**
TL Received 0.09 0.12 -0.02 -0.15 0.12 0.00 -0.10 8.00
Baseline Job
Satisfaction 0.04 -0.08 .36** -0.19 .94** .57** -0.04 -0.12
Baseline Sat. with
Sup. -0.02 -0.14 0.06 -0.09 .58** .97** -0.11 -0.14
Baseline OCB-O .64** .32** .26* 0.02 -0.07 .85** .64**
Baseline OCB-I .30** .21* 0.11 -0.07 -0.17 .59** .88**
PA .07* 0.08 0.15 .34** 0.05 .37** .24*
NA -0.03 -0.02 -0.10 -.23* -0.11 .37** .21*
Job Satisfaction .08* 0.04 .27** -29** .58** -0.05 -0.10
Satisfaction with Sup. 0.00 0.02 .10* -.13** .47** -0.16 -0.20
OCB-O .28** .14** .19** 0.03 .12** .11* .71**
OCB-I .21** .32** .20** -0.02 .11* 0.01 .39**
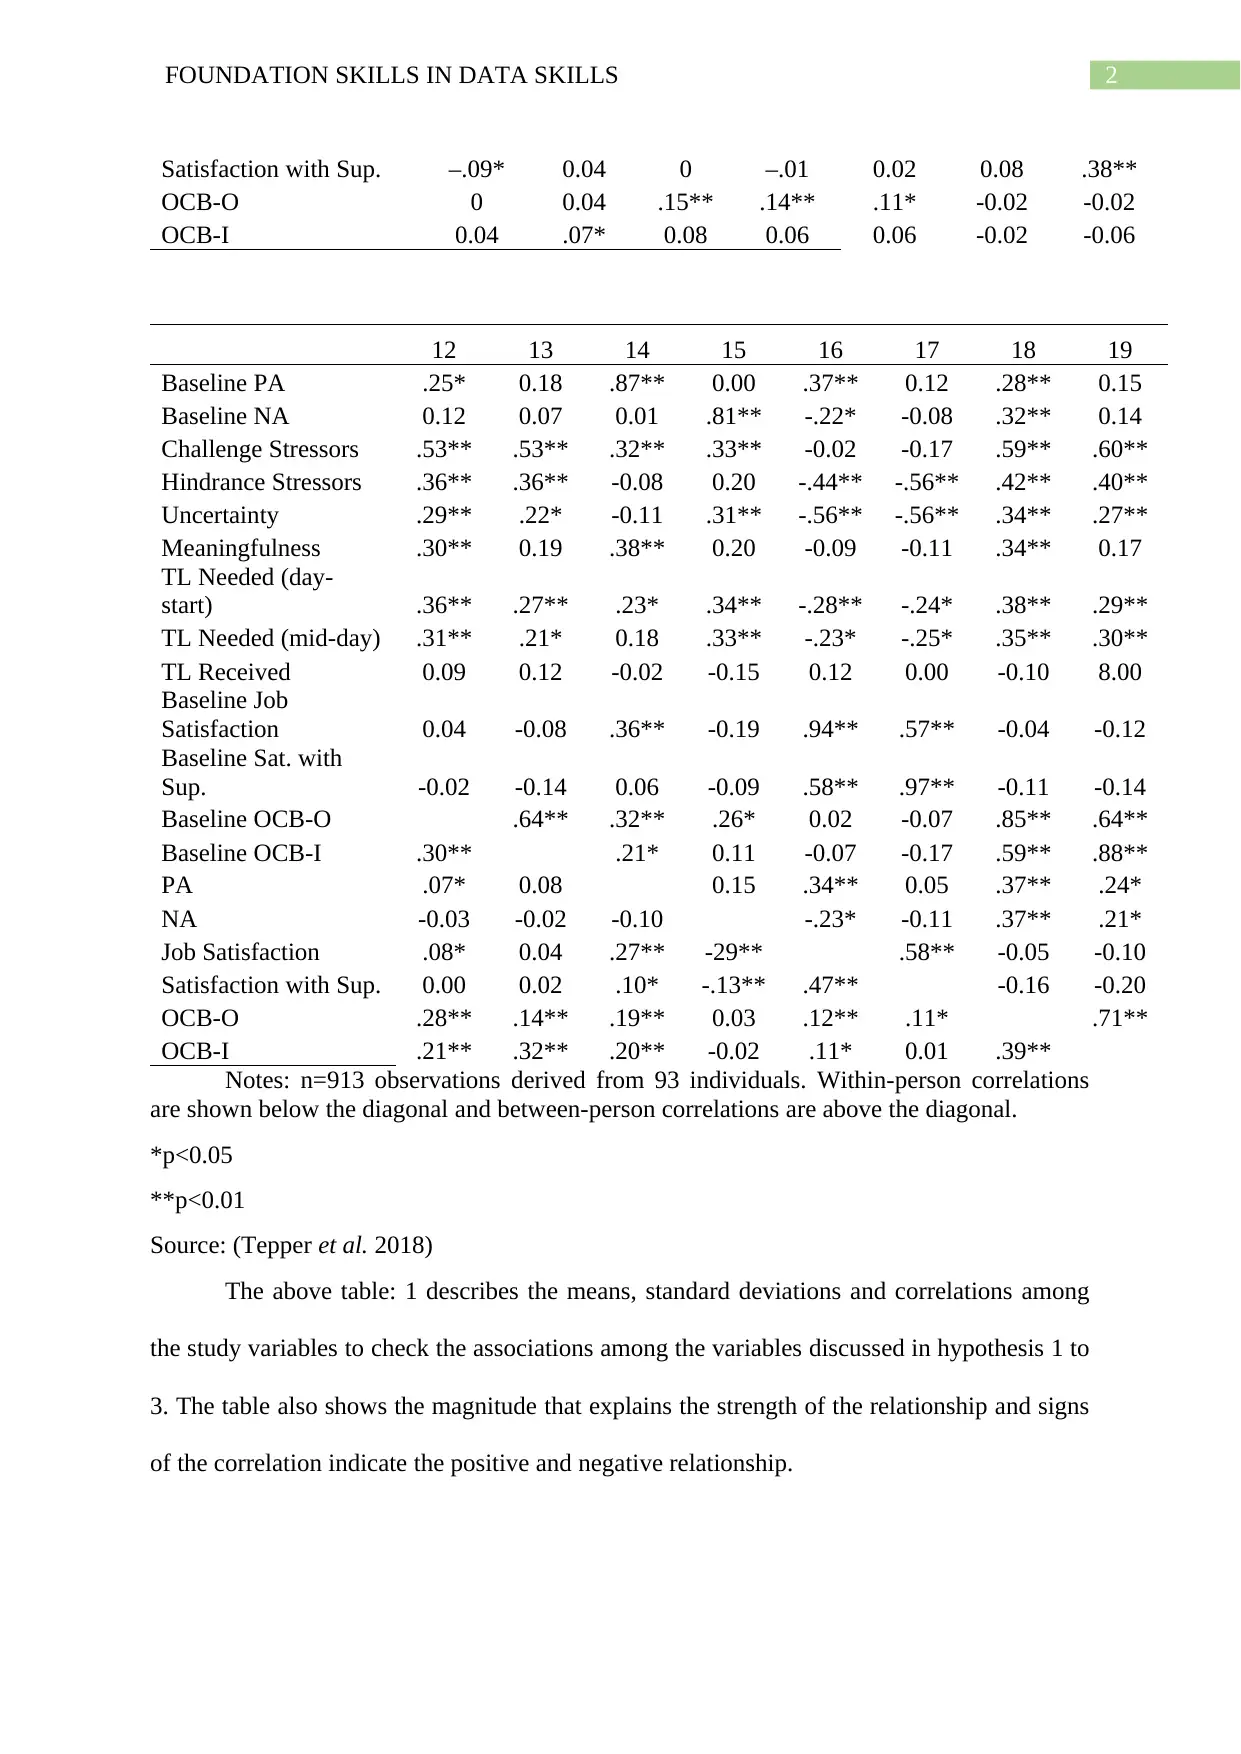
Notes: n=913 observations derived from 93 individuals. Within-person correlations
are shown below the diagonal and between-person correlations are above the diagonal.
*p<0.05
**p<0.01
Source: (Tepper et al. 2018)
The above table: 1 describes the means, standard deviations and correlations among
the study variables to check the associations among the variables discussed in hypothesis 1 to
3. The table also shows the magnitude that explains the strength of the relationship and signs
of the correlation indicate the positive and negative relationship.
Satisfaction with Sup. –.09* 0.04 0 –.01 0.02 0.08 .38**
OCB-O 0 0.04 .15** .14** .11* -0.02 -0.02
OCB-I 0.04 .07* 0.08 0.06 0.06 -0.02 -0.06
12 13 14 15 16 17 18 19
Baseline PA .25* 0.18 .87** 0.00 .37** 0.12 .28** 0.15
Baseline NA 0.12 0.07 0.01 .81** -.22* -0.08 .32** 0.14
Challenge Stressors .53** .53** .32** .33** -0.02 -0.17 .59** .60**
Hindrance Stressors .36** .36** -0.08 0.20 -.44** -.56** .42** .40**
Uncertainty .29** .22* -0.11 .31** -.56** -.56** .34** .27**
Meaningfulness .30** 0.19 .38** 0.20 -0.09 -0.11 .34** 0.17
TL Needed (day-
start) .36** .27** .23* .34** -.28** -.24* .38** .29**
TL Needed (mid-day) .31** .21* 0.18 .33** -.23* -.25* .35** .30**
TL Received 0.09 0.12 -0.02 -0.15 0.12 0.00 -0.10 8.00
Baseline Job
Satisfaction 0.04 -0.08 .36** -0.19 .94** .57** -0.04 -0.12
Baseline Sat. with
Sup. -0.02 -0.14 0.06 -0.09 .58** .97** -0.11 -0.14
Baseline OCB-O .64** .32** .26* 0.02 -0.07 .85** .64**
Baseline OCB-I .30** .21* 0.11 -0.07 -0.17 .59** .88**
PA .07* 0.08 0.15 .34** 0.05 .37** .24*
NA -0.03 -0.02 -0.10 -.23* -0.11 .37** .21*
Job Satisfaction .08* 0.04 .27** -29** .58** -0.05 -0.10
Satisfaction with Sup. 0.00 0.02 .10* -.13** .47** -0.16 -0.20
OCB-O .28** .14** .19** 0.03 .12** .11* .71**
OCB-I .21** .32** .20** -0.02 .11* 0.01 .39**
Notes: n=913 observations derived from 93 individuals. Within-person correlations
are shown below the diagonal and between-person correlations are above the diagonal.
*p<0.05
**p<0.01
Source: (Tepper et al. 2018)
The above table: 1 describes the means, standard deviations and correlations among
the study variables to check the associations among the variables discussed in hypothesis 1 to
3. The table also shows the magnitude that explains the strength of the relationship and signs
of the correlation indicate the positive and negative relationship.
⊘ This is a preview!⊘
Do you want full access?
Subscribe today to unlock all pages.
Trusted by 1+ million students worldwide
3FOUNDATION SKILLS IN DATA SKILLS
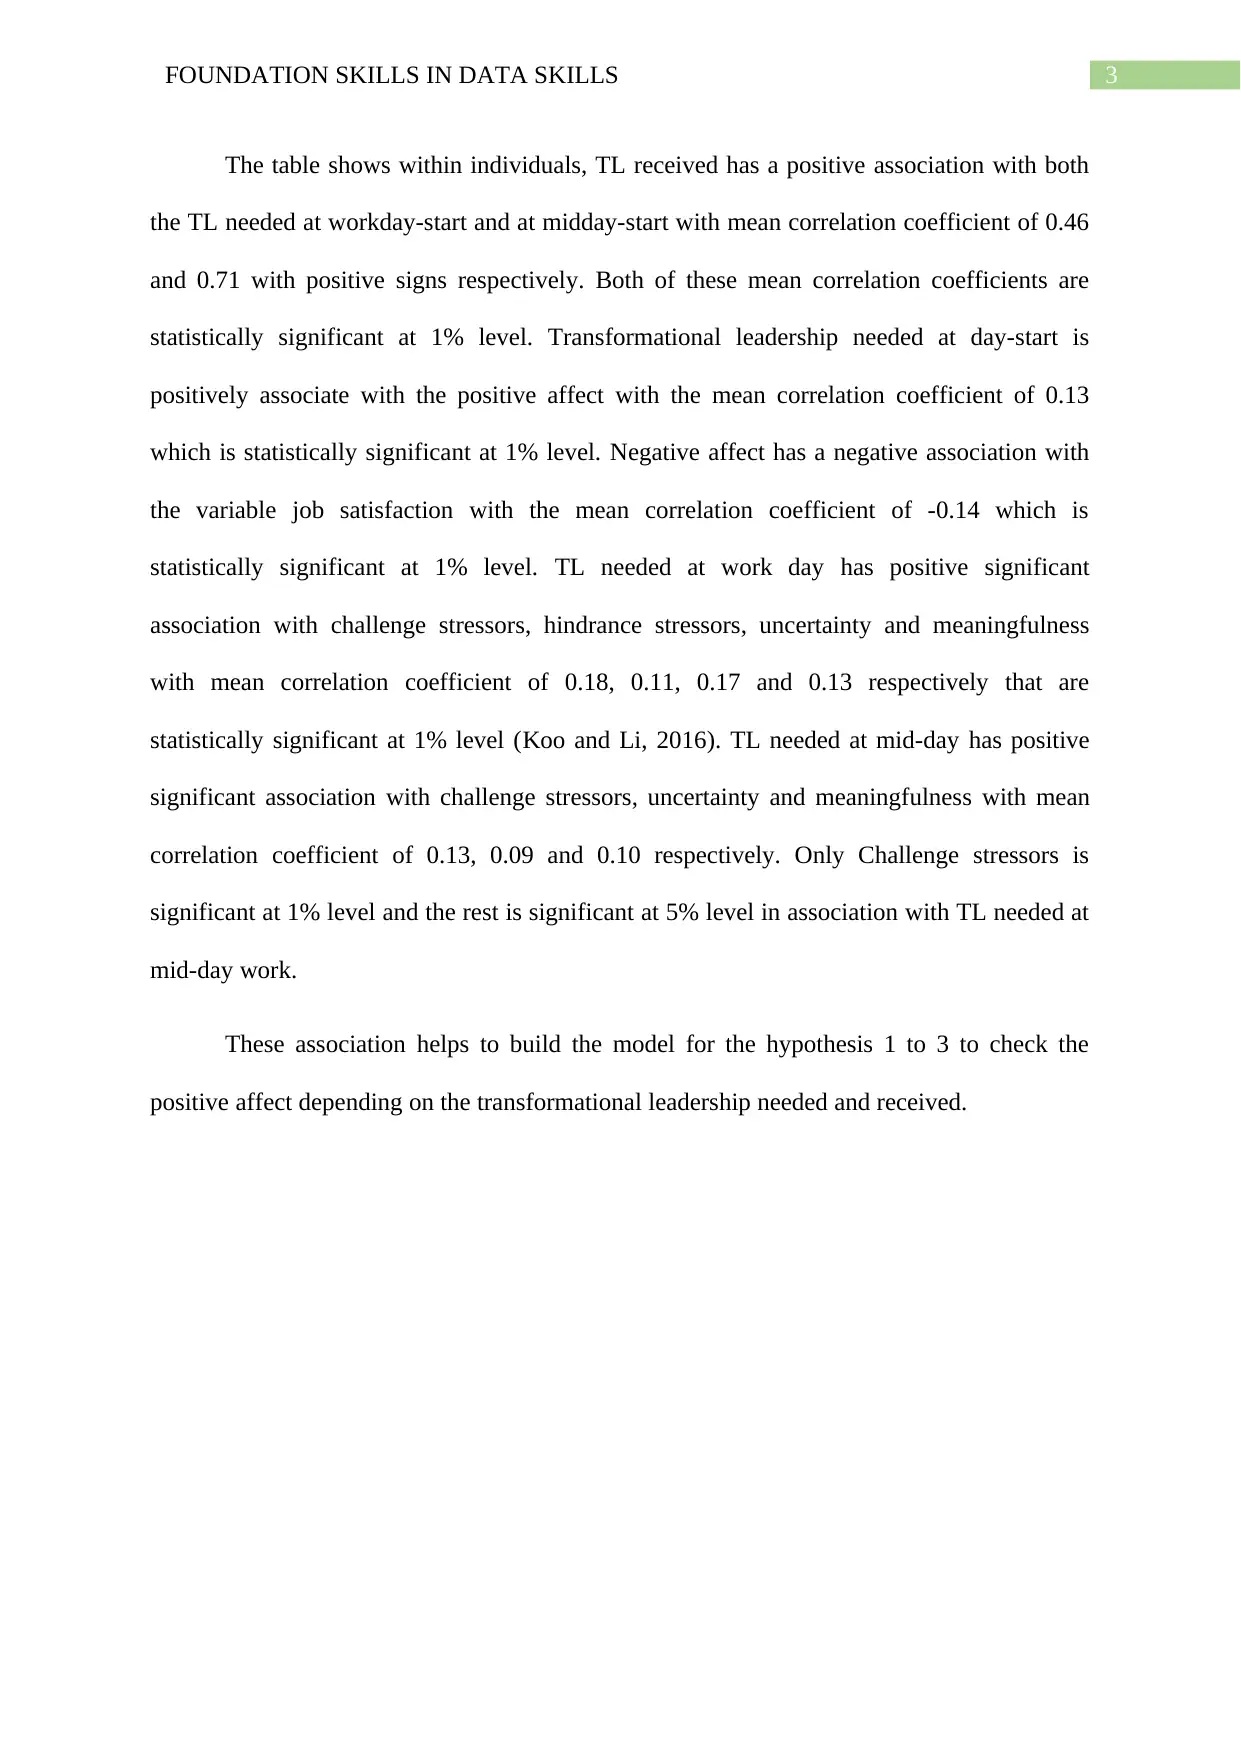
The table shows within individuals, TL received has a positive association with both
the TL needed at workday-start and at midday-start with mean correlation coefficient of 0.46
and 0.71 with positive signs respectively. Both of these mean correlation coefficients are
statistically significant at 1% level. Transformational leadership needed at day-start is
positively associate with the positive affect with the mean correlation coefficient of 0.13
which is statistically significant at 1% level. Negative affect has a negative association with
the variable job satisfaction with the mean correlation coefficient of -0.14 which is
statistically significant at 1% level. TL needed at work day has positive significant
association with challenge stressors, hindrance stressors, uncertainty and meaningfulness
with mean correlation coefficient of 0.18, 0.11, 0.17 and 0.13 respectively that are
statistically significant at 1% level (Koo and Li, 2016). TL needed at mid-day has positive
significant association with challenge stressors, uncertainty and meaningfulness with mean
correlation coefficient of 0.13, 0.09 and 0.10 respectively. Only Challenge stressors is
significant at 1% level and the rest is significant at 5% level in association with TL needed at
mid-day work.
These association helps to build the model for the hypothesis 1 to 3 to check the
positive affect depending on the transformational leadership needed and received.
Paraphrase This Document
Need a fresh take? Get an instant paraphrase of this document with our AI Paraphraser
4FOUNDATION SKILLS IN DATA SKILLS
Reference:
Tepper, B.J., Dimotakis, N., Lambert, L.S., Koopman, J., Matta, F.K., Man Park, H. and Goo,
W., 2018. Examining Follower Responses to Transformational Leadership from a Dynamic,
Person–Environment Fit Perspective. Academy of Management Journal, 61(4), pp.1343-
1368.
Koo, T.K. and Li, M.Y., 2016. A guideline of selecting and reporting intraclass correlation
coefficients for reliability research. Journal of chiropractic medicine, 15(2), pp.155-163.
1 out of 5
Related Documents


Your All-in-One AI-Powered Toolkit for Academic Success.
+13062052269
info@desklib.com
Available 24*7 on WhatsApp / Email
![[object Object]](/_next/static/media/star-bottom.7253800d.svg)
Unlock your academic potential
© 2024 | Zucol Services PVT LTD | All rights reserved.