Analysis of VAS Results at Rest and During Breath in Three Groups

Verified

Added on  2021/10/03

|35
|7068
|71
Report
AI Summary
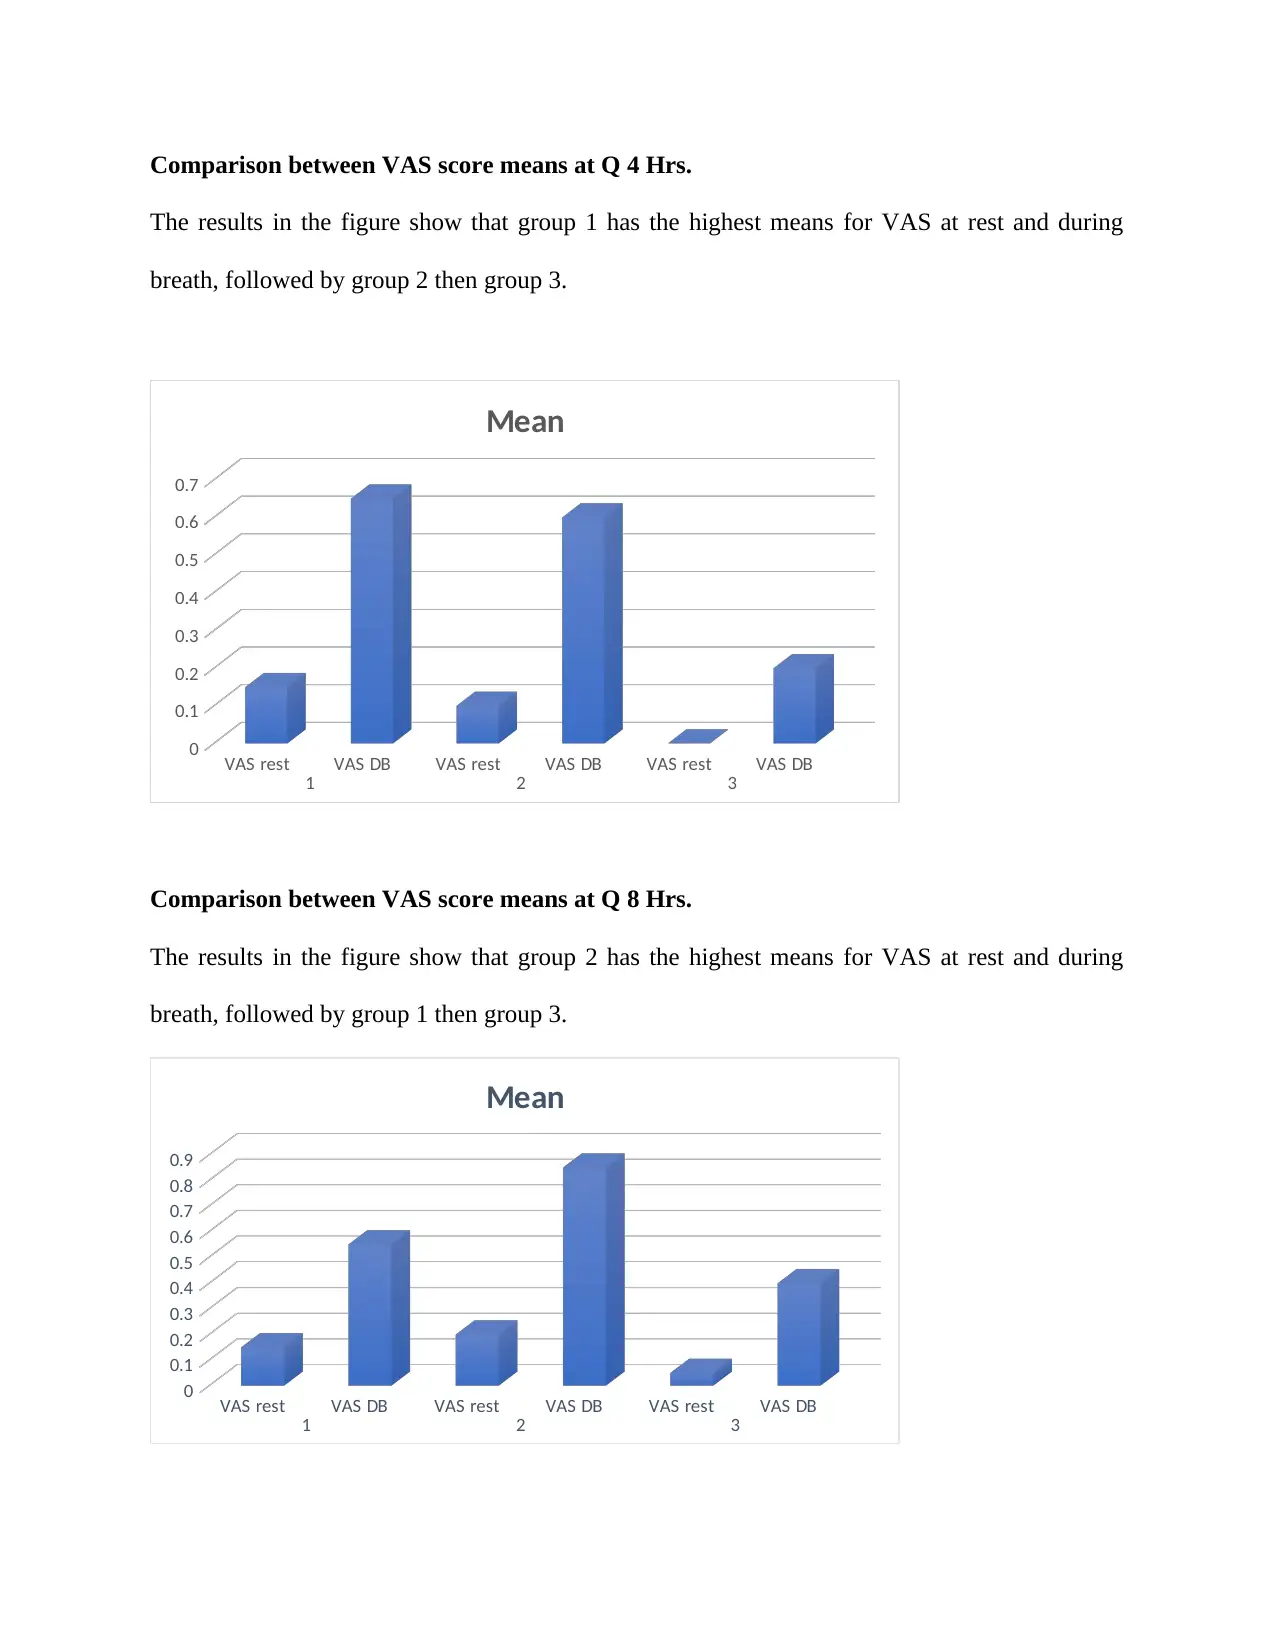
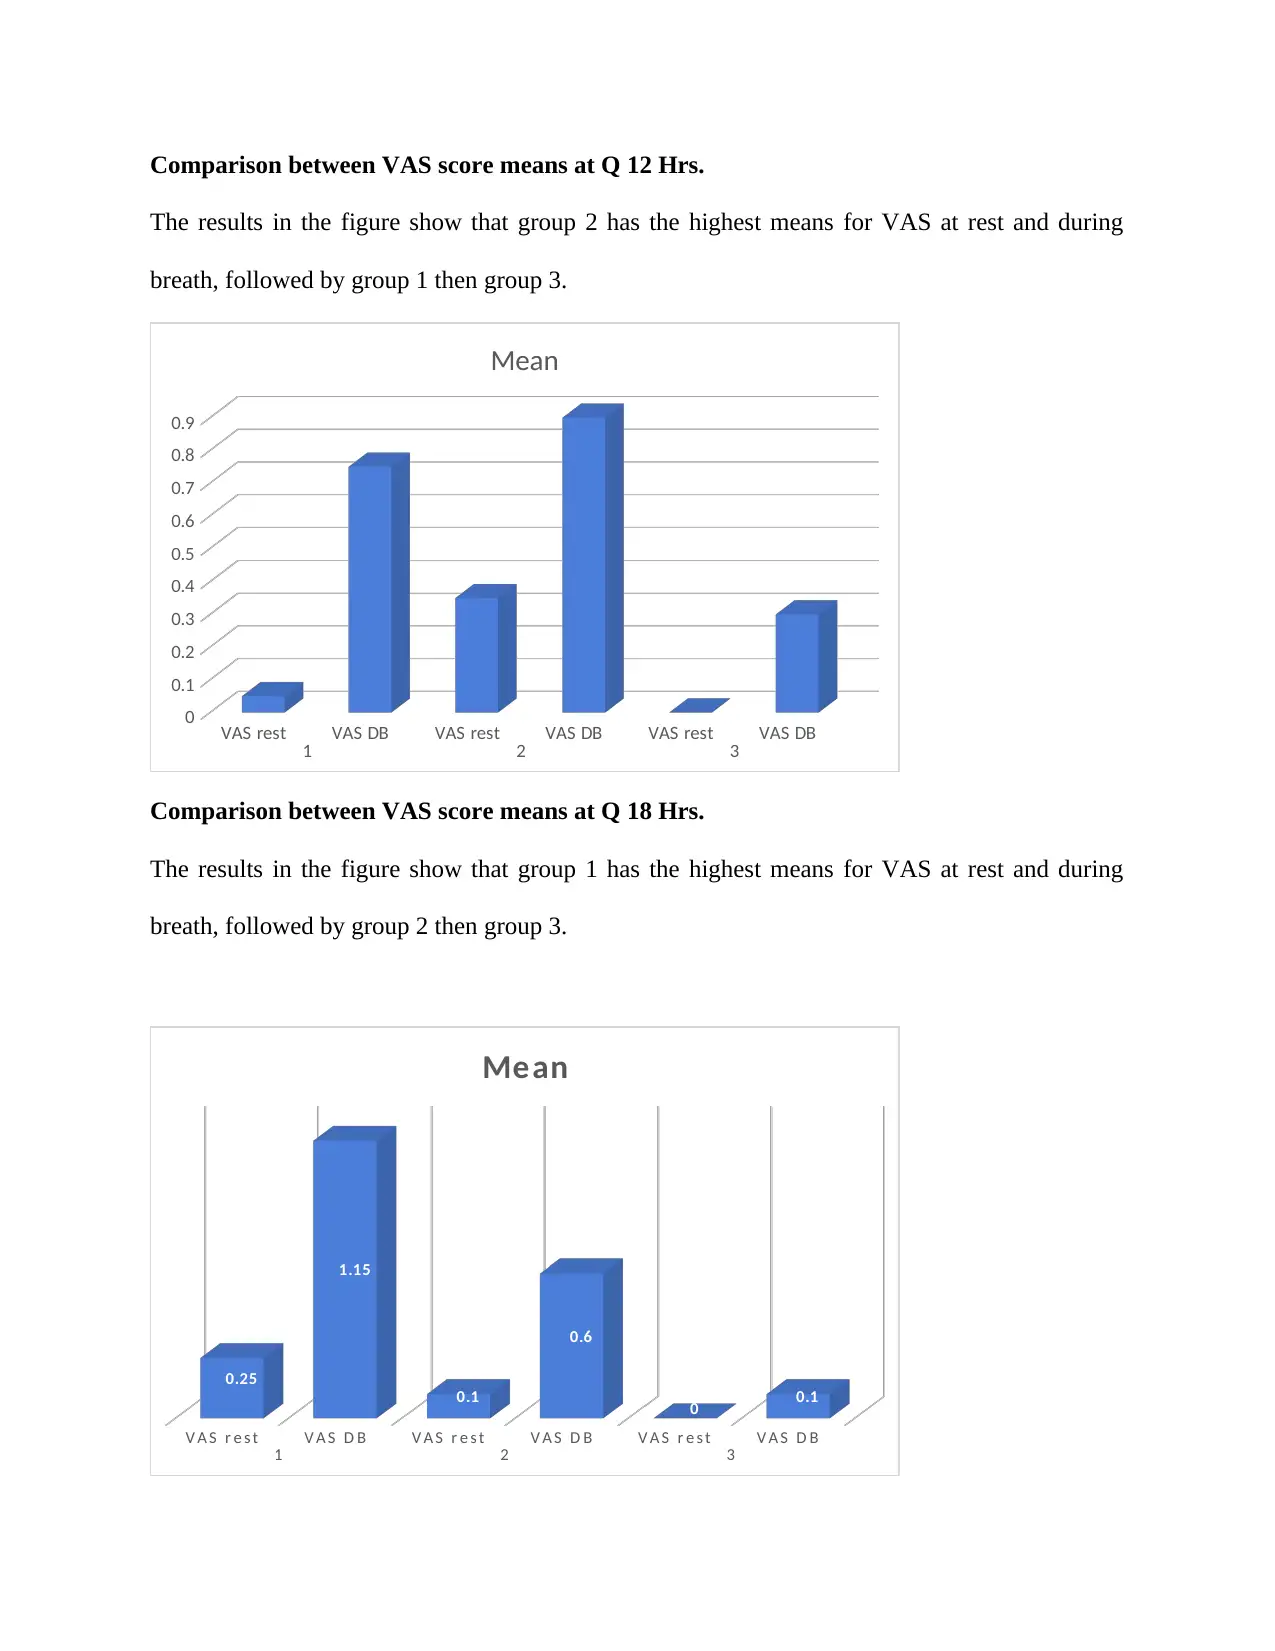
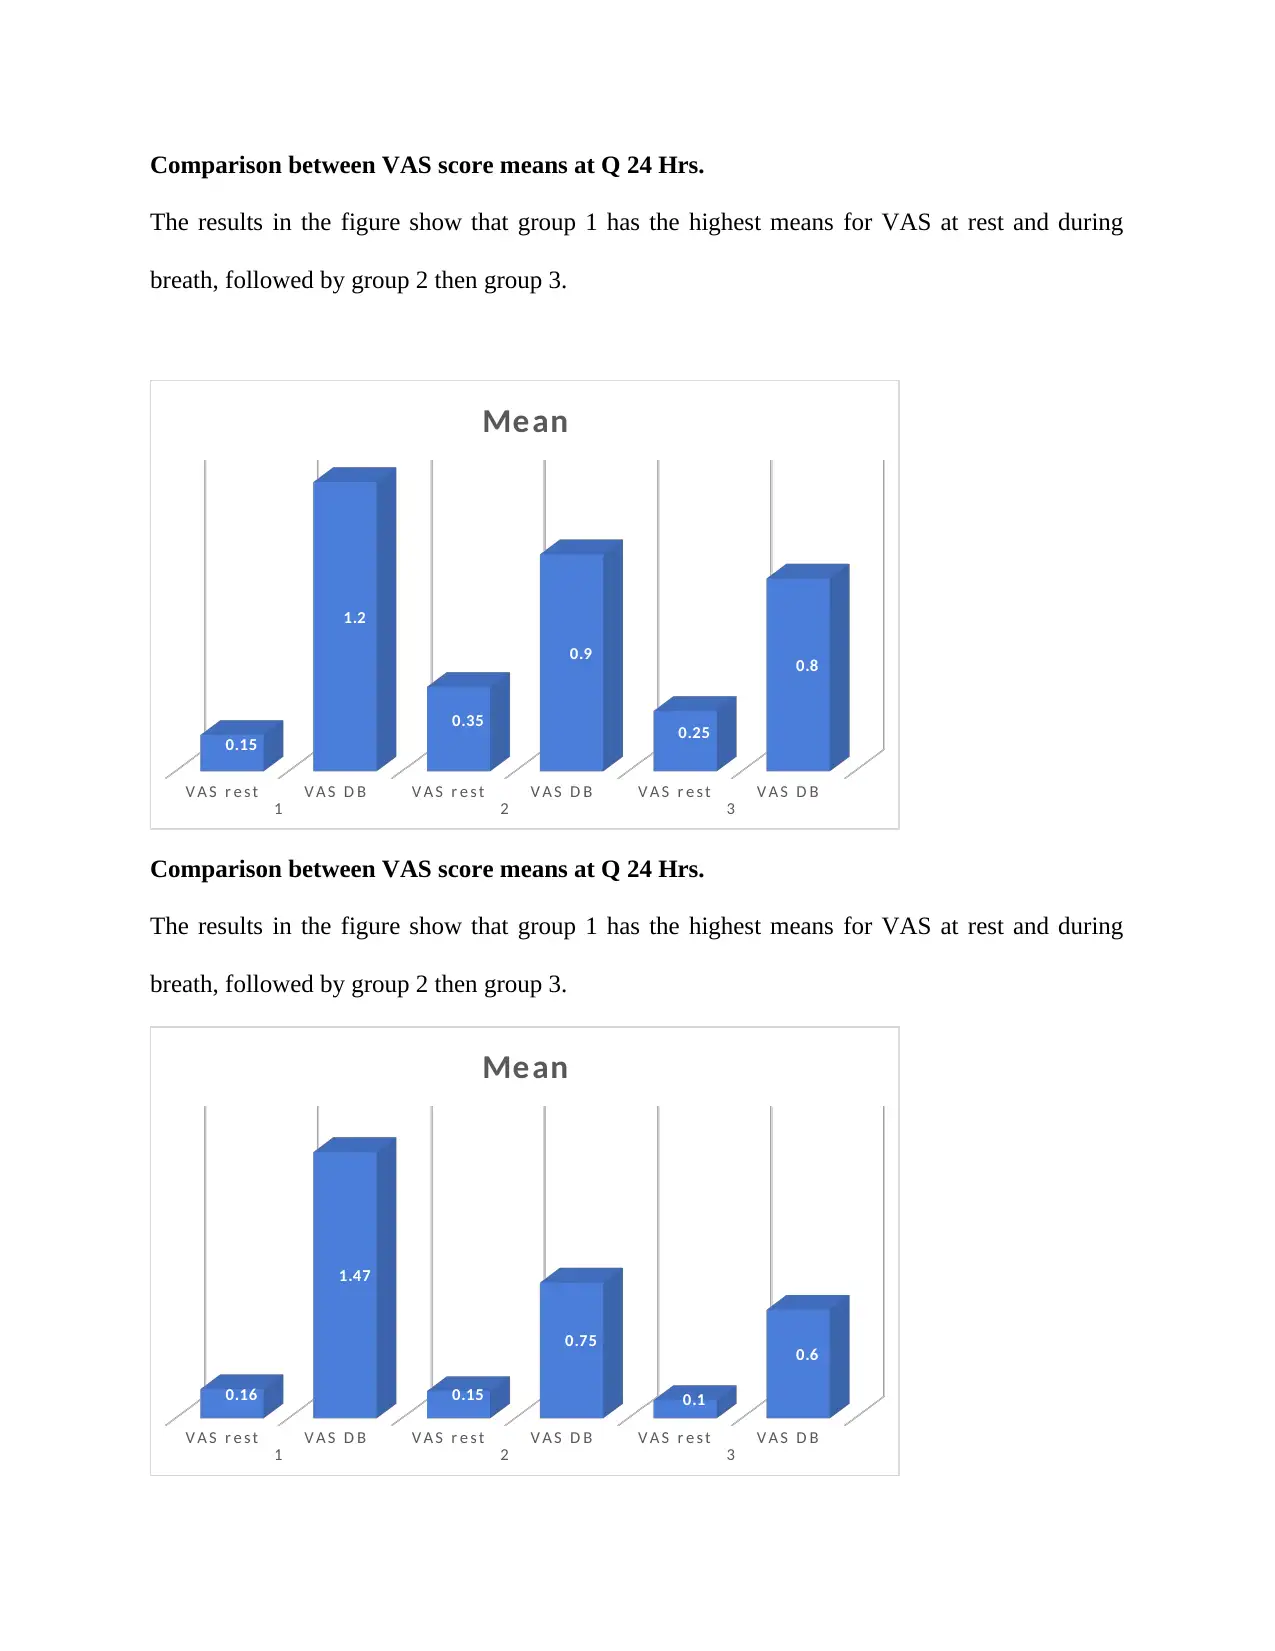
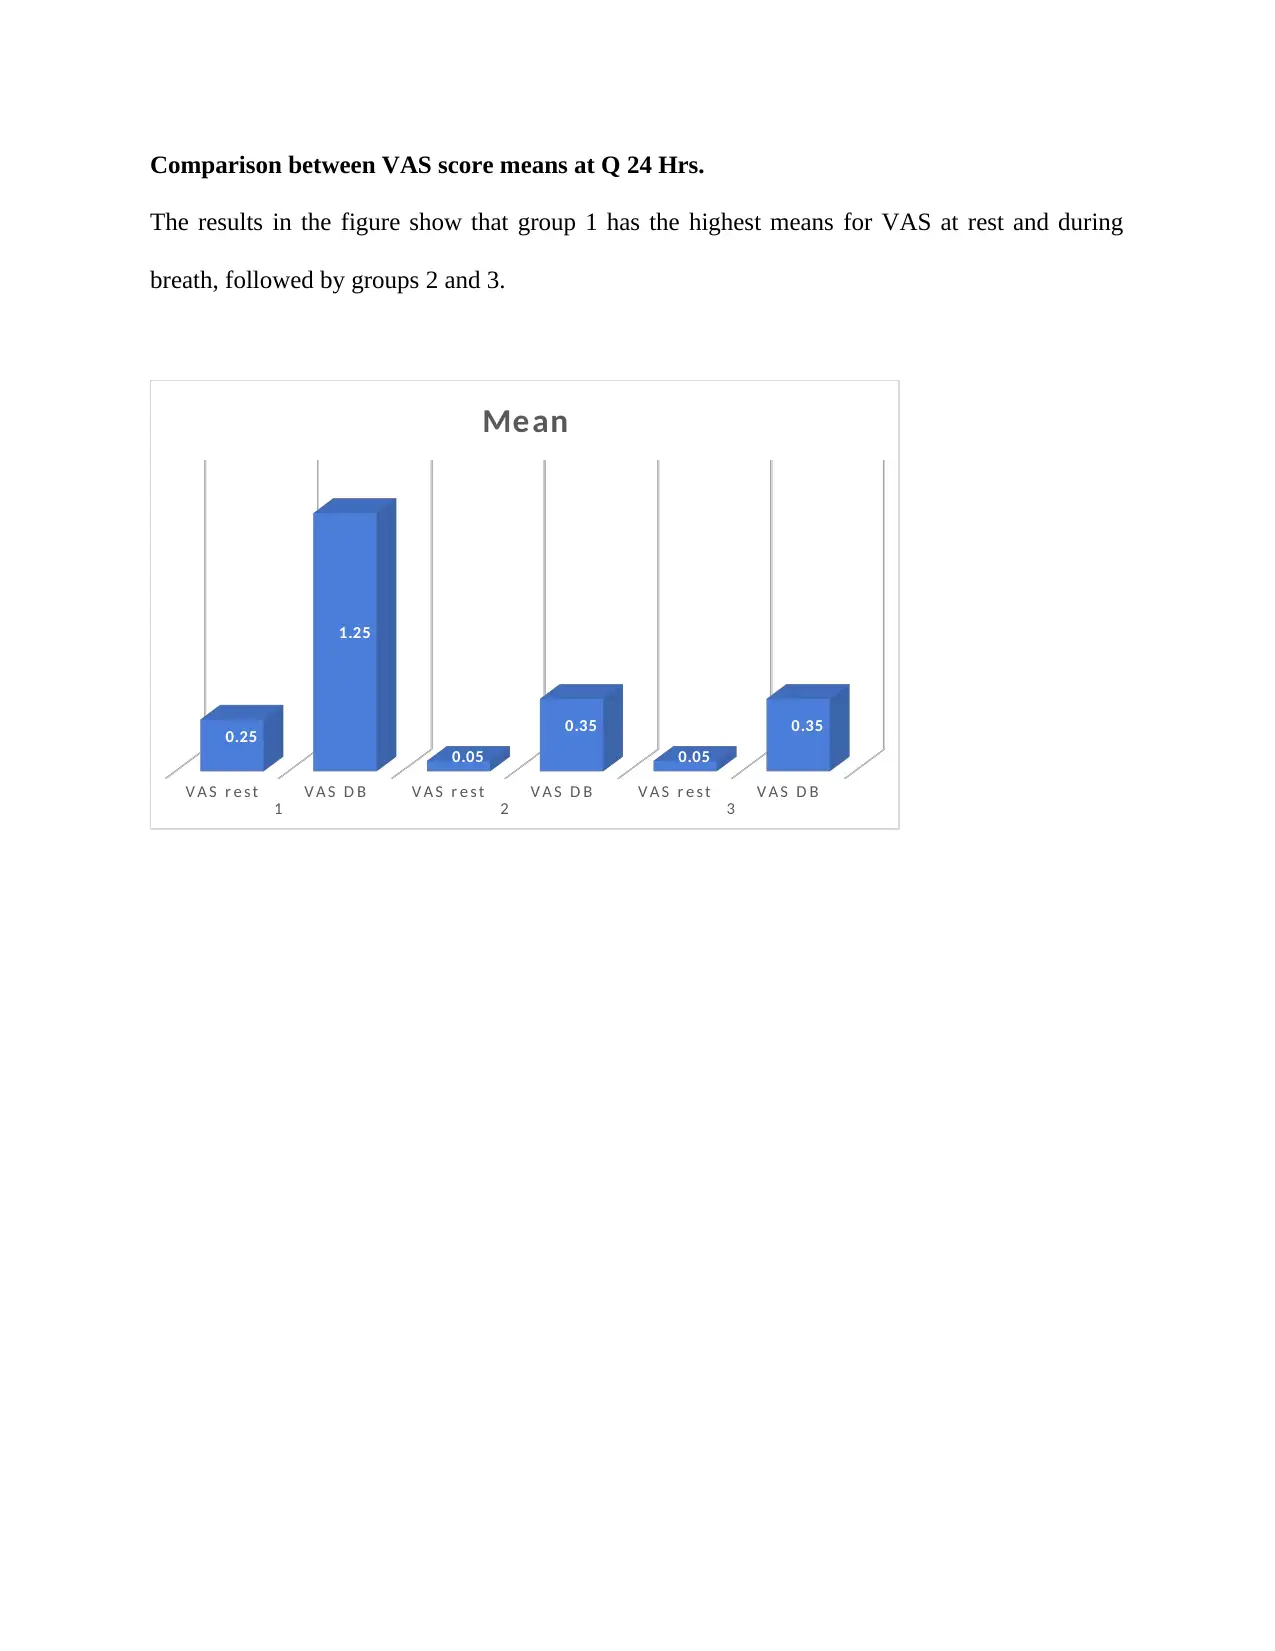
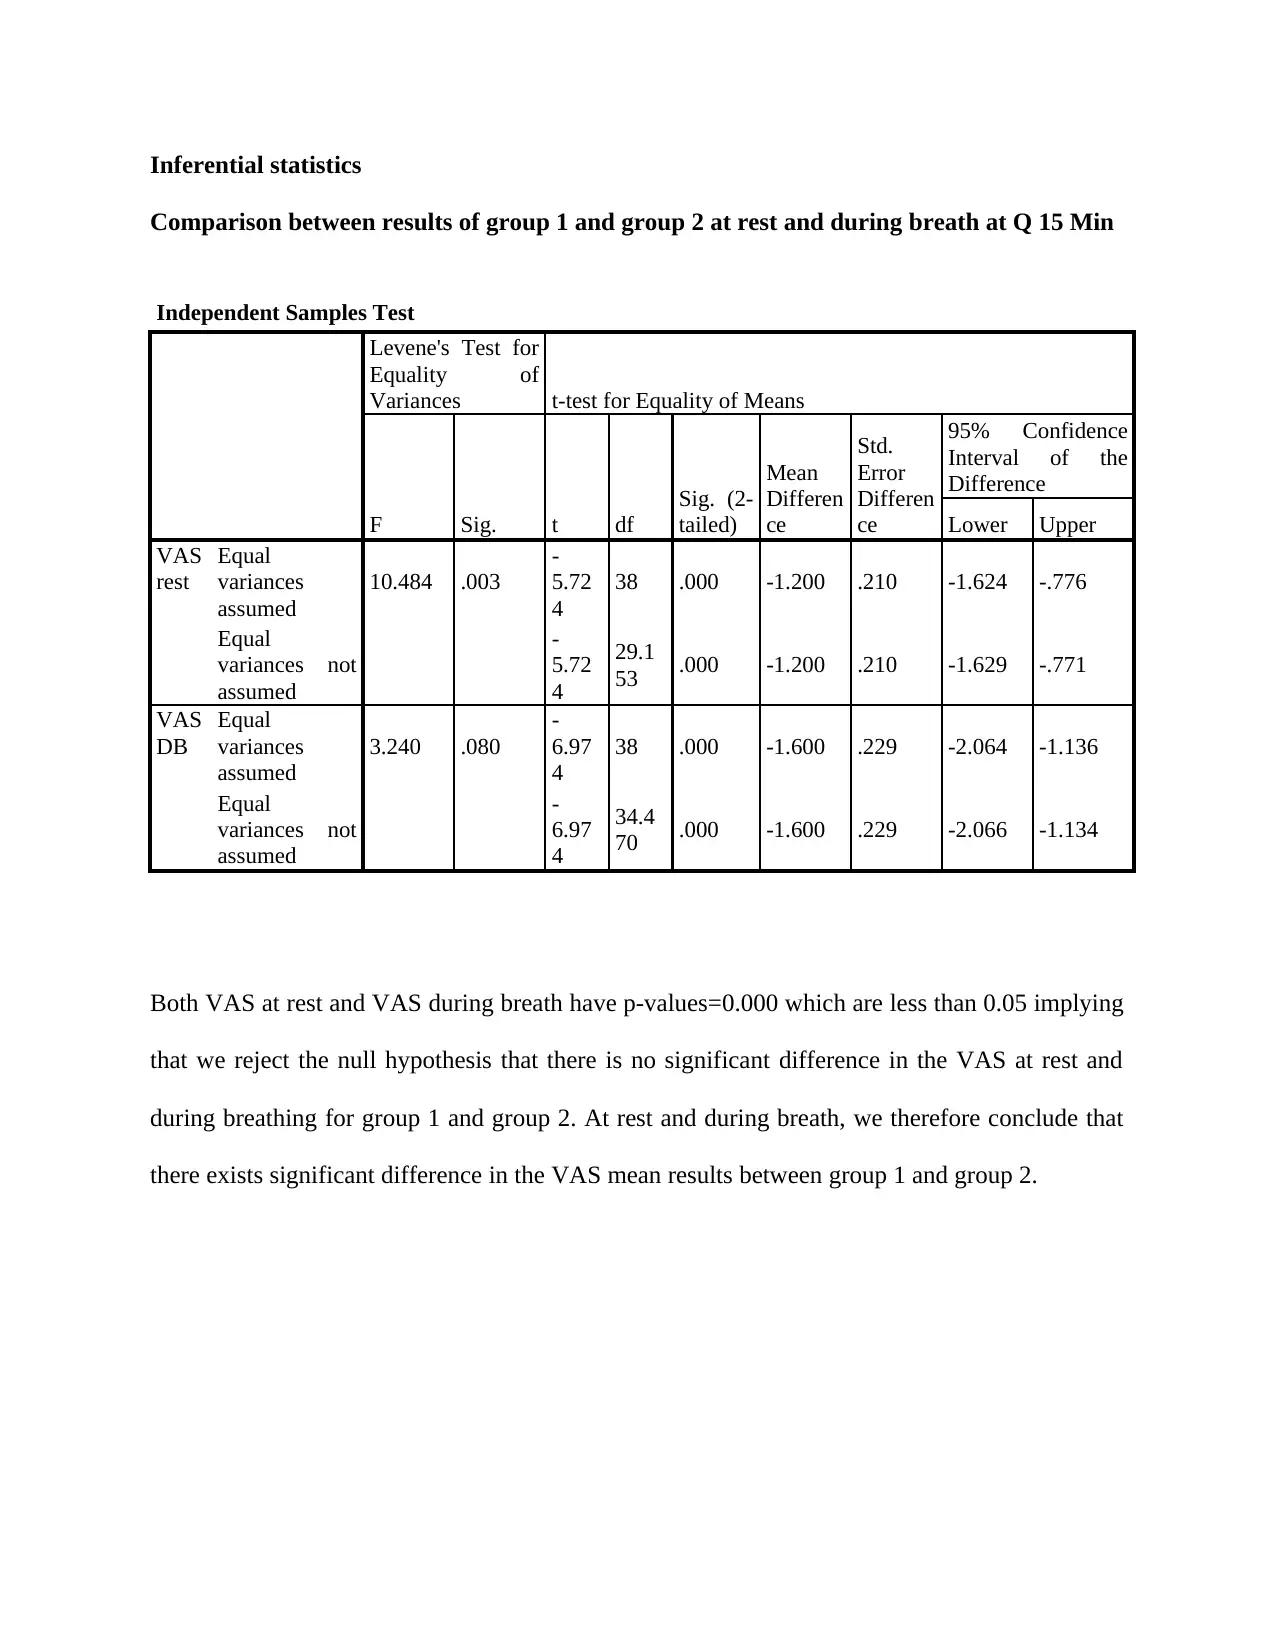
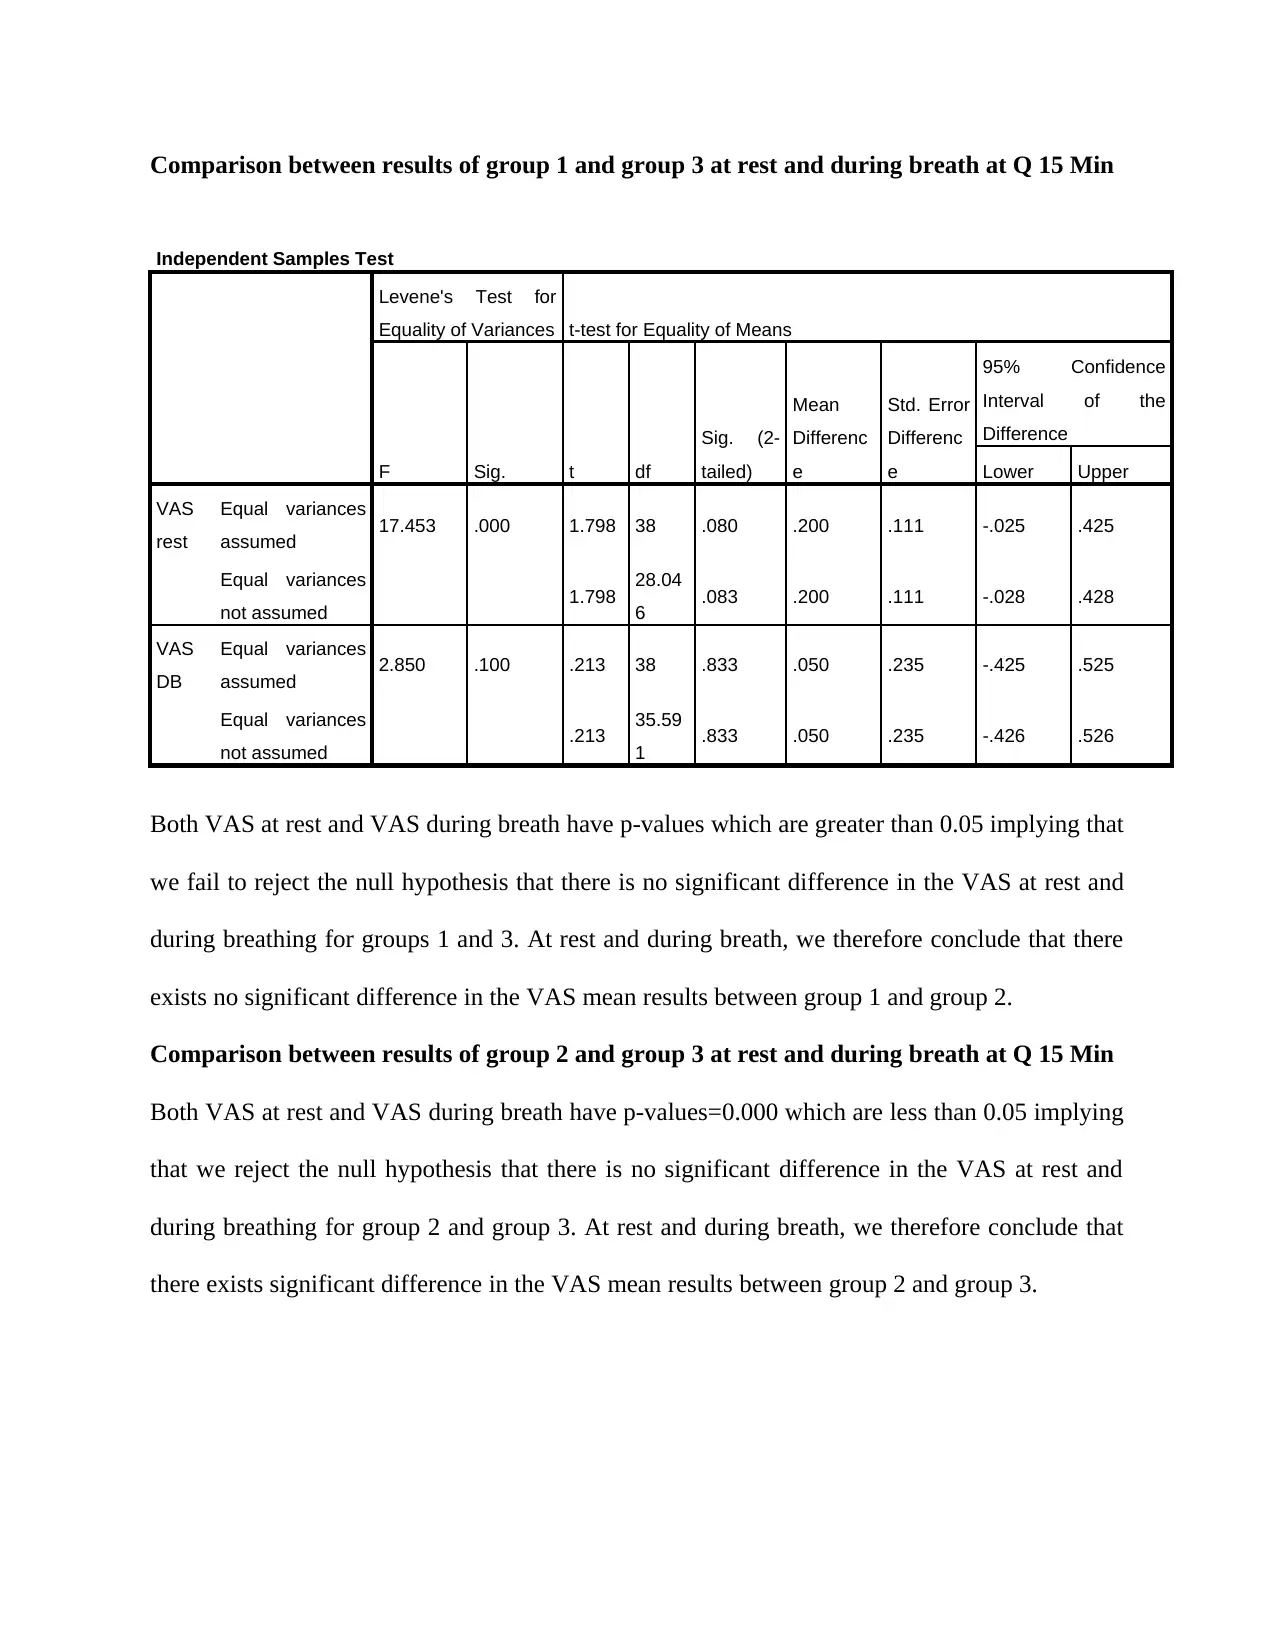
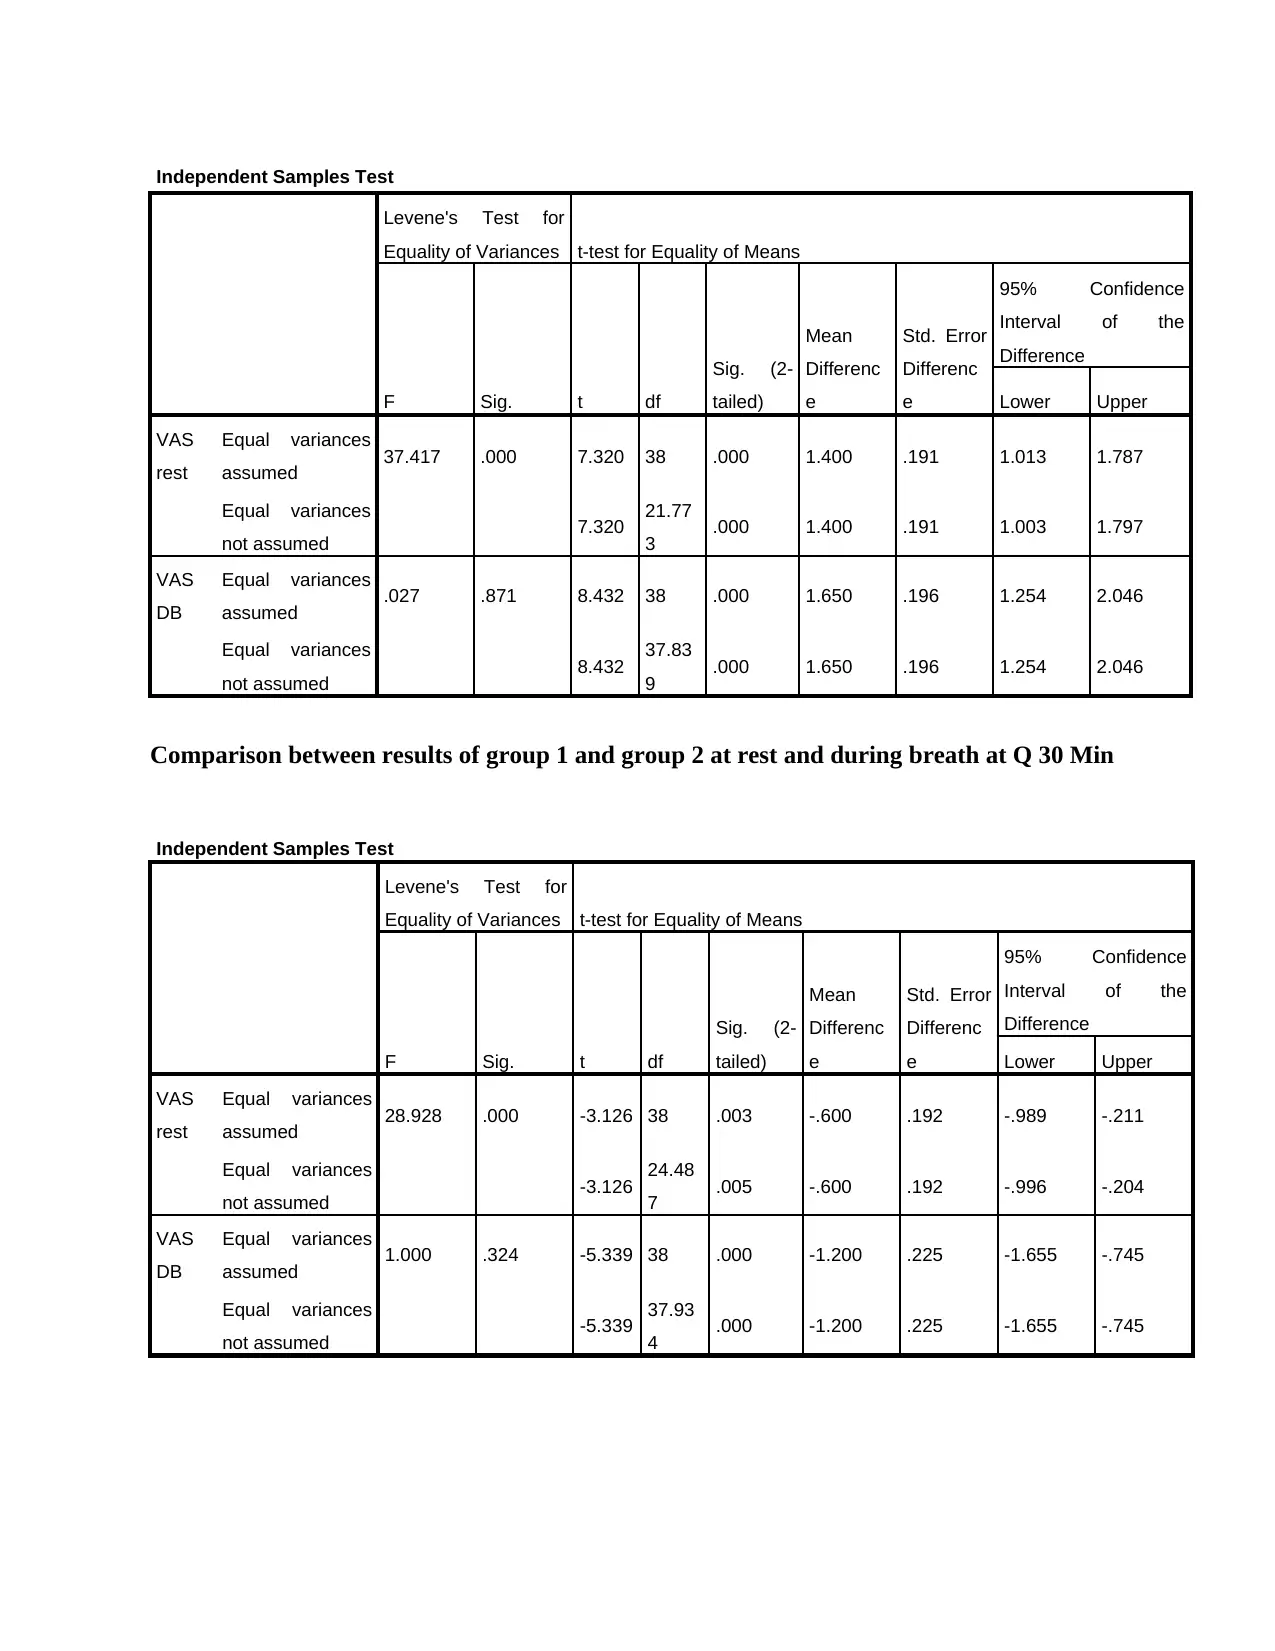
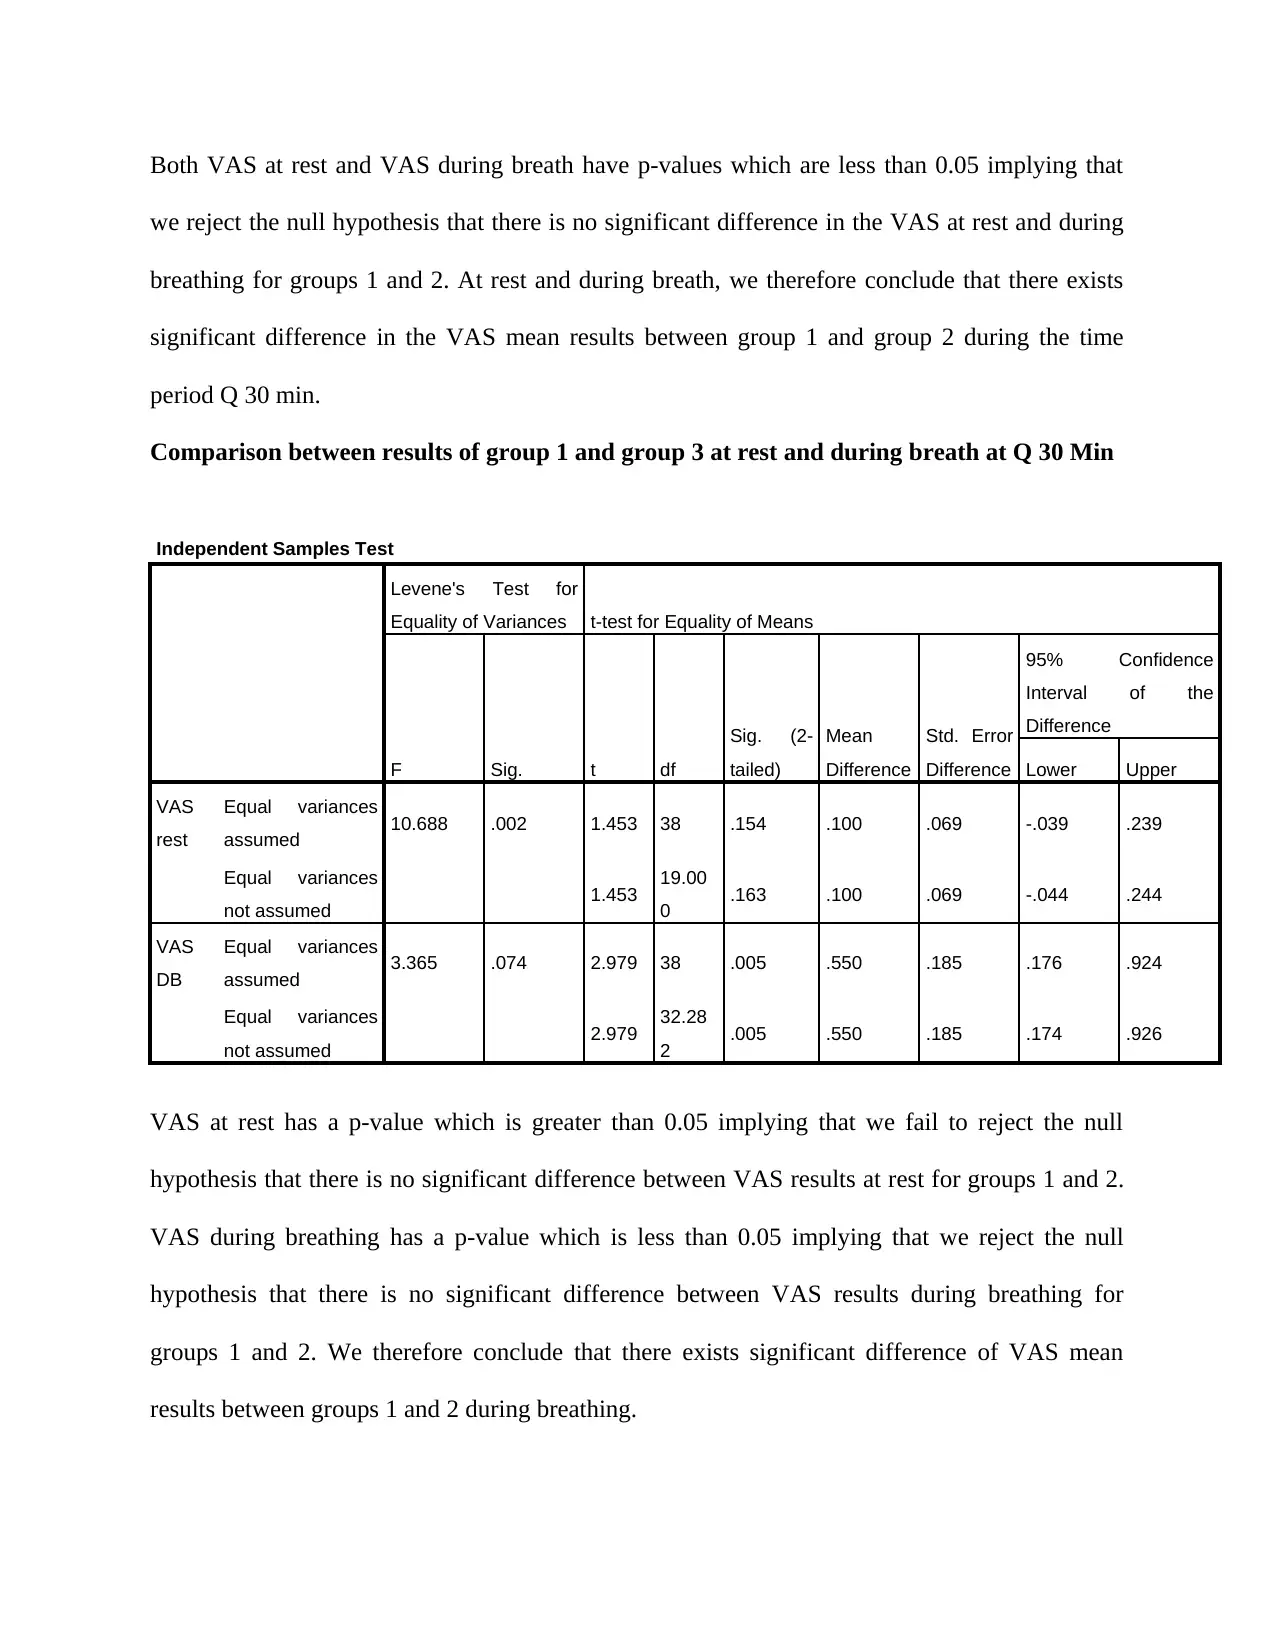
This research report investigates the comparison of Visual Analogue Scale (VAS) results at rest and during breath across three groups. The study employed descriptive statistics and independent samples t-tests to analyze the data. The research question focused on identifying differences in VAS results among the groups, guided by the hypothesis that such differences exist. The analysis compared VAS score means at various time intervals (Q 15 min, Q 30 min, Q 45 min, Q 60 min, Q 2 Hrs, Q 4 Hrs, Q 8 Hrs, Q 12 Hrs, Q 18 Hrs, and Q 24 Hrs), revealing that group 2 generally exhibited the highest mean VAS scores at rest and during breath, followed by group 1 and then group 3, although there were some variations at specific time points. Inferential statistics, including independent samples t-tests, were used to compare the results between group pairs (1 & 2, 1 & 3, and 2 & 3). The analysis revealed significant differences in VAS scores between groups 1 and 2, and between groups 2 and 3 at most time points, as indicated by p-values less than 0.05. However, the comparison between groups 1 and 3 showed no significant differences in many instances. The report presents detailed statistical findings, including p-values, t-test results, and mean differences, to support the conclusions regarding the significant and non-significant differences in VAS scores between the studied groups.
Document Page
Introduction.
The aim of this research study was to investigate the comparison between VAS results at rest and
during breath for three groups; 1, 2 and 3. To make such comparisons, descriptive statistics and
independent samples t tests were employed.
We tried to answer the research question on whether there existed differences in VAS results at
rest and during breath among the three groups under study.
The hypothesis that guided our study was;
H 0 :Thereis no difference VAS results at restduring breath amongthe three groups .
H 1:There is differenceVAS results at rest during breath among thethree gro ups .
tabler-icon-diamond-filled.svg

Paraphrase This Document

Need a fresh take? Get an instant paraphrase of this document with our AI Paraphraser
Document Page
Descriptive statistics
Comparison between VAS score means at Q 15 min
The figure below shows the comparison between VAS score means at rest and during breath for
groups 1, 2 and 3 for Q 15 minutes. The results show that group 2 has the highest means for VAS
at rest and during breath, followed by group 1 then group 3.
Comparison between VAS score means at Q 30 min
The results in the figure show that group 2 has the highest means for VAS at rest and during
breath, followed by group 1 then group 3.
VAS rest VAS DB VAS rest VAS DB VAS rest VAS DB
1 2 3
0
0.5
1
1.5
2
2.5
Comparison between VAS score
means
group
mean
Document Page
V A S r e s t V A S D B V A S r e s t V A S D B V A S r e s t V A S D B
1 2 3
0.1
0.8 0.7
2
0
0.25
Group
mean
Comparison between VAS score means at Q 45 min
The results in the figure show that group 2 has the highest means for VAS at rest and during
breath, followed by group 1 then group 3.
V A S r e s t V A S D B V A S r e s t V A S D B V A S r e s t V A S D B
1 2 3
0.05
0.4 0.5
1.75
0
0.2
Mean
group
Mean
Document Page
Comparison between VAS score means at Q 60 min
VAS rest VAS DB VAS rest VAS DB VAS rest VAS DB
1 2 3
0.2
0.55 0.45
1.75
0.15
0.5
Mean
Mean
The results in the figure show that group 2 has the highest means for VAS at rest and during
breath, followed by group 1 then group 3.
Comparison between VAS score means at Q 2 Hrs.
V A S r e s t V A S D B V A S r e s t V A S D B V A S r e s t V A S D B
1 2 3
0.05
0.6
0.1
1
0.05
0.3
Mean
The results in the figure show that group 2 has the highest means for VAS at rest and during
breath, followed by group 1 then group 3.
tabler-icon-diamond-filled.svg

Paraphrase This Document

Need a fresh take? Get an instant paraphrase of this document with our AI Paraphraser
Document Page
Comparison between VAS score means at Q 4 Hrs.
The results in the figure show that group 1 has the highest means for VAS at rest and during
breath, followed by group 2 then group 3.
VAS rest VAS DB VAS rest VAS DB VAS rest VAS DB
1 2 3
0
0.1
0.2
0.3
0.4
0.5
0.6
0.7
Mean
Comparison between VAS score means at Q 8 Hrs.
The results in the figure show that group 2 has the highest means for VAS at rest and during
breath, followed by group 1 then group 3.
VAS rest VAS DB VAS rest VAS DB VAS rest VAS DB
1 2 3
0
0.1
0.2
0.3
0.4
0.5
0.6
0.7
0.8
0.9
Mean
Document Page
Comparison between VAS score means at Q 12 Hrs.
The results in the figure show that group 2 has the highest means for VAS at rest and during
breath, followed by group 1 then group 3.
VAS rest VAS DB VAS rest VAS DB VAS rest VAS DB
1 2 3
0
0.1
0.2
0.3
0.4
0.5
0.6
0.7
0.8
0.9
Mean
Comparison between VAS score means at Q 18 Hrs.
The results in the figure show that group 1 has the highest means for VAS at rest and during
breath, followed by group 2 then group 3.
V A S r e s t V A S D B V A S r e s t V A S D B V A S r e s t V A S D B
1 2 3
0.25
1.15
0.1
0.6
0 0.1
Mean
Document Page
Comparison between VAS score means at Q 24 Hrs.
The results in the figure show that group 1 has the highest means for VAS at rest and during
breath, followed by group 2 then group 3.
V A S r e s t V A S D B V A S r e s t V A S D B V A S r e s t V A S D B
1 2 3
0.15
1.2
0.35
0.9
0.25
0.8
Mean
Comparison between VAS score means at Q 24 Hrs.
The results in the figure show that group 1 has the highest means for VAS at rest and during
breath, followed by group 2 then group 3.
V A S r e s t V A S D B V A S r e s t V A S D B V A S r e s t V A S D B
1 2 3
0.16
1.47
0.15
0.75
0.1
0.6
Mean
tabler-icon-diamond-filled.svg

Paraphrase This Document

Need a fresh take? Get an instant paraphrase of this document with our AI Paraphraser
Document Page
Comparison between VAS score means at Q 24 Hrs.
The results in the figure show that group 1 has the highest means for VAS at rest and during
breath, followed by groups 2 and 3.
V A S r e s t V A S D B V A S r e s t V A S D B V A S r e s t V A S D B
1 2 3
0.25
1.25
0.05
0.35
0.05
0.35
Mean
Document Page
Inferential statistics
Comparison between results of group 1 and group 2 at rest and during breath at Q 15 Min
Independent Samples Test
Levene's Test for
Equality of
Variances t-test for Equality of Means
F Sig. t df
Sig. (2-
tailed)
Mean
Differen
ce
Std.
Error
Differen
ce
95% Confidence
Interval of the
Difference
Lower Upper
VAS
rest
Equal
variances
assumed
10.484 .003
-
5.72
4
38 .000 -1.200 .210 -1.624 -.776
Equal
variances not
assumed
-
5.72
4
29.1
53 .000 -1.200 .210 -1.629 -.771
VAS
DB
Equal
variances
assumed
3.240 .080
-
6.97
4
38 .000 -1.600 .229 -2.064 -1.136
Equal
variances not
assumed
-
6.97
4
34.4
70 .000 -1.600 .229 -2.066 -1.134
Both VAS at rest and VAS during breath have p-values=0.000 which are less than 0.05 implying
that we reject the null hypothesis that there is no significant difference in the VAS at rest and
during breathing for group 1 and group 2. At rest and during breath, we therefore conclude that
there exists significant difference in the VAS mean results between group 1 and group 2.
Document Page
Comparison between results of group 1 and group 3 at rest and during breath at Q 15 Min
Independent Samples Test
Levene's Test for
Equality of Variances t-test for Equality of Means
F Sig. t df
Sig. (2-
tailed)
Mean
Differenc
e
Std. Error
Differenc
e
95% Confidence
Interval of the
Difference
Lower Upper
VAS
rest
Equal variances
assumed 17.453 .000 1.798 38 .080 .200 .111 -.025 .425
Equal variances
not assumed 1.798 28.04
6 .083 .200 .111 -.028 .428
VAS
DB
Equal variances
assumed 2.850 .100 .213 38 .833 .050 .235 -.425 .525
Equal variances
not assumed .213 35.59
1 .833 .050 .235 -.426 .526
Both VAS at rest and VAS during breath have p-values which are greater than 0.05 implying that
we fail to reject the null hypothesis that there is no significant difference in the VAS at rest and
during breathing for groups 1 and 3. At rest and during breath, we therefore conclude that there
exists no significant difference in the VAS mean results between group 1 and group 2.
Comparison between results of group 2 and group 3 at rest and during breath at Q 15 Min
Both VAS at rest and VAS during breath have p-values=0.000 which are less than 0.05 implying
that we reject the null hypothesis that there is no significant difference in the VAS at rest and
during breathing for group 2 and group 3. At rest and during breath, we therefore conclude that
there exists significant difference in the VAS mean results between group 2 and group 3.
tabler-icon-diamond-filled.svg

Paraphrase This Document

Need a fresh take? Get an instant paraphrase of this document with our AI Paraphraser
Document Page
Independent Samples Test
Levene's Test for
Equality of Variances t-test for Equality of Means
F Sig. t df
Sig. (2-
tailed)
Mean
Differenc
e
Std. Error
Differenc
e
95% Confidence
Interval of the
Difference
Lower Upper
VAS
rest
Equal variances
assumed 37.417 .000 7.320 38 .000 1.400 .191 1.013 1.787
Equal variances
not assumed 7.320 21.77
3 .000 1.400 .191 1.003 1.797
VAS
DB
Equal variances
assumed .027 .871 8.432 38 .000 1.650 .196 1.254 2.046
Equal variances
not assumed 8.432 37.83
9 .000 1.650 .196 1.254 2.046
Comparison between results of group 1 and group 2 at rest and during breath at Q 30 Min
Independent Samples Test
Levene's Test for
Equality of Variances t-test for Equality of Means
F Sig. t df
Sig. (2-
tailed)
Mean
Differenc
e
Std. Error
Differenc
e
95% Confidence
Interval of the
Difference
Lower Upper
VAS
rest
Equal variances
assumed 28.928 .000 -3.126 38 .003 -.600 .192 -.989 -.211
Equal variances
not assumed -3.126 24.48
7 .005 -.600 .192 -.996 -.204
VAS
DB
Equal variances
assumed 1.000 .324 -5.339 38 .000 -1.200 .225 -1.655 -.745
Equal variances
not assumed -5.339 37.93
4 .000 -1.200 .225 -1.655 -.745
Document Page
Both VAS at rest and VAS during breath have p-values which are less than 0.05 implying that
we reject the null hypothesis that there is no significant difference in the VAS at rest and during
breathing for groups 1 and 2. At rest and during breath, we therefore conclude that there exists
significant difference in the VAS mean results between group 1 and group 2 during the time
period Q 30 min.
Comparison between results of group 1 and group 3 at rest and during breath at Q 30 Min
Independent Samples Test
Levene's Test for
Equality of Variances t-test for Equality of Means
F Sig. t df
Sig. (2-
tailed)
Mean
Difference
Std. Error
Difference
95% Confidence
Interval of the
Difference
Lower Upper
VAS
rest
Equal variances
assumed 10.688 .002 1.453 38 .154 .100 .069 -.039 .239
Equal variances
not assumed 1.453 19.00
0 .163 .100 .069 -.044 .244
VAS
DB
Equal variances
assumed 3.365 .074 2.979 38 .005 .550 .185 .176 .924
Equal variances
not assumed 2.979 32.28
2 .005 .550 .185 .174 .926
VAS at rest has a p-value which is greater than 0.05 implying that we fail to reject the null
hypothesis that there is no significant difference between VAS results at rest for groups 1 and 2.
VAS during breathing has a p-value which is less than 0.05 implying that we reject the null
hypothesis that there is no significant difference between VAS results during breathing for
groups 1 and 2. We therefore conclude that there exists significant difference of VAS mean
results between groups 1 and 2 during breathing.
chevron_up_icon
1 out of 35
circle_padding
hide_on_mobile
zoom_out_icon
[object Object]