Financial Analysis Report: Dexter Plc, Philly Ltd, Sankrust Ltd

Verified

Added on  2021/02/22

|17
|4128
|107
Report
AI Summary
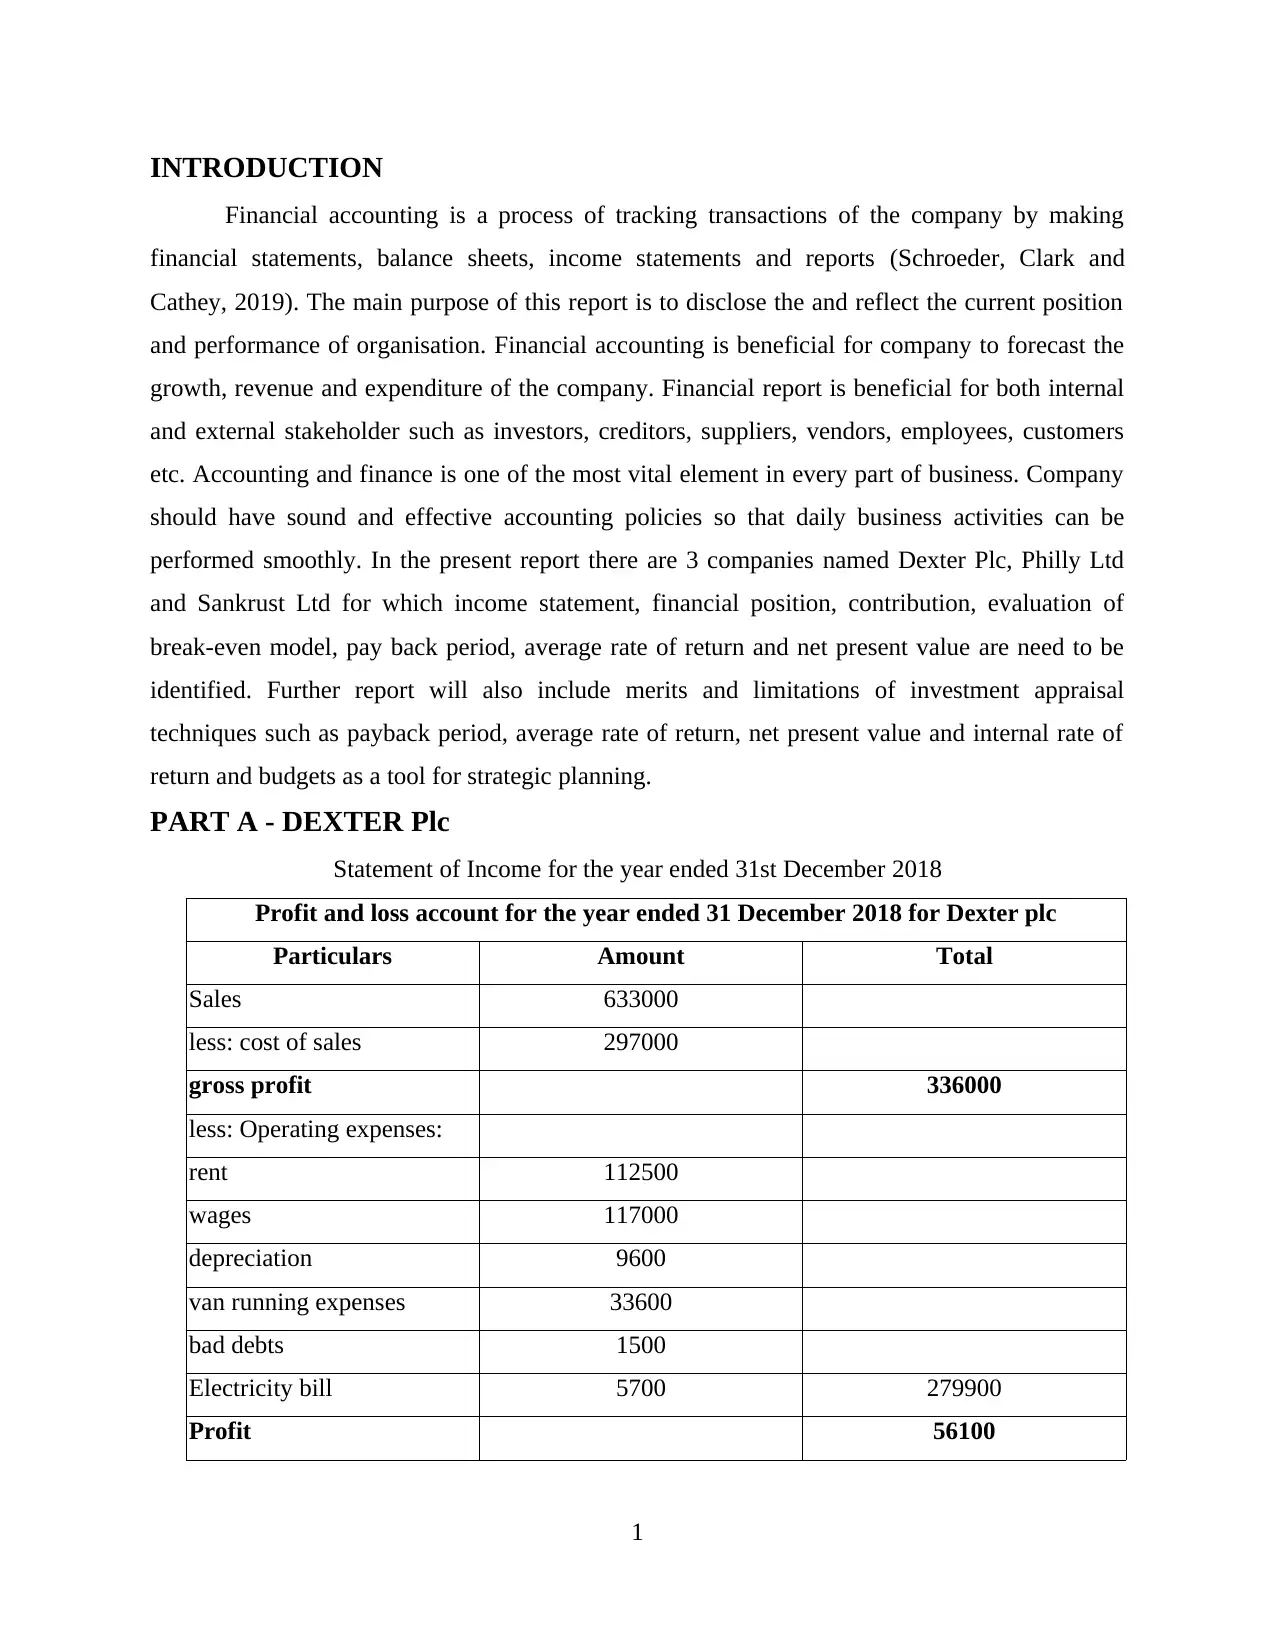
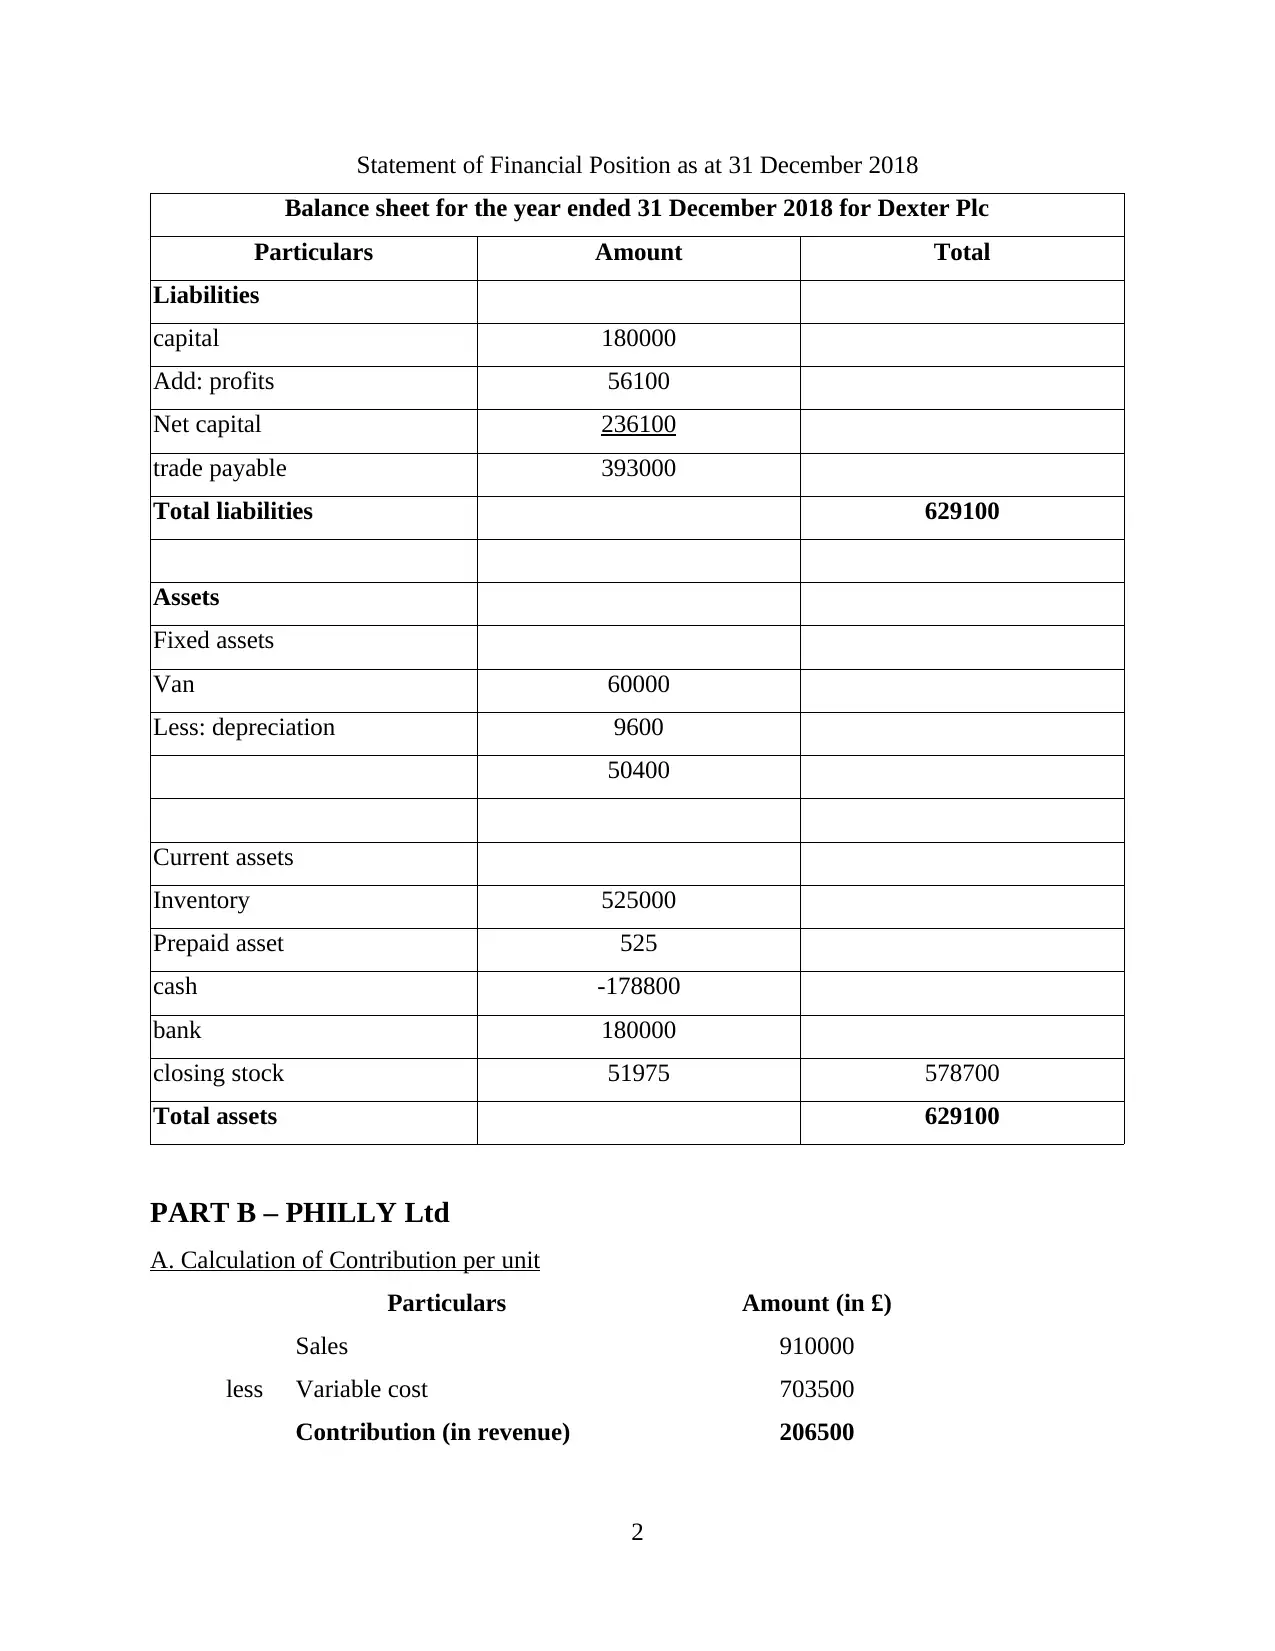
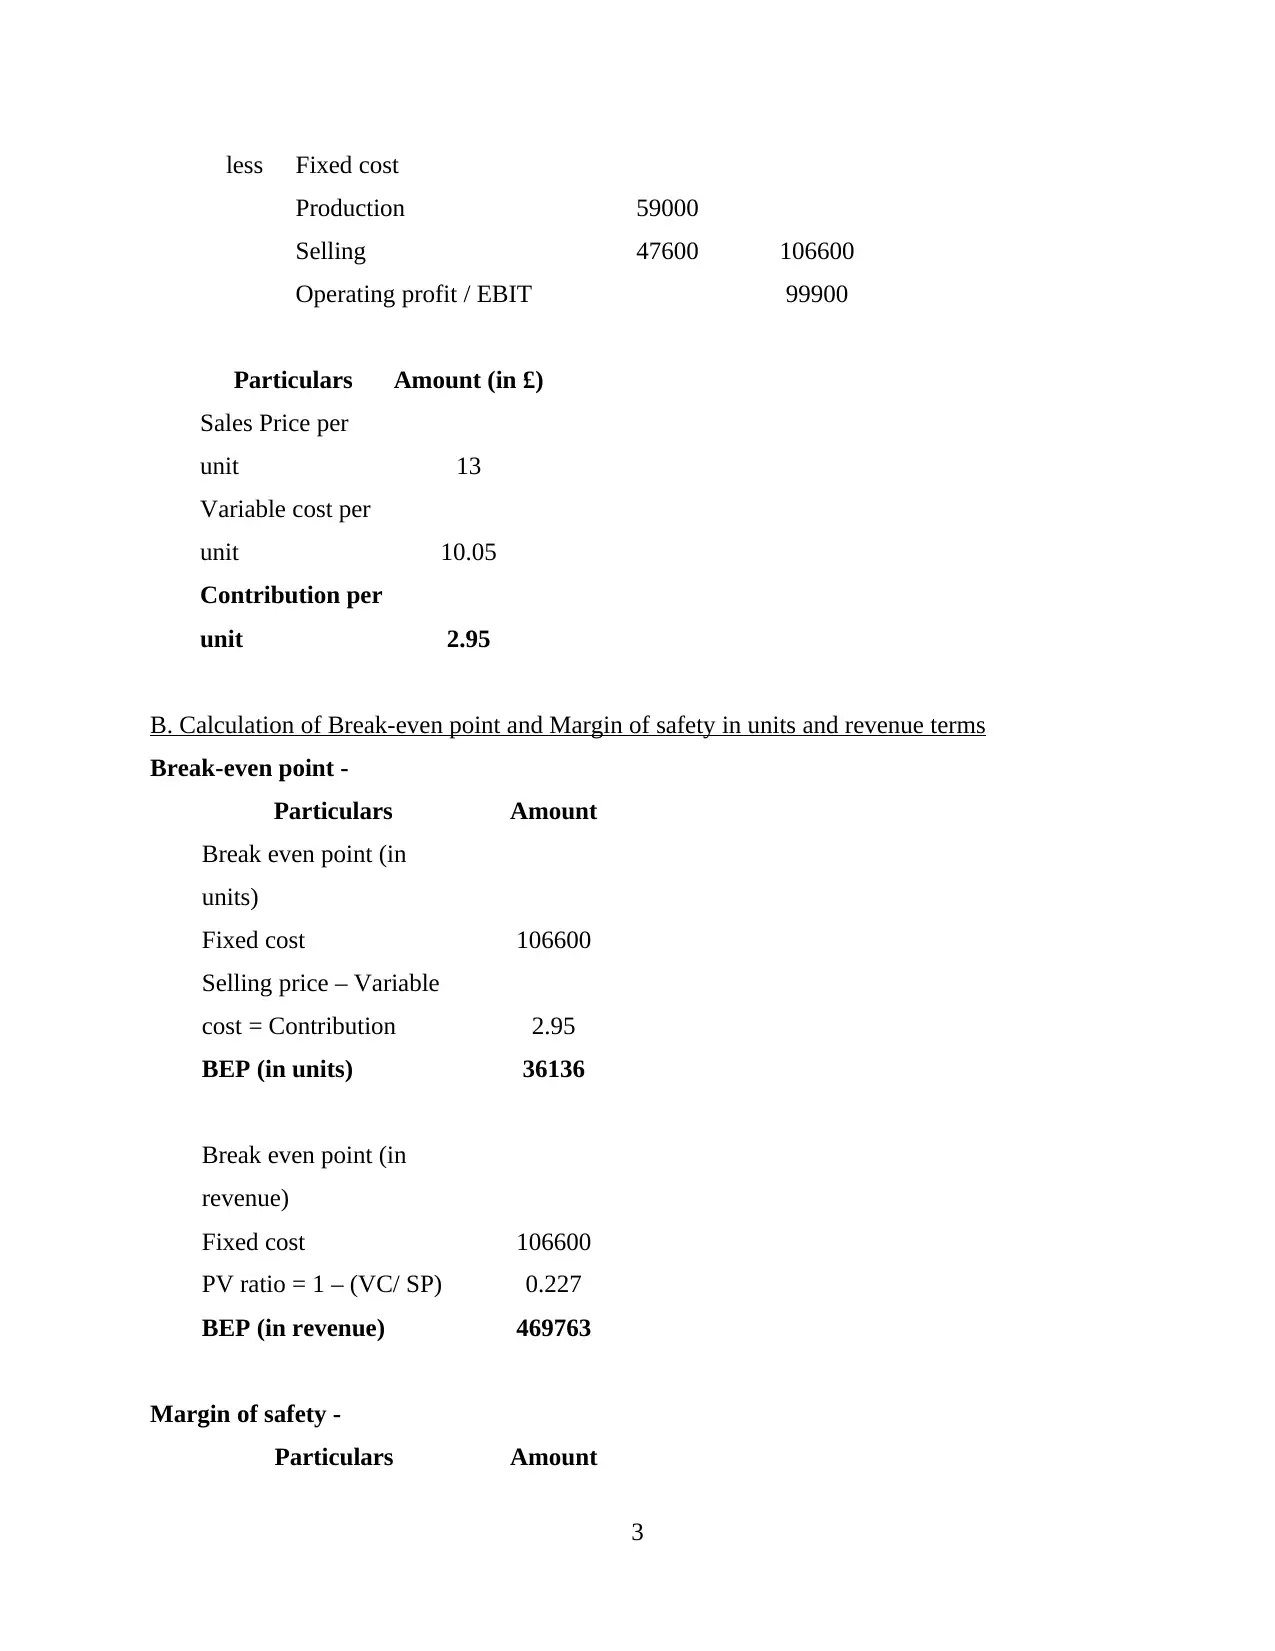
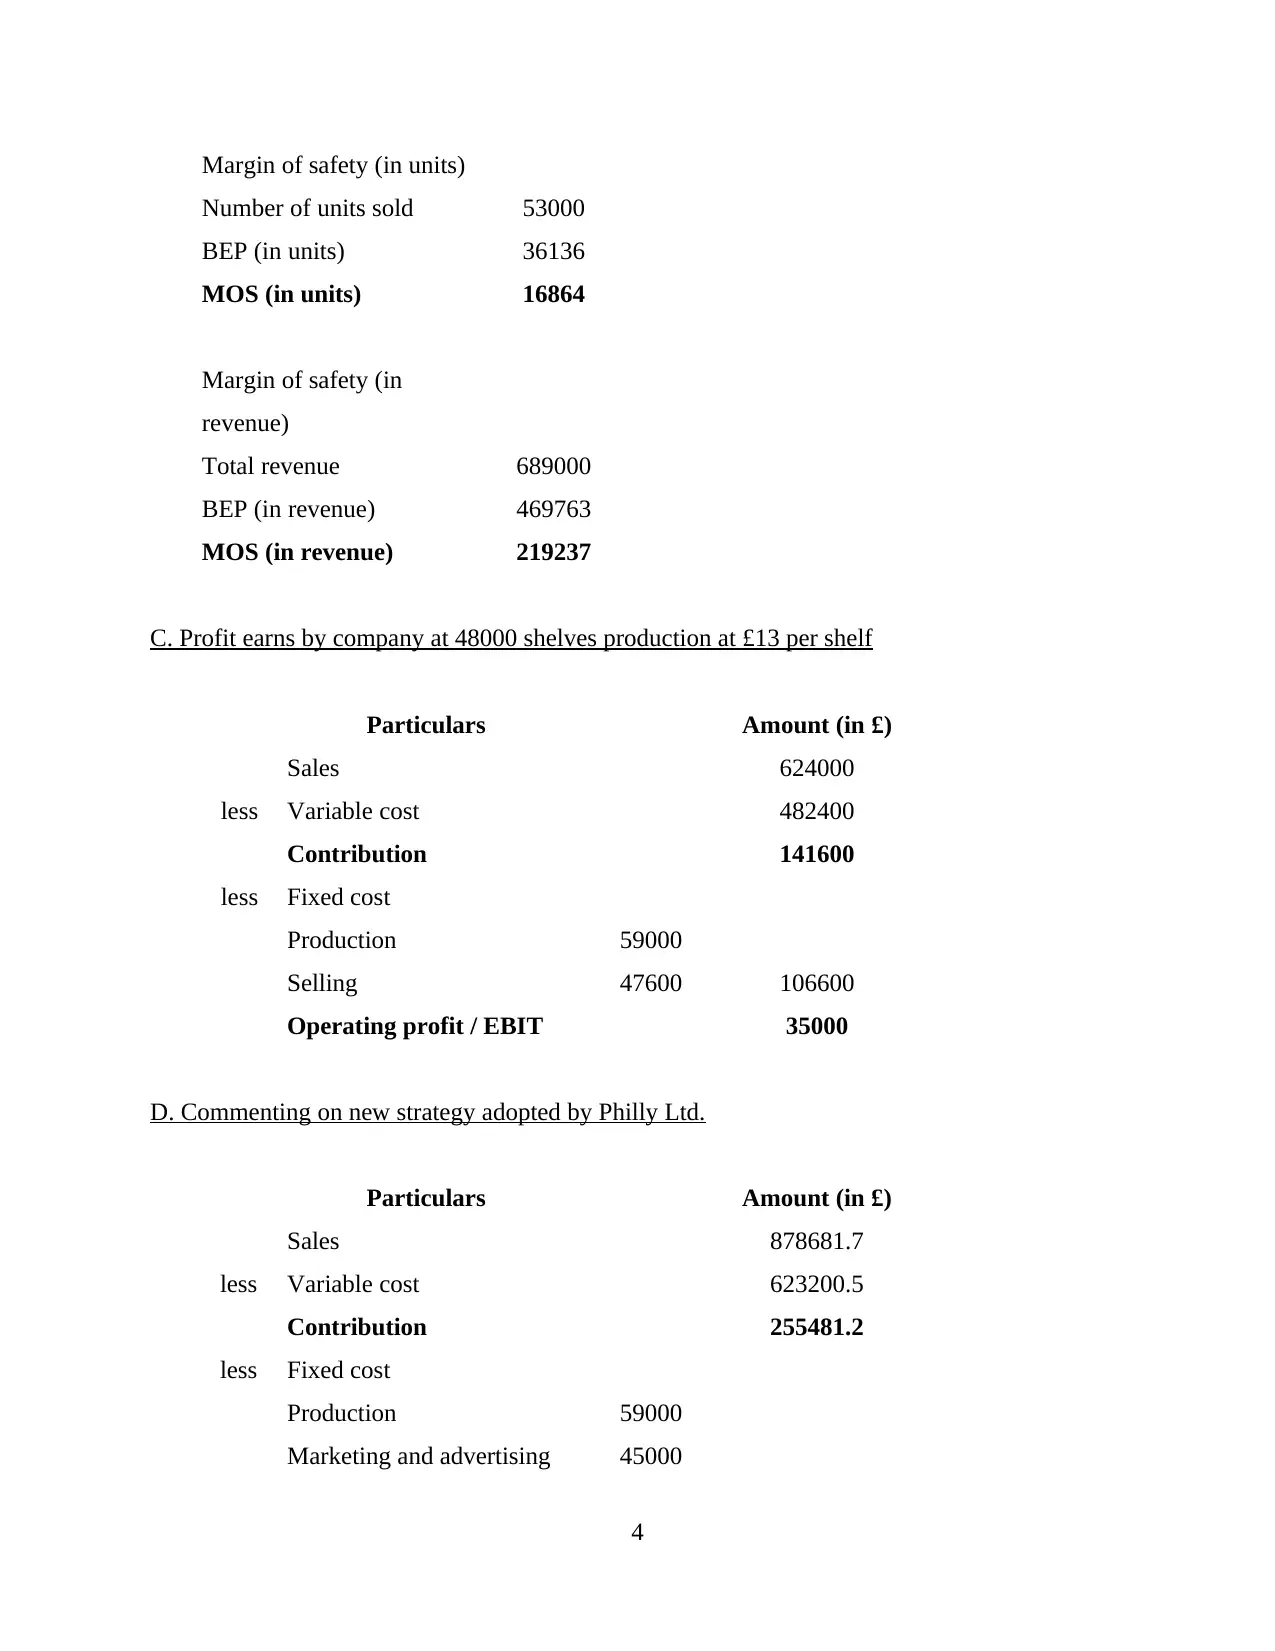
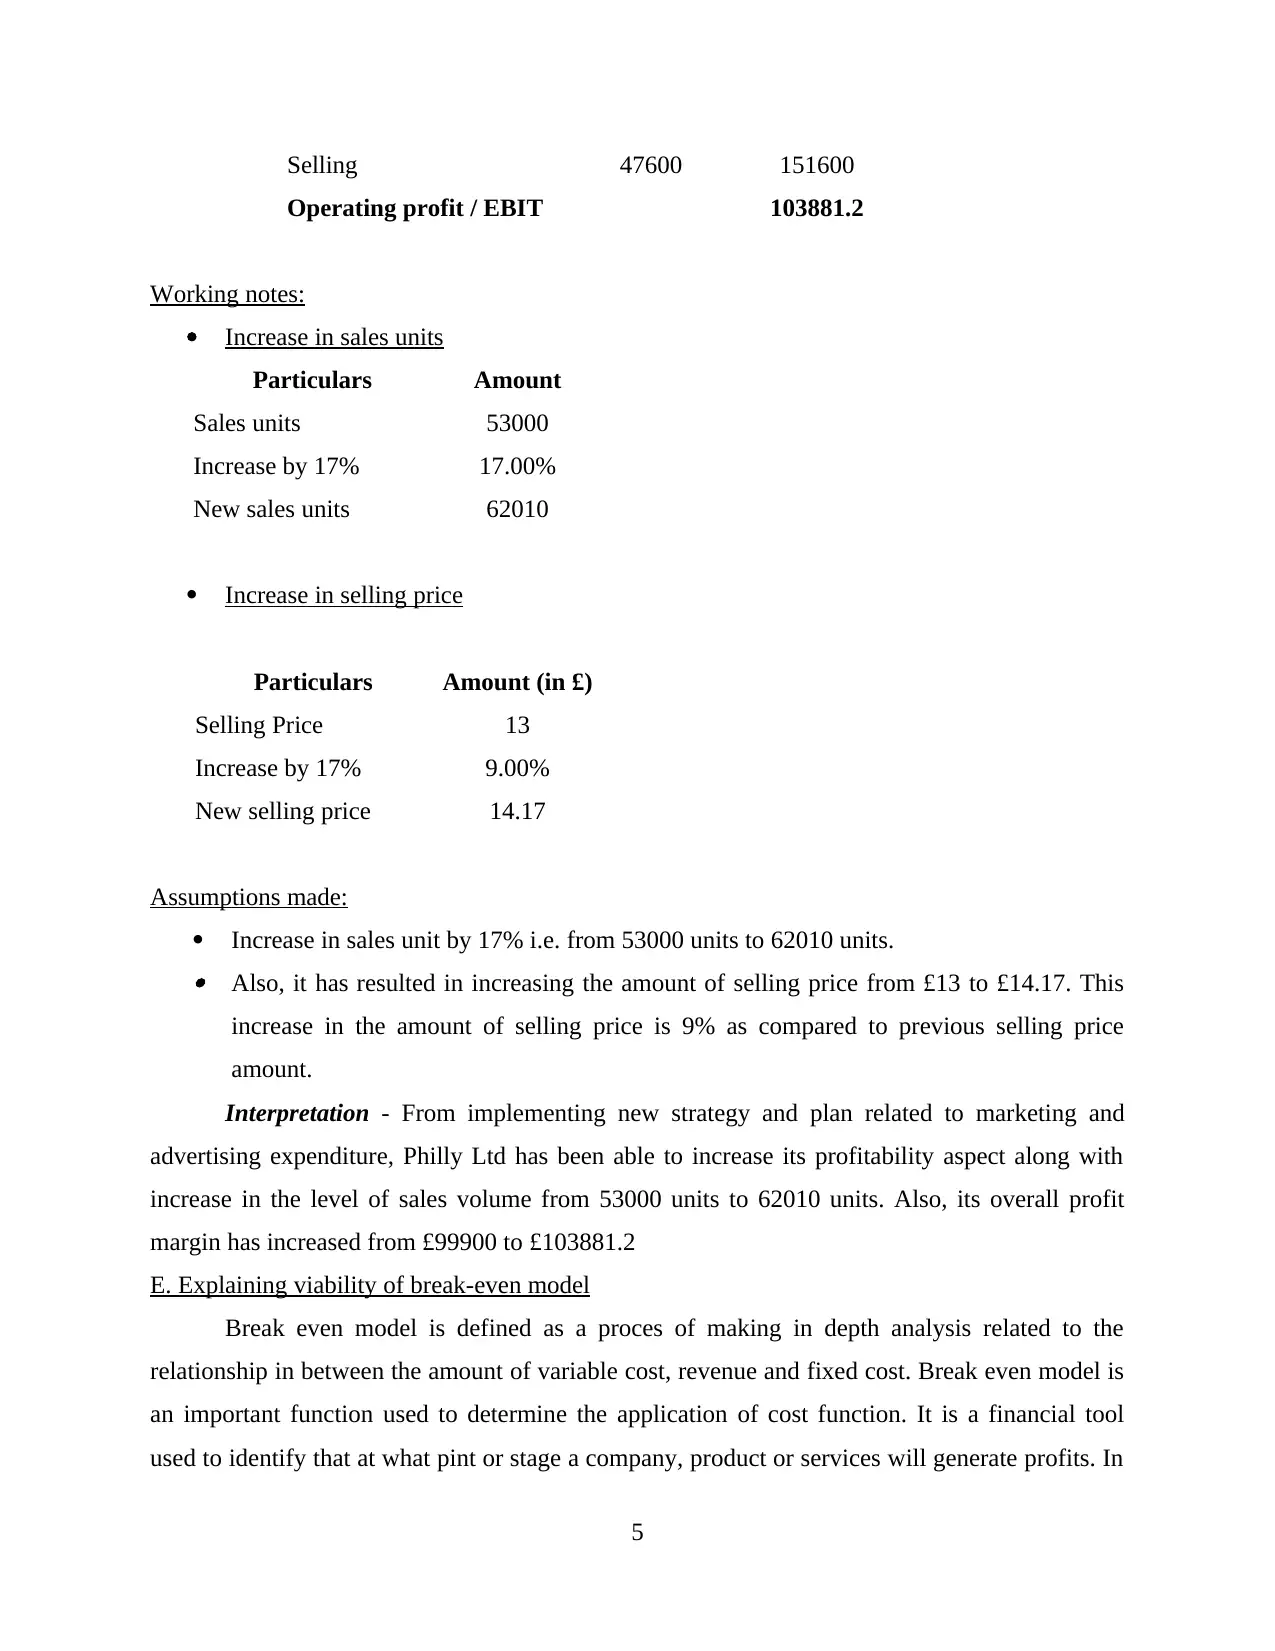
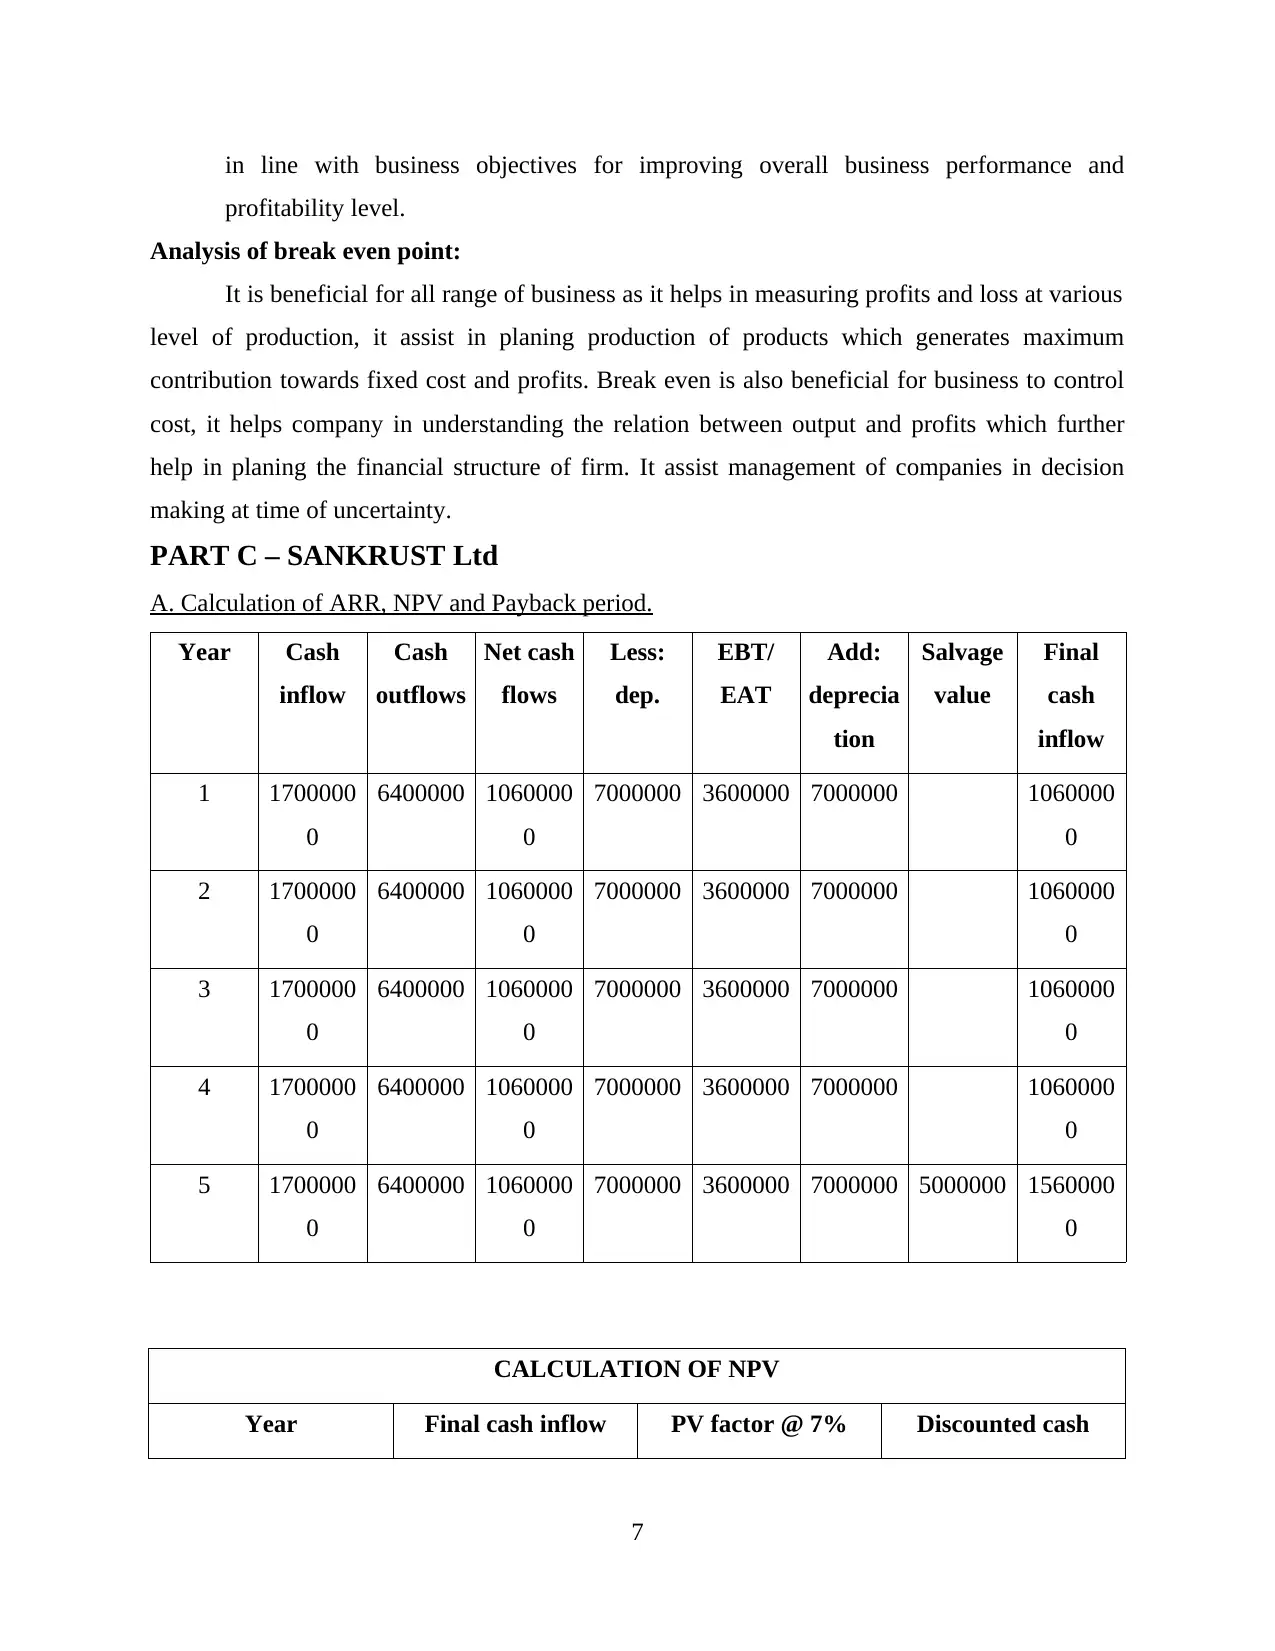
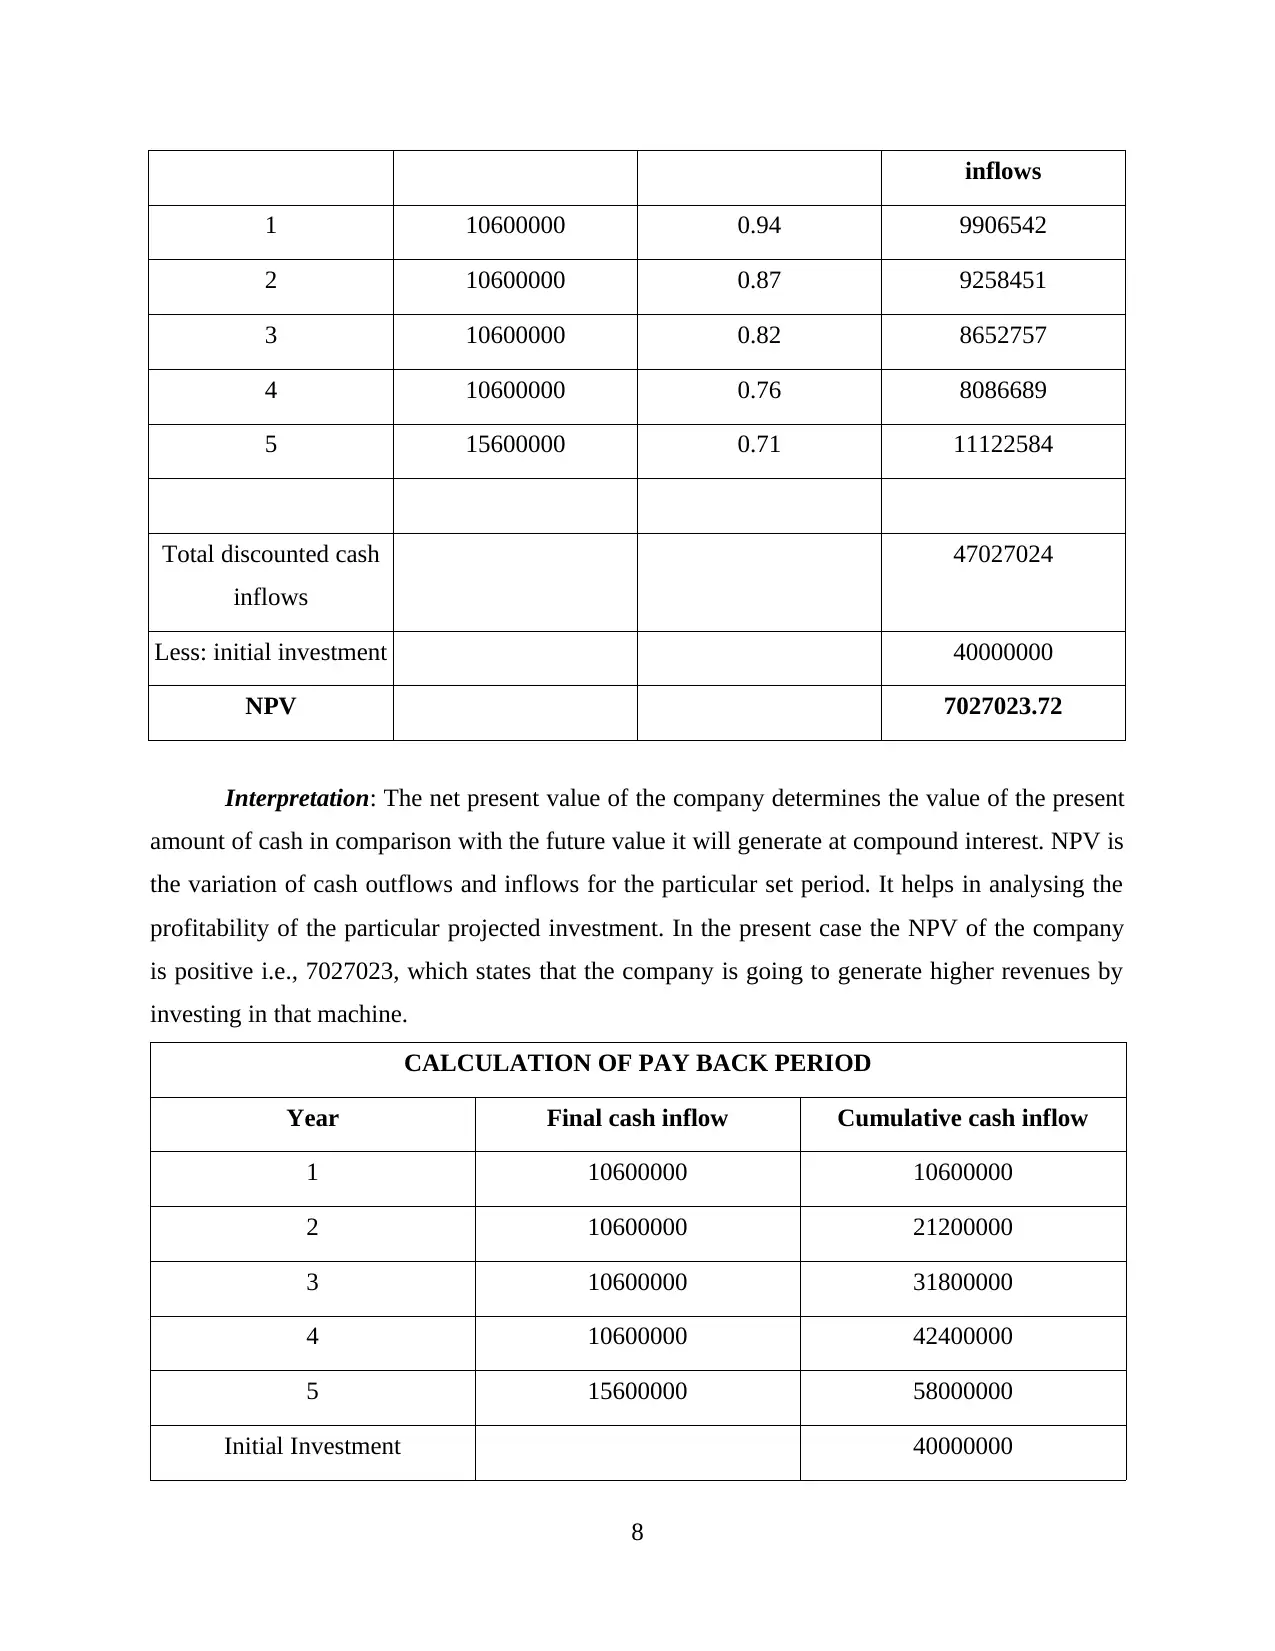
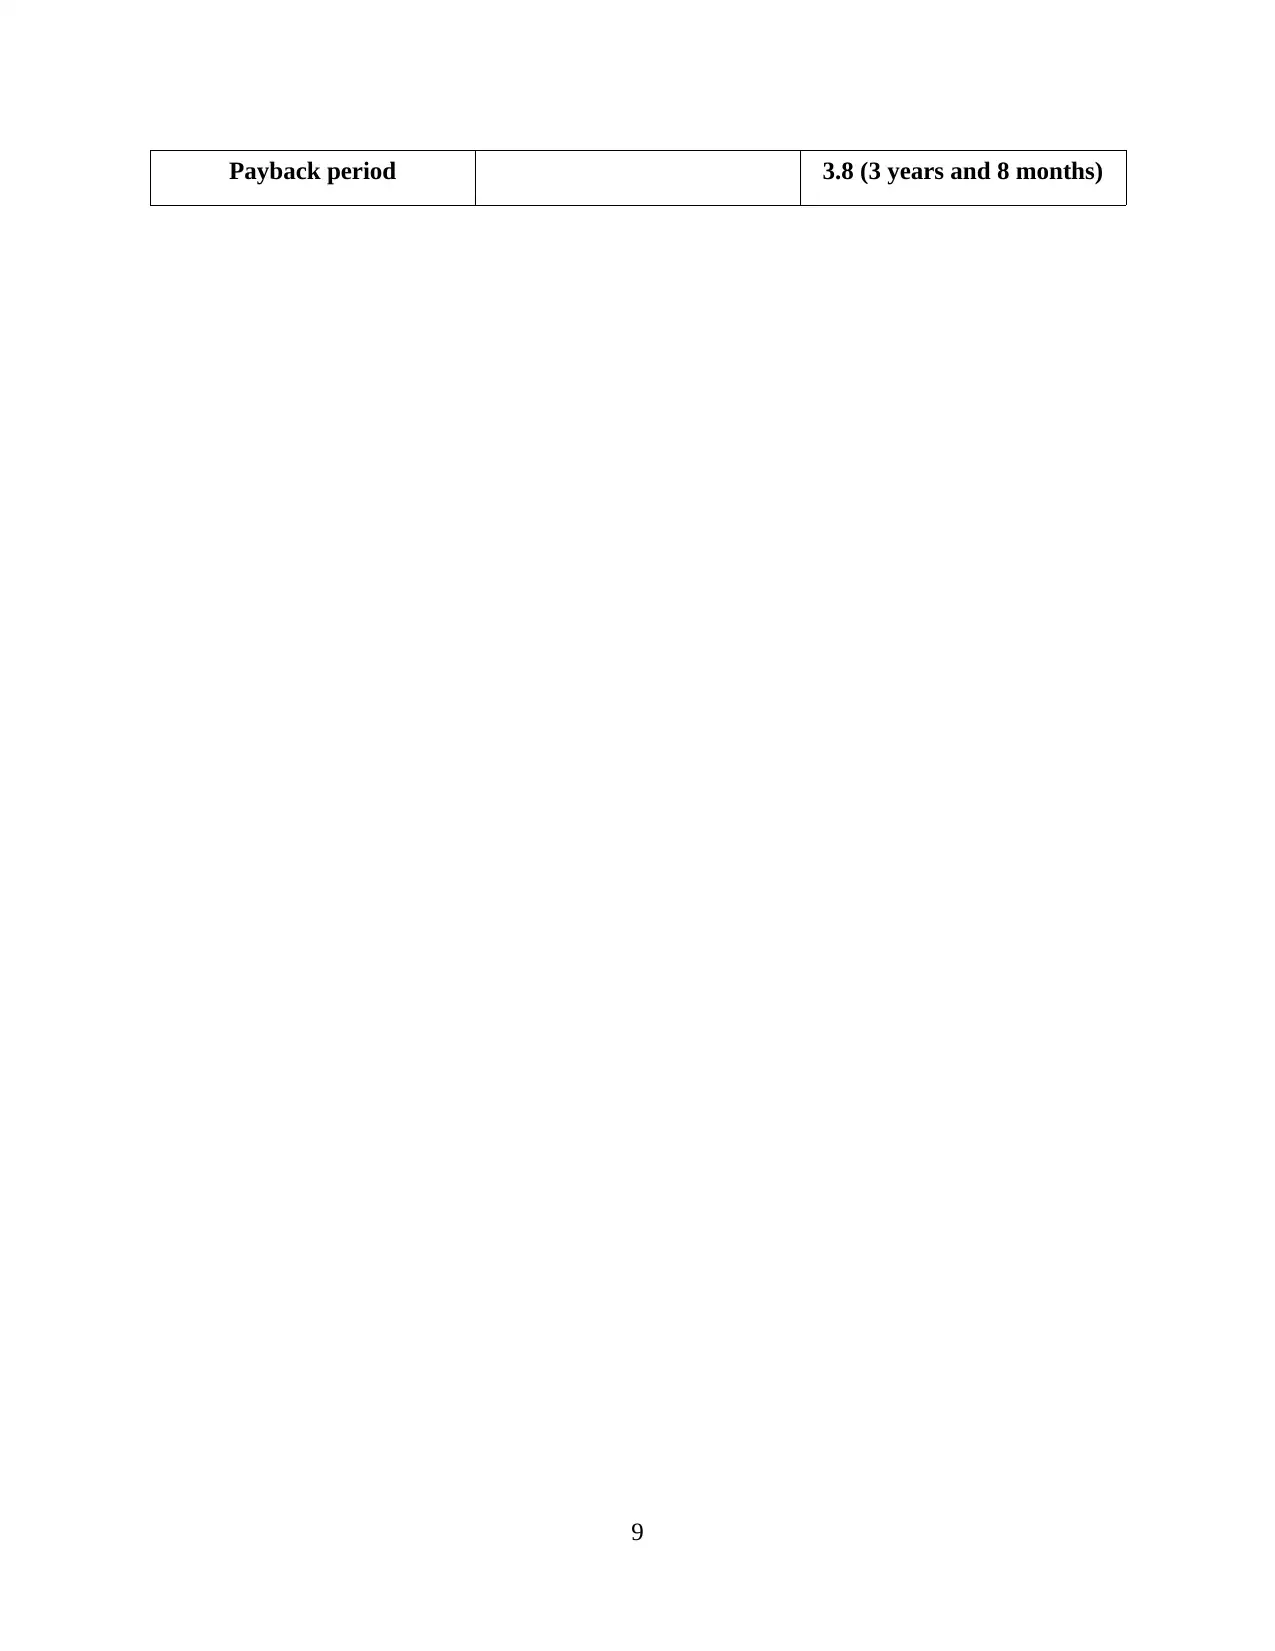
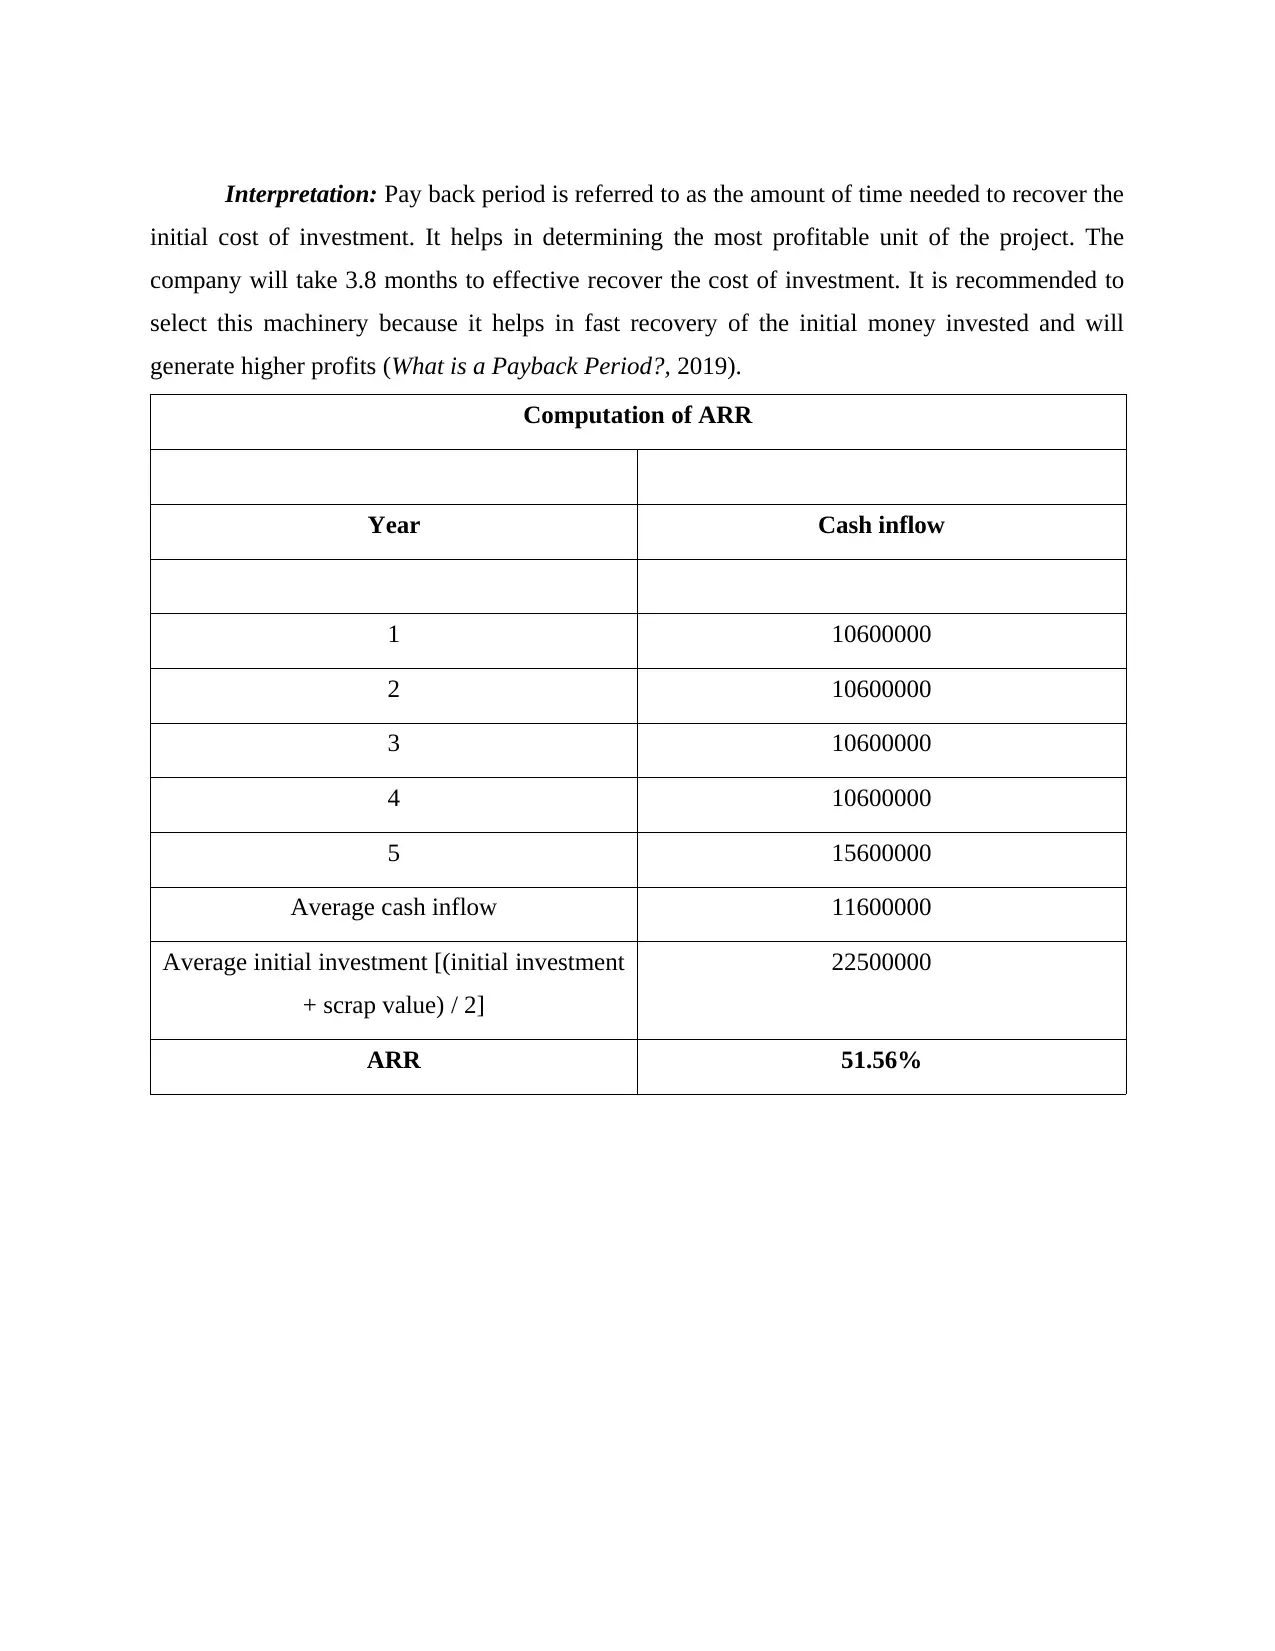
This report presents a financial analysis of three companies: Dexter Plc, Philly Ltd, and Sankrust Ltd. It includes the preparation of income statements and balance sheets for Dexter Plc, as well as calculations of contribution per unit, break-even points, and margin of safety for Philly Ltd. The report also examines the impact of a new marketing strategy on Philly Ltd's profitability and provides an explanation of the break-even model's viability. Furthermore, the report calculates the Average Rate of Return (ARR), Net Present Value (NPV), and payback period for Sankrust Ltd, and discusses the advantages and disadvantages of various investment appraisal techniques and the benefits and limitations of using budgets for strategic planning. The analysis provides insights into the financial performance and strategic considerations for each company, offering a comprehensive overview of their financial positions and investment decisions.
Document Page
Introduction to accounting
and finance assessment
tabler-icon-diamond-filled.svg

Paraphrase This Document

Need a fresh take? Get an instant paraphrase of this document with our AI Paraphraser
Document Page
Table of Contents
INTRODUCTION...........................................................................................................................1
PART A - DEXTER Plc..................................................................................................................1
PART B – PHILLY Ltd...................................................................................................................2
A. Calculation of Contribution per unit.......................................................................................2
B. Calculation of Break-even point and Margin of safety in units and revenue terms................2
C. Profit earns by company at 48000 shelves production at £13 per shelf..................................3
D. Commenting on new strategy adopted by Philly Ltd..............................................................3
E. Explaining viability of break-even model...............................................................................4
PART C – SANKRUST Ltd............................................................................................................6
A. Calculation of ARR, NPV and Payback period......................................................................6
B. Advantages and disadvantages of different investment appraisal techniques.........................1
C. The key benefits and limitations of using budgets as a toll for strategic planning.................3
CONCLUSION ...............................................................................................................................4
REFERENCES ...............................................................................................................................5
Document Page
INTRODUCTION
Financial accounting is a process of tracking transactions of the company by making
financial statements, balance sheets, income statements and reports (Schroeder, Clark and
Cathey, 2019). The main purpose of this report is to disclose the and reflect the current position
and performance of organisation. Financial accounting is beneficial for company to forecast the
growth, revenue and expenditure of the company. Financial report is beneficial for both internal
and external stakeholder such as investors, creditors, suppliers, vendors, employees, customers
etc. Accounting and finance is one of the most vital element in every part of business. Company
should have sound and effective accounting policies so that daily business activities can be
performed smoothly. In the present report there are 3 companies named Dexter Plc, Philly Ltd
and Sankrust Ltd for which income statement, financial position, contribution, evaluation of
break-even model, pay back period, average rate of return and net present value are need to be
identified. Further report will also include merits and limitations of investment appraisal
techniques such as payback period, average rate of return, net present value and internal rate of
return and budgets as a tool for strategic planning.
PART A - DEXTER Plc
Statement of Income for the year ended 31st December 2018
Profit and loss account for the year ended 31 December 2018 for Dexter plc
Particulars Amount Total
Sales 633000
less: cost of sales 297000
gross profit 336000
less: Operating expenses:
rent 112500
wages 117000
depreciation 9600
van running expenses 33600
bad debts 1500
Electricity bill 5700 279900
Profit 56100
1
Document Page
Statement of Financial Position as at 31 December 2018
Balance sheet for the year ended 31 December 2018 for Dexter Plc
Particulars Amount Total
Liabilities
capital 180000
Add: profits 56100
Net capital 236100
trade payable 393000
Total liabilities 629100
Assets
Fixed assets
Van 60000
Less: depreciation 9600
50400
Current assets
Inventory 525000
Prepaid asset 525
cash -178800
bank 180000
closing stock 51975 578700
Total assets 629100
PART B – PHILLY Ltd
A. Calculation of Contribution per unit
Particulars Amount (in £)
Sales 910000
less Variable cost 703500
Contribution (in revenue) 206500
2
tabler-icon-diamond-filled.svg

Paraphrase This Document

Need a fresh take? Get an instant paraphrase of this document with our AI Paraphraser
Document Page
less Fixed cost
Production 59000
Selling 47600 106600
Operating profit / EBIT 99900
Particulars Amount (in £)
Sales Price per
unit 13
Variable cost per
unit 10.05
Contribution per
unit 2.95
B. Calculation of Break-even point and Margin of safety in units and revenue terms
Break-even point -
Particulars Amount
Break even point (in
units)
Fixed cost 106600
Selling price – Variable
cost = Contribution 2.95
BEP (in units) 36136
Break even point (in
revenue)
Fixed cost 106600
PV ratio = 1 – (VC/ SP) 0.227
BEP (in revenue) 469763
Margin of safety -
Particulars Amount
3
Document Page
Margin of safety (in units)
Number of units sold 53000
BEP (in units) 36136
MOS (in units) 16864
Margin of safety (in
revenue)
Total revenue 689000
BEP (in revenue) 469763
MOS (in revenue) 219237
C. Profit earns by company at 48000 shelves production at £13 per shelf
Particulars Amount (in £)
Sales 624000
less Variable cost 482400
Contribution 141600
less Fixed cost
Production 59000
Selling 47600 106600
Operating profit / EBIT 35000
D. Commenting on new strategy adopted by Philly Ltd.
Particulars Amount (in £)
Sales 878681.7
less Variable cost 623200.5
Contribution 255481.2
less Fixed cost
Production 59000
Marketing and advertising 45000
4
Document Page
Selling 47600 151600
Operating profit / EBIT 103881.2
Working notes:
ï‚· Increase in sales units
Particulars Amount
Sales units 53000
Increase by 17% 17.00%
New sales units 62010
ï‚· Increase in selling price
Particulars Amount (in £)
Selling Price 13
Increase by 17% 9.00%
New selling price 14.17
Assumptions made:
 Increase in sales unit by 17% i.e. from 53000 units to 62010 units. Also, it has resulted in increasing the amount of selling price from £13 to £14.17. This
increase in the amount of selling price is 9% as compared to previous selling price
amount.
Interpretation - From implementing new strategy and plan related to marketing and
advertising expenditure, Philly Ltd has been able to increase its profitability aspect along with
increase in the level of sales volume from 53000 units to 62010 units. Also, its overall profit
margin has increased from £99900 to £103881.2
E. Explaining viability of break-even model
Break even model is defined as a proces of making in depth analysis related to the
relationship in between the amount of variable cost, revenue and fixed cost. Break even model is
an important function used to determine the application of cost function. It is a financial tool
used to identify that at what pint or stage a company, product or services will generate profits. In
5
tabler-icon-diamond-filled.svg

Paraphrase This Document

Need a fresh take? Get an instant paraphrase of this document with our AI Paraphraser
Document Page
simple words it is defines as a financial calculation to determine the number of product sold in
order to cover the cost of a product.With the help of break even analysis tool helps the company
in calculating margin of safety wherein the price of asset as well as revenue of firm use to falls or
can remain above the break even point as defined. This technique helps the production
management as well as accountants in making crucial business decisions (Hatch and et.al.,
2017). The amount of total variable and fixed cost are compared along with the revenue amount
so as to identify the margin or level of sales volume at which the operations of business is able to
make neither profit nor loss.
Assumption made in case of break-even analysis includes:
ï‚· The cost related to production, sells, manufacturing etc. can be bifurcated under the
categories of fixed and variable.
ï‚· Amount of fixed cost remain constant at each level of output whereas in case of the
variable cost fluctuation is there in direct proportion to output level.
ï‚· Amount incurred in form of price for inputs including wages, materials, rent etc. shall
remain same.
ï‚· No changes will be made in case of technological methods, techniques as well as related
to the efficiency aspects of both the men and machine resources of the business.
ï‚· Level of sales volume will be assumed as one of the most important factor which affects
cost structure of the company.
ï‚· Selling price will remain constant at each level of sales, it means that alteration in the
supply of a product will not change the selling price.
ï‚· Price will also remain constant towards the input section like rent, advertisement, wages
and materials.
Usefulness of Break-even model:
ï‚· It assists in identifying the amount of selling price which will yield profit.
ï‚· Aids in making proper forecasting and estimation related to the cost and profit amount
with the changes made in the sales volume.
ï‚· It supports the management of the company in determining the amount of cost and
revenue at different levels of sales output (Park and et.al., 2016).
ï‚· Further, with the help of break-even analysis tool, company can makes decision in more
effective and efficient manner. Also, it will help in making long term plans and strategies
6
Document Page
in line with business objectives for improving overall business performance and
profitability level.
Analysis of break even point:
It is beneficial for all range of business as it helps in measuring profits and loss at various
level of production, it assist in planing production of products which generates maximum
contribution towards fixed cost and profits. Break even is also beneficial for business to control
cost, it helps company in understanding the relation between output and profits which further
help in planing the financial structure of firm. It assist management of companies in decision
making at time of uncertainty.
PART C – SANKRUST Ltd
A. Calculation of ARR, NPV and Payback period.
Year Cash
inflow
Cash
outflows
Net cash
flows
Less:
dep.
EBT/
EAT
Add:
deprecia
tion
Salvage
value
Final
cash
inflow
1 1700000
0
6400000 1060000
0
7000000 3600000 7000000 1060000
0
2 1700000
0
6400000 1060000
0
7000000 3600000 7000000 1060000
0
3 1700000
0
6400000 1060000
0
7000000 3600000 7000000 1060000
0
4 1700000
0
6400000 1060000
0
7000000 3600000 7000000 1060000
0
5 1700000
0
6400000 1060000
0
7000000 3600000 7000000 5000000 1560000
0
CALCULATION OF NPV
Year Final cash inflow PV factor @ 7% Discounted cash
7
Document Page
inflows
1 10600000 0.94 9906542
2 10600000 0.87 9258451
3 10600000 0.82 8652757
4 10600000 0.76 8086689
5 15600000 0.71 11122584
Total discounted cash
inflows
47027024
Less: initial investment 40000000
NPV 7027023.72
Interpretation: The net present value of the company determines the value of the present
amount of cash in comparison with the future value it will generate at compound interest. NPV is
the variation of cash outflows and inflows for the particular set period. It helps in analysing the
profitability of the particular projected investment. In the present case the NPV of the company
is positive i.e., 7027023, which states that the company is going to generate higher revenues by
investing in that machine.
CALCULATION OF PAY BACK PERIOD
Year Final cash inflow Cumulative cash inflow
1 10600000 10600000
2 10600000 21200000
3 10600000 31800000
4 10600000 42400000
5 15600000 58000000
Initial Investment 40000000
8
tabler-icon-diamond-filled.svg

Paraphrase This Document

Need a fresh take? Get an instant paraphrase of this document with our AI Paraphraser
Document Page
Payback period 3.8 (3 years and 8 months)
9
Document Page
Interpretation: Pay back period is referred to as the amount of time needed to recover the
initial cost of investment. It helps in determining the most profitable unit of the project. The
company will take 3.8 months to effective recover the cost of investment. It is recommended to
select this machinery because it helps in fast recovery of the initial money invested and will
generate higher profits (What is a Payback Period?, 2019).
Computation of ARR
Year Cash inflow
1 10600000
2 10600000
3 10600000
4 10600000
5 15600000
Average cash inflow 11600000
Average initial investment [(initial investment
+ scrap value) / 2]
22500000
ARR 51.56%
chevron_up_icon
1 out of 17
circle_padding
hide_on_mobile
zoom_out_icon