CO5117 - Accounting Analysis: WaveRider's Financial Performance
VerifiedAdded on 2023/04/20
|8
|1613
|483
Report
AI Summary
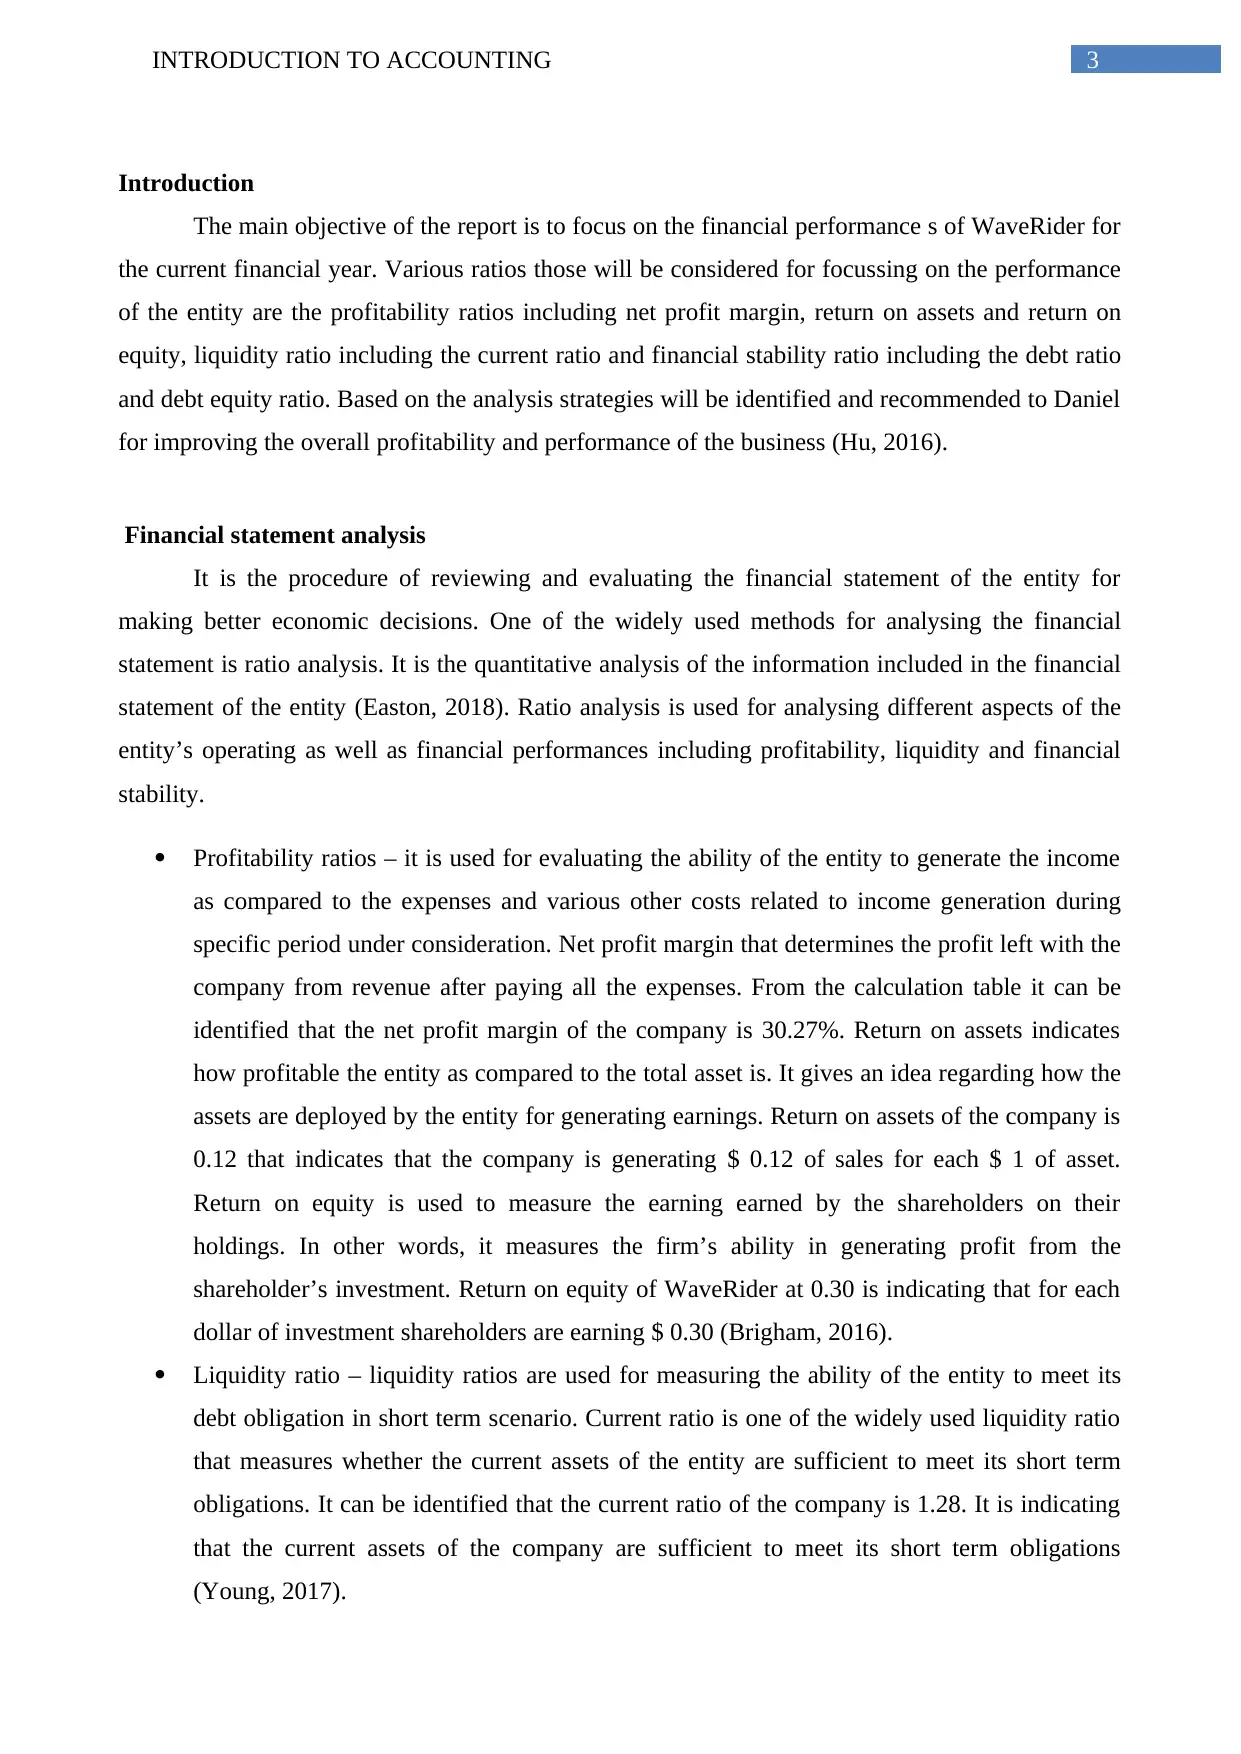
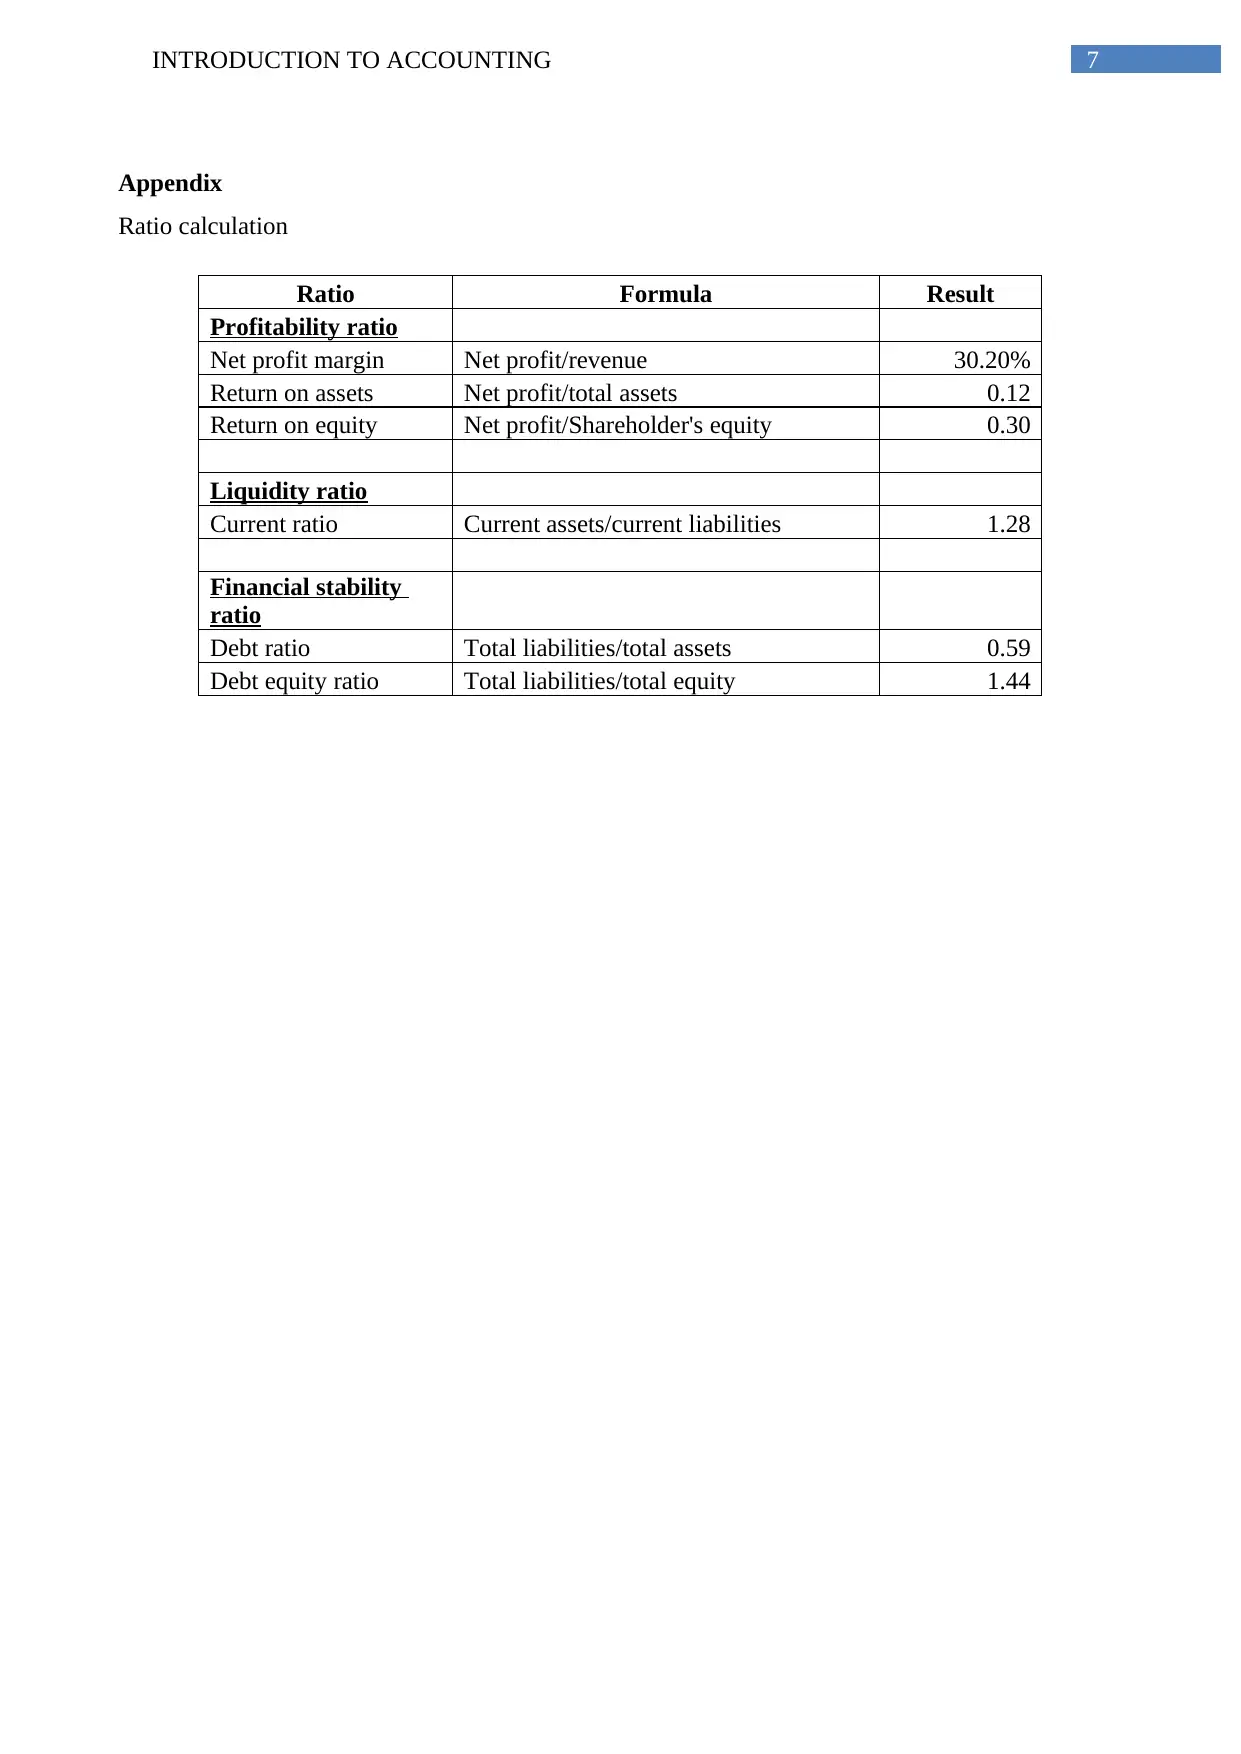
This report provides a financial analysis of WaveRider, a small business, focusing on its profitability, liquidity, and financial stability through ratio analysis. It computes ratios like net profit margin, return on assets, return on equity, current ratio, debt ratio, and debt-equity ratio to assess the company's ...

Running head: INTRODUCTION TO ACCOUNTING
Introduction to accounting
Name of the student
Name of the university
Student ID
Author note
Introduction to accounting
Name of the student
Name of the university
Student ID
Author note
Paraphrase This Document
Need a fresh take? Get an instant paraphrase of this document with our AI Paraphraser

1INTRODUCTION TO ACCOUNTING
Executive summary
The report will focus on the financial performance of WaveRider, a small business that provides
services through hiring wetsuits and surf equipments and arranging the surfing lessons. The report
will focus on the performances through computing various ratios like profitability ratio, liquidity
ratio and financial stability ratio. It will also focus on additional business scenario regarding
Australian sports and recreation industry. Finally based on the analysis, the report will provide
recommendation to enhance the profitability.

2INTRODUCTION TO ACCOUNTING
Table of Contents
Introduction..........................................................................................................................................3
Financial statement analysis.................................................................................................................3
Additional business scenario................................................................................................................4
Limitation of ratio analysis...................................................................................................................4
Conclusion and recommendation.........................................................................................................5
References............................................................................................................................................6
Appendix..............................................................................................................................................7
⊘ This is a preview!⊘
Do you want full access?
Subscribe today to unlock all pages.

Trusted by 1+ million students worldwide

3INTRODUCTION TO ACCOUNTING
Introduction
The main objective of the report is to focus on the financial performance s of WaveRider for
the current financial year. Various ratios those will be considered for focussing on the performance
of the entity are the profitability ratios including net profit margin, return on assets and return on
equity, liquidity ratio including the current ratio and financial stability ratio including the debt ratio
and debt equity ratio. Based on the analysis strategies will be identified and recommended to Daniel
for improving the overall profitability and performance of the business (Hu, 2016).
Financial statement analysis
It is the procedure of reviewing and evaluating the financial statement of the entity for
making better economic decisions. One of the widely used methods for analysing the financial
statement is ratio analysis. It is the quantitative analysis of the information included in the financial
statement of the entity (Easton, 2018). Ratio analysis is used for analysing different aspects of the
entity’s operating as well as financial performances including profitability, liquidity and financial
stability.
Profitability ratios – it is used for evaluating the ability of the entity to generate the income
as compared to the expenses and various other costs related to income generation during
specific period under consideration. Net profit margin that determines the profit left with the
company from revenue after paying all the expenses. From the calculation table it can be
identified that the net profit margin of the company is 30.27%. Return on assets indicates
how profitable the entity as compared to the total asset is. It gives an idea regarding how the
assets are deployed by the entity for generating earnings. Return on assets of the company is
0.12 that indicates that the company is generating $ 0.12 of sales for each $ 1 of asset.
Return on equity is used to measure the earning earned by the shareholders on their
holdings. In other words, it measures the firm’s ability in generating profit from the
shareholder’s investment. Return on equity of WaveRider at 0.30 is indicating that for each
dollar of investment shareholders are earning $ 0.30 (Brigham, 2016).
Liquidity ratio – liquidity ratios are used for measuring the ability of the entity to meet its
debt obligation in short term scenario. Current ratio is one of the widely used liquidity ratio
that measures whether the current assets of the entity are sufficient to meet its short term
obligations. It can be identified that the current ratio of the company is 1.28. It is indicating
that the current assets of the company are sufficient to meet its short term obligations
(Young, 2017).
Paraphrase This Document
Need a fresh take? Get an instant paraphrase of this document with our AI Paraphraser

4INTRODUCTION TO ACCOUNTING
Financial stability ratio – stability is long term counterpart of the liquidity. Analysis of
stability determines how much of debt is raised by the entity and whether the equity and
debt component of capital structure is balanced. Most common stability ratios used for
analysing the financial stability of the entity is debt ratio and debt to equity ratio. Debt ratio
is the stability ratio used to measure the total liabilities of the firm as the percentage aspect
of the total assets. It indicates the ability of the company to pay off the liabilities with the
assets (Uechi, 2015). The debt ratio of WaveRider at 0.59 is indicating that it has sufficient
assets to meet its debt obligation and the company will not have any issue in paying its debt.
On the other hand, debt to equity ratio determines the percentage of the firm’s asset financed
through debt and the percentage that is financed through equity. it is a long term solvency
ratio used to determine the soundness of the entity’s long term financial solvency. A debt
equity ratio of 0.5 indicates that the assets of the entity are funded 2 to 1 by the investors to
creditors. However, from the given scenario it can be observed that the debt equity ratio of
the company is 1.44 that is indicating that significantly large proportion of the assets of the
entity is financed though debt and small proportion is financed through equity. Hence, the
company is highly leveraged (Skillsiq.com.au).
Additional business scenario
Australian sports and recreation industry is extremely popular with the consumers and caters
to wide range of tastes and demographics. Consumers prefer services targeted to their particular
requirements that leads to offering of increased range of activities in fitness and gym facilities. In
accordance with ‘Sport and Recreation 2018 IRC Skills Forecast and Proposed Schedule of Work’
economic contribution of this sector is equal to 2-3% of the GDP and it employs more than 220,000
people that attracts 1.8 million of volunteers. However, a sole trader like Wave Rider is exposed to
high level of competition. This competition has arisen due to affordability that is the prices of gym
membership fell across the industry and full service gyms became more flexible with changing
themselves as per the requirement of the customers. However, the strong profitability and liquidity
condition of the company is indicating that it will be sustainable for the long term (Report, 2019).
Limitation of ratio analysis
Though ratio analysis is an important tool to analyse the performance of any company it has
some limitations as follows –
All the information used by this technique are from historical results and does not state
anything regarding the future performance

5INTRODUCTION TO ACCOUNTING
It does not consider the important factors like industry performance, economic condition of
the country and rate of inflation
Different entities use different policies for reporting the accounting transaction. It makes
comparing the ratios with other entity difficult (Penman, 2015).
Conclusion and recommendation
From the above discussion it can be concluded that the company is performing well in
profitability and liquidity aspect. However, if the stability context is considered it can be stated that
the company is highly leveraged as the debt portion is significantly high as compared to equity.
Hence, it is suggested to raise further requirement of fund trough equity rather than debt to balance
the debt and equity. Further, to enhance the profitability WaveRider shall modify itself as per the
customer’s requirements and minimise the expenses wherever possible.
⊘ This is a preview!⊘
Do you want full access?
Subscribe today to unlock all pages.

Trusted by 1+ million students worldwide

6INTRODUCTION TO ACCOUNTING
Bibliography
Brigham, E. F. (2016). Financial Managment: Theory And Practice, Canadian Edition. Nelson
Education. In E. F. Brigham, Financial Managment: Theory And Practice, Canadian Edition.
Nelson Education.
Easton, M. &. (2018). Financial Statement Analysis & Valuation. In M. &. Easton, Financial
Statement Analysis & Valuation.
Hu, K. H. (2016). Evaluating the improvement of sustainability of sports industry policy based on
MADM. Sustainability,.
Penman, S. H. (2015). Financial Ratios and Equity Valuation.Wiley Encyclopedia of Management.
In S. H. Penman, Financial Ratios and Equity Valuation.Wiley Encyclopedia of Management (pp.
1-7).
Report, N. I. (2019). Sport, Fitness and Recreation. Retrieved January 9, 2019, from National
Industry Insights Report: https://nationalindustryinsights.aisc.net.au/industries/sport-fitness-and-
recreation
Skillsiq.com.au. (n.d.). Retrieved January 9, 2019, from
https://www.skillsiq.com.au/site/DefaultSite/filesystem/documents/Industry-Skills-Forecasts-
June2017/2018%20Drafts/Sport%20and%20Recreation%20Draft%202018%20Industry%20Skills
%20Forecast%20for%20Public%20Consultation.pdf
Uechi, L. A. (2015). Sector dominance ratio analysis of financial markets. In Physica A: Statistical
Mechanics and its Applications (pp. 488-509).
Young, T. S. (2017). In T. S. Young, Educating managers for equity and social justice: Integrating
Indigenous knowledges and perspectives in Australian sport, recreation and event management
curricula. Journal of Hospitality, Leisure, Sport & Tourism Education (pp. 135-143).
Paraphrase This Document
Need a fresh take? Get an instant paraphrase of this document with our AI Paraphraser

7INTRODUCTION TO ACCOUNTING
Appendix
Ratio calculation
Ratio Formula Result
Profitability ratio
Net profit margin Net profit/revenue 30.20%
Return on assets Net profit/total assets 0.12
Return on equity Net profit/Shareholder's equity 0.30
Liquidity ratio
Current ratio Current assets/current liabilities 1.28
Financial stability
ratio
Debt ratio Total liabilities/total assets 0.59
Debt equity ratio Total liabilities/total equity 1.44
1 out of 8
Related Documents

Your All-in-One AI-Powered Toolkit for Academic Success.
+13062052269
info@desklib.com
Available 24*7 on WhatsApp / Email
Unlock your academic potential
© 2024 | Zucol Services PVT LTD | All rights reserved.