Corporate Finance Report: Investment Analysis and Project Appraisal
VerifiedAdded on 2024/05/13
|18
|3125
|362
Report
AI Summary
This report provides a comprehensive analysis of corporate finance concepts, divided into two main parts. Part A focuses on calculating the expected rate of return, beta, and standard deviation for Aussie Limited and Blue Star Limited, comparing these metrics with the ASX 200 indices to assess investment value. It evaluates different portfolios for investment decisions, considering both risk and return. Part B assesses the viability of a specific project by calculating the payback period, Net Present Value (NPV), Internal Rate of Return (IRR), and profitability index. The analysis aims to determine the project's efficiency and profitability, providing a basis for informed investment decisions. The report uses financial formulas and techniques to evaluate investment opportunities and project feasibility.

Introduction to Corporate Finance
1
1
Paraphrase This Document
Need a fresh take? Get an instant paraphrase of this document with our AI Paraphraser

Contents
Introduction................................................................................................................................3
Part A.........................................................................................................................................4
Part B........................................................................................................................................12
Conclusions..............................................................................................................................17
References:...............................................................................................................................18
2

Introduction
In this, there are two parts and this includes part a, and part b. In part a, expected rate of
return, beta, and the standard deviation is calculated. This will allow the individual to know
about the position of the Aussie Limited and the Blue Star Limited. This will enable the
individual to know about the investment value in the company. Then this information will
also be compared with the ASX 200 indices. Further, different portfolios have been evaluated
for the purpose of investment. In part b, the payback period, Net Present Value, Internal Rate
of Return and the profitability index has been calculated for a particular project. This will
enable the individual to know about the efficiency of the project.
3
⊘ This is a preview!⊘
Do you want full access?
Subscribe today to unlock all pages.
Trusted by 1+ million students worldwide
Part A.
1. Calculation of the expected rate of return
The expected rate of return is the return that an individual expects from an investment. This is
the anticipated rate of return that an individual has anticipated from a particular investment.
This can be calculated using the potential outcomes and multiplying it by chances of
occurring. In the end, the results will be summed to get the expected rate of return
(Gunarathna, 2014).
The following calculation has been performed using the calculation tool of the Microsoft
Excel.
The formula used for the performance of the calculation is –
E(R) = w1R1 + w2Rq + ...+ wnRn
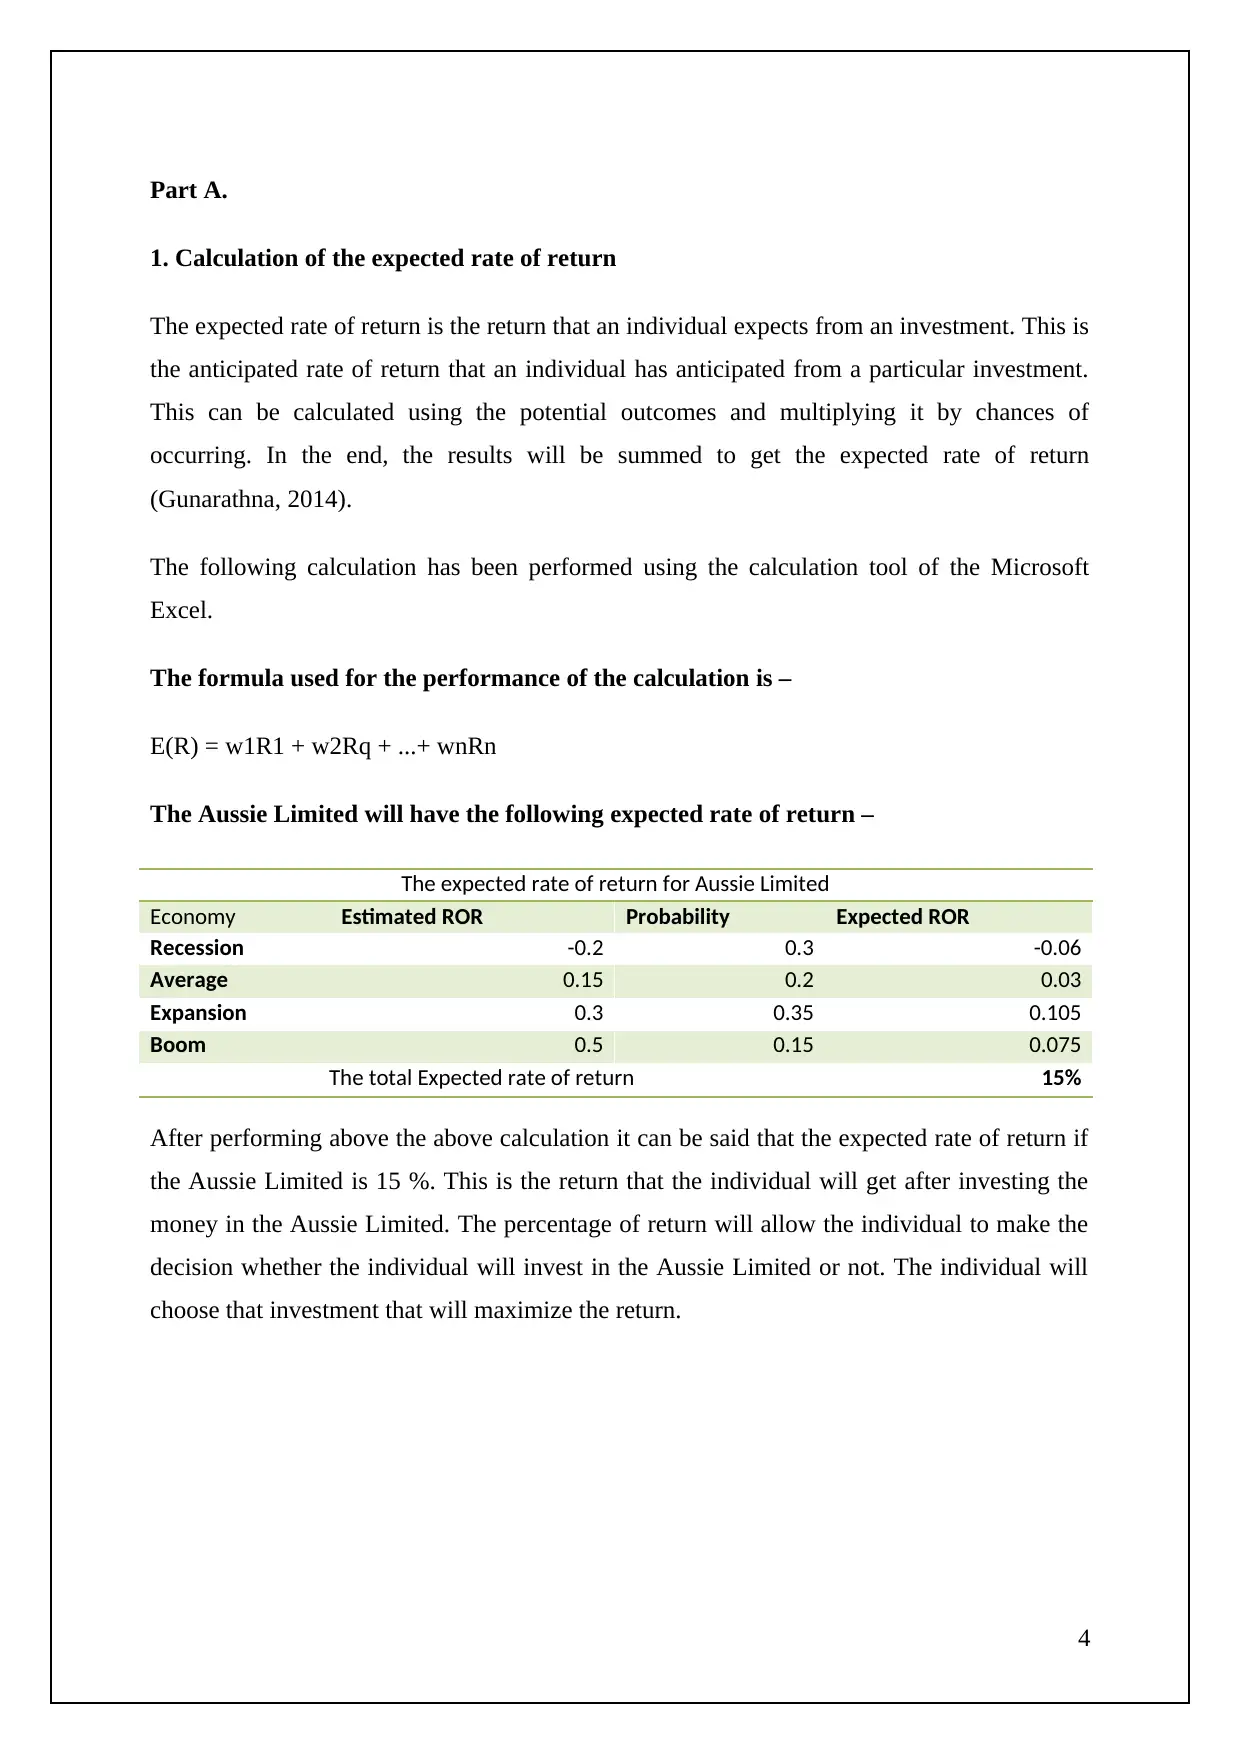
The Aussie Limited will have the following expected rate of return –
The expected rate of return for Aussie Limited
Economy Estimated ROR Probability Expected ROR
Recession -0.2 0.3 -0.06
Average 0.15 0.2 0.03
Expansion 0.3 0.35 0.105
Boom 0.5 0.15 0.075
The total Expected rate of return 15%
After performing above the above calculation it can be said that the expected rate of return if
the Aussie Limited is 15 %. This is the return that the individual will get after investing the
money in the Aussie Limited. The percentage of return will allow the individual to make the
decision whether the individual will invest in the Aussie Limited or not. The individual will
choose that investment that will maximize the return.
4
1. Calculation of the expected rate of return
The expected rate of return is the return that an individual expects from an investment. This is
the anticipated rate of return that an individual has anticipated from a particular investment.
This can be calculated using the potential outcomes and multiplying it by chances of
occurring. In the end, the results will be summed to get the expected rate of return
(Gunarathna, 2014).
The following calculation has been performed using the calculation tool of the Microsoft
Excel.
The formula used for the performance of the calculation is –
E(R) = w1R1 + w2Rq + ...+ wnRn
The Aussie Limited will have the following expected rate of return –
The expected rate of return for Aussie Limited
Economy Estimated ROR Probability Expected ROR
Recession -0.2 0.3 -0.06
Average 0.15 0.2 0.03
Expansion 0.3 0.35 0.105
Boom 0.5 0.15 0.075
The total Expected rate of return 15%
After performing above the above calculation it can be said that the expected rate of return if
the Aussie Limited is 15 %. This is the return that the individual will get after investing the
money in the Aussie Limited. The percentage of return will allow the individual to make the
decision whether the individual will invest in the Aussie Limited or not. The individual will
choose that investment that will maximize the return.
4
Paraphrase This Document
Need a fresh take? Get an instant paraphrase of this document with our AI Paraphraser
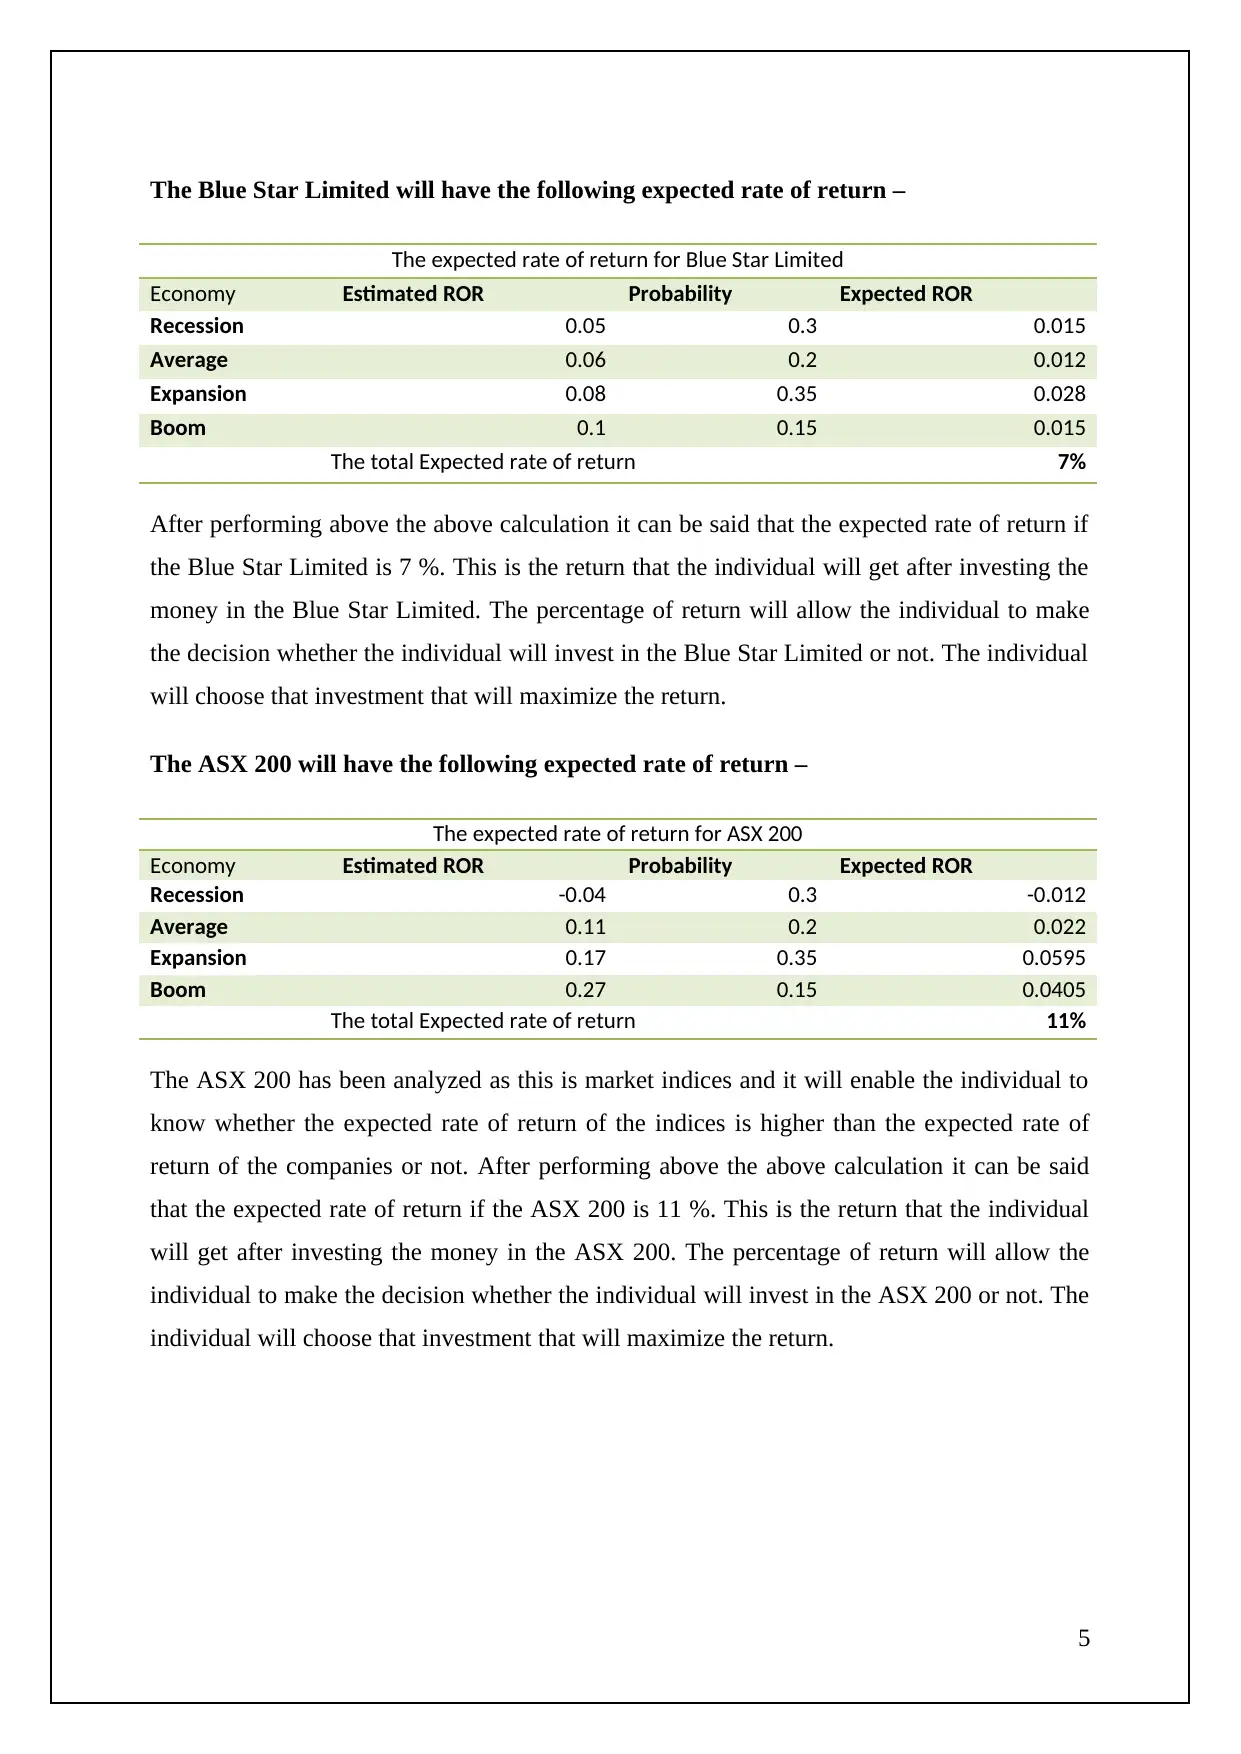
The Blue Star Limited will have the following expected rate of return –
The expected rate of return for Blue Star Limited
Economy Estimated ROR Probability Expected ROR
Recession 0.05 0.3 0.015
Average 0.06 0.2 0.012
Expansion 0.08 0.35 0.028
Boom 0.1 0.15 0.015
The total Expected rate of return 7%
After performing above the above calculation it can be said that the expected rate of return if
the Blue Star Limited is 7 %. This is the return that the individual will get after investing the
money in the Blue Star Limited. The percentage of return will allow the individual to make
the decision whether the individual will invest in the Blue Star Limited or not. The individual
will choose that investment that will maximize the return.
The ASX 200 will have the following expected rate of return –
The expected rate of return for ASX 200
Economy Estimated ROR Probability Expected ROR
Recession -0.04 0.3 -0.012
Average 0.11 0.2 0.022
Expansion 0.17 0.35 0.0595
Boom 0.27 0.15 0.0405
The total Expected rate of return 11%
The ASX 200 has been analyzed as this is market indices and it will enable the individual to
know whether the expected rate of return of the indices is higher than the expected rate of
return of the companies or not. After performing above the above calculation it can be said
that the expected rate of return if the ASX 200 is 11 %. This is the return that the individual
will get after investing the money in the ASX 200. The percentage of return will allow the
individual to make the decision whether the individual will invest in the ASX 200 or not. The
individual will choose that investment that will maximize the return.
5
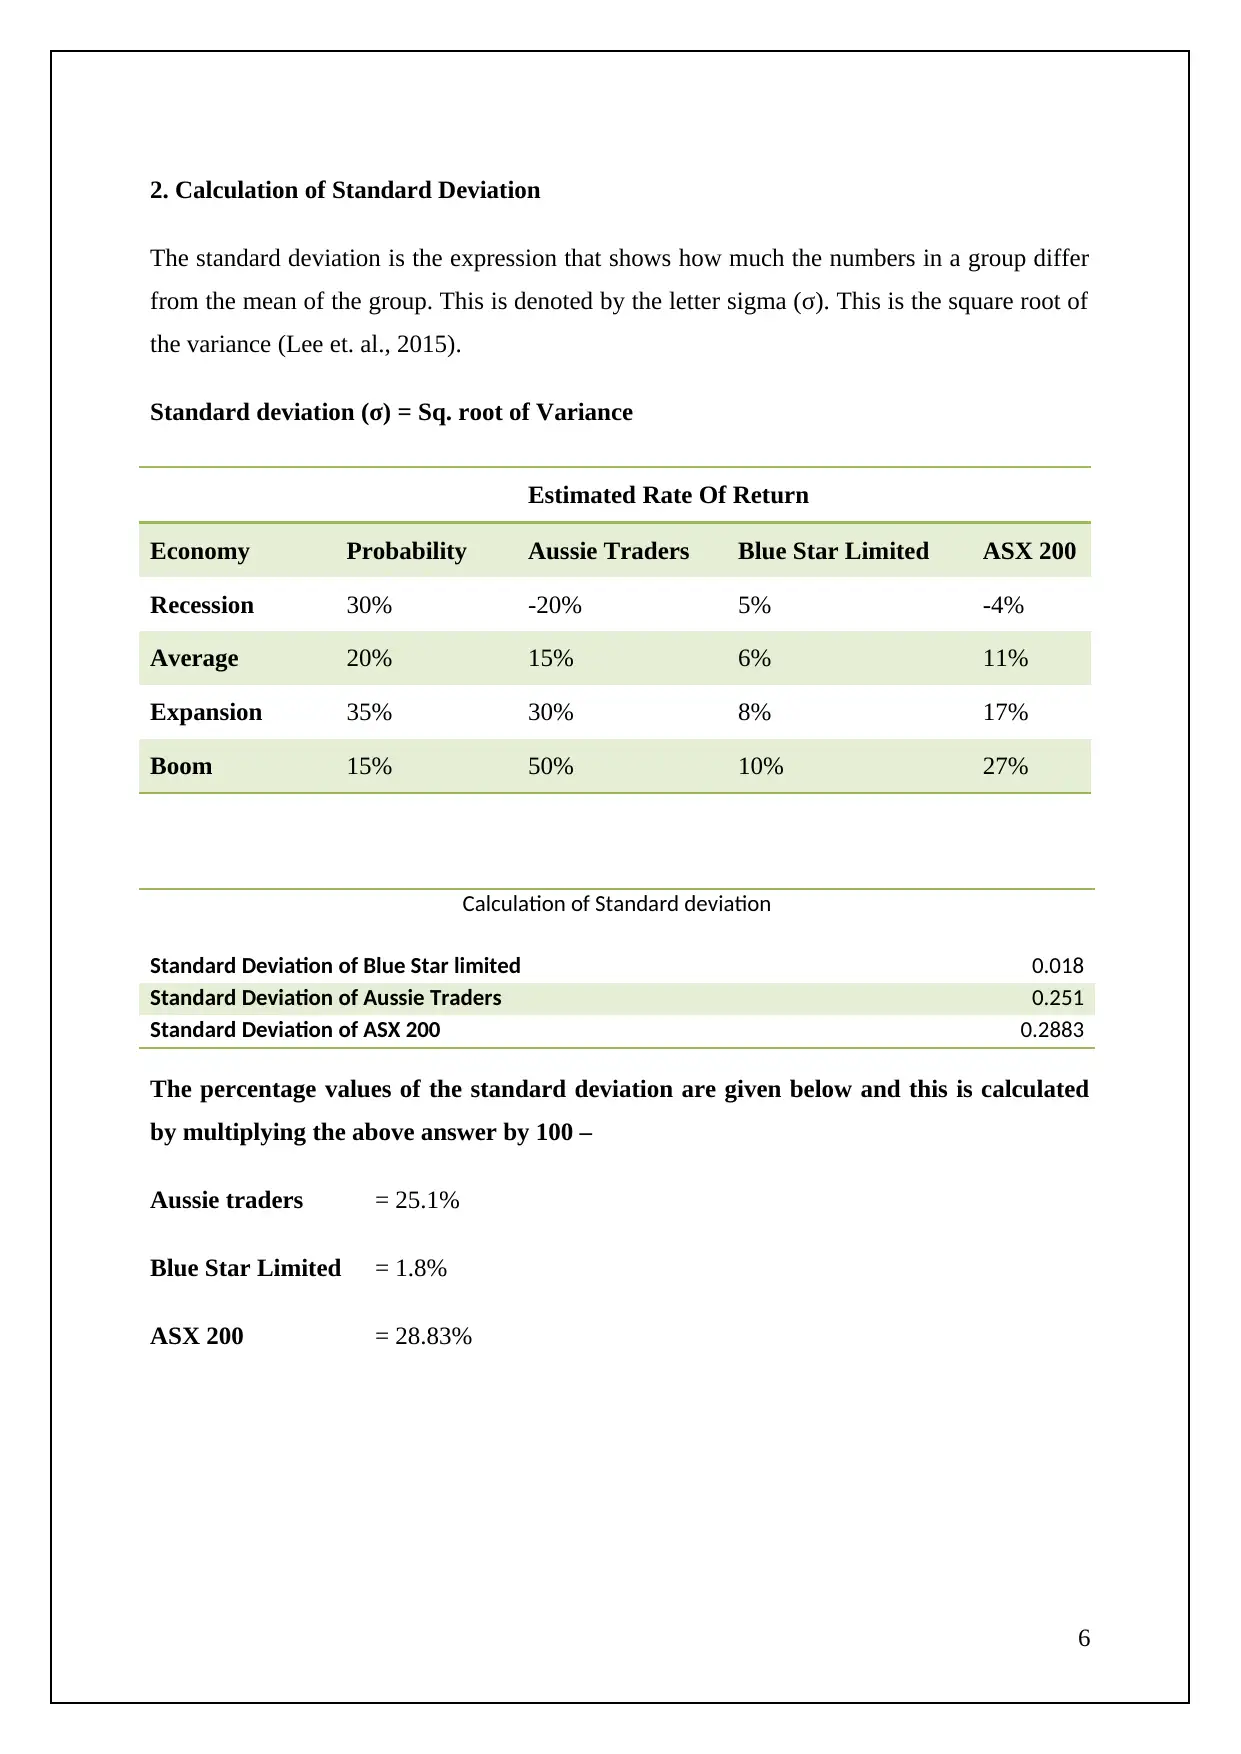
2. Calculation of Standard Deviation
The standard deviation is the expression that shows how much the numbers in a group differ
from the mean of the group. This is denoted by the letter sigma (σ). This is the square root of
the variance (Lee et. al., 2015).
Standard deviation (σ) = Sq. root of Variance
Estimated Rate Of Return
Economy Probability Aussie Traders Blue Star Limited ASX 200
Recession 30% -20% 5% -4%
Average 20% 15% 6% 11%
Expansion 35% 30% 8% 17%
Boom 15% 50% 10% 27%
Calculation of Standard deviation
Standard Deviation of Blue Star limited 0.018
Standard Deviation of Aussie Traders 0.251
Standard Deviation of ASX 200 0.2883
The percentage values of the standard deviation are given below and this is calculated
by multiplying the above answer by 100 –
Aussie traders = 25.1%
Blue Star Limited = 1.8%
ASX 200 = 28.83%
6
⊘ This is a preview!⊘
Do you want full access?
Subscribe today to unlock all pages.
Trusted by 1+ million students worldwide
3. Which is a better measure – Standard Deviation or Beta?
The beta and standard deviation will enable the individual to know about the volatility in the
investment. Higher volatility is associated with a higher risk. The standard deviation
represents the individual risk associated with the investment. On the other hand, the beat
value represents the relative comparison. The beat value considers the market risk and
volatility in the portfolio.
It can be said that the beta value is a more appropriate measure in the given portfolio. The
decisions made using the beta value is more effective and will allow an individual to
maximize the return on investment by keeping the risk in control. So, the choice made after
the analysis of the beta of the company is Aussie Limited. This company has a higher beta
value (Sornette, 2017).
7
Paraphrase This Document
Need a fresh take? Get an instant paraphrase of this document with our AI Paraphraser
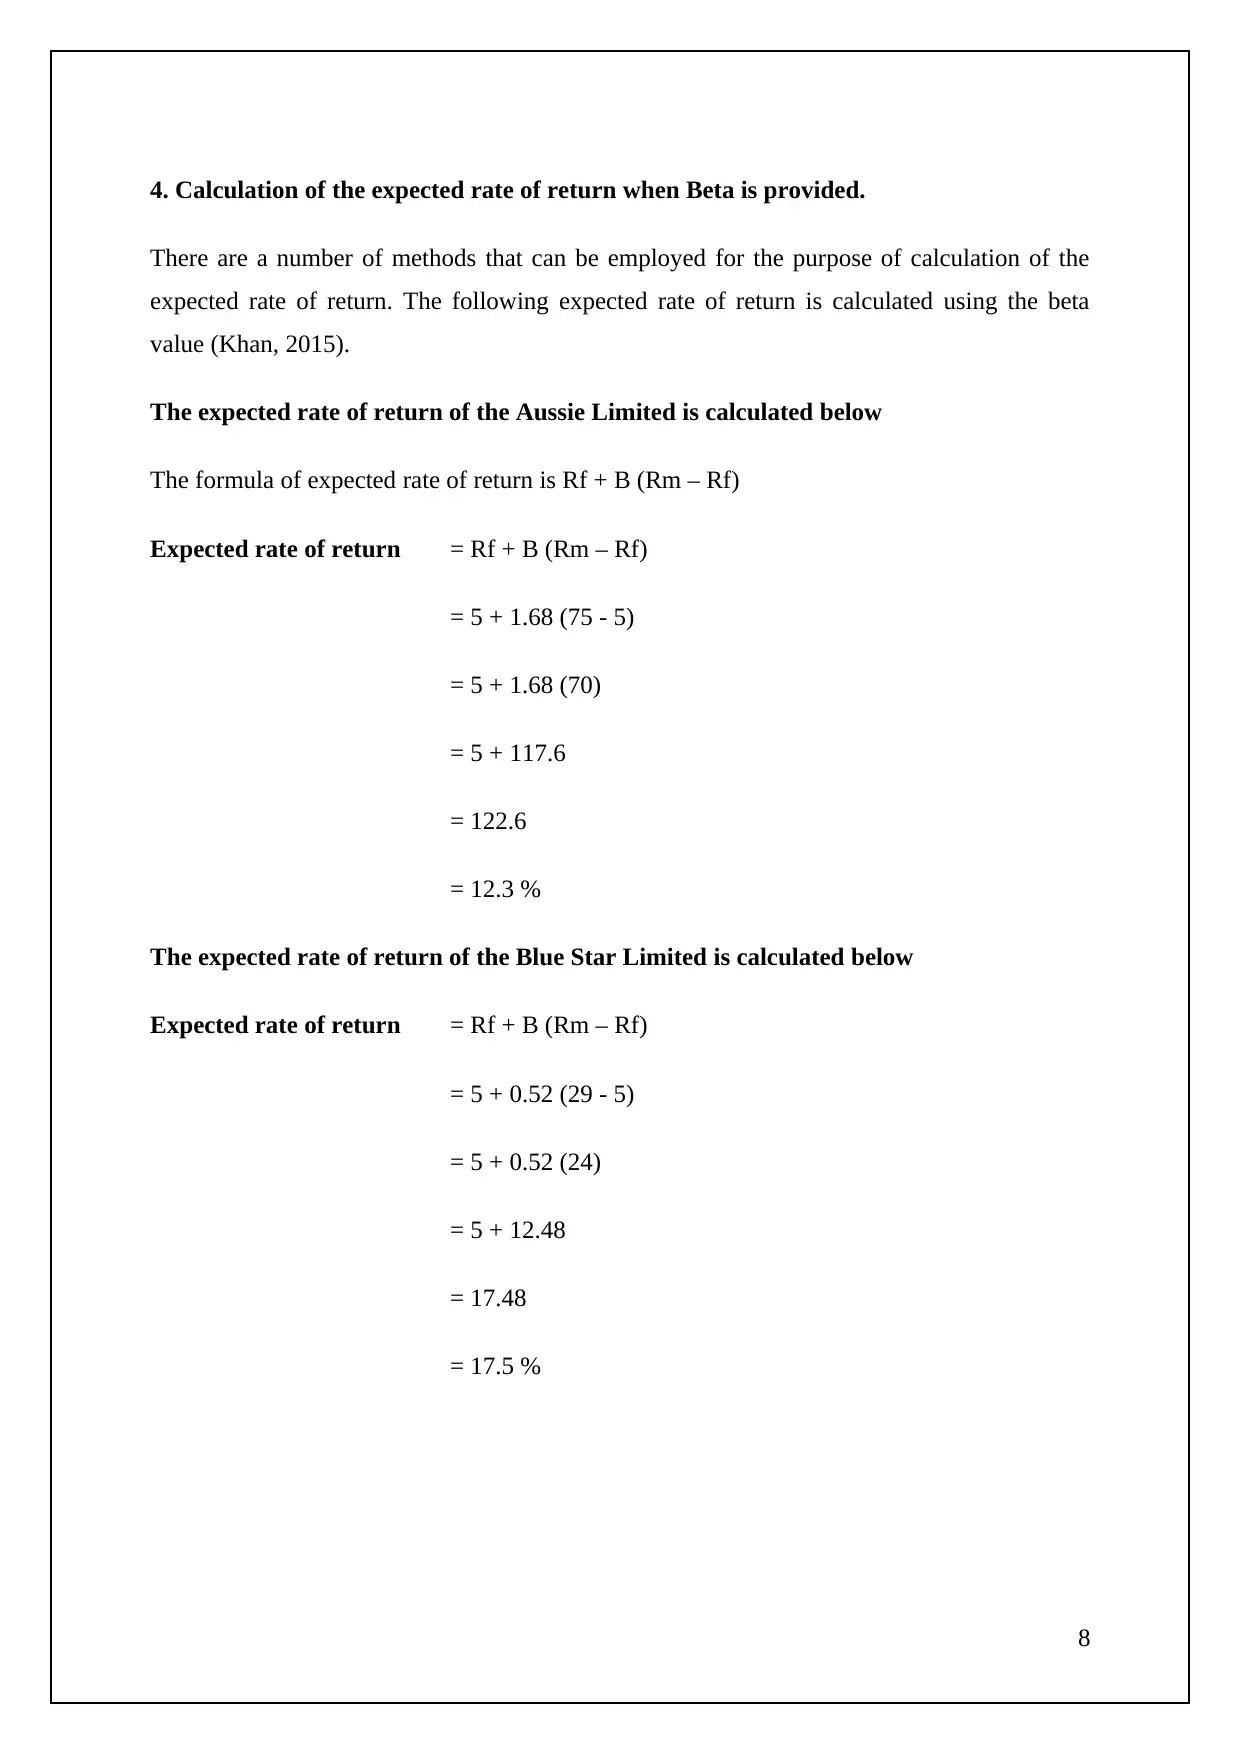
4. Calculation of the expected rate of return when Beta is provided.
There are a number of methods that can be employed for the purpose of calculation of the
expected rate of return. The following expected rate of return is calculated using the beta
value (Khan, 2015).
The expected rate of return of the Aussie Limited is calculated below
The formula of expected rate of return is Rf + B (Rm – Rf)
Expected rate of return = Rf + B (Rm – Rf)
= 5 + 1.68 (75 - 5)
= 5 + 1.68 (70)
= 5 + 117.6
= 122.6
= 12.3 %
The expected rate of return of the Blue Star Limited is calculated below
Expected rate of return = Rf + B (Rm – Rf)
= 5 + 0.52 (29 - 5)
= 5 + 0.52 (24)
= 5 + 12.48
= 17.48
= 17.5 %
8
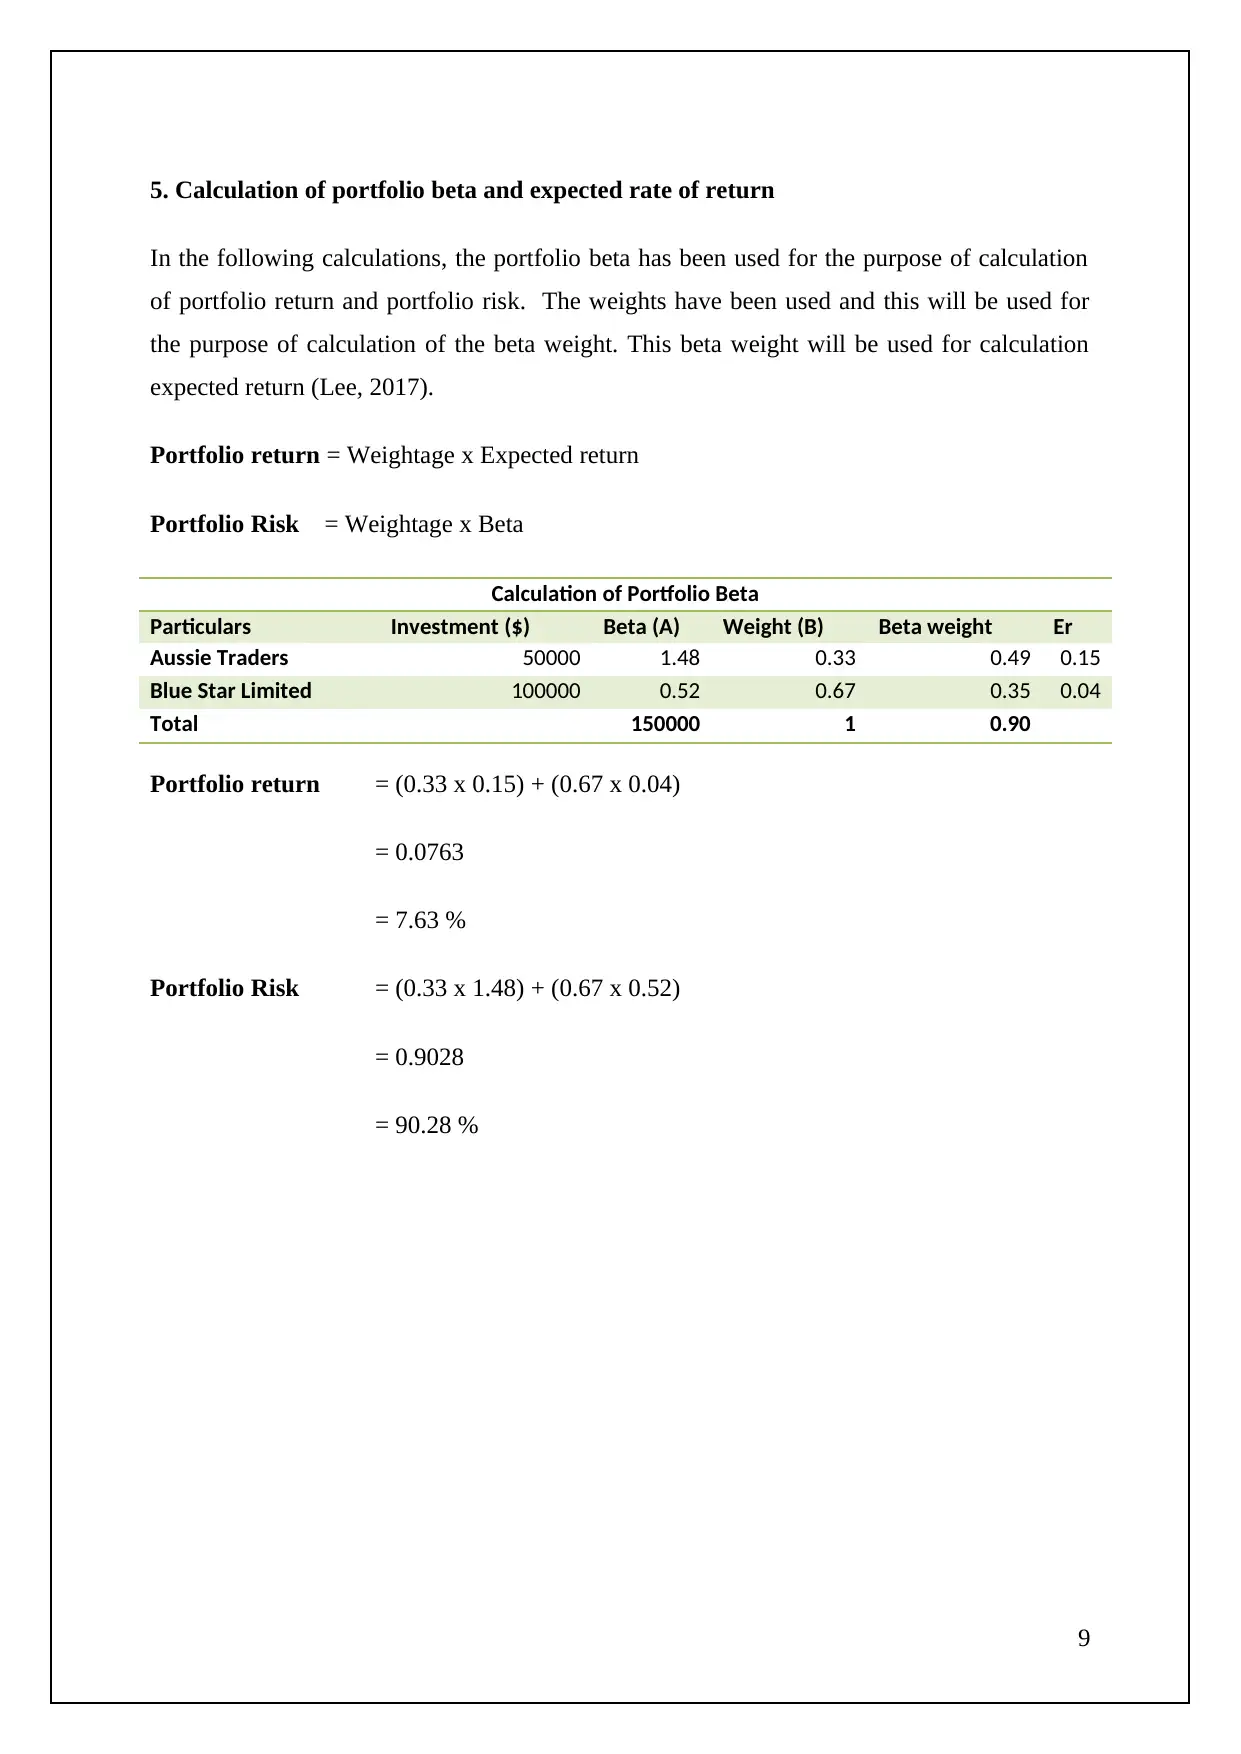
5. Calculation of portfolio beta and expected rate of return
In the following calculations, the portfolio beta has been used for the purpose of calculation
of portfolio return and portfolio risk. The weights have been used and this will be used for
the purpose of calculation of the beta weight. This beta weight will be used for calculation
expected return (Lee, 2017).
Portfolio return = Weightage x Expected return
Portfolio Risk = Weightage x Beta
Calculation of Portfolio Beta
Particulars Investment ($) Beta (A) Weight (B) Beta weight Er
Aussie Traders 50000 1.48 0.33 0.49 0.15
Blue Star Limited 100000 0.52 0.67 0.35 0.04
Total 150000 1 0.90
Portfolio return = (0.33 x 0.15) + (0.67 x 0.04)
= 0.0763
= 7.63 %
Portfolio Risk = (0.33 x 1.48) + (0.67 x 0.52)
= 0.9028
= 90.28 %
9
⊘ This is a preview!⊘
Do you want full access?
Subscribe today to unlock all pages.
Trusted by 1+ million students worldwide
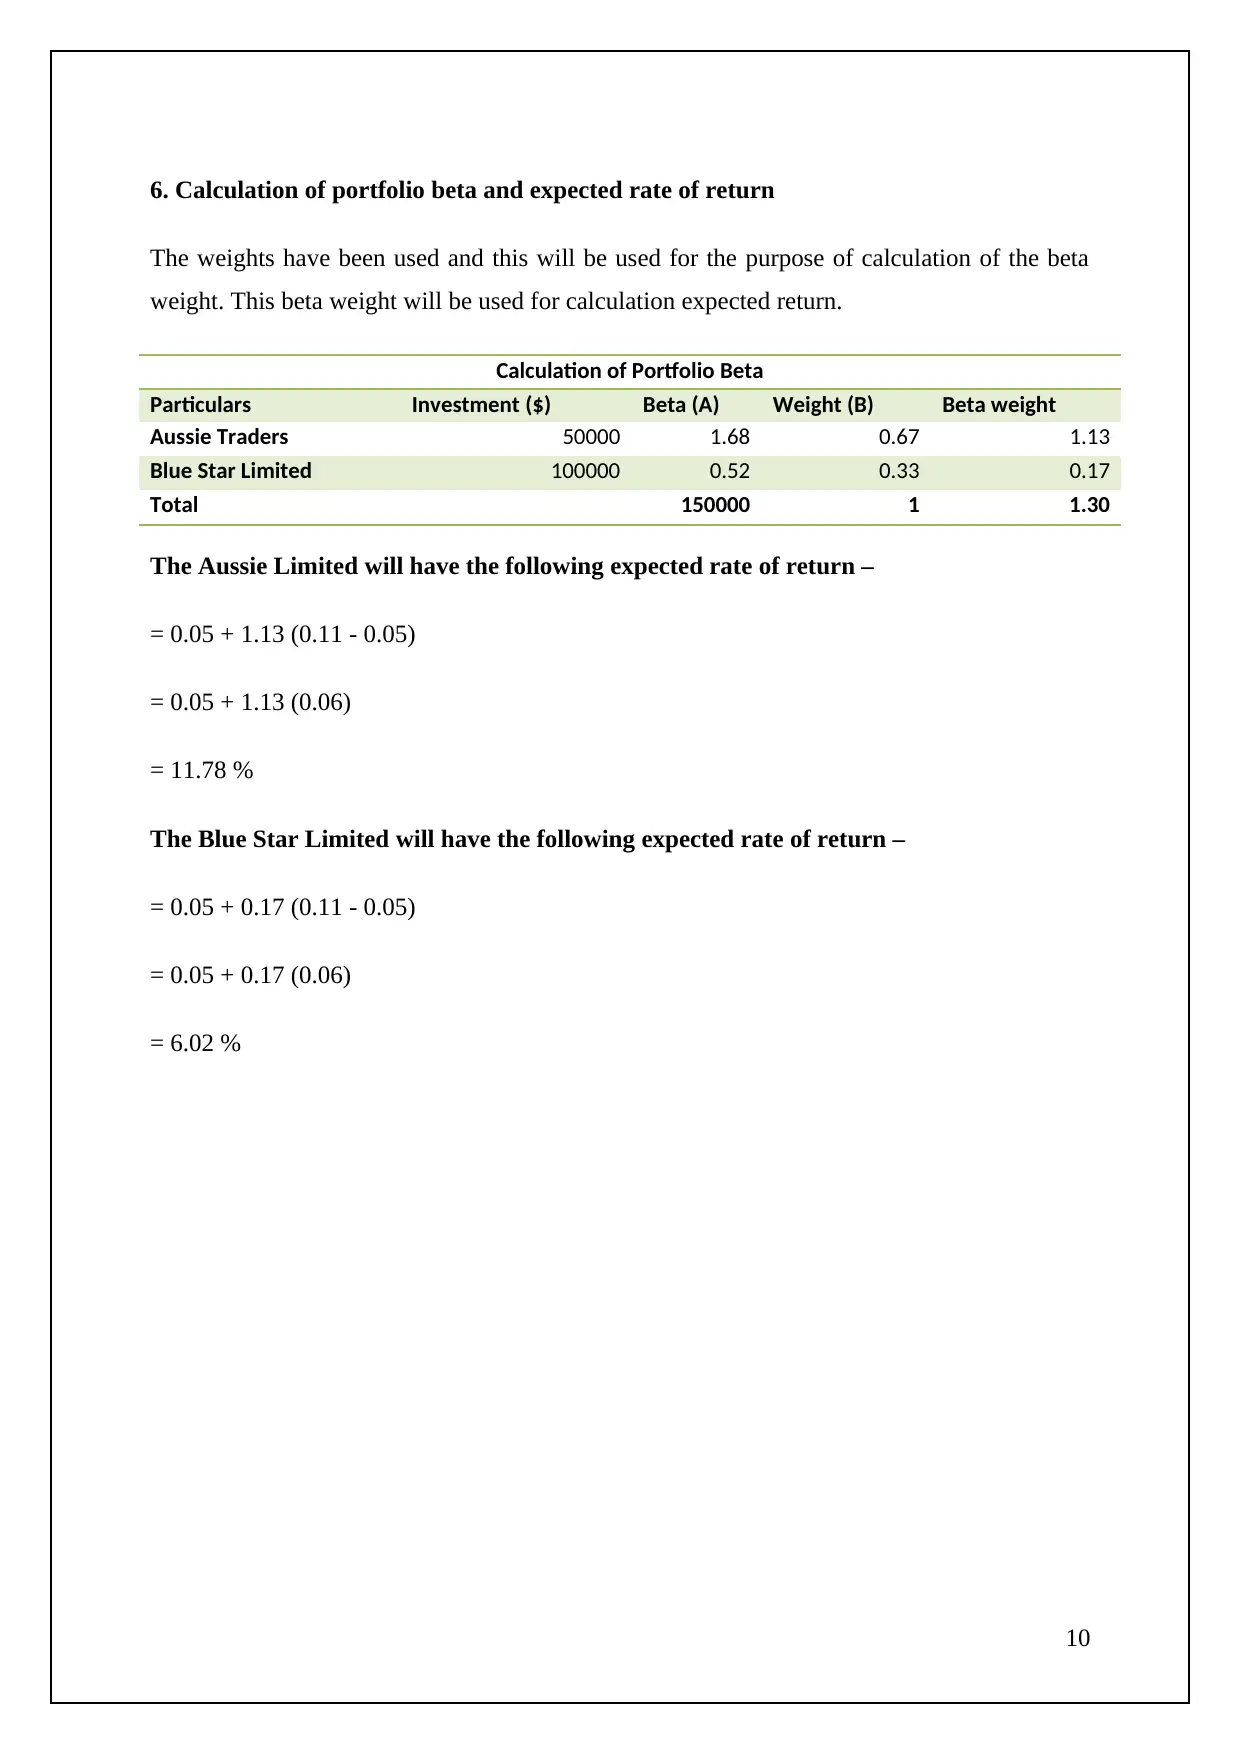
6. Calculation of portfolio beta and expected rate of return
The weights have been used and this will be used for the purpose of calculation of the beta
weight. This beta weight will be used for calculation expected return.
Calculation of Portfolio Beta
Particulars Investment ($) Beta (A) Weight (B) Beta weight
Aussie Traders 50000 1.68 0.67 1.13
Blue Star Limited 100000 0.52 0.33 0.17
Total 150000 1 1.30
The Aussie Limited will have the following expected rate of return –
= 0.05 + 1.13 (0.11 - 0.05)
= 0.05 + 1.13 (0.06)
= 11.78 %
The Blue Star Limited will have the following expected rate of return –
= 0.05 + 0.17 (0.11 - 0.05)
= 0.05 + 0.17 (0.06)
= 6.02 %
10
Paraphrase This Document
Need a fresh take? Get an instant paraphrase of this document with our AI Paraphraser

7. Which of these two-share portfolios do you prefer? Why?
The portfolio that will be chosen for the purpose of investment by an individual is the one
having higher return and lower risk. After the analysis of the portfolios, it can be said that the
portfolio in which the investment is higher in the Blue Star Limited that is $100,000 will be
chosen. In this portfolio, the investment in the Aussie Limited is $50,000. This will enable
the individual to maximize the return on the investment. The risk in this investment is lower
and the return is higher (Dieci et. al., 2018).
11
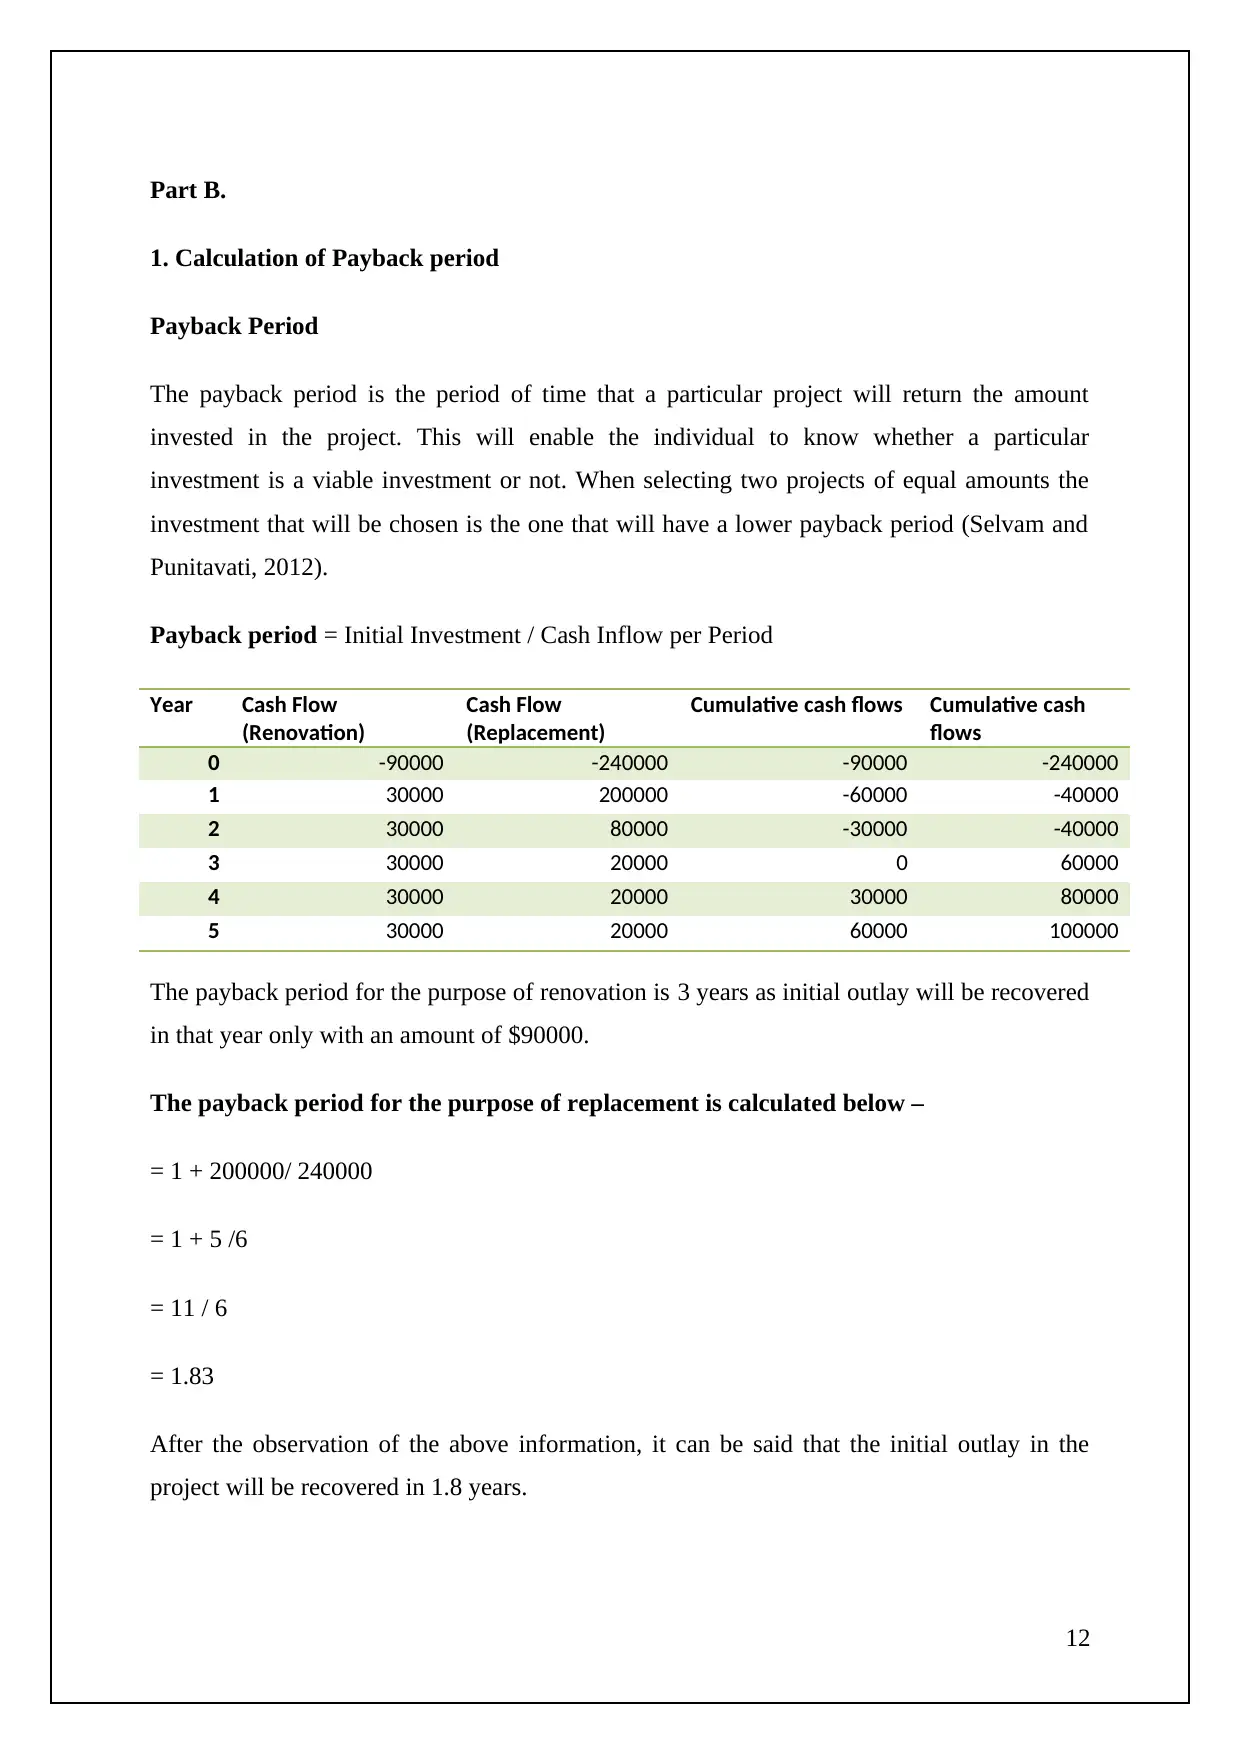
Part B.
1. Calculation of Payback period
Payback Period
The payback period is the period of time that a particular project will return the amount
invested in the project. This will enable the individual to know whether a particular
investment is a viable investment or not. When selecting two projects of equal amounts the
investment that will be chosen is the one that will have a lower payback period (Selvam and
Punitavati, 2012).
Payback period = Initial Investment / Cash Inflow per Period
Year Cash Flow
(Renovation)
Cash Flow
(Replacement)
Cumulative cash flows Cumulative cash
flows
0 -90000 -240000 -90000 -240000
1 30000 200000 -60000 -40000
2 30000 80000 -30000 -40000
3 30000 20000 0 60000
4 30000 20000 30000 80000
5 30000 20000 60000 100000
The payback period for the purpose of renovation is 3 years as initial outlay will be recovered
in that year only with an amount of $90000.
The payback period for the purpose of replacement is calculated below –
= 1 + 200000/ 240000
= 1 + 5 /6
= 11 / 6
= 1.83
After the observation of the above information, it can be said that the initial outlay in the
project will be recovered in 1.8 years.
12
⊘ This is a preview!⊘
Do you want full access?
Subscribe today to unlock all pages.
Trusted by 1+ million students worldwide
1 out of 18

Your All-in-One AI-Powered Toolkit for Academic Success.
+13062052269
info@desklib.com
Available 24*7 on WhatsApp / Email
![[object Object]](/_next/static/media/star-bottom.7253800d.svg)
Unlock your academic potential
Copyright © 2020–2025 A2Z Services. All Rights Reserved. Developed and managed by ZUCOL.