Introduction to Research: Experiment Design and Result Analysis Report
VerifiedAdded on 2023/06/09

Introduction to Research
Name
Institution Affiliation
City/Sate
Date
Paraphrase This Document
Table of Contents
Data Collection......................................................................................................................................3
Sources of data..................................................................................................................................3
Data collection table..........................................................................................................................4
Table 1: Data collection table........................................................................................................4
Data storage.......................................................................................................................................5
Table 2: Data storage table............................................................................................................6
Design and implementation...................................................................................................................6
Data pre-processing...........................................................................................................................6
Feature selection/ dimension reduction..........................................................................................8
Table 3: Feature selection/dimension reduction table....................................................................9
Experiment design...............................................................................................................................10
Detailed design process...................................................................................................................10
Table 4: The questionnaire questions table..................................................................................10
Table 5: Demographic information table.....................................................................................11
Research implementation....................................................................................................................12
Data analysis tools and software......................................................................................................12
Table 6: Analysed demographic population information.............................................................12
Results.................................................................................................................................................13
Results analysis...............................................................................................................................14
Table 7: Research results.............................................................................................................14
The expected results........................................................................................................................15
Results summary.................................................................................................................................16
Data Collection
For any given research it is important to have the necessary data requirements so as to make
sure that the experiment is undertaken successful. Consequently, prior to commencing on the
experiment, the researcher is supposed to determine and identify suitable sources of data that
the research will gather the needed information (Barker, and Milivojevich, 2016).
Accordingly, data collection is the initial step when it comes to designing as well as
implementing any given experiment. Certainly, after identifying the appropriate sources of
data the researcher is supposed to gather raw data and then recorded it in well-organised
tables for purposes of analysis at the time of implementing the experiment (Curtis et al, 2015,
p. 3462). In this sense there are various steps that are undertaken in at the time of data
gathering such as identifying the most suitable data sources, data collection and storage of the
collected data.
Sources of data
Accordingly, the initial step in any given research experiment, the primary most step is
identification of appropriate sources of the data under investigation (Eyring et al, 2016, p.
1939). Therefore, it is highly advisable that the researcher determine the most appropriate
type of data which is necessary for the experiment to avoid cases of collecting data which is
not relevant with the research under investigation (Montgomery, 2017). Therefore, the type
of data that will be collected will be used to show how business organisation utilise shopping
apps to market and sale their products. The reason of picking of business organisation to be
able to identify how these organisations work to ensure that customer’s personal information
is protected. Thus, it is significant for the researcher to select on the most suitable and
dependable sources of data where it will be possible to interact with diverse personalities
using different social applications to improve their personal data privacy (Candioti, De Zan,
⊘ This is a preview!⊘
Do you want full access?
Subscribe today to unlock all pages.
Trusted by 1+ million students worldwide
Cámara, and Goicoechea, 2014. p. 124). Certainly, some of the probable public place sources
that are likely to provide the investigator with the appropriate data include malls, companies
and small and medium-sized enterprises and supermarkets which run their business using
social applications to interact with their existing and potential customers.
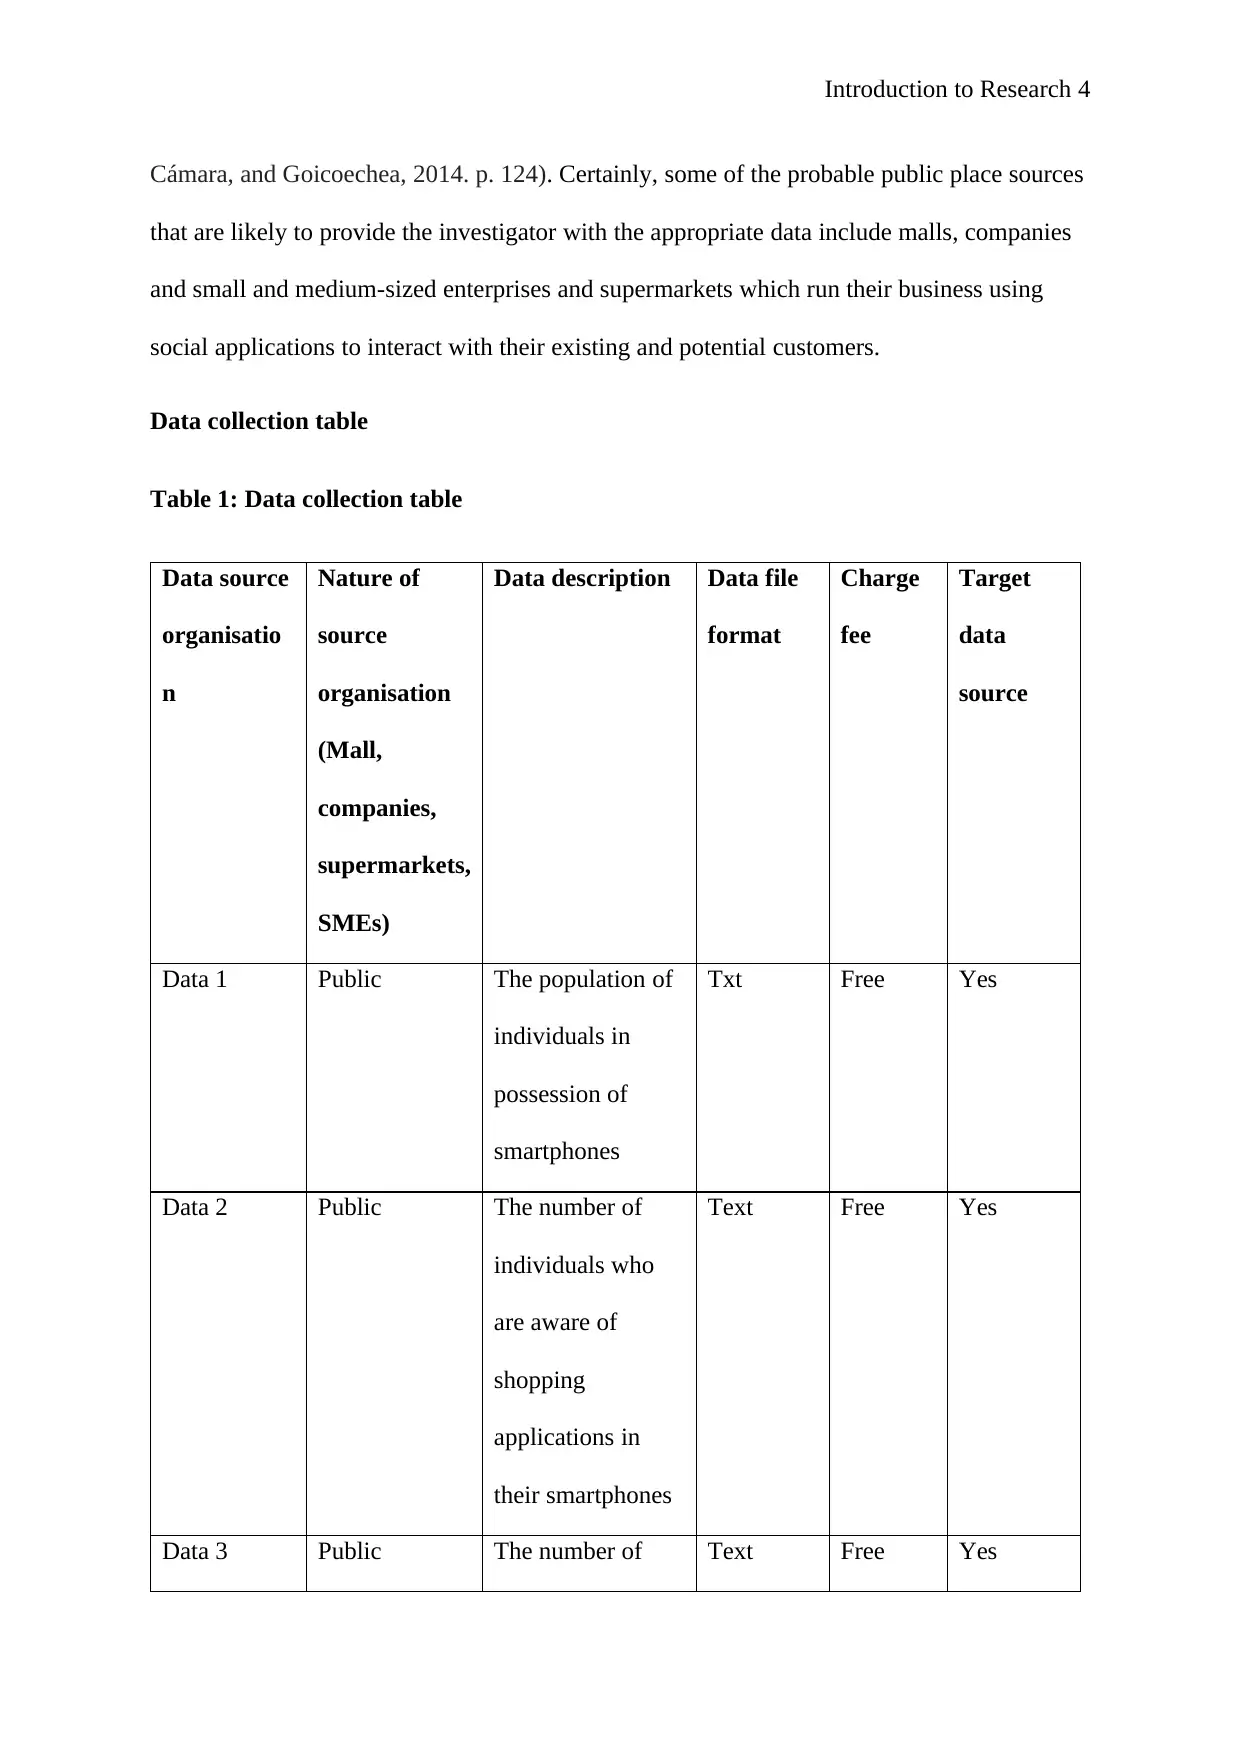
Data collection table
Table 1: Data collection table
Data source
organisatio
n
Nature of
source
organisation
(Mall,
companies,
supermarkets,
SMEs)
Data description Data file
format
Charge
fee
Target
data
source
Data 1 Public The population of
individuals in
possession of
smartphones
Txt Free Yes
Data 2 Public The number of
individuals who
are aware of
shopping
applications in
their smartphones
Text Free Yes
Data 3 Public The number of Text Free Yes
Paraphrase This Document
people who have
downloaded the
shopping apps
Data 4 Public The number of
individuals who
follow the
shopping
applications
Text Free Yes
Data 5 Public Individuals who
feel the shopping
apps are effective
Text Free Yes
Data 6 Public The number of
people satisfied
with the shopping
apps
Text Free Yes
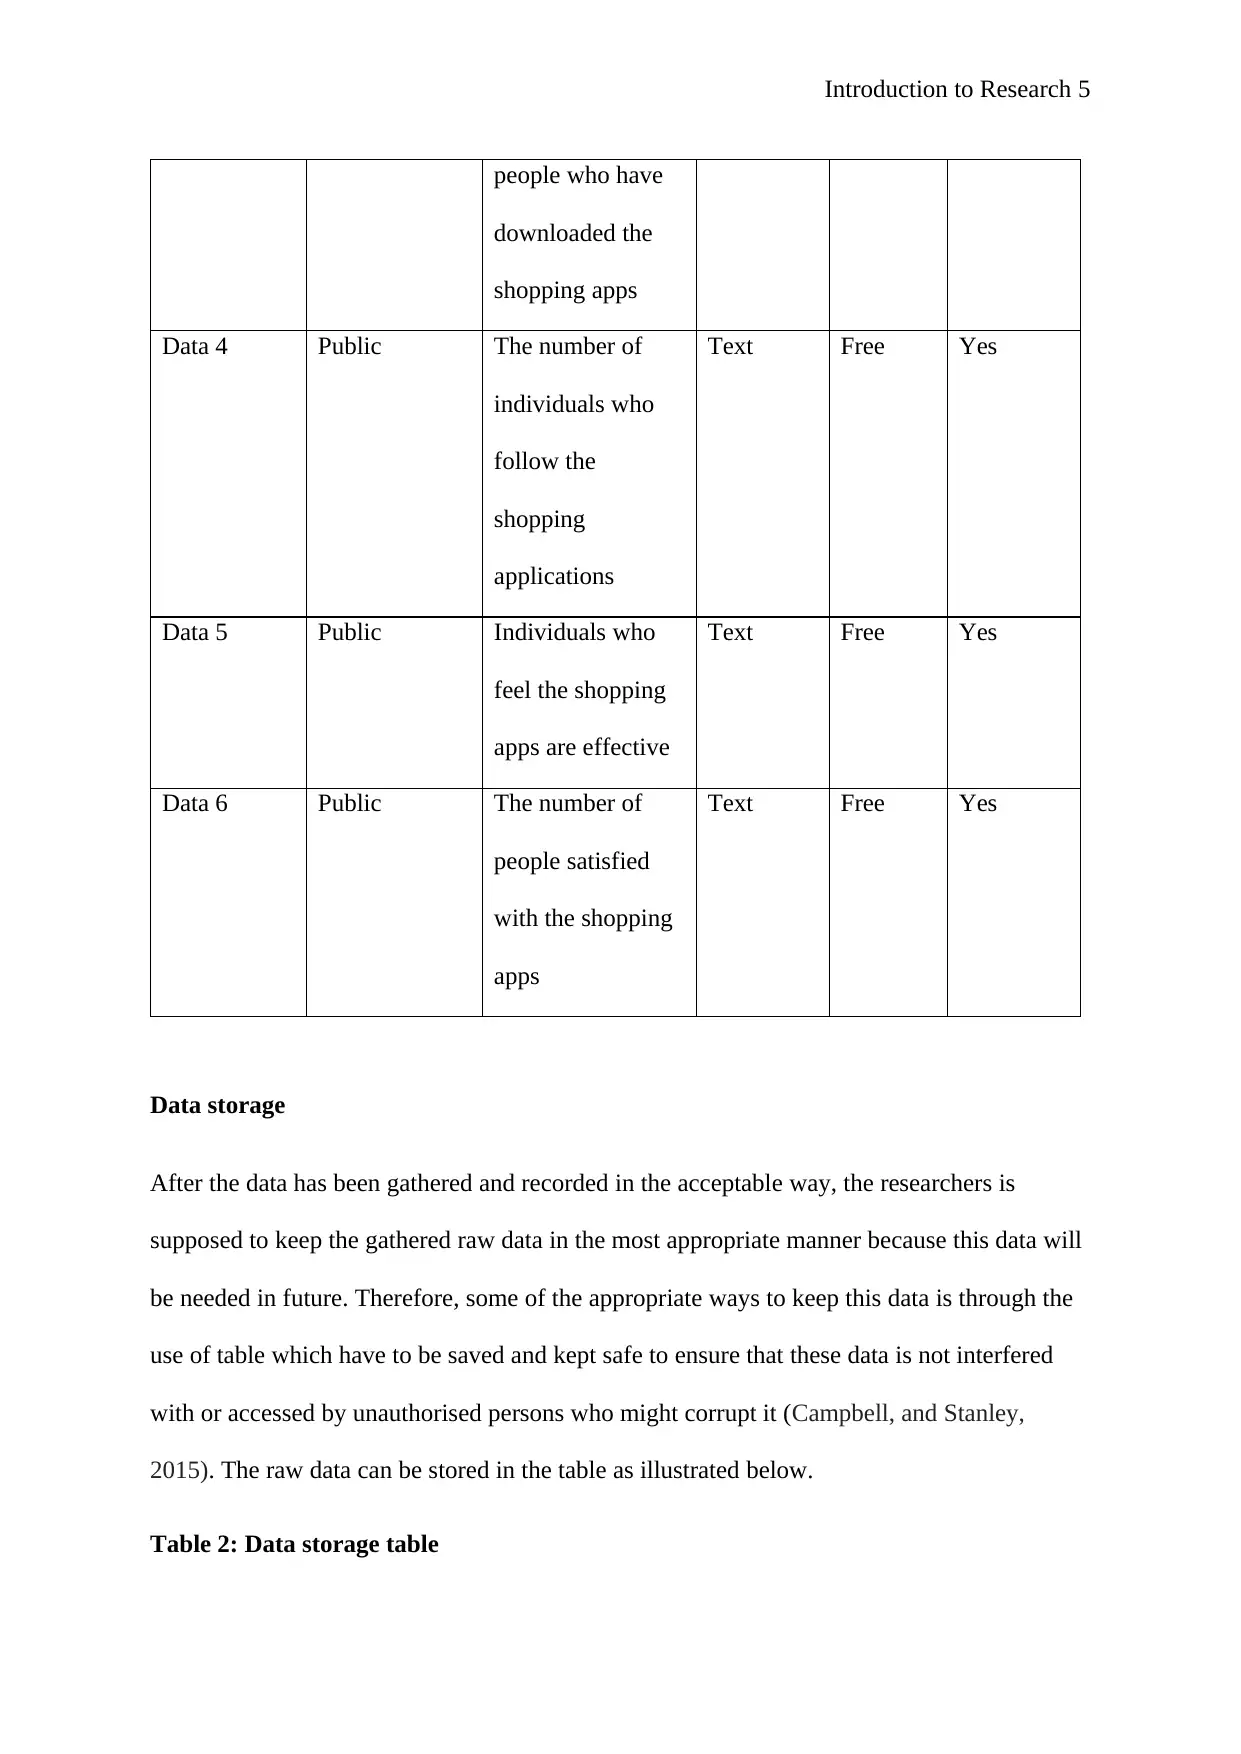
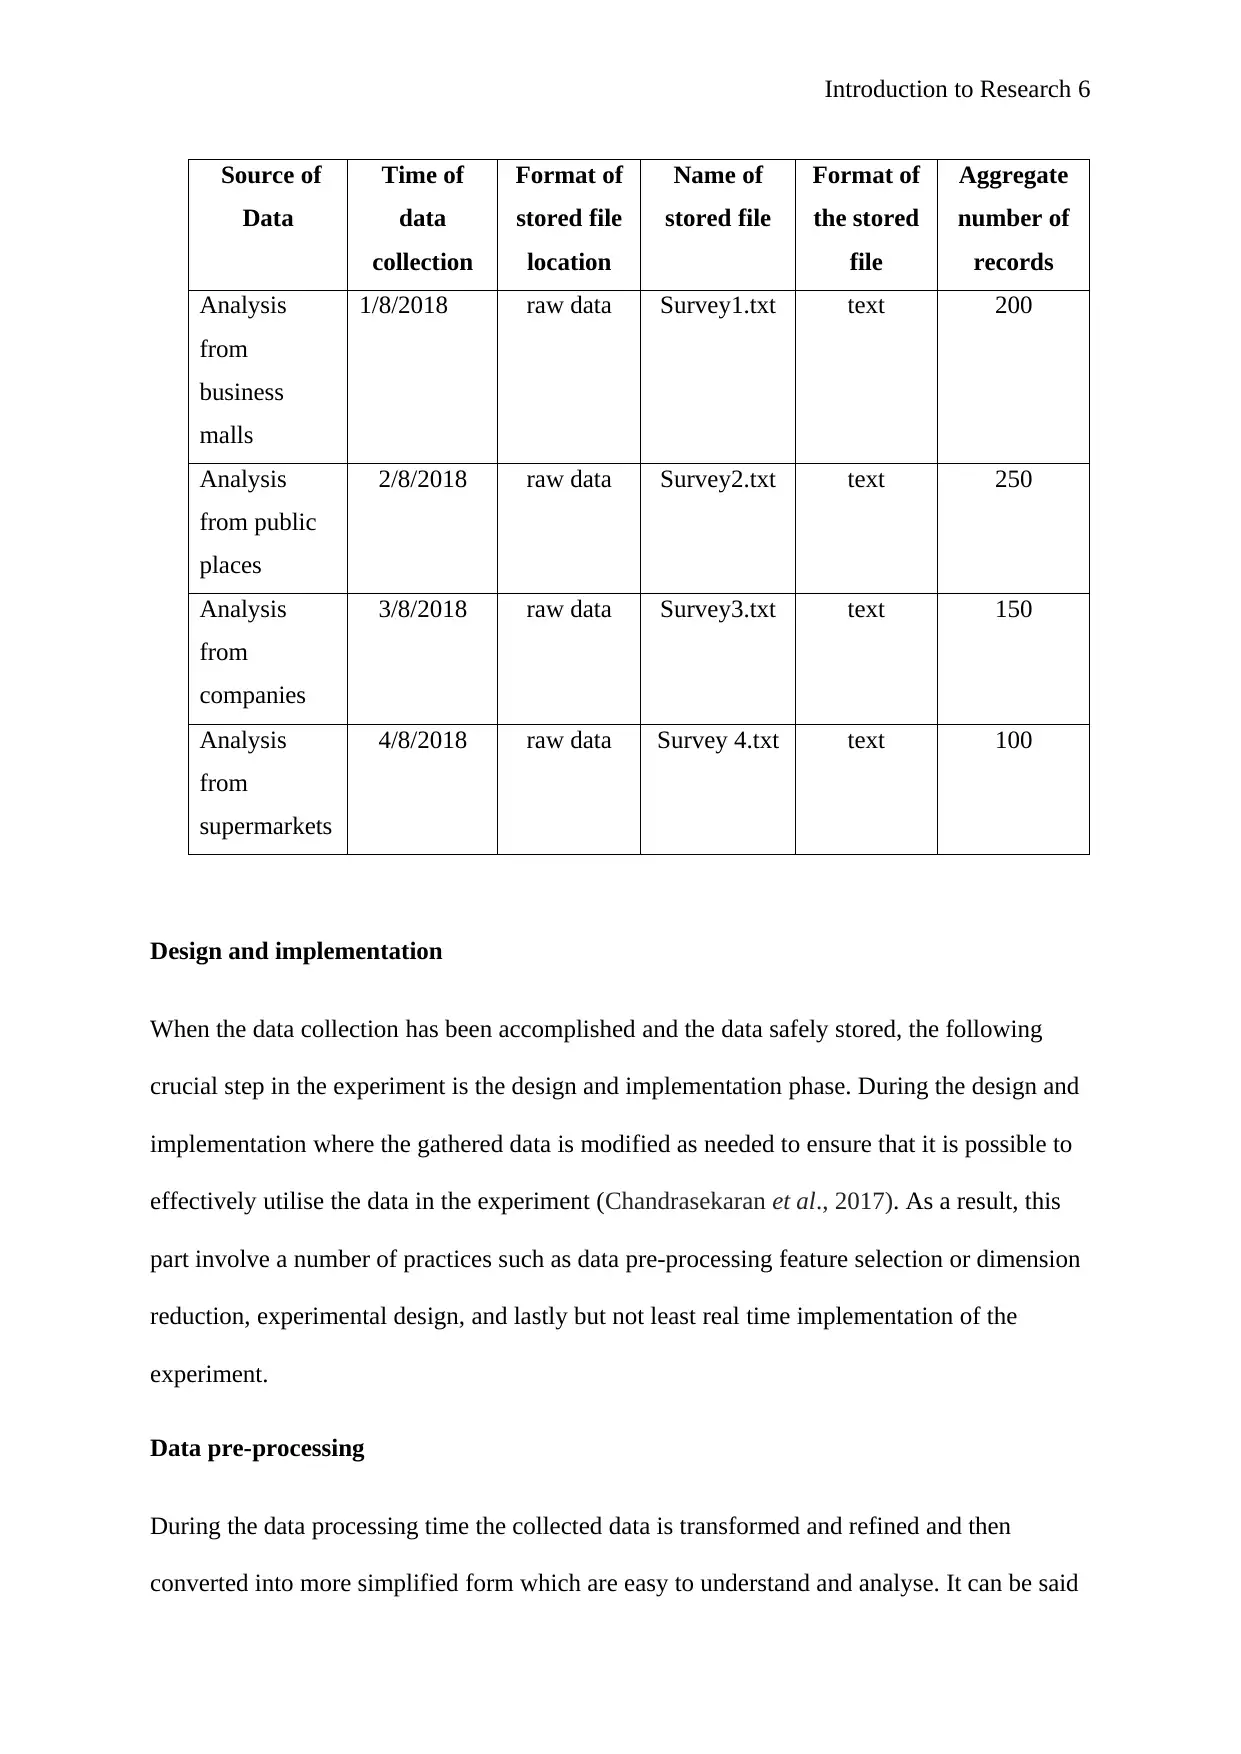
Data storage
After the data has been gathered and recorded in the acceptable way, the researchers is
supposed to keep the gathered raw data in the most appropriate manner because this data will
be needed in future. Therefore, some of the appropriate ways to keep this data is through the
use of table which have to be saved and kept safe to ensure that these data is not interfered
with or accessed by unauthorised persons who might corrupt it (Campbell, and Stanley,
2015). The raw data can be stored in the table as illustrated below.
Table 2: Data storage table
Source of
Data
Time of
data
collection
Format of
stored file
location
Name of
stored file
Format of
the stored
file
Aggregate
number of
records
Analysis
from
business
malls
1/8/2018 raw data Survey1.txt text 200
Analysis
from public
places
2/8/2018 raw data Survey2.txt text 250
Analysis
from
companies
3/8/2018 raw data Survey3.txt text 150
Analysis
from
supermarkets
4/8/2018 raw data Survey 4.txt text 100
Design and implementation
When the data collection has been accomplished and the data safely stored, the following
crucial step in the experiment is the design and implementation phase. During the design and
implementation where the gathered data is modified as needed to ensure that it is possible to
effectively utilise the data in the experiment (Chandrasekaran et al., 2017). As a result, this
part involve a number of practices such as data pre-processing feature selection or dimension
reduction, experimental design, and lastly but not least real time implementation of the
experiment.
Data pre-processing
During the data processing time the collected data is transformed and refined and then
converted into more simplified form which are easy to understand and analyse. It can be said
⊘ This is a preview!⊘
Do you want full access?
Subscribe today to unlock all pages.
Trusted by 1+ million students worldwide
that the data pre-processing is conducted to aid the researcher in preparing the data to be
utilised in the experiment so that it can realise all the necessary features which have to be
processed while analysing the experiment. Accordingly, data pre-processing is an essential
procedure in an experiment since it plays a significant part in enhancing the usability and
readability of the collected raw data. Consequently, once the experimental raw data has been
collected, it is advisable to perform data pre-processing prior to making use of the
experiment. In that case, there are several approaches utilised to perform data pre-processing,
but the most appropriate approaches include data integration, data cleaning, data reduction,
and data transformation.
Data integration: This is a pre-processing approach whereby the collected raw data is
improved and then changed into a suitable form or formats accordingly. Therefore, the main
practices during this phase include smoothing of data, data normalisation, summing up of the
data, as well as data generalisation.
Data cleaning: This is a pre-processing technique that involves normalisation of the data to
substitute for some of the erroneous data values, reduction of the data noise and eliminating
of the unnecessary inconsistency made during data coaction time. Certainly, data cleaning
helps to ensure that the researcher come up with data which is less noisy, complete, and
consistent. As a result, this makes it easier for the researcher to analyse the experimental
results.
Data reduction: Accordingly, this process entails simplifying the data by eliminating
unnecessary and unwanted data while ensuring that the data is not altered so as not to
compromise the quality and integrity of the data. Data reduction involves a range of
techniques such as data discretisation, dimension reduction, data compression, and
numerosity reduction. Indeed, all this approaches are significant in the sense that they aid to
Paraphrase This Document
eliminate unwanted and unnecessary data contained in the raw collected data. As a result, it
help to ensuring that the researcher only remain with accurate data which can be effectively
used in the experimental process with much easy.
Data transformation: It is pre-processing technique that combine data that seem to be related
even though it can be originating from different sources so as to come up with a single and
much dependable data that can be utilised as one in the experiment. Thus it makes the
experiment process easier.
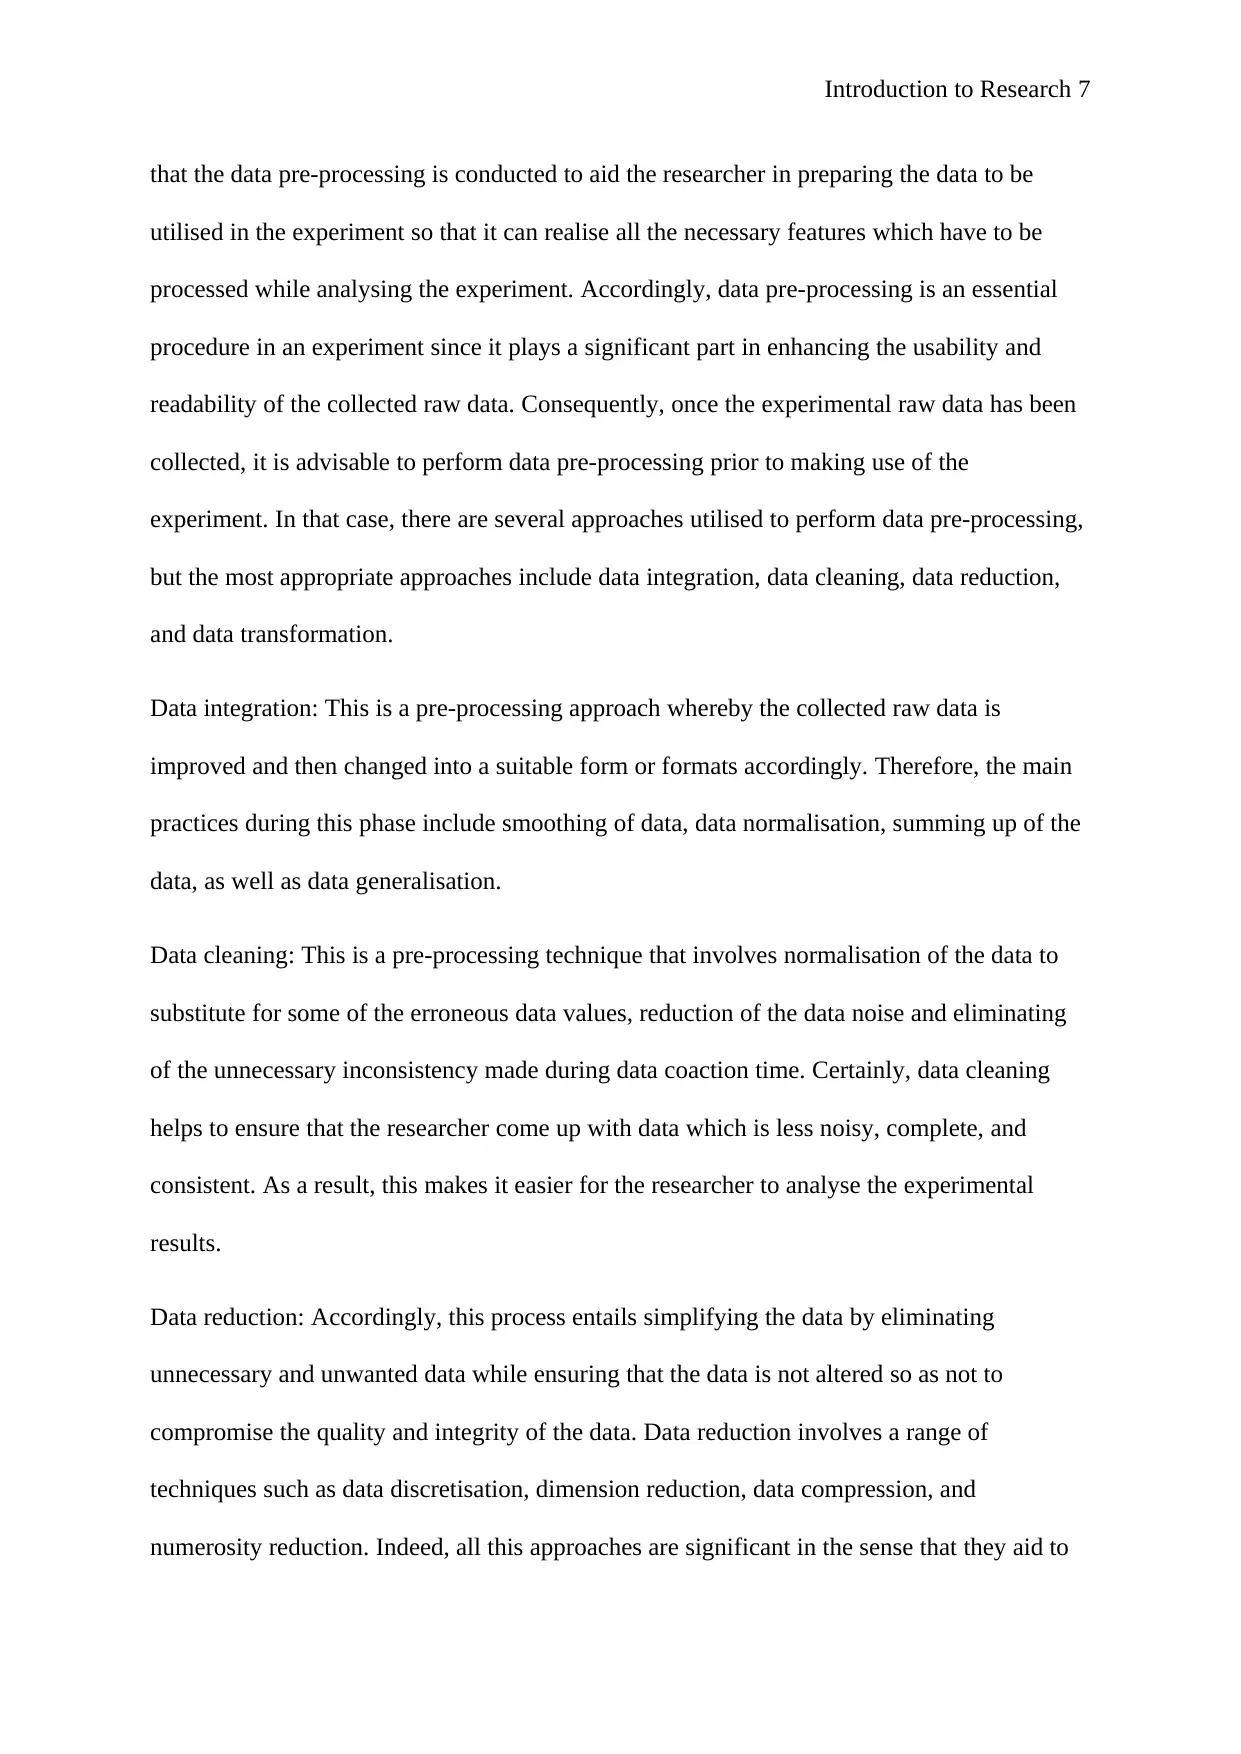
Accordingly, the figure below provides an illustration of a summary of the major data pre-
processing techniques used in experiments.
Figure 1: Data pre-processing techniqu
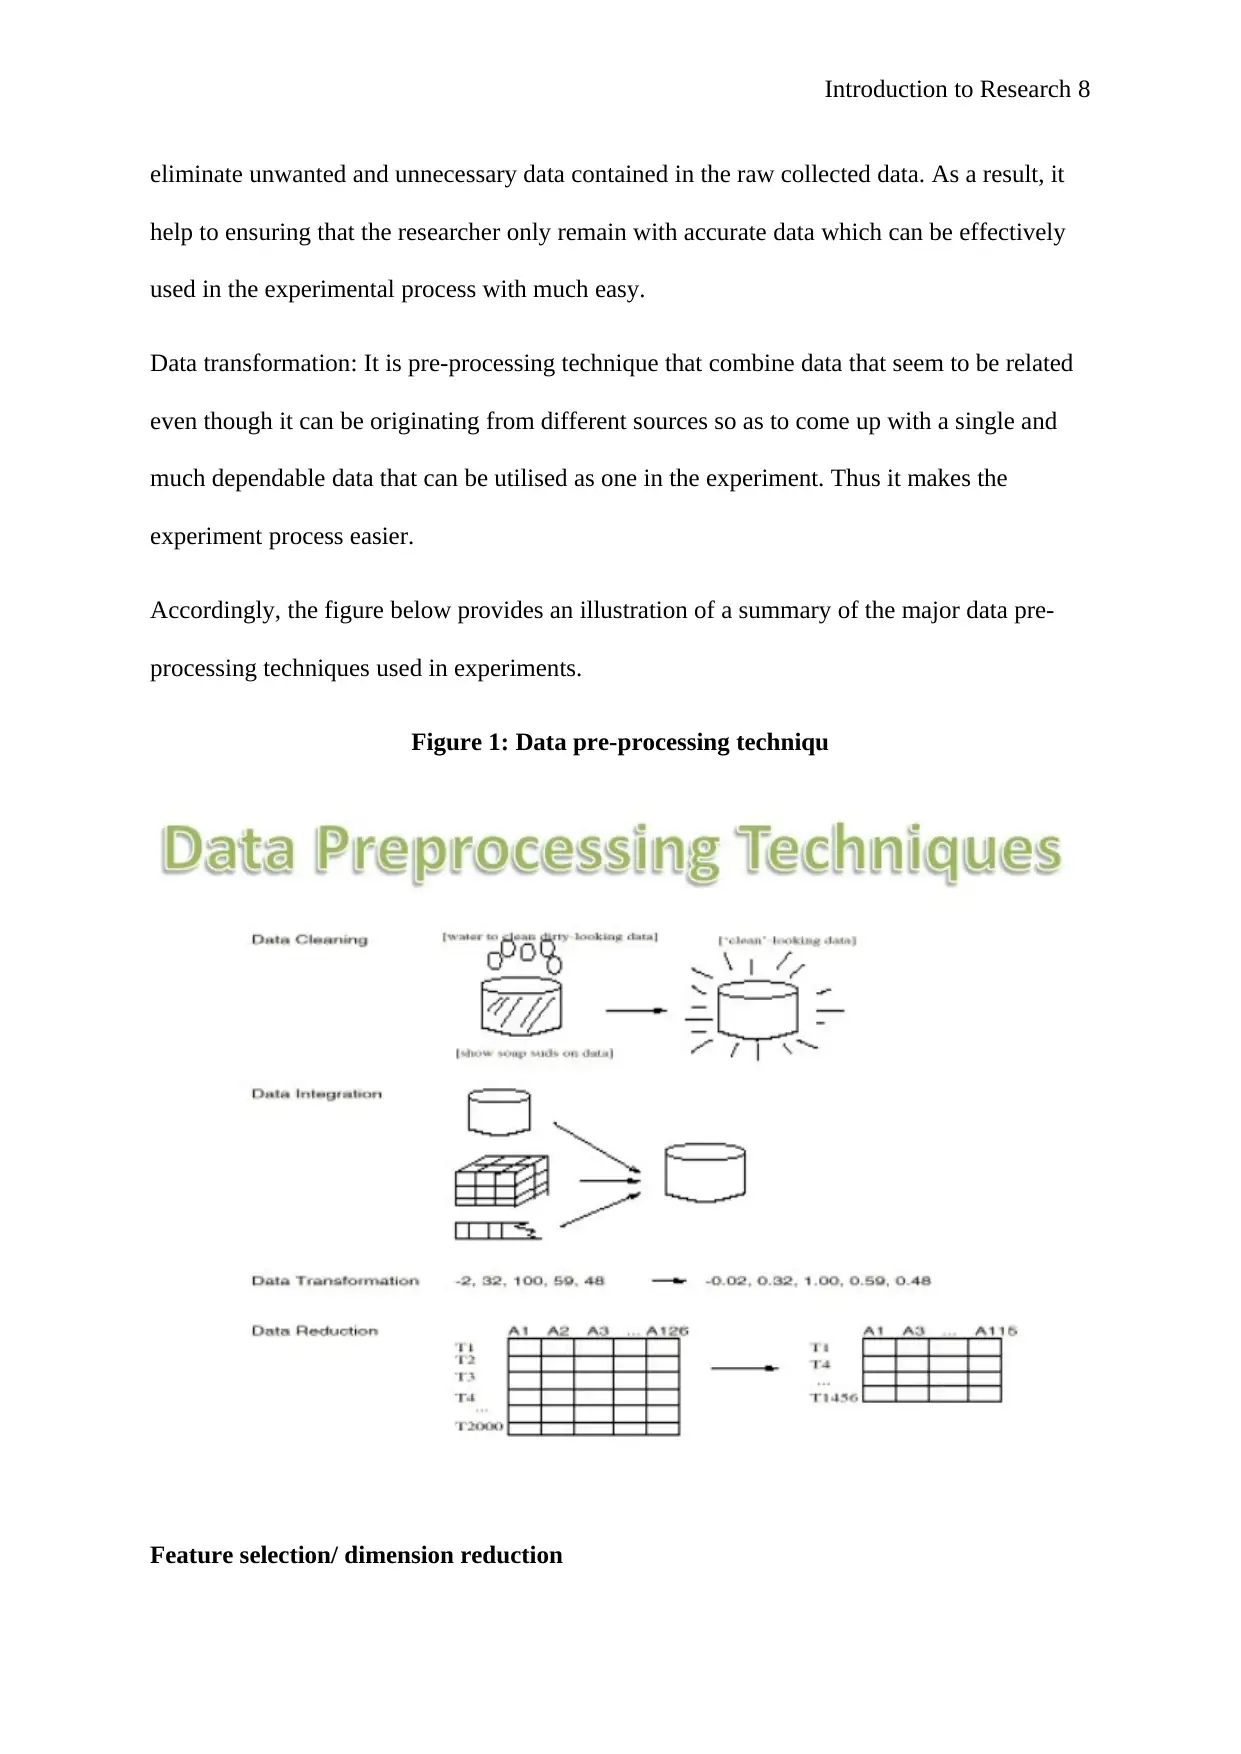
Feature selection/ dimension reduction
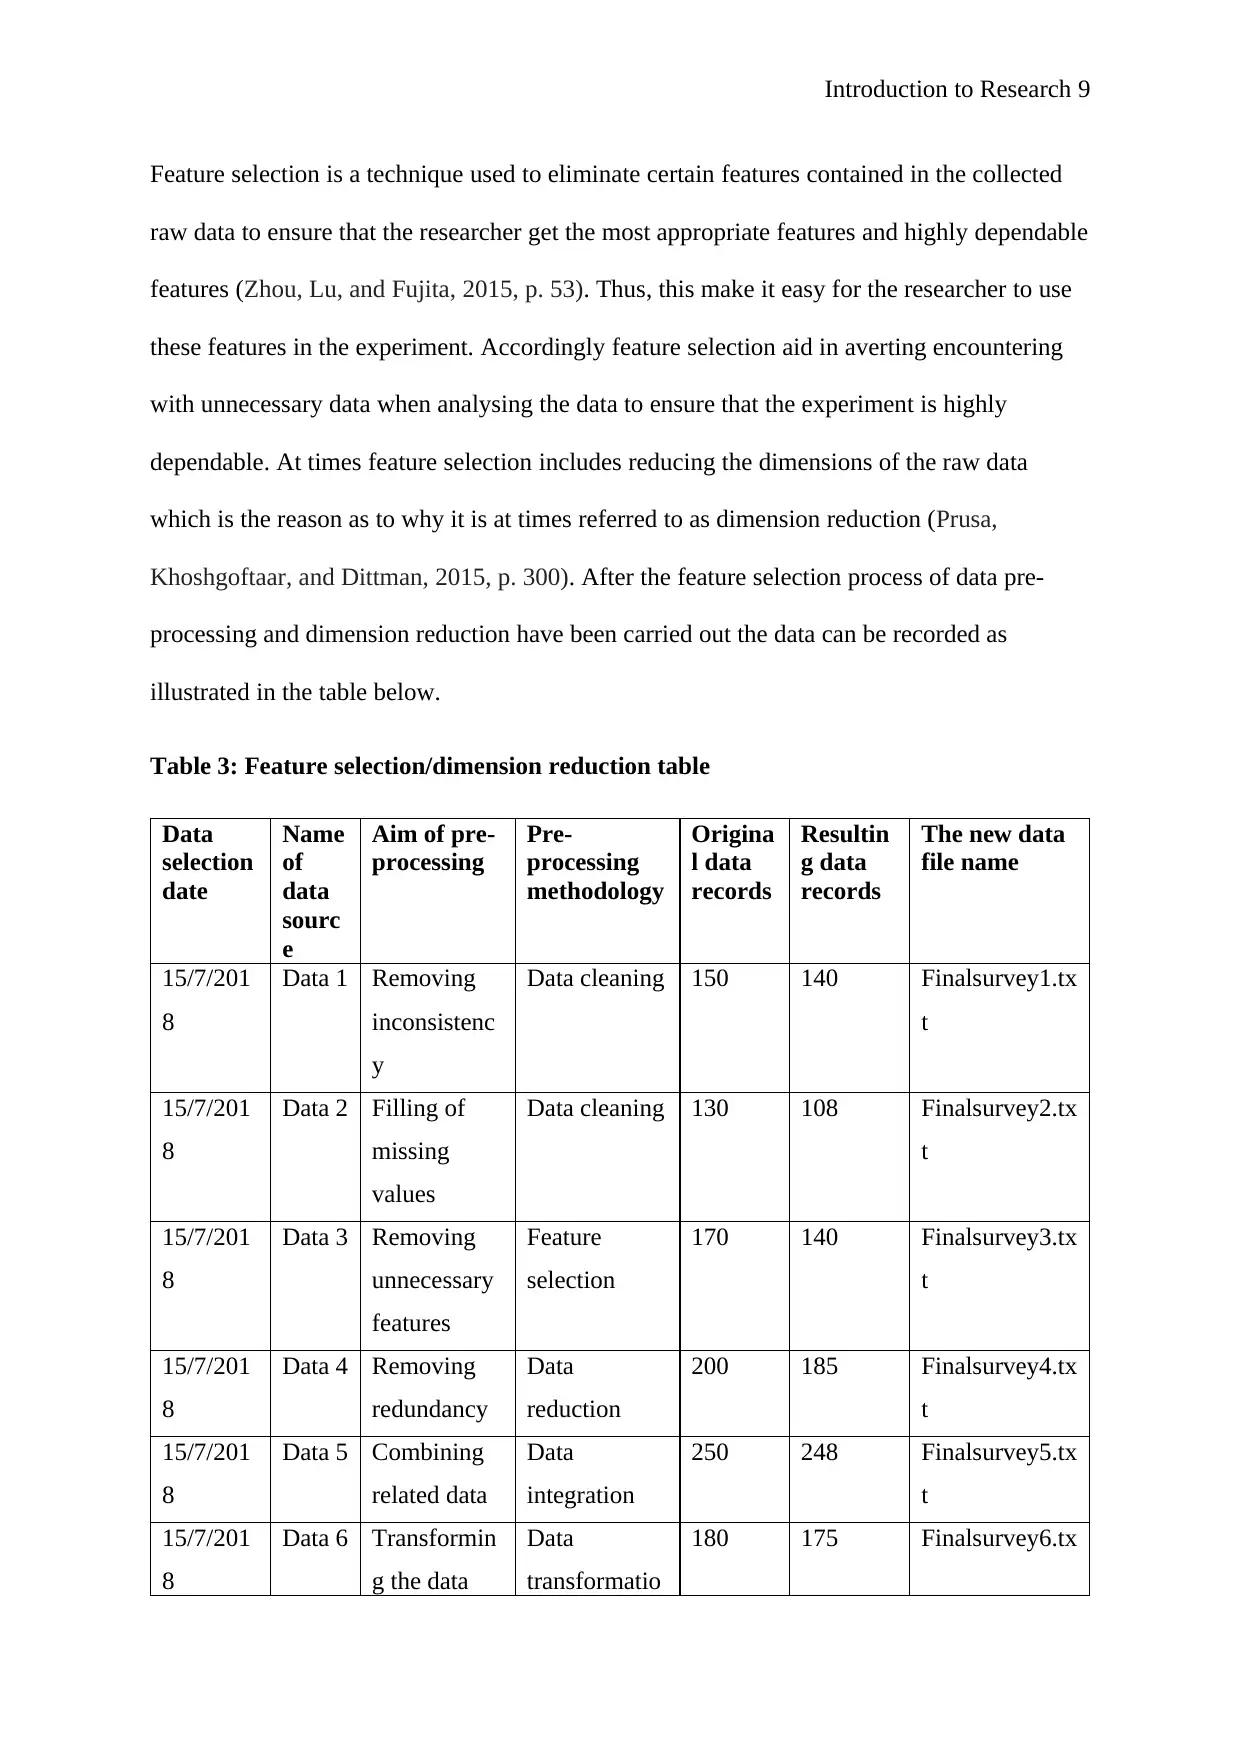
Feature selection is a technique used to eliminate certain features contained in the collected
raw data to ensure that the researcher get the most appropriate features and highly dependable
features (Zhou, Lu, and Fujita, 2015, p. 53). Thus, this make it easy for the researcher to use
these features in the experiment. Accordingly feature selection aid in averting encountering
with unnecessary data when analysing the data to ensure that the experiment is highly
dependable. At times feature selection includes reducing the dimensions of the raw data
which is the reason as to why it is at times referred to as dimension reduction (Prusa,
Khoshgoftaar, and Dittman, 2015, p. 300). After the feature selection process of data pre-
processing and dimension reduction have been carried out the data can be recorded as
illustrated in the table below.
Table 3: Feature selection/dimension reduction table
Data
selection
date
Name
of
data
sourc
e
Aim of pre-
processing
Pre-
processing
methodology
Origina
l data
records
Resultin
g data
records
The new data
file name
15/7/201
8
Data 1 Removing
inconsistenc
y
Data cleaning 150 140 Finalsurvey1.tx
t
15/7/201
8
Data 2 Filling of
missing
values
Data cleaning 130 108 Finalsurvey2.tx
t
15/7/201
8
Data 3 Removing
unnecessary
features
Feature
selection
170 140 Finalsurvey3.tx
t
15/7/201
8
Data 4 Removing
redundancy
Data
reduction
200 185 Finalsurvey4.tx
t
15/7/201
8
Data 5 Combining
related data
Data
integration
250 248 Finalsurvey5.tx
t
15/7/201
8
Data 6 Transformin
g the data
Data
transformatio
180 175 Finalsurvey6.tx
⊘ This is a preview!⊘
Do you want full access?
Subscribe today to unlock all pages.
Trusted by 1+ million students worldwide
into the
required
formats
n t
Experiment design
During the experiment design phase it when the methodology is employed is selected and
then applied effectively to the experiment. Thus, it is significant to select a methodology that
will ensure that the experiment is performed in a smooth way with no difficulty.
Detailed design process
In the context of this experiment design the research chose on a hybrid methodology. The
hybrid method is significant since it allow the investigator to gather and analyse both
arithmetical and non-arithmetic data types. Therefore, it was one of the most effective
approach for this experiment because the researcher anticipated coming across both
arithmetical and non-arithmetic data (Haley et al., 2018, p. 4). The researcher was mainly
interested in how shopping apps aided in enhancing the sales of business and how it
effectively met customers’ needs and wants. As a result, the researcher paid visits to different
public places where they could come into contact with this information. Consequently, the
researcher developed some guiding research questions in form of a questionnaires. This
questionnaire comprised of various levels such as the level of education, sex, age and
background of the participants. Also, another section included how the participants utilised
shopping apps in their smartphones. The researcher used both closed-ended questions and
open-ended questions to allow participants to give their opinions regarding their experience
with the shopping apps. For purposes of ethical considerations the research observed high
Paraphrase This Document
ethical standards by ensuring that the questions asked could not infringed the respondent’s
personal questions. Therefore, the research utilised statistical figures to record and analyse
the collected data from the participants which are illustrated in the table below.
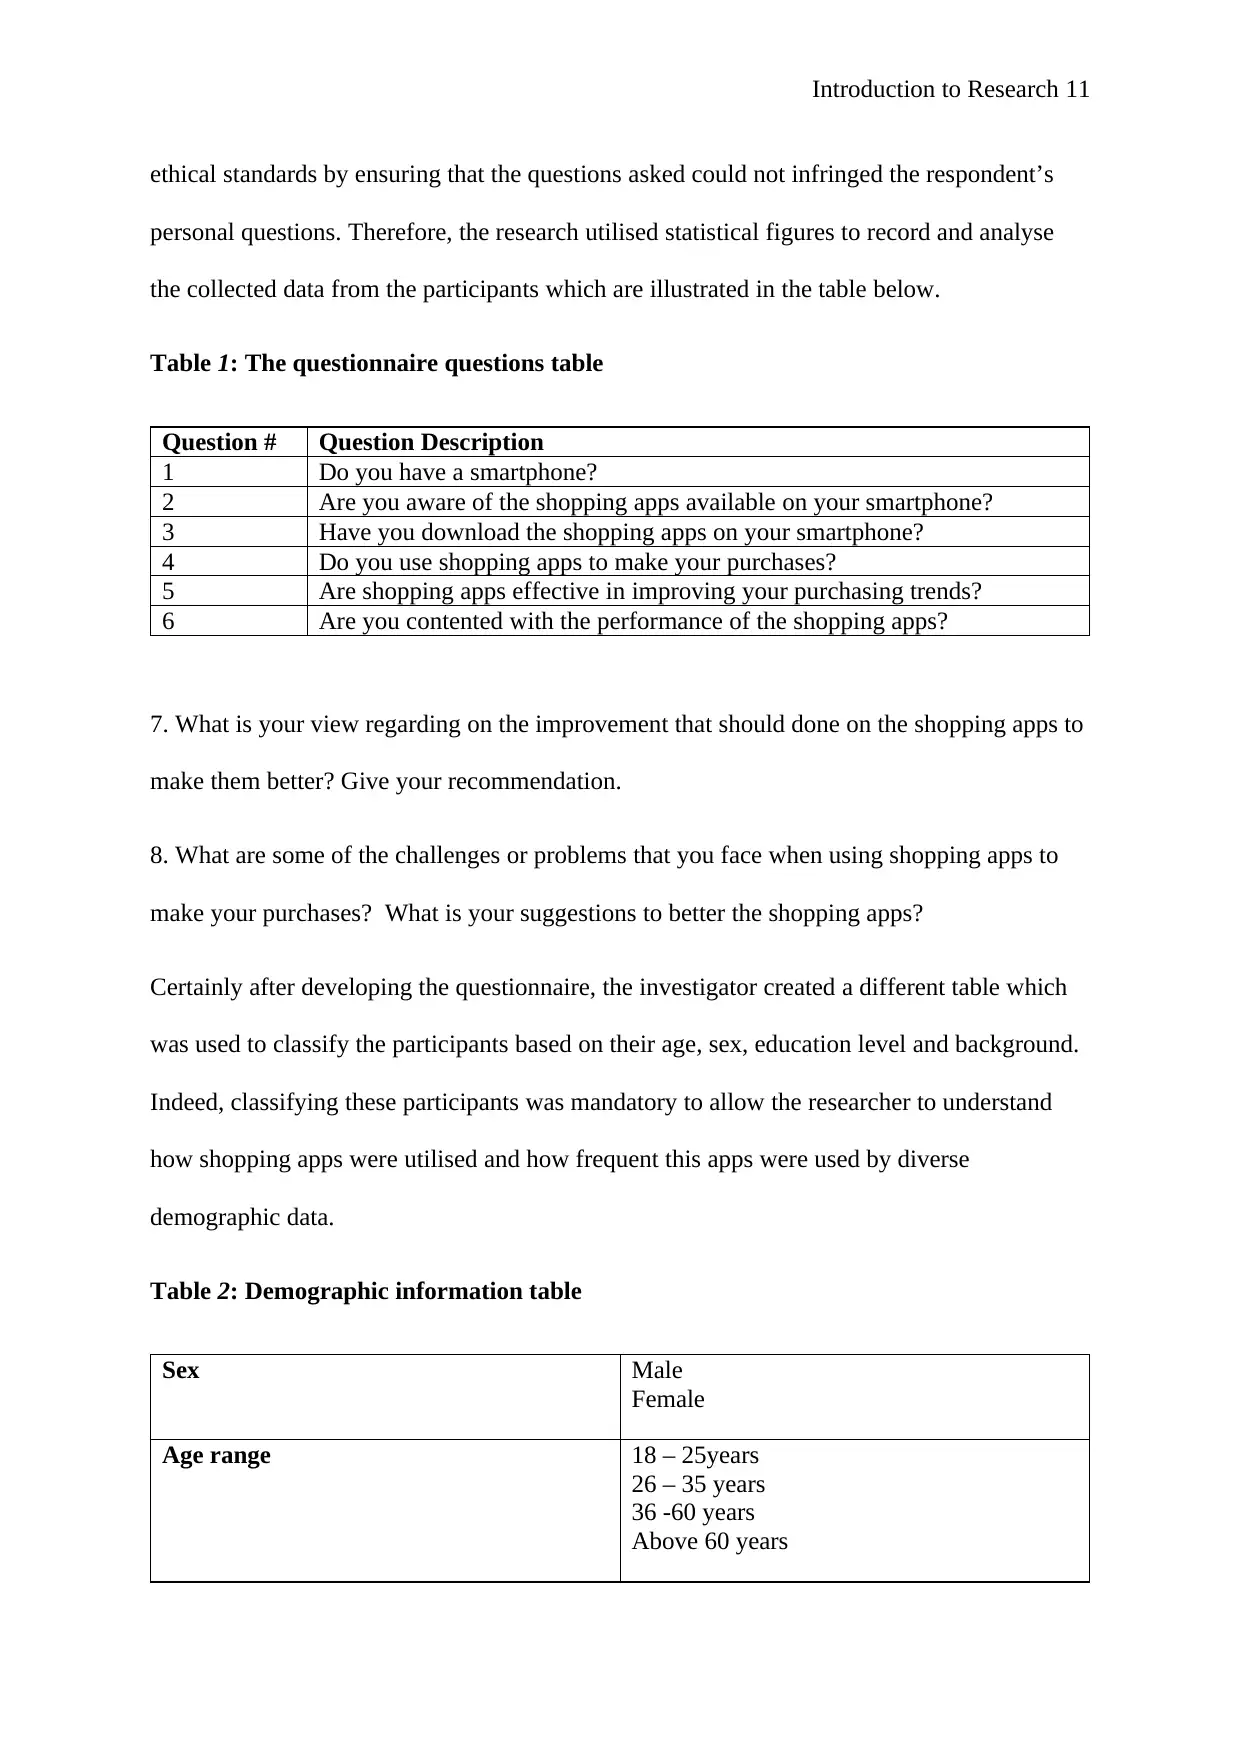
Table 1: The questionnaire questions table
Question # Question Description
1 Do you have a smartphone?
2 Are you aware of the shopping apps available on your smartphone?
3 Have you download the shopping apps on your smartphone?
4 Do you use shopping apps to make your purchases?
5 Are shopping apps effective in improving your purchasing trends?
6 Are you contented with the performance of the shopping apps?
7. What is your view regarding on the improvement that should done on the shopping apps to
make them better? Give your recommendation.
8. What are some of the challenges or problems that you face when using shopping apps to
make your purchases? What is your suggestions to better the shopping apps?
Certainly after developing the questionnaire, the investigator created a different table which
was used to classify the participants based on their age, sex, education level and background.
Indeed, classifying these participants was mandatory to allow the researcher to understand
how shopping apps were utilised and how frequent this apps were used by diverse
demographic data.
Table 2: Demographic information table
Sex Male
Female
Age range 18 – 25years
26 – 35 years
36 -60 years
Above 60 years
Education level High school
College diploma
University degree
Masters
Background Student
Business person
Employed
Unemployed
Research implementation
Data analysis tools and software
After developing the research questions and classifying the demographic population
information of the respondents, the investigator went head to collect the data as asked by the
experiment. The gathered data was then analysed with the help of certain statistical analysis
techniques and tools with Microsoft Excel being the chief software for analysing data.
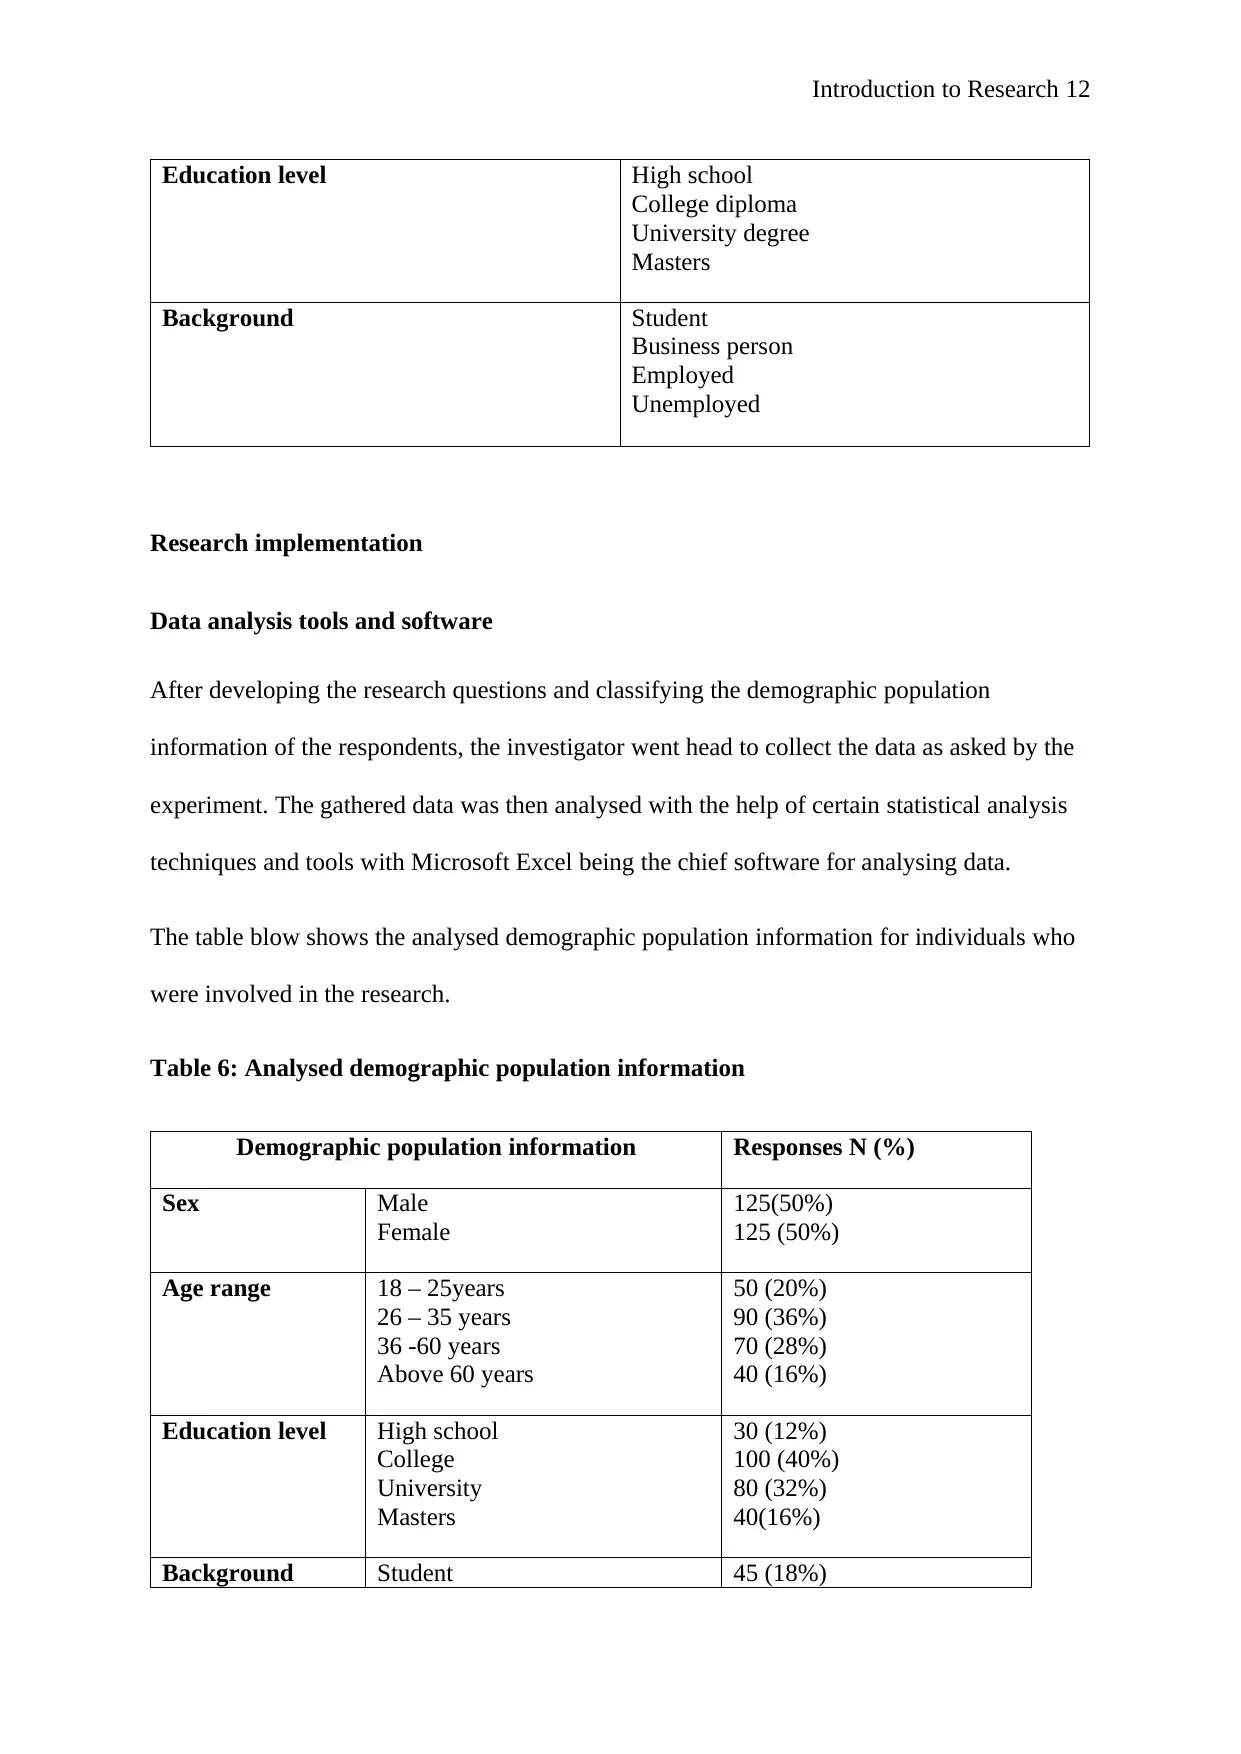
The table blow shows the analysed demographic population information for individuals who
were involved in the research.
Table 6: Analysed demographic population information
Demographic population information Responses N (%)
Sex Male
Female
125(50%)
125 (50%)
Age range 18 – 25years
26 – 35 years
36 -60 years
Above 60 years
50 (20%)
90 (36%)
70 (28%)
40 (16%)
Education level High school
College
University
Masters
30 (12%)
100 (40%)
80 (32%)
40(16%)
Background Student 45 (18%)
⊘ This is a preview!⊘
Do you want full access?
Subscribe today to unlock all pages.
Trusted by 1+ million students worldwide
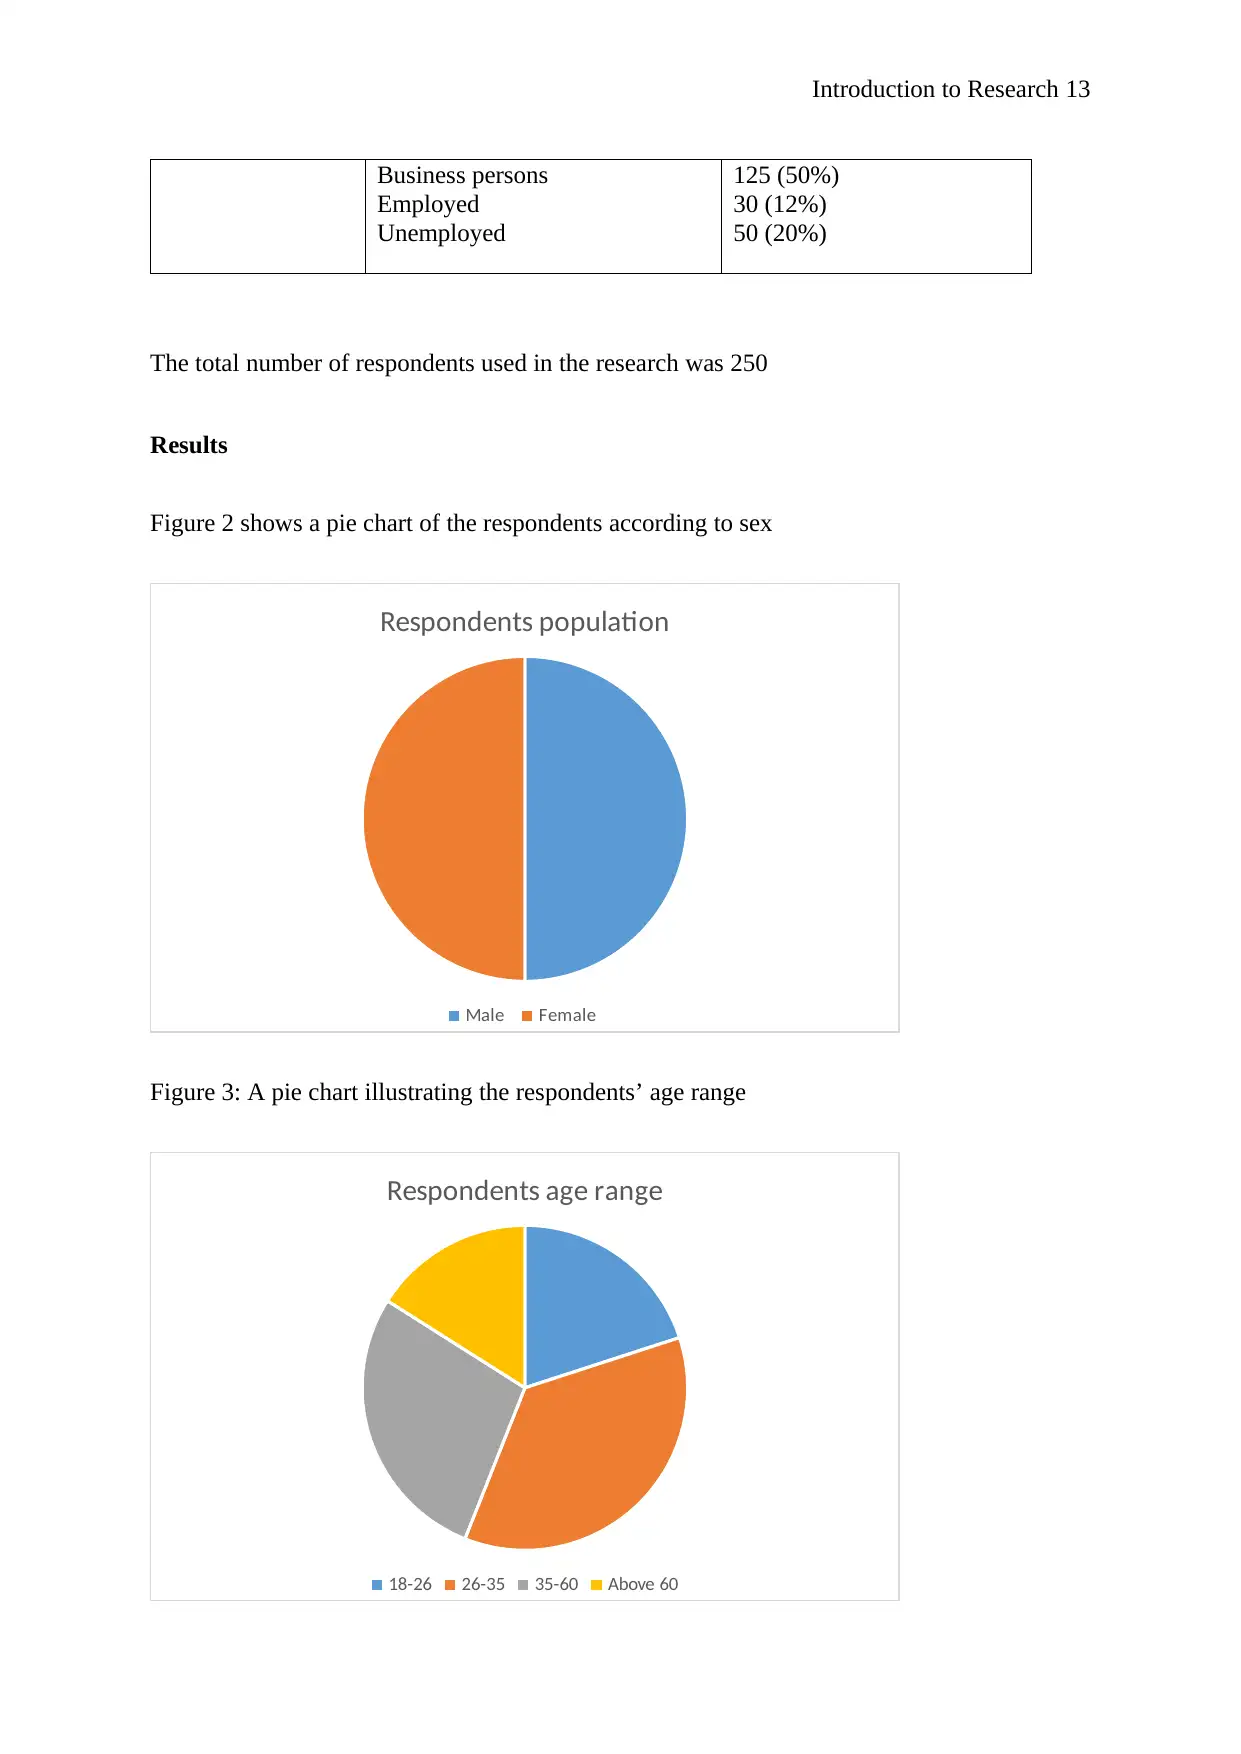
Business persons
Employed
Unemployed
125 (50%)
30 (12%)
50 (20%)
The total number of respondents used in the research was 250
Results
Figure 2 shows a pie chart of the respondents according to sex
Respondents population
Male Female
Figure 3: A pie chart illustrating the respondents’ age range
Respondents age range
18-26 26-35 35-60 Above 60
Paraphrase This Document
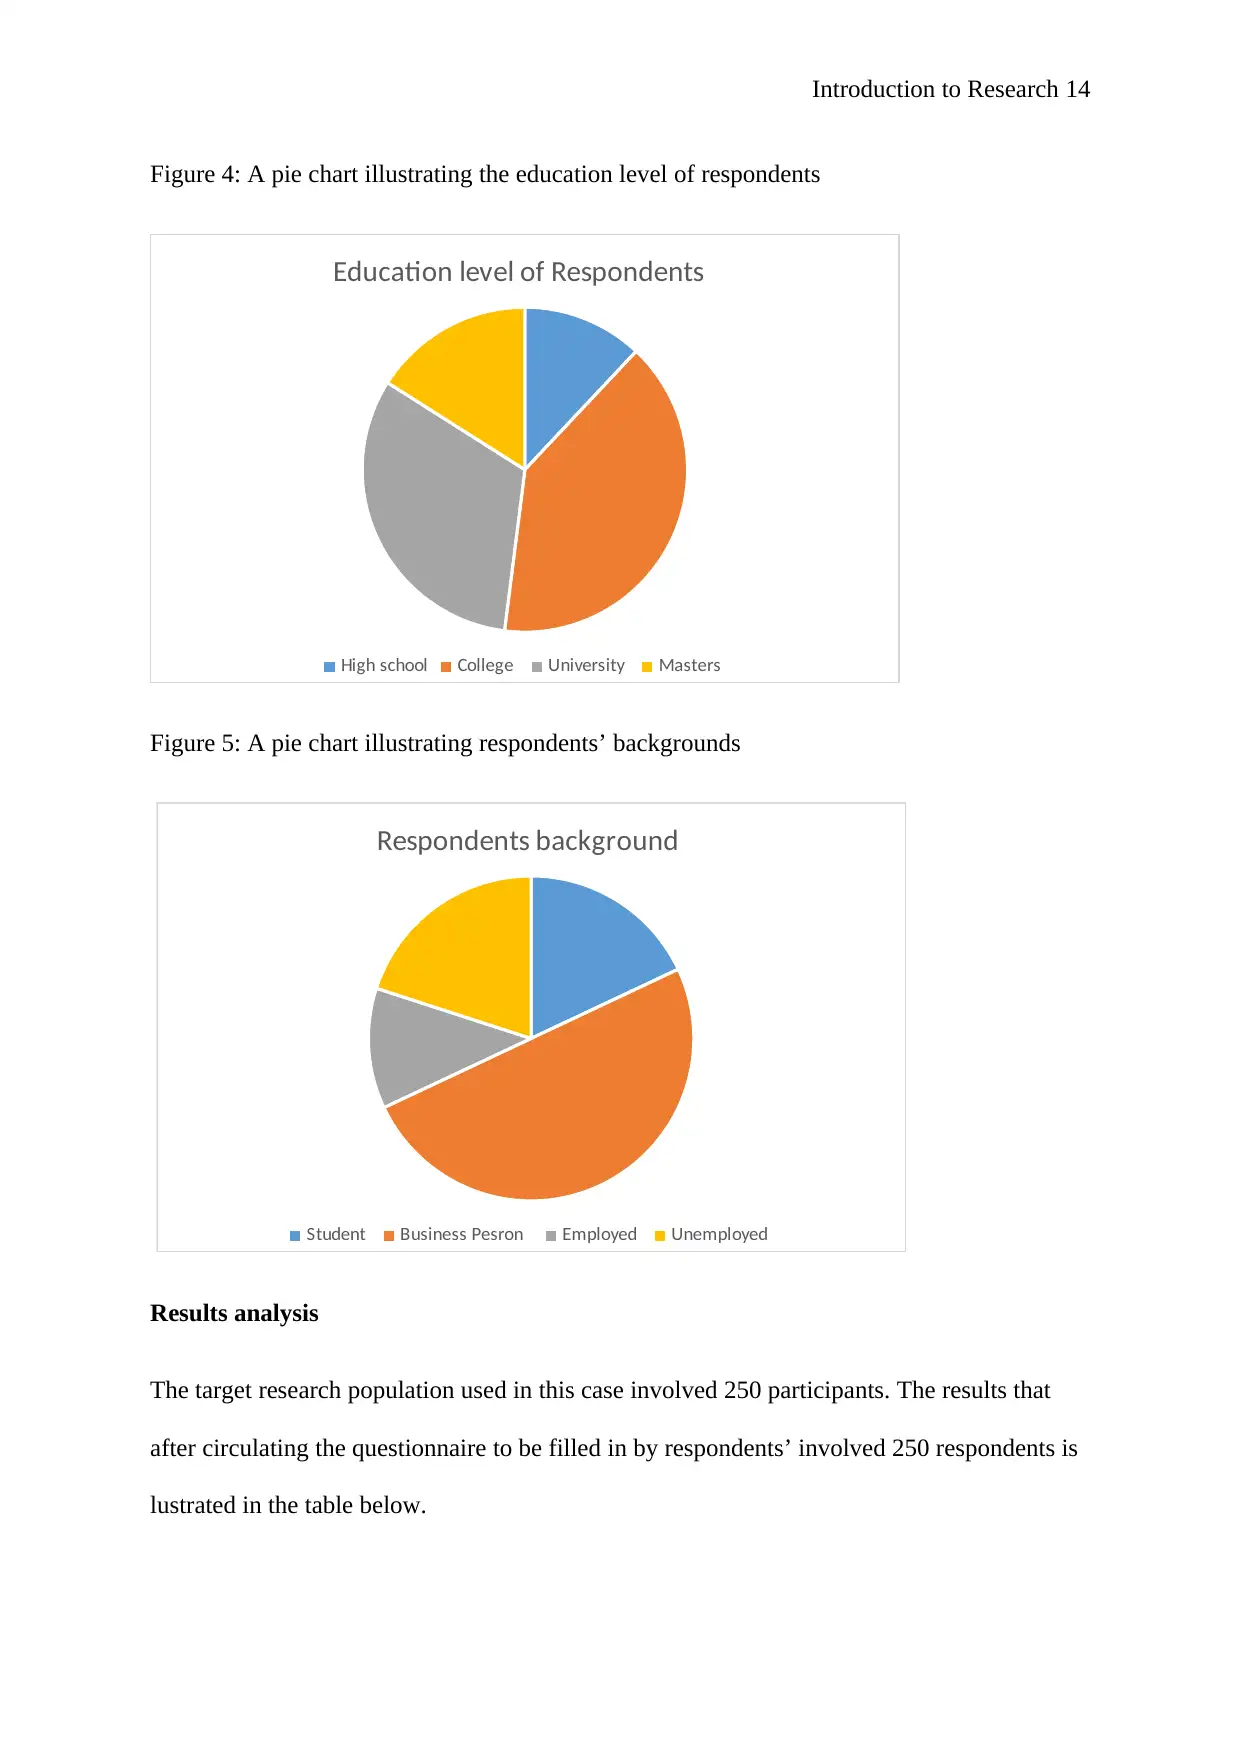
Figure 4: A pie chart illustrating the education level of respondents
Education level of Respondents
High school College University Masters
Figure 5: A pie chart illustrating respondents’ backgrounds
Respondents background
Student Business Pesron Employed Unemployed
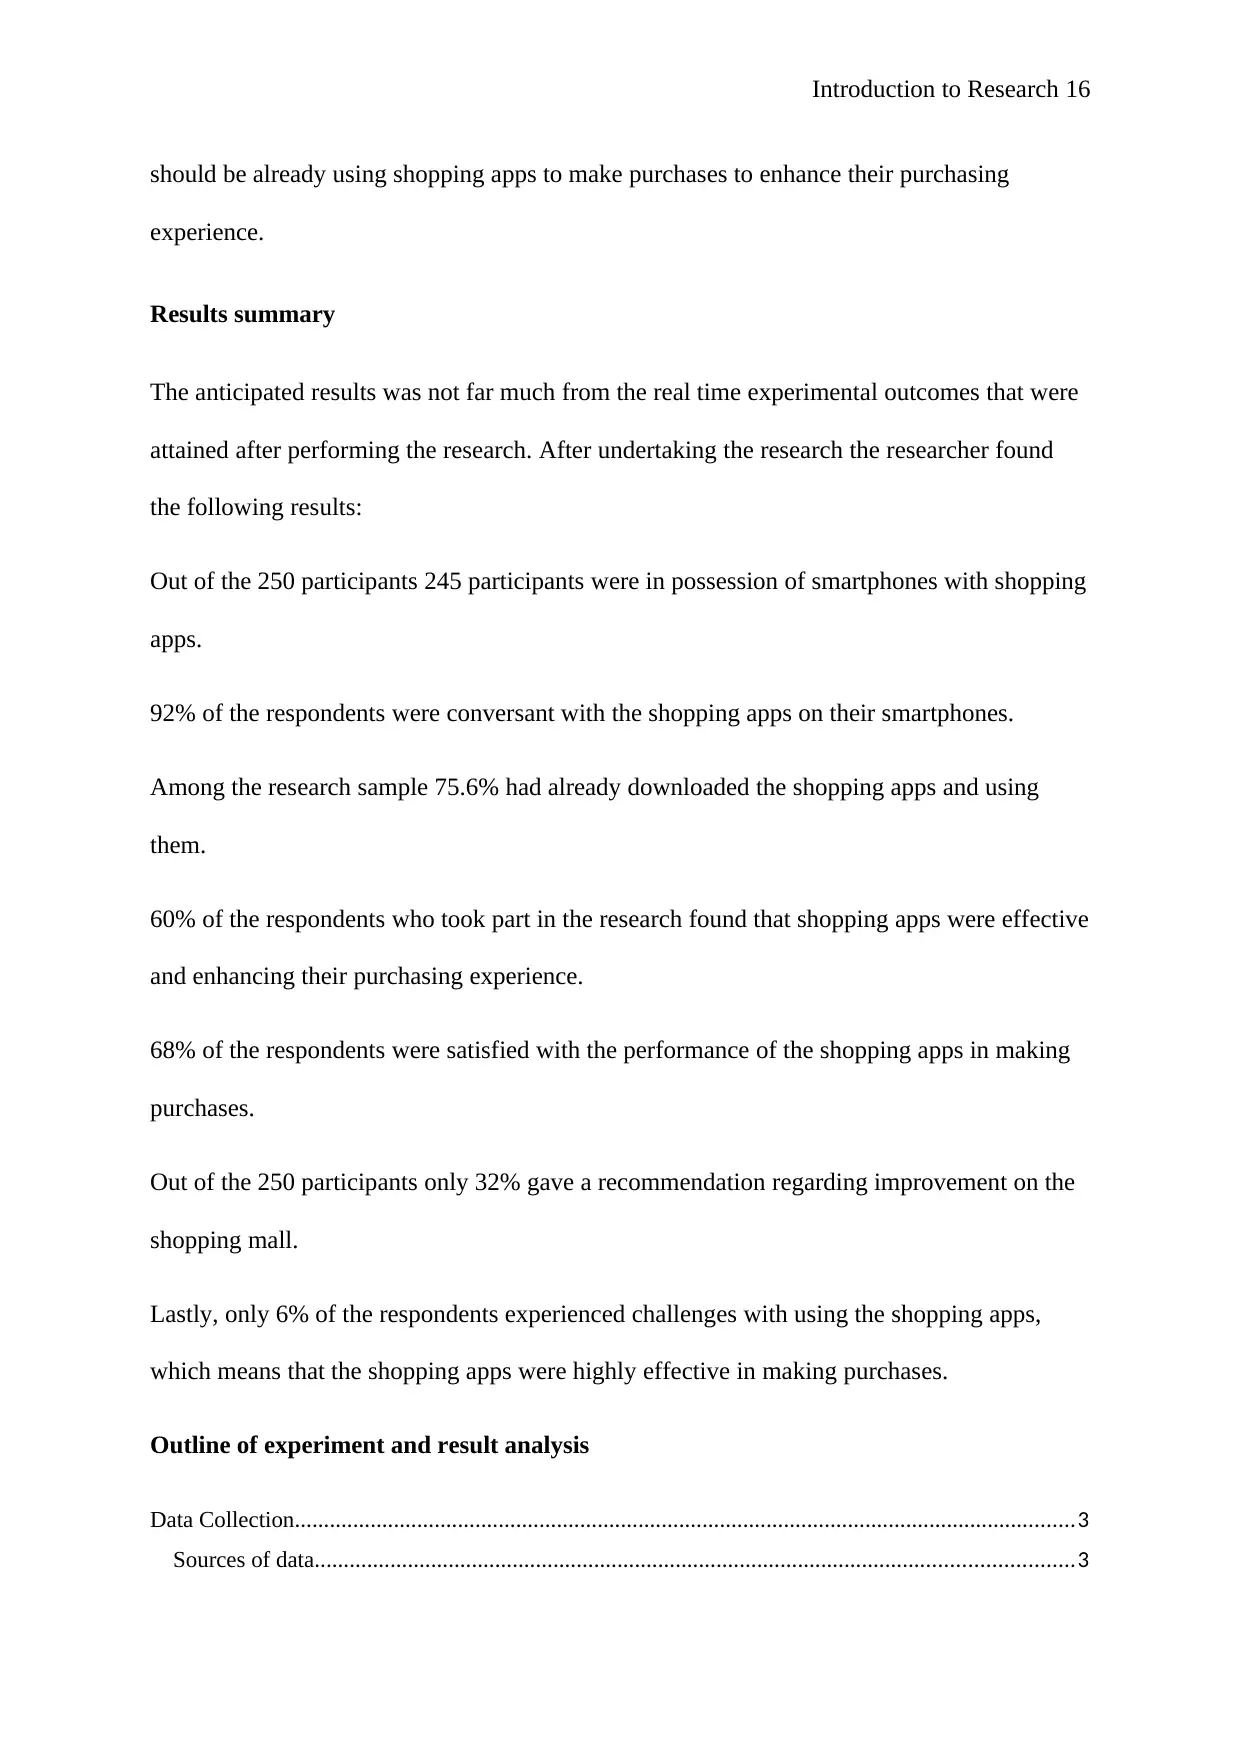
Results analysis
The target research population used in this case involved 250 participants. The results that
after circulating the questionnaire to be filled in by respondents’ involved 250 respondents is
lustrated in the table below.
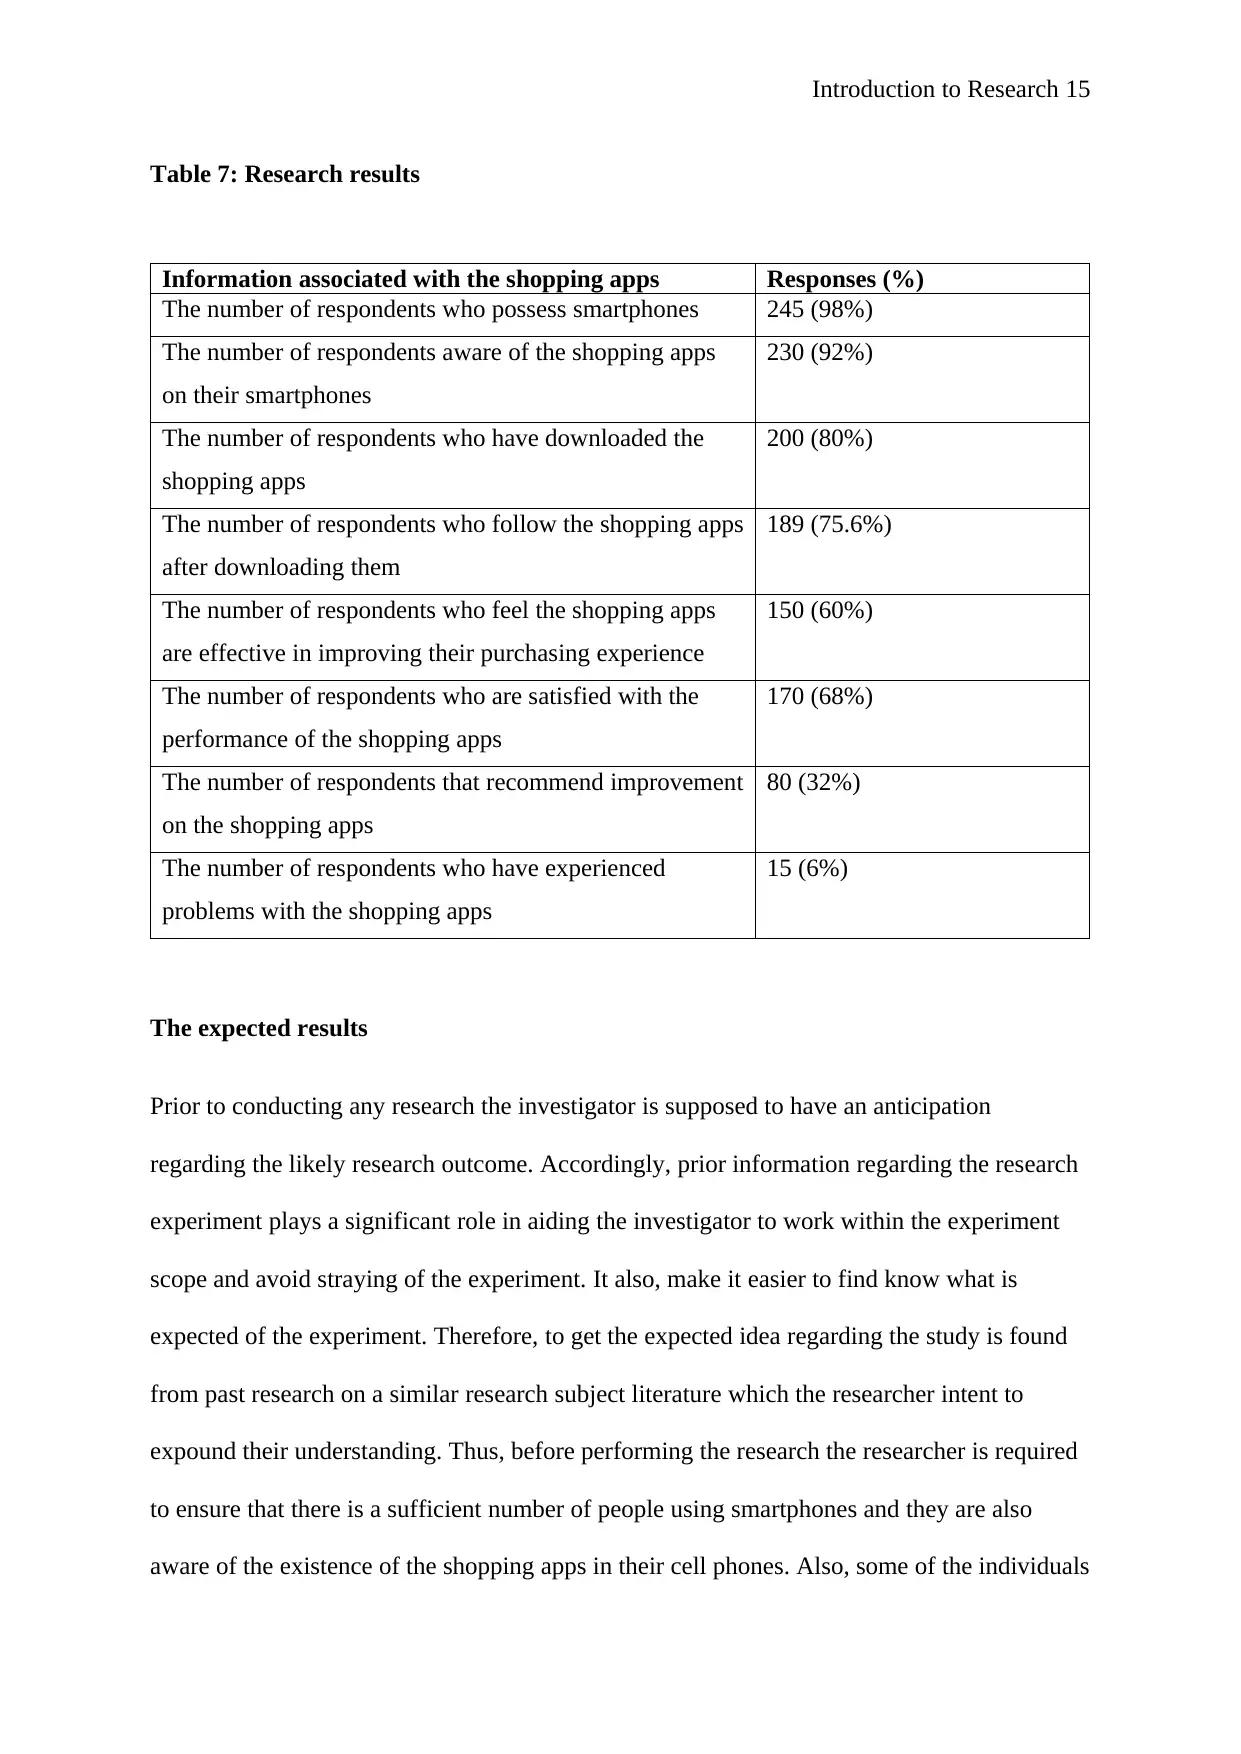
Table 7: Research results
Information associated with the shopping apps Responses (%)
The number of respondents who possess smartphones 245 (98%)
The number of respondents aware of the shopping apps
on their smartphones
230 (92%)
The number of respondents who have downloaded the
shopping apps
200 (80%)
The number of respondents who follow the shopping apps
after downloading them
189 (75.6%)
The number of respondents who feel the shopping apps
are effective in improving their purchasing experience
150 (60%)
The number of respondents who are satisfied with the
performance of the shopping apps
170 (68%)
The number of respondents that recommend improvement
on the shopping apps
80 (32%)
The number of respondents who have experienced
problems with the shopping apps
15 (6%)
The expected results
Prior to conducting any research the investigator is supposed to have an anticipation
regarding the likely research outcome. Accordingly, prior information regarding the research
experiment plays a significant role in aiding the investigator to work within the experiment
scope and avoid straying of the experiment. It also, make it easier to find know what is
expected of the experiment. Therefore, to get the expected idea regarding the study is found
from past research on a similar research subject literature which the researcher intent to
expound their understanding. Thus, before performing the research the researcher is required
to ensure that there is a sufficient number of people using smartphones and they are also
aware of the existence of the shopping apps in their cell phones. Also, some of the individuals
⊘ This is a preview!⊘
Do you want full access?
Subscribe today to unlock all pages.
Trusted by 1+ million students worldwide
should be already using shopping apps to make purchases to enhance their purchasing
experience.
Results summary
The anticipated results was not far much from the real time experimental outcomes that were
attained after performing the research. After undertaking the research the researcher found
the following results:
Out of the 250 participants 245 participants were in possession of smartphones with shopping
apps.
92% of the respondents were conversant with the shopping apps on their smartphones.
Among the research sample 75.6% had already downloaded the shopping apps and using
them.
60% of the respondents who took part in the research found that shopping apps were effective
and enhancing their purchasing experience.
68% of the respondents were satisfied with the performance of the shopping apps in making
purchases.
Out of the 250 participants only 32% gave a recommendation regarding improvement on the
shopping mall.
Lastly, only 6% of the respondents experienced challenges with using the shopping apps,
which means that the shopping apps were highly effective in making purchases.
Outline of experiment and result analysis
Data Collection......................................................................................................................................3
Sources of data..................................................................................................................................3
Paraphrase This Document
Data collection table..........................................................................................................................4
Table 1: Data collection table........................................................................................................4
Data storage.......................................................................................................................................5
Table 2: Data storage table............................................................................................................6
Design and implementation...................................................................................................................6
Data pre-processing...........................................................................................................................6
Feature selection/ dimension reduction..........................................................................................8
Table 3: Feature selection/dimension reduction table....................................................................9
Experiment design...............................................................................................................................10
Detailed design process...................................................................................................................10
Table 4: The questionnaire questions table..................................................................................10
Table 5: Demographic information table.....................................................................................11
Research implementation....................................................................................................................12
Data analysis tools and software......................................................................................................12
Table 6: Analysed demographic population information.............................................................12
Results.................................................................................................................................................13
Results analysis...............................................................................................................................14
Table 7: Research results.............................................................................................................14
The expected results........................................................................................................................15
Results summary.................................................................................................................................16

Bibliography
Barker, T.B. and Milivojevich, A., 2016. Quality by experimental design. CRC Press.
Barker, T.B. and Milivojevich, A., 2016. Quality by experimental design. CRC Press.
Campbell, D.T. and Stanley, J.C., 2015. Experimental and quasi-experimental designs for
research. Ravenio Books.
Candioti, L.V., De Zan, M.M., Cámara, M.S. and Goicoechea, H.C., 2014. Experimental
design and multiple response optimization. Using the desirability function in analytical
methods development. Talanta, 124, pp.123-138.
Chandrasekaran, A., Anand, G., Ward, P., Sharma, L. and Moffatt-Bruce, S., 2017. Design
and Implementation of Standard Work on Care Delivery Performance: A Quasi-Experimental
Investigation.
Curtis, M.J., Bond, R.A., Spina, D., Ahluwalia, A., Alexander, S.P., Giembycz, M.A.,
Gilchrist, A., Hoyer, D., Insel, P.A., Izzo, A.A. and Lawrence, A.J., 2015. Experimental
⊘ This is a preview!⊘
Do you want full access?
Subscribe today to unlock all pages.
Trusted by 1+ million students worldwide
design and analysis and their reporting: new guidance for publication in BJP. British journal
of pharmacology, 172(14), pp.3461-3471.
Eyring, V., Bony, S., Meehl, G.A., Senior, C.A., Stevens, B., Stouffer, R.J. and Taylor, K.E.,
2016. Overview of the Coupled Model Intercomparison Project Phase 6 (CMIP6)
experimental design and organization. Geoscientific Model Development, 9(5), pp.1937-
1958.
Haley, N.J., Richt, J.A., Davenport, K.A., Henderson, D.M., Hoover, E.A., Manca, M.,
Caughey, B., Marthaler, D., Bartz, J. and Gilch, S., 2018. Design, implementation, and
interpretation of amplification studies for prion detection. Prion, pp.1-10.
Merriam, S.B. and Tisdell, E.J., 2015. Qualitative research: A guide to design and
implementation. John Wiley & Sons.
Montgomery, D.C., 2017. Design and analysis of experiments. John wiley & sons.
Prusa, J.D., Khoshgoftaar, T.M. and Dittman, D.J., 2015, May. Impact of Feature Selection
Techniques for Tweet Sentiment Classification. In FLAIRS Conference (pp. 299-304).
Zhou, L., Lu, D. and Fujita, H., 2015. The performance of corporate financial distress
prediction models with features selection guided by domain knowledge and data mining
approaches. Knowledge-Based Systems, 85, pp.52-61.
Related Documents


Your All-in-One AI-Powered Toolkit for Academic Success.
+13062052269
info@desklib.com
Available 24*7 on WhatsApp / Email
![[object Object]](/_next/static/media/star-bottom.7253800d.svg)
© 2024 | Zucol Services PVT LTD | All rights reserved.