Ask a question from expert
Introductory Biostatistics | Assignment
12 Pages2138 Words199 Views
Added on 2020-03-23
Introductory Biostatistics | Assignment
Added on 2020-03-23
BookmarkShareRelated Documents
161.130 Ass2 2017Name: _____ Rosemarie Nazareth________ ID number: _________ 15251459_____________MASSEY UNIVERSITYCollege of SciencesInstitute of Fundamental Sciences (Statistics)Introductory Biostatistics 161.130Assignment 2Duedate:Friday 6 October 2017Assessmentvalue:9%•This assignment is marked out of 50 marks.Part A:Critique ofGraph[8marks]The graph below shows numbers of live births for four different regional council areas and total births registered in New Zealand from 2003 to 2016. It is derived from data published by Stats NZ.1.Critique the above graph, discussing any strengths and weaknesses. [3 Marks]Type your answer hereThe above graph is not visually appealing. First it is not possible from the graph to compare the live births from the regional council areas for each year. Just by quickly looking at the graph one cannot tell whether the live births have been increasing, decreasing or has Page 1
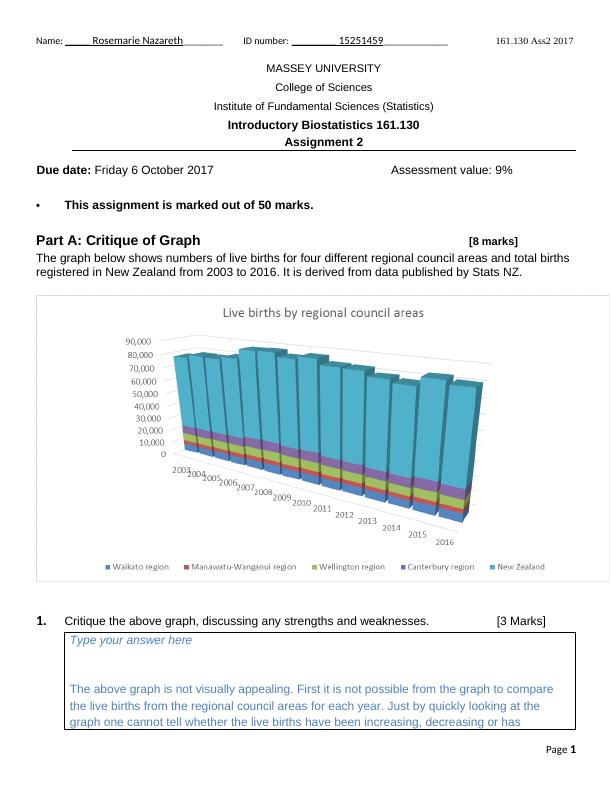
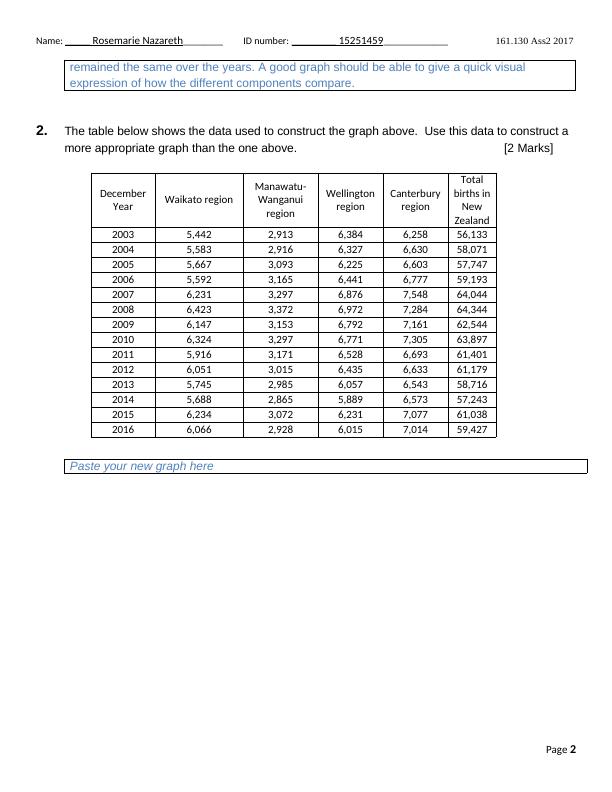
161.130 Ass2 2017Name: _____ Rosemarie Nazareth________ ID number: _________ 15251459_____________remained the same over the years. A good graph should be able to give a quick visual expression of how the different components compare.2.The table below shows the data used to construct the graph above. Use this data to construct a more appropriate graph than the one above.[2Marks]DecemberYearWaikato regionManawatu-WanganuiregionWellingtonregionCanterburyregionTotalbirths inNewZealand 20035,4422,9136,3846,25856,13320045,5832,9166,3276,63058,07120055,6673,0936,2256,60357,74720065,5923,1656,4416,77759,19320076,2313,2976,8767,54864,04420086,4233,3726,9727,28464,34420096,1473,1536,7927,16162,54420106,3243,2976,7717,30563,89720115,9163,1716,5286,69361,40120126,0513,0156,4356,63361,17920135,7452,9856,0576,54358,71620145,6882,8655,8896,57357,24320156,2343,0726,2317,07761,03820166,0662,9286,0157,01459,427Paste your new graph herePage 2
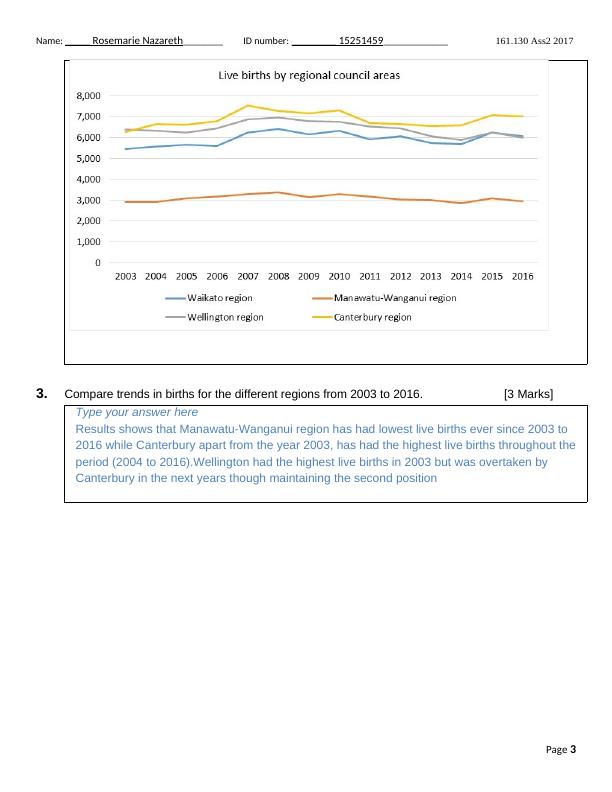
161.130 Ass2 2017Name: _____ Rosemarie Nazareth________ ID number: _________ 15251459_____________3.Compare trends in births for the different regions from 2003 to 2016. [3Marks]Type your answer hereResults shows that Manawatu-Wanganui region has had lowest live births ever since 2003 to 2016 while Canterbury apart from the year 2003, has had the highest live births throughout the period (2004 to 2016).Wellington had the highest live births in 2003 but was overtaken by Canterbury in the next years though maintaining the second positionPage 3
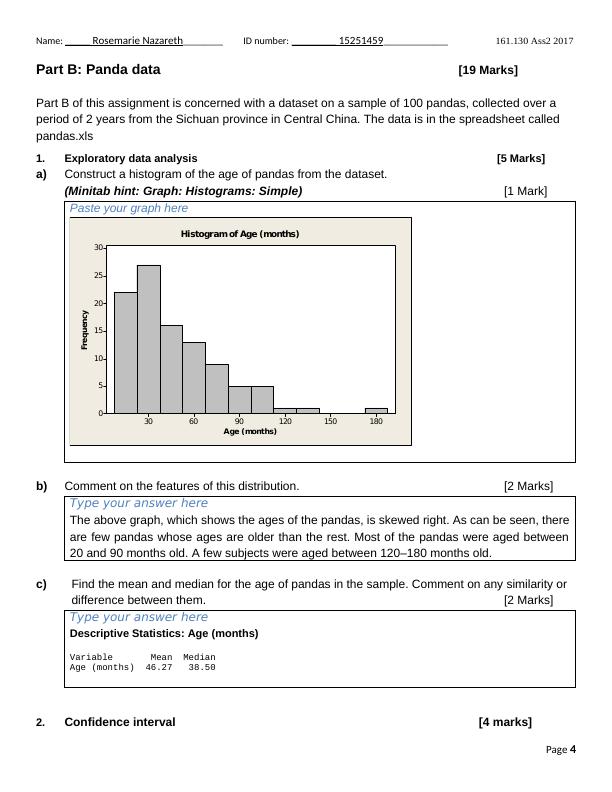
161.130 Ass2 2017Name: _____ Rosemarie Nazareth________ ID number: _________ 15251459_____________Part B: Panda data[19 Marks]Part B of this assignment is concerned with a dataset on a sample of 100 pandas, collected over a period of 2 years from the Sichuan province in Central China. The data is in the spreadsheet called pandas.xls1.Exploratory data analysis[5 Marks]a)Construct a histogram of the age of pandas from the dataset. (Minitab hint: Graph: Histograms: Simple)[1 Mark]Paste your graph hereAge(months)Frequency180150120906030302520151050HistogramofAge(months)b)Comment on the features of this distribution. [2 Marks]Type your answer hereThe above graph, which shows the ages of the pandas, is skewed right. As can be seen, thereare few pandas whose ages are older than the rest. Most of the pandas were aged between20 and 90 months old. A few subjects were aged between 120–180 months old. c)Find the mean and median for the age of pandas in the sample. Comment on any similarity or difference between them.[2 Marks]Type your answer hereDescriptive Statistics: Age (months) Variable Mean MedianAge (months) 46.27 38.502.Confidence interval[4 marks]Page 4
End of preview
Want to access all the pages? Upload your documents or become a member.
Related Documents
Data Analysis Data Descriptionlg...
|12
|1064
|16
The effect of coffee consumptionlg...
|10
|978
|16