Investigatory Business Report on Tesco's Financial Performance
VerifiedAdded on 2022/12/15
|12
|3004
|424
AI Summary
This report analyzes and investigates the business performance of Tesco through financial ratio analysis. It examines liquidity, profitability, and efficiency ratios to identify issues and provide solutions. The report highlights a decline in profit margins and inventory management as areas of concern.
Contribute Materials
Your contribution can guide someone’s learning journey. Share your
documents today.
Investigatory Business
Report
Report
Secure Best Marks with AI Grader
Need help grading? Try our AI Grader for instant feedback on your assignments.
Executive Summary
This report pertains to analyse and investigate business performance of Tesco to identify the
issues that its financial performance analysis reflects. This report undertakes financial ratio analysis
using figures from the declared statements of the last two years by the company. Further,
information obtained from ratios has been visually presented so that comment on Tesco’s
profitability, liquidity and efficiency can be made as well as issues related to them can be identified.
Further, solutions and recommendations have been presented.
Contents
Executive Summary...........................................................................................................................................2
Introduction.......................................................................................................................................................4
Main Body.........................................................................................................................................................4
Ratio Analysis...............................................................................................................................................4
Problem Identification and investigation.......................................................................................................9
Solutions and recommendations..................................................................................................................10
Conclusion.......................................................................................................................................................11
References.......................................................................................................................................................12
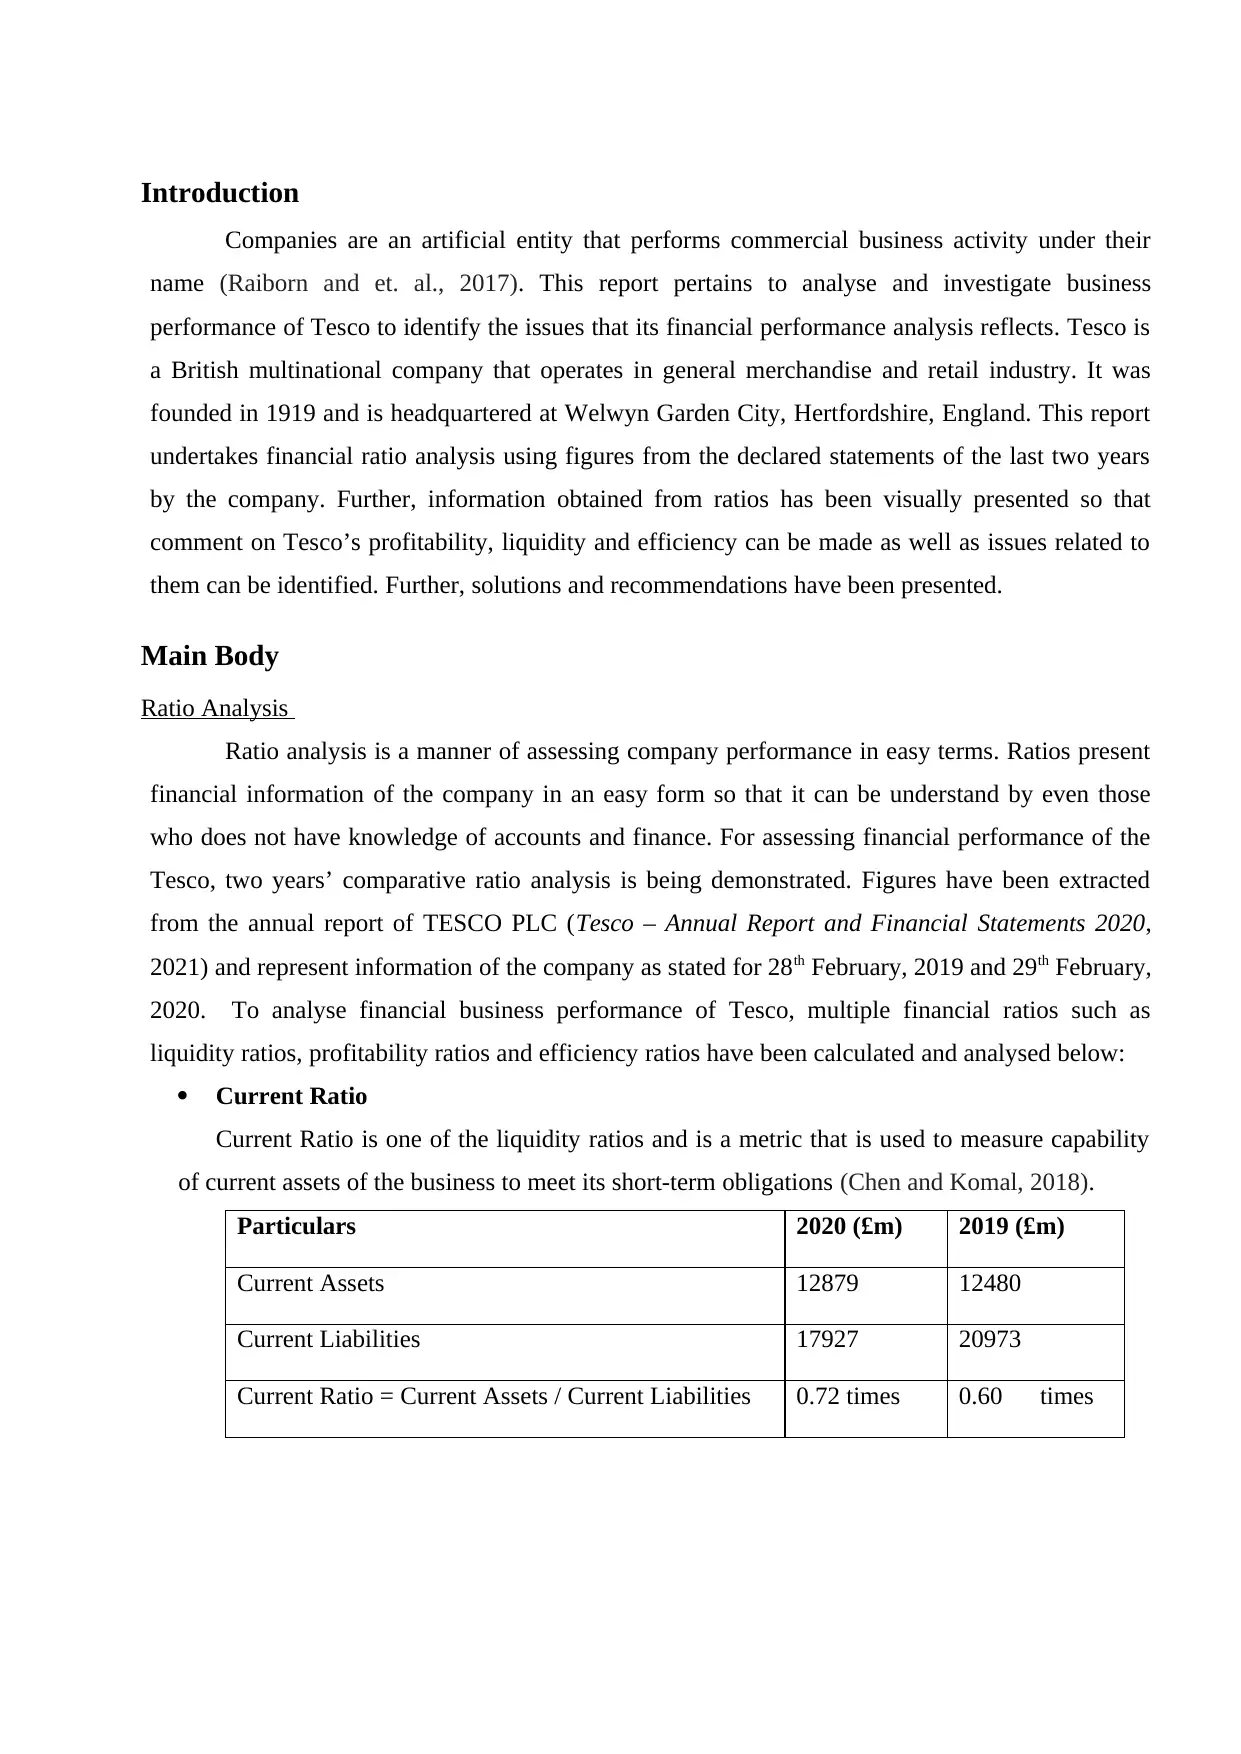
Introduction
Companies are an artificial entity that performs commercial business activity under their
name (Raiborn and et. al., 2017). This report pertains to analyse and investigate business
performance of Tesco to identify the issues that its financial performance analysis reflects. Tesco is
a British multinational company that operates in general merchandise and retail industry. It was
founded in 1919 and is headquartered at Welwyn Garden City, Hertfordshire, England. This report
undertakes financial ratio analysis using figures from the declared statements of the last two years
by the company. Further, information obtained from ratios has been visually presented so that
comment on Tesco’s profitability, liquidity and efficiency can be made as well as issues related to
them can be identified. Further, solutions and recommendations have been presented.
Main Body
Ratio Analysis
Ratio analysis is a manner of assessing company performance in easy terms. Ratios present
financial information of the company in an easy form so that it can be understand by even those
who does not have knowledge of accounts and finance. For assessing financial performance of the
Tesco, two years’ comparative ratio analysis is being demonstrated. Figures have been extracted
from the annual report of TESCO PLC (Tesco – Annual Report and Financial Statements 2020,
2021) and represent information of the company as stated for 28th February, 2019 and 29th February,
2020. To analyse financial business performance of Tesco, multiple financial ratios such as
liquidity ratios, profitability ratios and efficiency ratios have been calculated and analysed below:
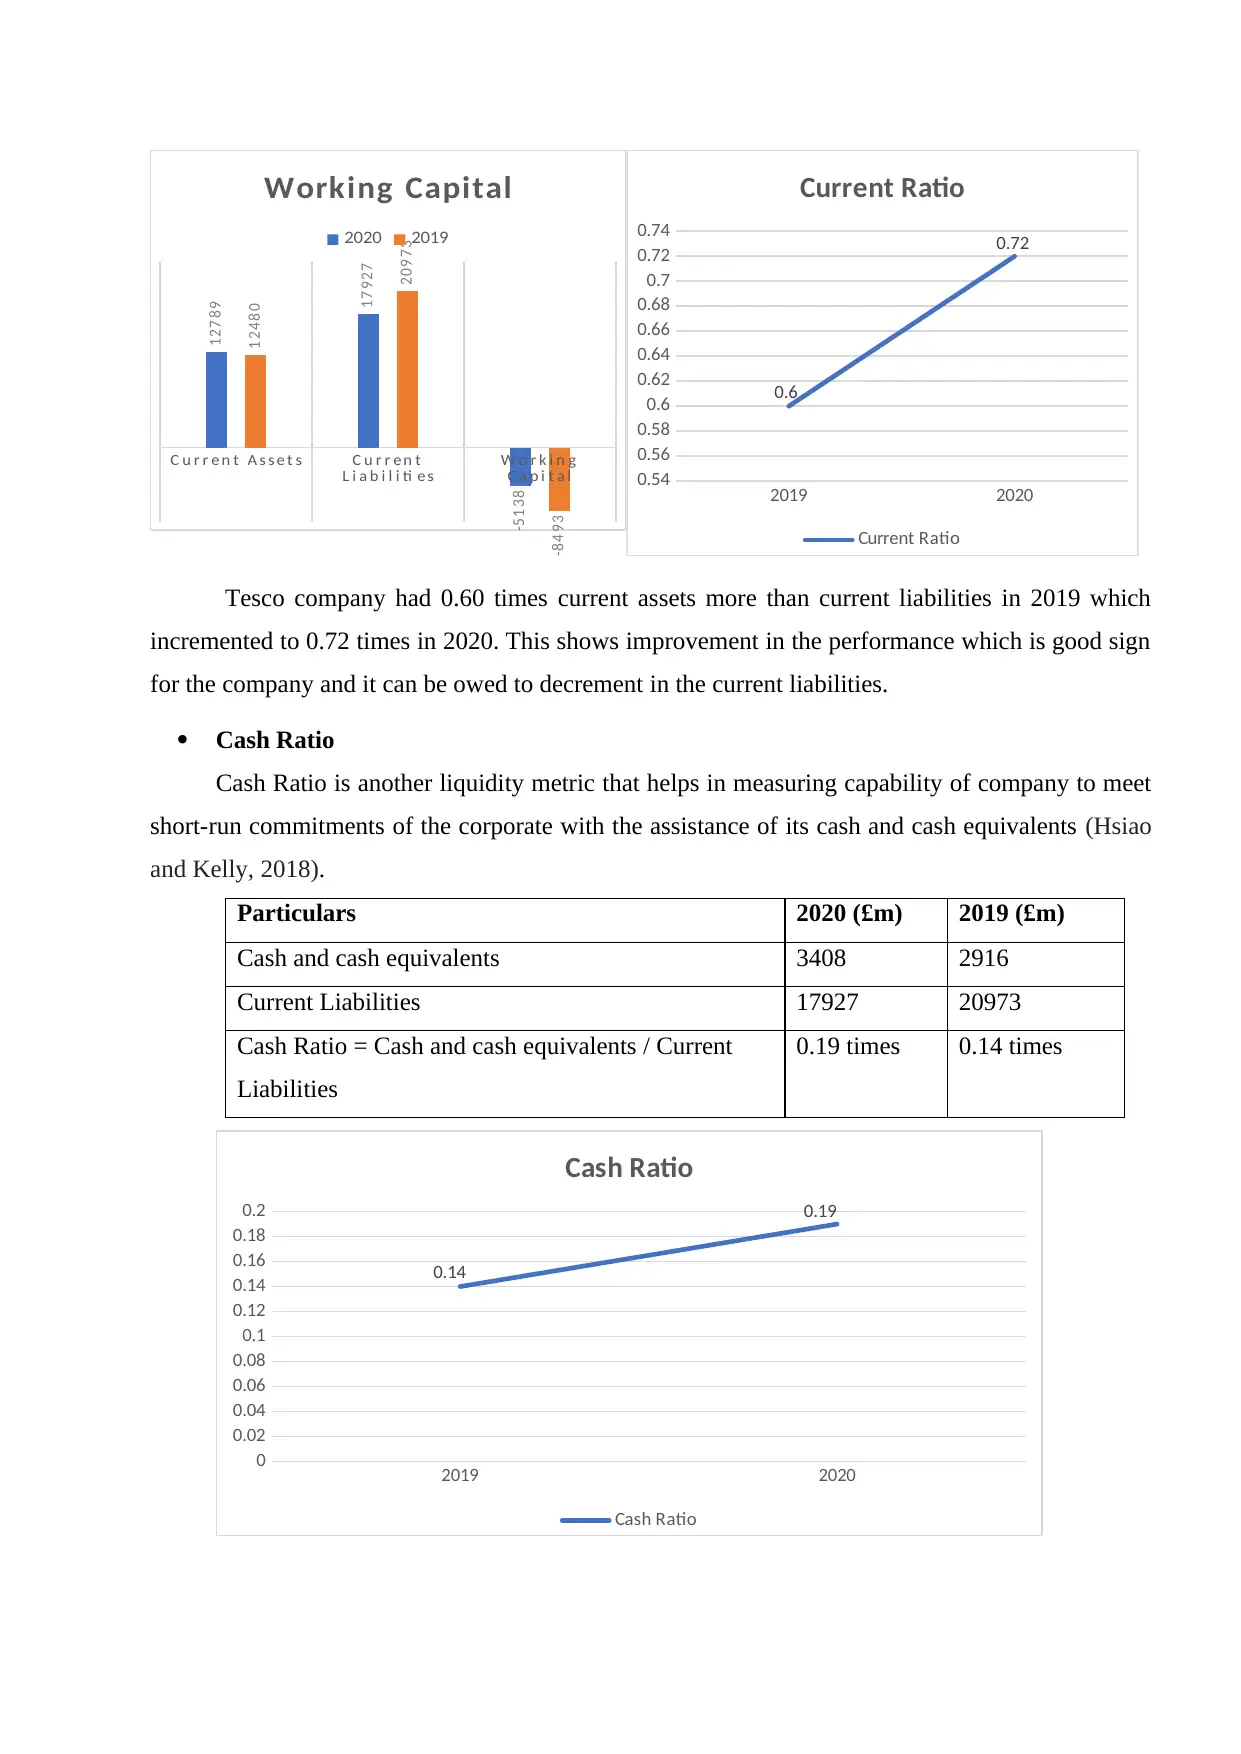
Current Ratio
Current Ratio is one of the liquidity ratios and is a metric that is used to measure capability
of current assets of the business to meet its short-term obligations (Chen and Komal, 2018).
Particulars 2020 (£m) 2019 (£m)
Current Assets 12879 12480
Current Liabilities 17927 20973
Current Ratio = Current Assets / Current Liabilities 0.72 times 0.60 times
Companies are an artificial entity that performs commercial business activity under their
name (Raiborn and et. al., 2017). This report pertains to analyse and investigate business
performance of Tesco to identify the issues that its financial performance analysis reflects. Tesco is
a British multinational company that operates in general merchandise and retail industry. It was
founded in 1919 and is headquartered at Welwyn Garden City, Hertfordshire, England. This report
undertakes financial ratio analysis using figures from the declared statements of the last two years
by the company. Further, information obtained from ratios has been visually presented so that
comment on Tesco’s profitability, liquidity and efficiency can be made as well as issues related to
them can be identified. Further, solutions and recommendations have been presented.
Main Body
Ratio Analysis
Ratio analysis is a manner of assessing company performance in easy terms. Ratios present
financial information of the company in an easy form so that it can be understand by even those
who does not have knowledge of accounts and finance. For assessing financial performance of the
Tesco, two years’ comparative ratio analysis is being demonstrated. Figures have been extracted
from the annual report of TESCO PLC (Tesco – Annual Report and Financial Statements 2020,
2021) and represent information of the company as stated for 28th February, 2019 and 29th February,
2020. To analyse financial business performance of Tesco, multiple financial ratios such as
liquidity ratios, profitability ratios and efficiency ratios have been calculated and analysed below:
Current Ratio
Current Ratio is one of the liquidity ratios and is a metric that is used to measure capability
of current assets of the business to meet its short-term obligations (Chen and Komal, 2018).
Particulars 2020 (£m) 2019 (£m)
Current Assets 12879 12480
Current Liabilities 17927 20973
Current Ratio = Current Assets / Current Liabilities 0.72 times 0.60 times
Secure Best Marks with AI Grader
Need help grading? Try our AI Grader for instant feedback on your assignments.
C u r r e n t A s s e t s C u r r e n t
L i a b i l i ti e s
W o r k i n g
C a p i t a l
12789
17927
-5138
12480
20973
-8493
Working Capital
2020 2019
2019 2020
0.54
0.56
0.58
0.6
0.62
0.64
0.66
0.68
0.7
0.72
0.74
0.6
0.72
Current Ratio
Current Ratio
Tesco company had 0.60 times current assets more than current liabilities in 2019 which
incremented to 0.72 times in 2020. This shows improvement in the performance which is good sign
for the company and it can be owed to decrement in the current liabilities.
Cash Ratio
Cash Ratio is another liquidity metric that helps in measuring capability of company to meet
short-run commitments of the corporate with the assistance of its cash and cash equivalents (Hsiao
and Kelly, 2018).
Particulars 2020 (£m) 2019 (£m)
Cash and cash equivalents 3408 2916
Current Liabilities 17927 20973
Cash Ratio = Cash and cash equivalents / Current
Liabilities
0.19 times 0.14 times
2019 2020
0
0.02
0.04
0.06
0.08
0.1
0.12
0.14
0.16
0.18
0.2
0.14
0.19
Cash Ratio
Cash Ratio
As identified from the above table, Tesco had 0.14 times cash and cash equivalents to cover
current liabilities in 2019 which amplified to 0.19 times in 2020. This shows enhancement in the
performance that is positive for the corporation and can be due to decrease in the current liabilities
as well as improvement in the cash assets.
In summarised words, both the above liquidity ratios reflect positive signs for the operational
performance as well as liquidity position of the company with respect to the complete working
capital management.
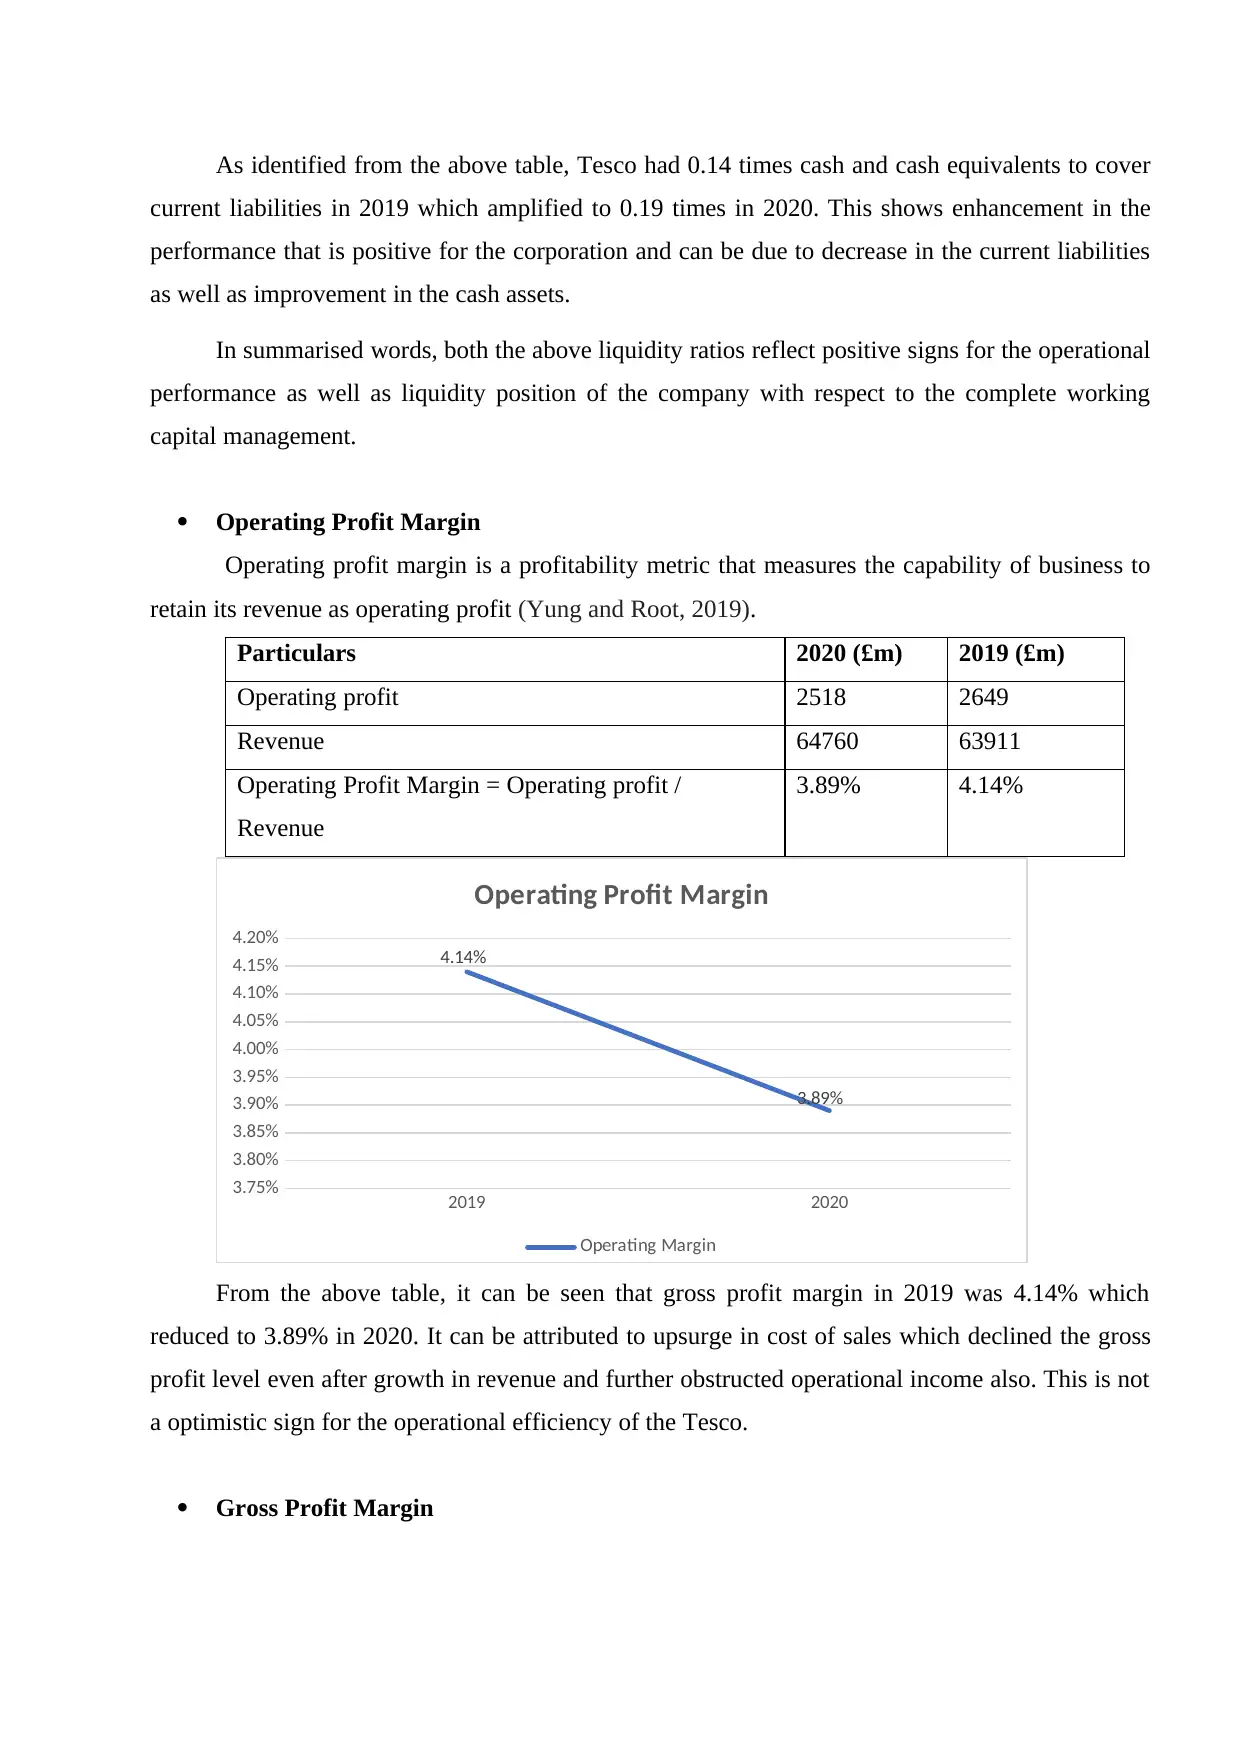
Operating Profit Margin
Operating profit margin is a profitability metric that measures the capability of business to
retain its revenue as operating profit (Yung and Root, 2019).
Particulars 2020 (£m) 2019 (£m)
Operating profit 2518 2649
Revenue 64760 63911
Operating Profit Margin = Operating profit /
Revenue
3.89% 4.14%
2019 2020
3.75%
3.80%
3.85%
3.90%
3.95%
4.00%
4.05%
4.10%
4.15%
4.20%
4.14%
3.89%
Operating Profit Margin
Operating Margin
From the above table, it can be seen that gross profit margin in 2019 was 4.14% which
reduced to 3.89% in 2020. It can be attributed to upsurge in cost of sales which declined the gross
profit level even after growth in revenue and further obstructed operational income also. This is not
a optimistic sign for the operational efficiency of the Tesco.
Gross Profit Margin
current liabilities in 2019 which amplified to 0.19 times in 2020. This shows enhancement in the
performance that is positive for the corporation and can be due to decrease in the current liabilities
as well as improvement in the cash assets.
In summarised words, both the above liquidity ratios reflect positive signs for the operational
performance as well as liquidity position of the company with respect to the complete working
capital management.
Operating Profit Margin
Operating profit margin is a profitability metric that measures the capability of business to
retain its revenue as operating profit (Yung and Root, 2019).
Particulars 2020 (£m) 2019 (£m)
Operating profit 2518 2649
Revenue 64760 63911
Operating Profit Margin = Operating profit /
Revenue
3.89% 4.14%
2019 2020
3.75%
3.80%
3.85%
3.90%
3.95%
4.00%
4.05%
4.10%
4.15%
4.20%
4.14%
3.89%
Operating Profit Margin
Operating Margin
From the above table, it can be seen that gross profit margin in 2019 was 4.14% which
reduced to 3.89% in 2020. It can be attributed to upsurge in cost of sales which declined the gross
profit level even after growth in revenue and further obstructed operational income also. This is not
a optimistic sign for the operational efficiency of the Tesco.
Gross Profit Margin
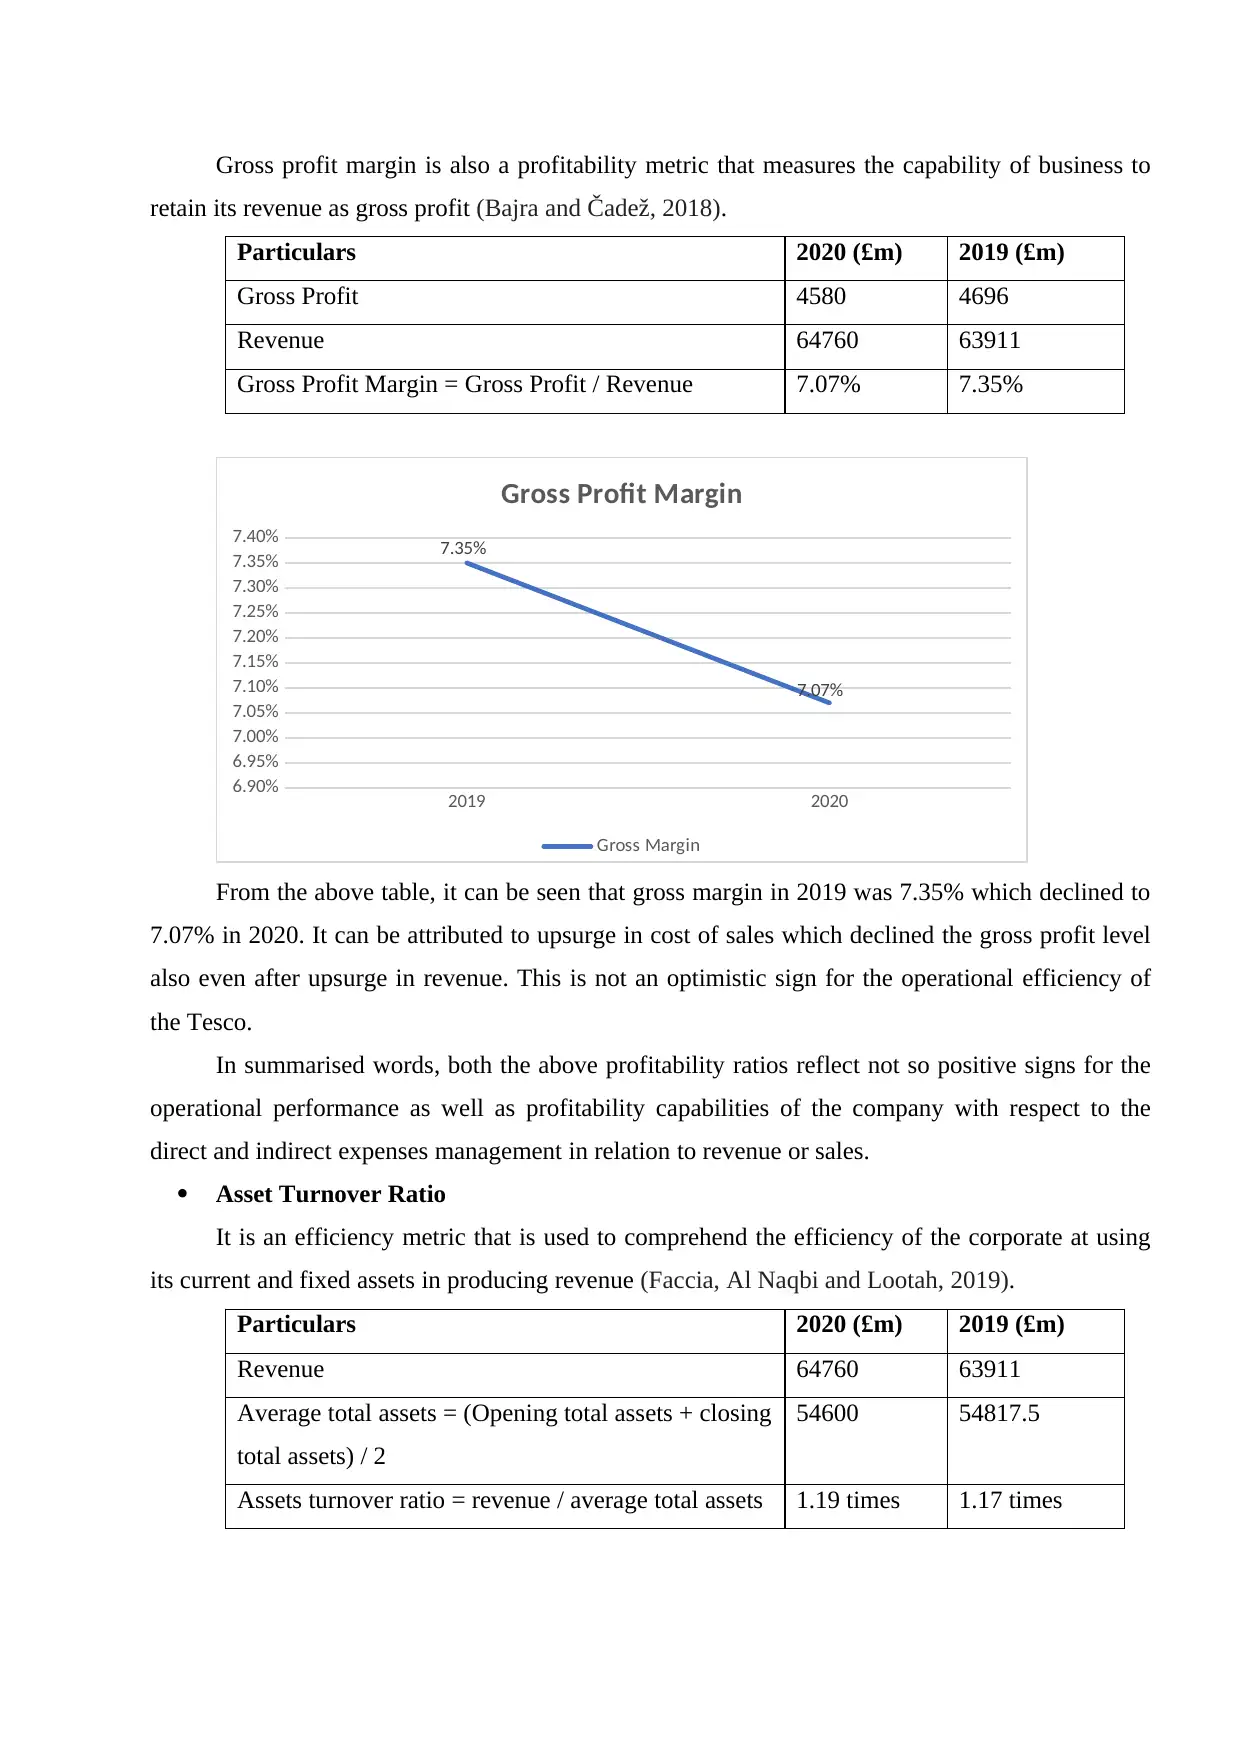
Gross profit margin is also a profitability metric that measures the capability of business to
retain its revenue as gross profit (Bajra and Čadež, 2018).
Particulars 2020 (£m) 2019 (£m)
Gross Profit 4580 4696
Revenue 64760 63911
Gross Profit Margin = Gross Profit / Revenue 7.07% 7.35%
2019 2020
6.90%
6.95%
7.00%
7.05%
7.10%
7.15%
7.20%
7.25%
7.30%
7.35%
7.40% 7.35%
7.07%
Gross Profit Margin
Gross Margin
From the above table, it can be seen that gross margin in 2019 was 7.35% which declined to
7.07% in 2020. It can be attributed to upsurge in cost of sales which declined the gross profit level
also even after upsurge in revenue. This is not an optimistic sign for the operational efficiency of
the Tesco.
In summarised words, both the above profitability ratios reflect not so positive signs for the
operational performance as well as profitability capabilities of the company with respect to the
direct and indirect expenses management in relation to revenue or sales.
Asset Turnover Ratio
It is an efficiency metric that is used to comprehend the efficiency of the corporate at using
its current and fixed assets in producing revenue (Faccia, Al Naqbi and Lootah, 2019).
Particulars 2020 (£m) 2019 (£m)
Revenue 64760 63911
Average total assets = (Opening total assets + closing
total assets) / 2
54600 54817.5
Assets turnover ratio = revenue / average total assets 1.19 times 1.17 times
Paraphrase This Document
Need a fresh take? Get an instant paraphrase of this document with our AI Paraphraser
2019 2020
1.155
1.16
1.165
1.17
1.175
1.18
1.185
1.19
1.195
1.17
1.19
Assets Turnover Ratio
Assets Turnover Ratio
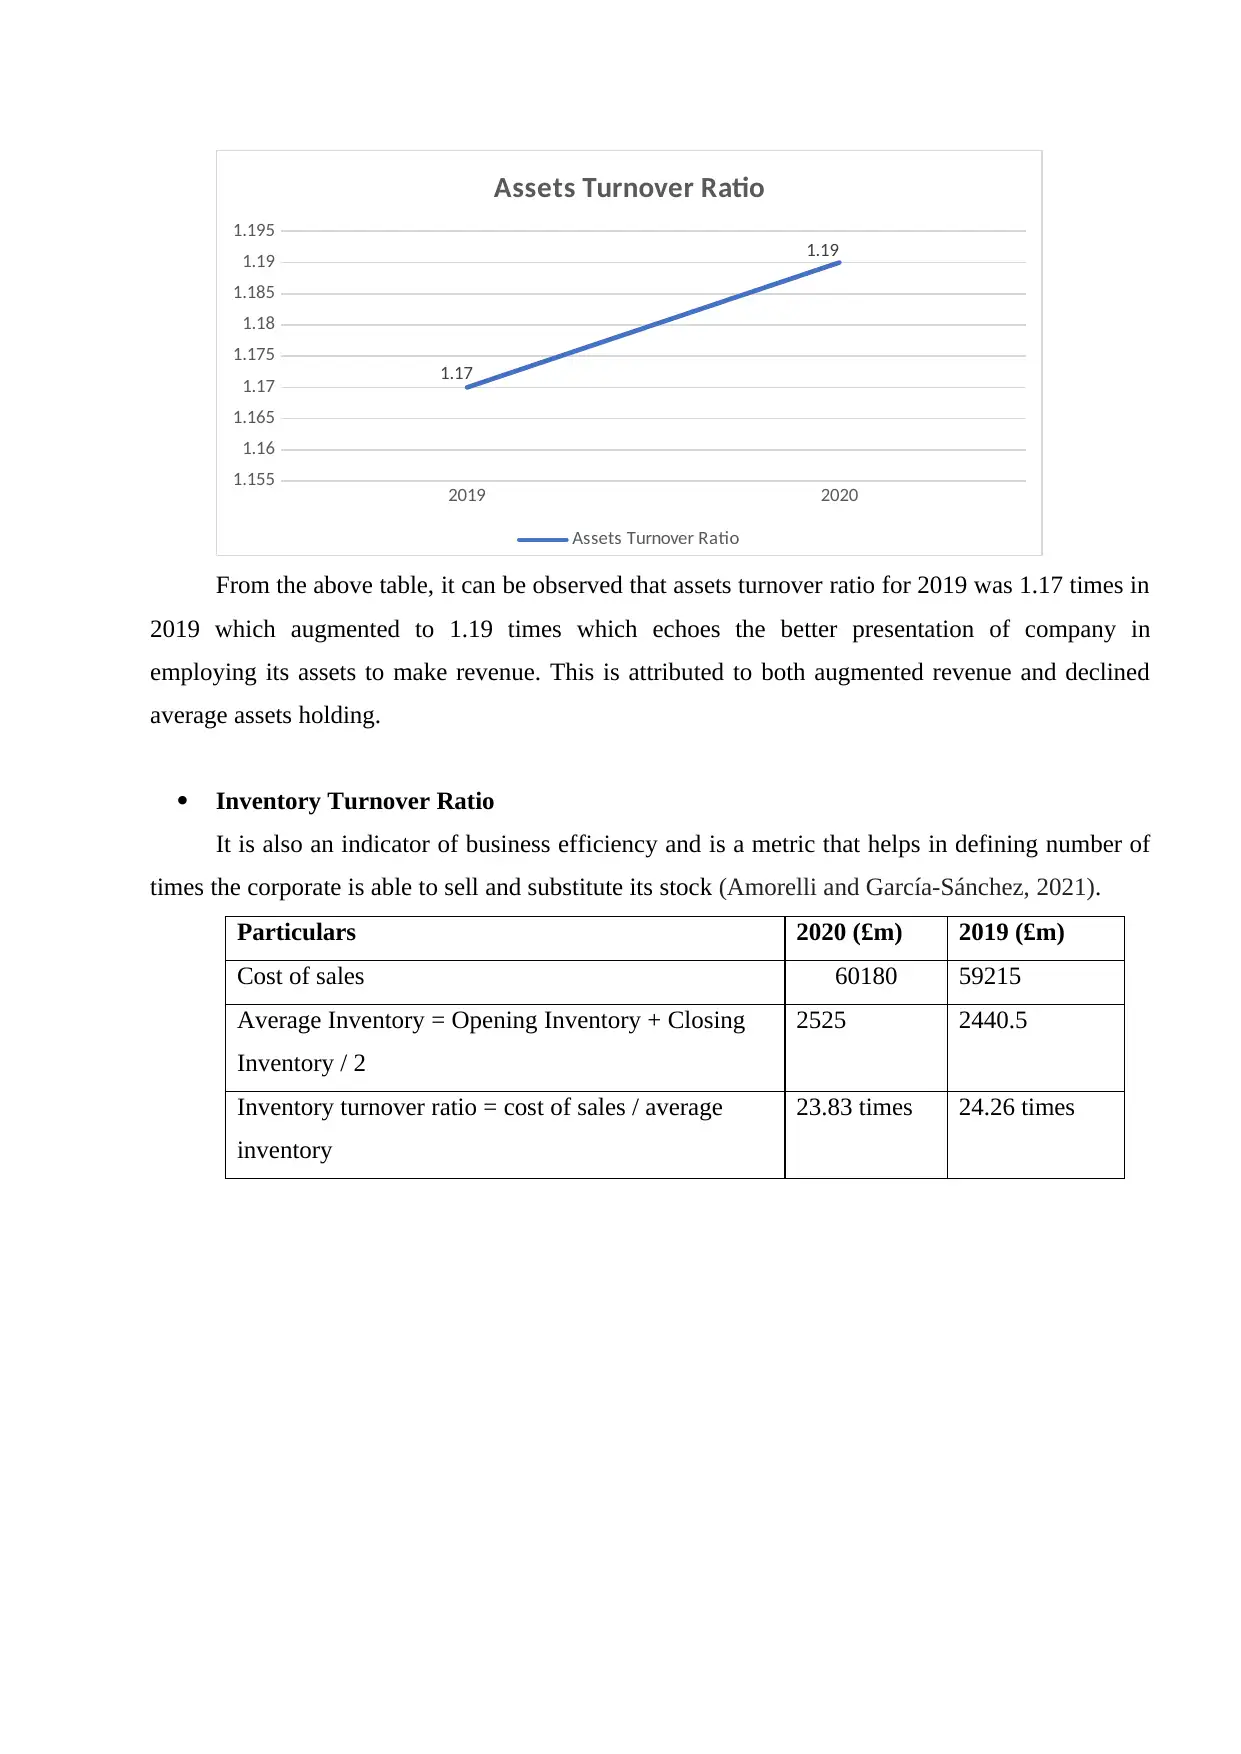
From the above table, it can be observed that assets turnover ratio for 2019 was 1.17 times in
2019 which augmented to 1.19 times which echoes the better presentation of company in
employing its assets to make revenue. This is attributed to both augmented revenue and declined
average assets holding.
Inventory Turnover Ratio
It is also an indicator of business efficiency and is a metric that helps in defining number of
times the corporate is able to sell and substitute its stock (Amorelli and García‐Sánchez, 2021).
Particulars 2020 (£m) 2019 (£m)
Cost of sales 60180 59215
Average Inventory = Opening Inventory + Closing
Inventory / 2
2525 2440.5
Inventory turnover ratio = cost of sales / average
inventory
23.83 times 24.26 times
1.155
1.16
1.165
1.17
1.175
1.18
1.185
1.19
1.195
1.17
1.19
Assets Turnover Ratio
Assets Turnover Ratio
From the above table, it can be observed that assets turnover ratio for 2019 was 1.17 times in
2019 which augmented to 1.19 times which echoes the better presentation of company in
employing its assets to make revenue. This is attributed to both augmented revenue and declined
average assets holding.
Inventory Turnover Ratio
It is also an indicator of business efficiency and is a metric that helps in defining number of
times the corporate is able to sell and substitute its stock (Amorelli and García‐Sánchez, 2021).
Particulars 2020 (£m) 2019 (£m)
Cost of sales 60180 59215
Average Inventory = Opening Inventory + Closing
Inventory / 2
2525 2440.5
Inventory turnover ratio = cost of sales / average
inventory
23.83 times 24.26 times
2019 2020
23.6
23.7
23.8
23.9
24
24.1
24.2
24.3 24.26
23.83
Inventory Turnover Ratio
Inventory Turnover Ratio
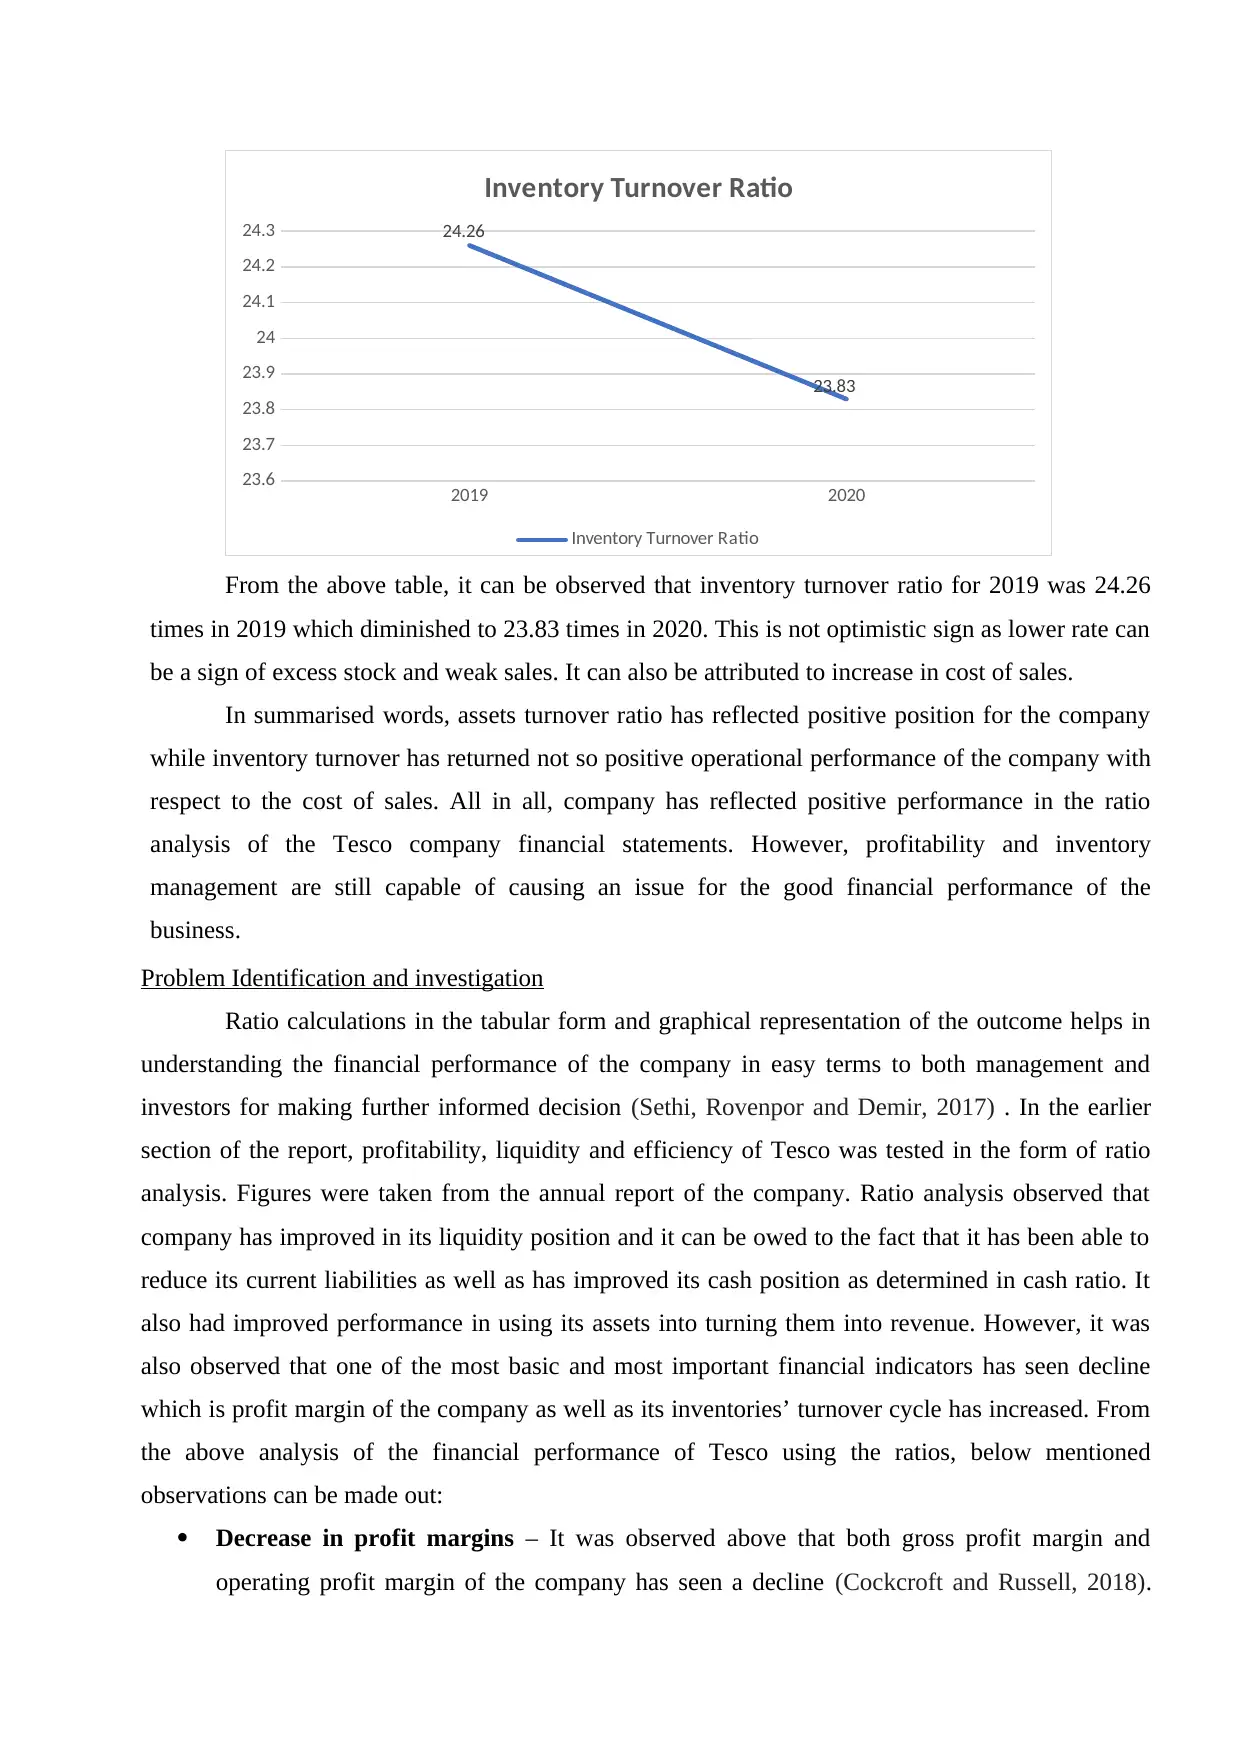
From the above table, it can be observed that inventory turnover ratio for 2019 was 24.26
times in 2019 which diminished to 23.83 times in 2020. This is not optimistic sign as lower rate can
be a sign of excess stock and weak sales. It can also be attributed to increase in cost of sales.
In summarised words, assets turnover ratio has reflected positive position for the company
while inventory turnover has returned not so positive operational performance of the company with
respect to the cost of sales. All in all, company has reflected positive performance in the ratio
analysis of the Tesco company financial statements. However, profitability and inventory
management are still capable of causing an issue for the good financial performance of the
business.
Problem Identification and investigation
Ratio calculations in the tabular form and graphical representation of the outcome helps in
understanding the financial performance of the company in easy terms to both management and
investors for making further informed decision (Sethi, Rovenpor and Demir, 2017) . In the earlier
section of the report, profitability, liquidity and efficiency of Tesco was tested in the form of ratio
analysis. Figures were taken from the annual report of the company. Ratio analysis observed that
company has improved in its liquidity position and it can be owed to the fact that it has been able to
reduce its current liabilities as well as has improved its cash position as determined in cash ratio. It
also had improved performance in using its assets into turning them into revenue. However, it was
also observed that one of the most basic and most important financial indicators has seen decline
which is profit margin of the company as well as its inventories’ turnover cycle has increased. From
the above analysis of the financial performance of Tesco using the ratios, below mentioned
observations can be made out:
Decrease in profit margins – It was observed above that both gross profit margin and
operating profit margin of the company has seen a decline (Cockcroft and Russell, 2018).
23.6
23.7
23.8
23.9
24
24.1
24.2
24.3 24.26
23.83
Inventory Turnover Ratio
Inventory Turnover Ratio
From the above table, it can be observed that inventory turnover ratio for 2019 was 24.26
times in 2019 which diminished to 23.83 times in 2020. This is not optimistic sign as lower rate can
be a sign of excess stock and weak sales. It can also be attributed to increase in cost of sales.
In summarised words, assets turnover ratio has reflected positive position for the company
while inventory turnover has returned not so positive operational performance of the company with
respect to the cost of sales. All in all, company has reflected positive performance in the ratio
analysis of the Tesco company financial statements. However, profitability and inventory
management are still capable of causing an issue for the good financial performance of the
business.
Problem Identification and investigation
Ratio calculations in the tabular form and graphical representation of the outcome helps in
understanding the financial performance of the company in easy terms to both management and
investors for making further informed decision (Sethi, Rovenpor and Demir, 2017) . In the earlier
section of the report, profitability, liquidity and efficiency of Tesco was tested in the form of ratio
analysis. Figures were taken from the annual report of the company. Ratio analysis observed that
company has improved in its liquidity position and it can be owed to the fact that it has been able to
reduce its current liabilities as well as has improved its cash position as determined in cash ratio. It
also had improved performance in using its assets into turning them into revenue. However, it was
also observed that one of the most basic and most important financial indicators has seen decline
which is profit margin of the company as well as its inventories’ turnover cycle has increased. From
the above analysis of the financial performance of Tesco using the ratios, below mentioned
observations can be made out:
Decrease in profit margins – It was observed above that both gross profit margin and
operating profit margin of the company has seen a decline (Cockcroft and Russell, 2018).
These ratios have two components’ sales or revenue and expenses which on being reduced
from revenue, forms profit. For gross profit, direct expenses or cost of sales has to be
reduced from revenue to ascertain gross profit. On assessing the financial statements further,
it was identified that revenue of the group has improved by 1.33% but cost of sales has
increased by 1.63% which might has resulted in decline. This apparently looks like the
reason behind decline in operating margin as well for the administrative expenses has only
increased by 0.73% which is considered routine in nature. Prima Facie it looks like that
increased cost is due to disrupted supply chain because of global pandemic however, this
reason has to be ruled out since, the results being compared are up to 29th February, 2020 by
when the pandemic had not erupted violently. Therefore, these are due to other reasons such
as due to policy confusions due to Brexit or due to inflationary conditions in the economy,
etc. One point worth noting more is that though the comparison period is not marred by
pandemic but subsequent year would be affected by the pandemic. Therefore, declining
profitability is not a positive sign for the operational efficiency as well as financial
performance of the company (Wang and Sarkis, 2017).
Decline in inventory management – It was further observed from the ratio analysis that
inventory turnover ratio of the company has decreased. Inventory turnover ratio depicts the
number of times that inventory of the company rotates from raw material to delivery. It
forms the very important part of both working capital management as well as operational
efficiency of the company as it forms the basis of debtors’ and creditors’ management
policies and affects cash management of the company. This ratio has two components – one,
cost of sales and another, average inventory. As identified earlier, cost of sales had an
increase of 1.63% from 2019 to 2020. Average inventory refers to the average amount of the
inventory in the whole year. Therefore, closing and opening inventory is averaged to
determine average annual inventory figure. It denotes the mean figure of inventory holding in
the year by the company. Average inventory holding went up by 34.56% which must have
been the reason for the decline in the inventory turnover ratio. This is not a positive sign for
the inventory management of the company as Tesco is a retail company and increase in
average inventory holding means that company performance has declined (Moşteanu, Faccia
and Cavaliere, 2020).
Secure Best Marks with AI Grader
Need help grading? Try our AI Grader for instant feedback on your assignments.
Solutions and recommendations
In the above section of the report, two challenges for the company were identified. It was
identified that company has to deal with reduced profitability and reduced inventory turnover in the
comparative analysis of 2019 and 2020 performance. Further, period subsequent to the comparison
has been marred by the disruptions caused by the combined impacts of global pandemic, Brexit,
increased inflation, etc. Therefore, in order to reduce the negative impacts that these challenges are
capable of causing or to not increase the decline further, it is very important for company to
undertake the management of the inventory very seriously as underlying cause of both the declines
lies in the inventory management (Landi and Sciarelli, 2019).
To improve inventory management company should review its inventory order, holding and
delivery policies according to the changes that are required as per the present situation which has
additional challenges. Further, company is a retail business which operates in a low-cost model so
that profitability can be optimised. So, in order to increased its profitability level, company shall
check its cost structure again and make revised budgets and budgetary allocation.
Conclusion
Above report has been prepared for assessing business performance of a company. It was
analysed that ratio analysis is an easy form to understand and make observations about the
profitability, liquidity and efficiency of the company. Further, information observed from ratio
analysis helps determine the issues and challenges that are reflected in the financial statements. It is
very important as only after the issues are determined that, they can be worked upon to solve. All
this makes important contribution to ensure sound financial health of the company.
References
Books and Journal
Amorelli, M. F. and García‐Sánchez, I. M., 2021. Trends in the dynamic evolution of board gender
diversity and corporate social responsibility. Corporate Social Responsibility and
Environmental Management. 28(2). pp.537-554.
Bajra, U. and Čadež, S., 2018. Audit committees and financial reporting quality: The 8th EU
Company Law Directive perspective. Economic Systems. 42(1). pp.151-163.
Chen, S. and Komal, B., 2018. Audit committee financial expertise and earnings quality: A meta-
analysis. Journal of Business Research. 84. pp.253-270.
Cockcroft, S. and Russell, M., 2018. Big data opportunities for accounting and finance practice and
research. Australian Accounting Review. 28(3). pp.323-333.
Faccia, A., Al Naqbi, M. Y. K. and Lootah, S. A., 2019, August. Integrated Cloud Financial
Accounting Cycle: How Artificial Intelligence, Blockchain, and XBRL will Change the
Accounting, Fiscal and Auditing Practices. In Proceedings of the 2019 3rd International
Conference on Cloud and Big Data Computing (pp. 31-37).
Hsiao, P. C. K. and Kelly, M., 2018. Investment considerations and impressions of integrated
reporting. Sustainability Accounting, Management and Policy Journal.
Landi, G. and Sciarelli, M., 2019. Towards a more ethical market: the impact of ESG rating on
corporate financial performance. Social Responsibility Journal.
Moşteanu, N. R., Faccia, A. and Cavaliere, L. P. L., 2020, August. Disaster Management,
Digitalization and Financial Resources: key factors to keep the organization ongoing.
In Proceedings of the 2020 4th International Conference on Cloud and Big Data
Computing (pp. 118-122).
Raiborn, C. and et. al., 2017. The internal audit function: A prerequisite for Good
Governance. Journal of Corporate Accounting & Finance. 28(2). pp.10-21.
Sethi, S. P., Rovenpor, J. L. and Demir, M., 2017. Enhancing the quality of reporting in corporate
social responsibility guidance documents: The roles of ISO 26000, global reporting
initiative and CSR‐sustainability monitor. Business and Society Review. 122(2). pp.139-163.
Wang, Z. and Sarkis, J., 2017. Corporate social responsibility governance, outcomes, and financial
performance. Journal of Cleaner Production. 162. pp.1607-1616.
Yung, K. and Root, A., 2019. Policy uncertainty and earnings management: International
evidence. Journal of Business Research. 100. pp.255-267.
Online
Tesco – Annual Report and Financial Statements 2020. 2021. [Online]. Available through:<
https://www.tescoplc.com/media/755761/tes006_ar2020_web_updated_200505.pdf>
1 out of 12
Related Documents


Your All-in-One AI-Powered Toolkit for Academic Success.
+13062052269
info@desklib.com
Available 24*7 on WhatsApp / Email
![[object Object]](/_next/static/media/star-bottom.7253800d.svg)
Unlock your academic potential
© 2024 | Zucol Services PVT LTD | All rights reserved.