University Investment Analysis and Portfolio Management Report
VerifiedAdded on 2021/04/17
|16
|3545
|23
Report
AI Summary
This report delves into the 2008 financial crisis, examining its causes, timeline, and the devastating impact on the global economy, with a specific focus on the United States. It discusses the financial impacts, including company bankruptcies, rising unemployment, and the collapse of the stock market. The report also analyzes the social and political consequences of the crisis, such as increased unemployment, social unrest, and changes in political leadership. Furthermore, it explores preventative measures that could have mitigated the crisis, including stricter regulations, improved risk management, and greater oversight of financial institutions. The report also includes an analysis of portfolio optimization, comparing a provided portfolio with optimized portfolios based on Sharpe and Sortino ratios and minimum variance, providing insights into risk and return trade-offs. The student assignment is available on Desklib, offering valuable insights into investment analysis and financial crisis management.
Running head: INVESTMENT ANALYSIS AND PORTFOLIO MANAGEMENT
Investment Analysis and Portfolio Management
Name of the Student:
Name of the University:
Authors Note:
Investment Analysis and Portfolio Management
Name of the Student:
Name of the University:
Authors Note:
Paraphrase This Document
Need a fresh take? Get an instant paraphrase of this document with our AI Paraphraser

INVESTMENT ANALYSIS AND PORTFOLIO MANAGEMENT
1
Table of Contents
1. Comparing two companies in term of financial health/position:...........................................2
1
Table of Contents
1. Comparing two companies in term of financial health/position:...........................................2
INVESTMENT ANALYSIS AND PORTFOLIO MANAGEMENT
2
Compulsory Question:
1. Identifying the financial crisis for analysis:
The financial crisis of 2008 is mainly used for the analysis part in the study, which
destroyed banking and financial sector of the world. The financial crisis of 2008 was one the
major atrocities in the modern world, where capital market and financial sector all around the
world crumbled. The analysis of financial crisis might help in detecting the problems that was
the main cause for the decline in financial sector. The augmentation of the financial crisis
started with the announcement from George Bush regarding the fulfilment of every citizens
American Dream.
2. Tracking the flow of events that took place about the causes:
The announcement of low priced housing loan to individuals all around America
started the sphere of financial crisis. The announcement made by George Bush after the
commencement of Presidential house started a crippling effect, where banks could issue loans
to all individuals residing in America. The time line for the Global Economic & Financial
Crisis are depicted as follows.
Date Event
Year 2007 Housing crisis deepens, as the losses in subprime loan rises due to the
increment in worthless assets as foreclosures grows. This damage in
mortgages sector reaches the top echelons of Wal Street.
February 7, 2007 Announcement of losses linked with US subprime mortgages
announced by HSBC
February 7, 2007 Freddie Mac indicated that they will not buy risky subprime loans any
⊘ This is a preview!⊘
Do you want full access?
Subscribe today to unlock all pages.
Trusted by 1+ million students worldwide
INVESTMENT ANALYSIS AND PORTFOLIO MANAGEMENT
3
further due to the increment in defaulters of loan.
April 2007 New Century Financial files bankruptcy-court protection, who was on
the major subprime mortgage lender in US. The declining value and
rising risk involved in mortgage industry might led to financial
instability of New Century Financial.
August 2007 The American Home Mortgage Investment also files for bankruptcy
protection due to the declining mortgage value and returns.
August 2007 Rating of Countrywide Financial was reduced by Fitch Rating to its
third lowest investment grade due to the declining valuation of
mortgage.
January 2008 The recession in US economy starts due to the crisis in subprime
mortgages and mortgage credit market.
January 2008 Countrywide Financial is bought by Bank of America for about $4
billion
March 2008 Federal Reserve agrees to guarantee $30 billion of Bear Streams assets
in connection with government sponsored sale to JPMorgan Chase.
July 2008 IndyMac Federal Bank was seized by Federal regulators, as it became
largest regulated thrift to fail
September 2008 The government takes over Freddie Mac and Fannie Mae due to the
accumulation of high debt
September 2008 Merrill Lynch agreed to buy bank of America for $50 billion
September 2008 Lehman Brothers filed bankruptcy protection due to its incapability to
continue their operations.
September 2008 American internal group accepts $85 billion as the bailout package and
introduced 79.9% stake to the government.
Paraphrase This Document
Need a fresh take? Get an instant paraphrase of this document with our AI Paraphraser
INVESTMENT ANALYSIS AND PORTFOLIO MANAGEMENT
4
October 2008 Congress passes the Bailout rescue package requesting Federal loans
from TARP
3. Discussing the financial impact on the country or region:
The financial crisis of 2008 was not restricted to USA instead it demolished the entire
financial sector of the world. This was due to the involvement of other countries in mortgage
securities of US. The different types of impacts on the country origin due to the augmentation
of financial crisis, where companies became bankrupt and the financial sector was not able to
continue with its operations. the financial crisis started due to the increment in fed interest
rates, which was higher than the actual mortgage interest rates (Feldkircher 2014). This
relevantly increased the interest payments of mortgage holders, which in turn raise the level
of defaulters of mortgage loans. this crippling effect was seen all around US, where
individuals over defaulting due to high loan repayment and companies having high exposure
to mortgage bonds were not able to receive payments for their loans.
This was the augmentation of financial crisis, where companies highly exposed to
mortgage bonds not able to generate adequate revenues. On the other hand, the accumulation
of faulty mortgage bonds increased within the financial sector of US. Big companies with
thousands of employees we've been bankrupt due to the unavailability of funds for containing
the operations. This increased the unemployment rate in US, while deflated the overall
economy. The economic crisis also hampered in the stock market or capital market condition
of US, where continuous decline in values of Assets and shares was seen. This is relatively
declined the US Stock Market aggressively towards new loan. Furthermore, the rising default
rate initiated a mass selling of property all across the US, which relatively declined actual
value of the property (Jones and Murphy 2016).
INVESTMENT ANALYSIS AND PORTFOLIO MANAGEMENT
5
Massive unemployment, low growth, closure of big companies, job insecurity, and
falling financial sector of US was the main impact of financial crisis. The negative impact of
financial crisis was not restricted to US, instead it crumbled the entire financial sector of the
world, which started mass unemployment and bankruptcy all around the world. The effects of
the financial crisis can be seen today, where subdivisions of the financial sector have not fully
recovered from the losses.
4. Discussing the consequence of such crisis on economy, social and politics:
There are high consequences for such kind of financial crisis on Economy, social and
politics of the country. The financial crisis firstly impacts the economy of the country, where
it destroys or disintegrates maximum of the companies who has that exposure on debt. The
chain of events will mainly start due to the augmentation of financial crisis, where companies
with Low financial capability will not able to operate in the crisis. This relatively indicates
that companies with the exposure of high depth would eventually fall in the stock market.
The financial crisis will eventually reduce the revenue generation capacity of the companies,
as consumers will have low purchasing power due to the unstable economy. this would result
in low growth and high expenses of the companies (Nelson and Katzenstein 2014).
Due to the continuous decline in Economic condition of the country, negative impact
on social measure would also increase. Discontinued degradation of the economy would
eventually lead to high unemployment and negatively impact the social condition of the
country. The result of high unemployment would create uncertainty and stress among the
youth of the country. This would eventually hamper the functional capability of the society to
conduct ethical and just activities. The rising unemployment rate would eventually force the
youth to take unethical decisions to support their livelihood, which would deteriorate the
standard of living in society. Furthermore, the financial crisis would you also reduce the
⊘ This is a preview!⊘
Do you want full access?
Subscribe today to unlock all pages.
Trusted by 1+ million students worldwide
INVESTMENT ANALYSIS AND PORTFOLIO MANAGEMENT
6
availability of adequate resources for the individual and Society, which might initiate a public
sphere within the country (Lins, Servaes and Tamayo 2017).
There will be immense political consequences for the country, as appropriate charities
were not able to regulate the companies, which initiated the economic crisis. Changes in
political condition would eventually increase due to the augmentation of financial crisis, as
people needs change and the person providing the change would be the new political leader
of the country. Furthermore, the political condition would deteriorate, where the government
would eventually draft out a way for halting the progress of financial crisis. Hence, political
summary of the country would change, where ways of reducing the negative impact of
financial crisis will be identified (Berk and Rauch 2016).
5. Discussing how it could be prevented by looking in the hindsight:
There are different ways in which prevention of the financial crisis can be conducted
by governments and companies. The main prevention that need to be conducted are the
unethical operations, which is been steered throughout the country. Control of unethical
measures would eventually allow the prevention of financial crisis, as the evaluation
indicated the problem related to organizations and authorities. The regulator of companies
needs to conduct through evaluation of their annual report and financial position, which could
negatively hamper the capital market. Moreover, fines and punishment to independent
auditor's needs to be conducted by the regulator's, as they were the main culprits of not
providing the actual financial position of the company in their annual report. On the other
hand, the independent auditor report indicated the financial capability of the company to
continue its operation effectively without any interruption (Floyd, Li and Skinner 2015).
The Other preventive measure needs to be conducted on Bank regulator, who are
responsible to provide loans. The declining mortgage market was due to the faulty loan
Paraphrase This Document
Need a fresh take? Get an instant paraphrase of this document with our AI Paraphraser
INVESTMENT ANALYSIS AND PORTFOLIO MANAGEMENT
7
accumulation conducted by banks, which was generated by marketing representatives, who
manipulated client’s data and provided them with funds without the capability to repay them
in time. This would eventually help in reducing problems faced during the financial crisis of
2008, which was due to the unethical measures of banks and loan providers. The third and
foremost measure that needs to be conducted is the interest rates provided by Central Bank or
FED. Control on interest rates need to be conducted, as it directly linked with the liquidity
and prosperity conditions of the economy. The reduction and increment in industry needs to
be conducted through adequate evaluation, as any certain move would either the hamper the
economic condition or increase cash flow within the economic (Benetrix, Lane and
Shambaugh 2015).
Optional Question:
Option 1:
Objective 1a:
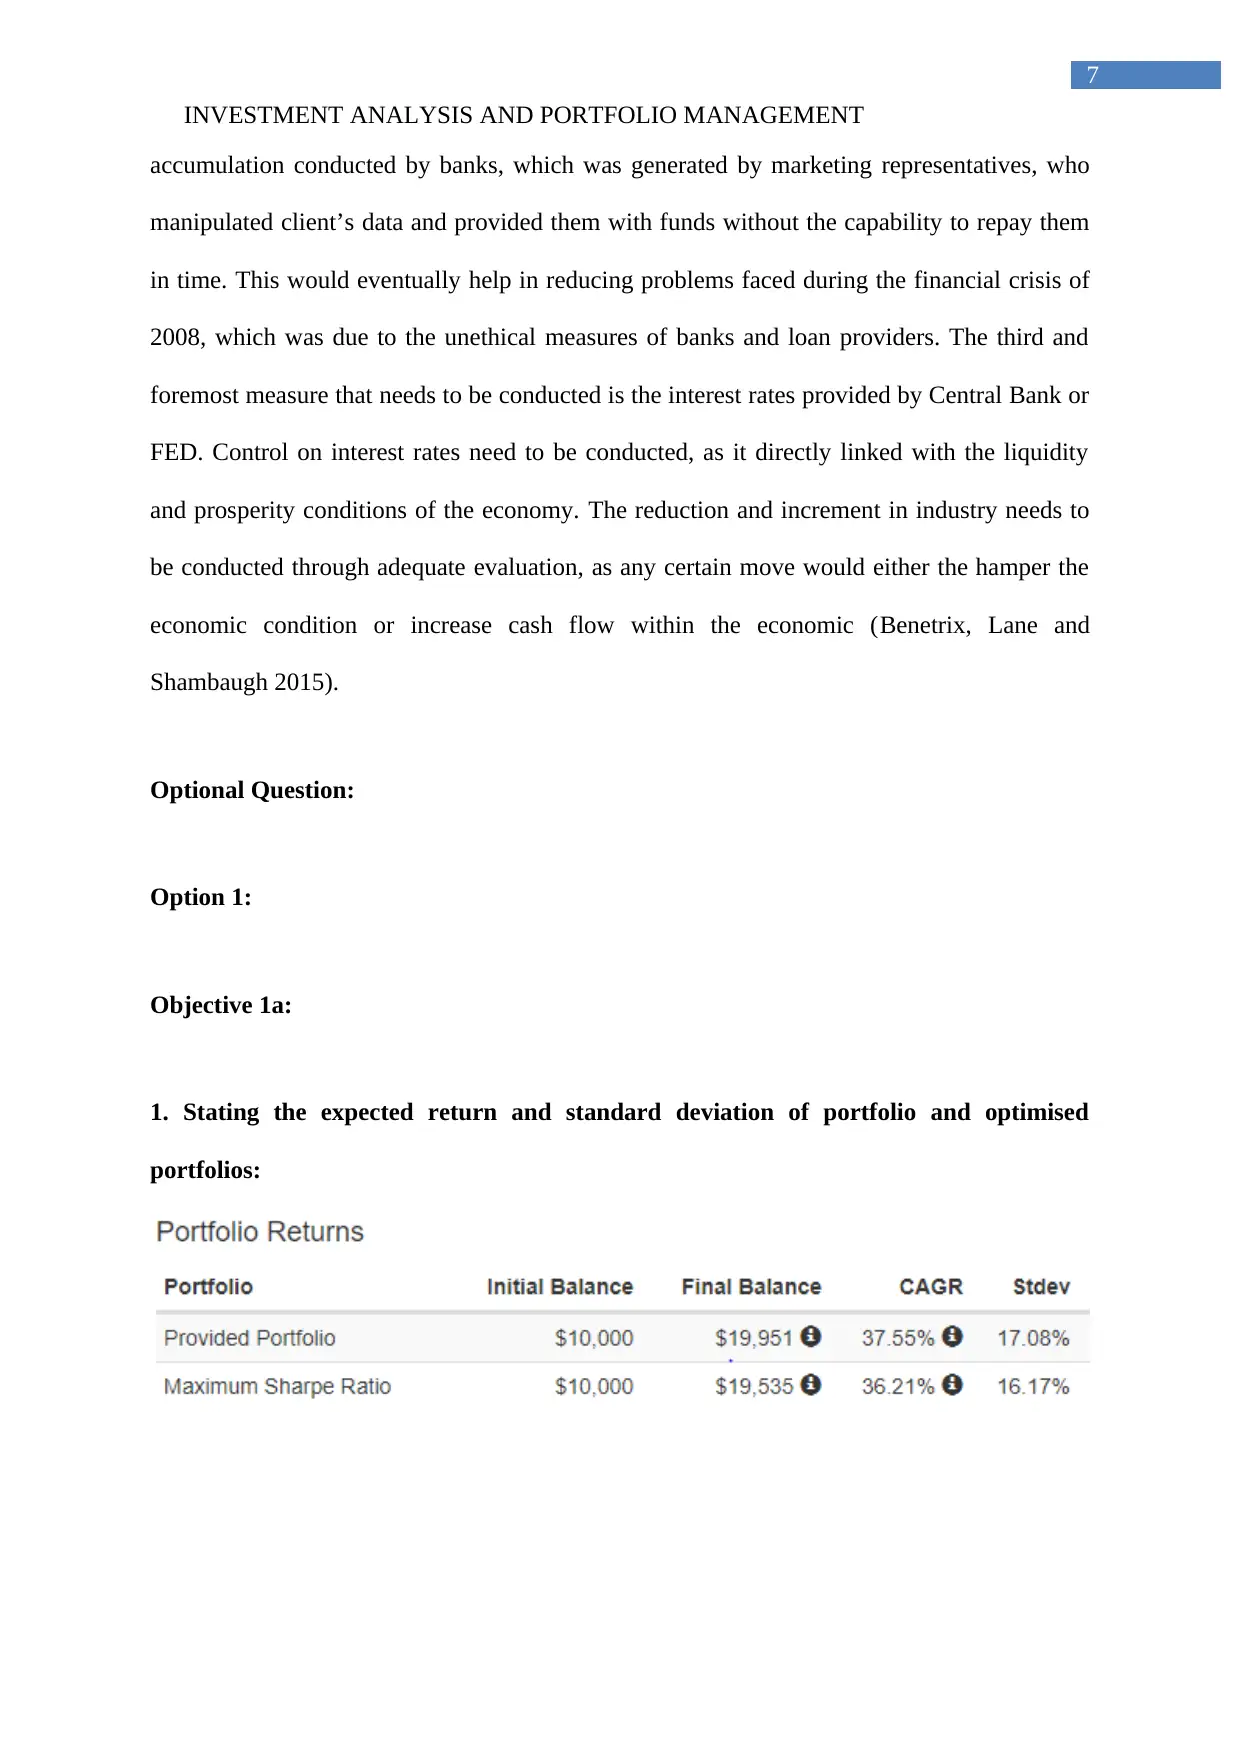
1. Stating the expected return and standard deviation of portfolio and optimised
portfolios:
7
accumulation conducted by banks, which was generated by marketing representatives, who
manipulated client’s data and provided them with funds without the capability to repay them
in time. This would eventually help in reducing problems faced during the financial crisis of
2008, which was due to the unethical measures of banks and loan providers. The third and
foremost measure that needs to be conducted is the interest rates provided by Central Bank or
FED. Control on interest rates need to be conducted, as it directly linked with the liquidity
and prosperity conditions of the economy. The reduction and increment in industry needs to
be conducted through adequate evaluation, as any certain move would either the hamper the
economic condition or increase cash flow within the economic (Benetrix, Lane and
Shambaugh 2015).
Optional Question:
Option 1:
Objective 1a:
1. Stating the expected return and standard deviation of portfolio and optimised
portfolios:
INVESTMENT ANALYSIS AND PORTFOLIO MANAGEMENT
8
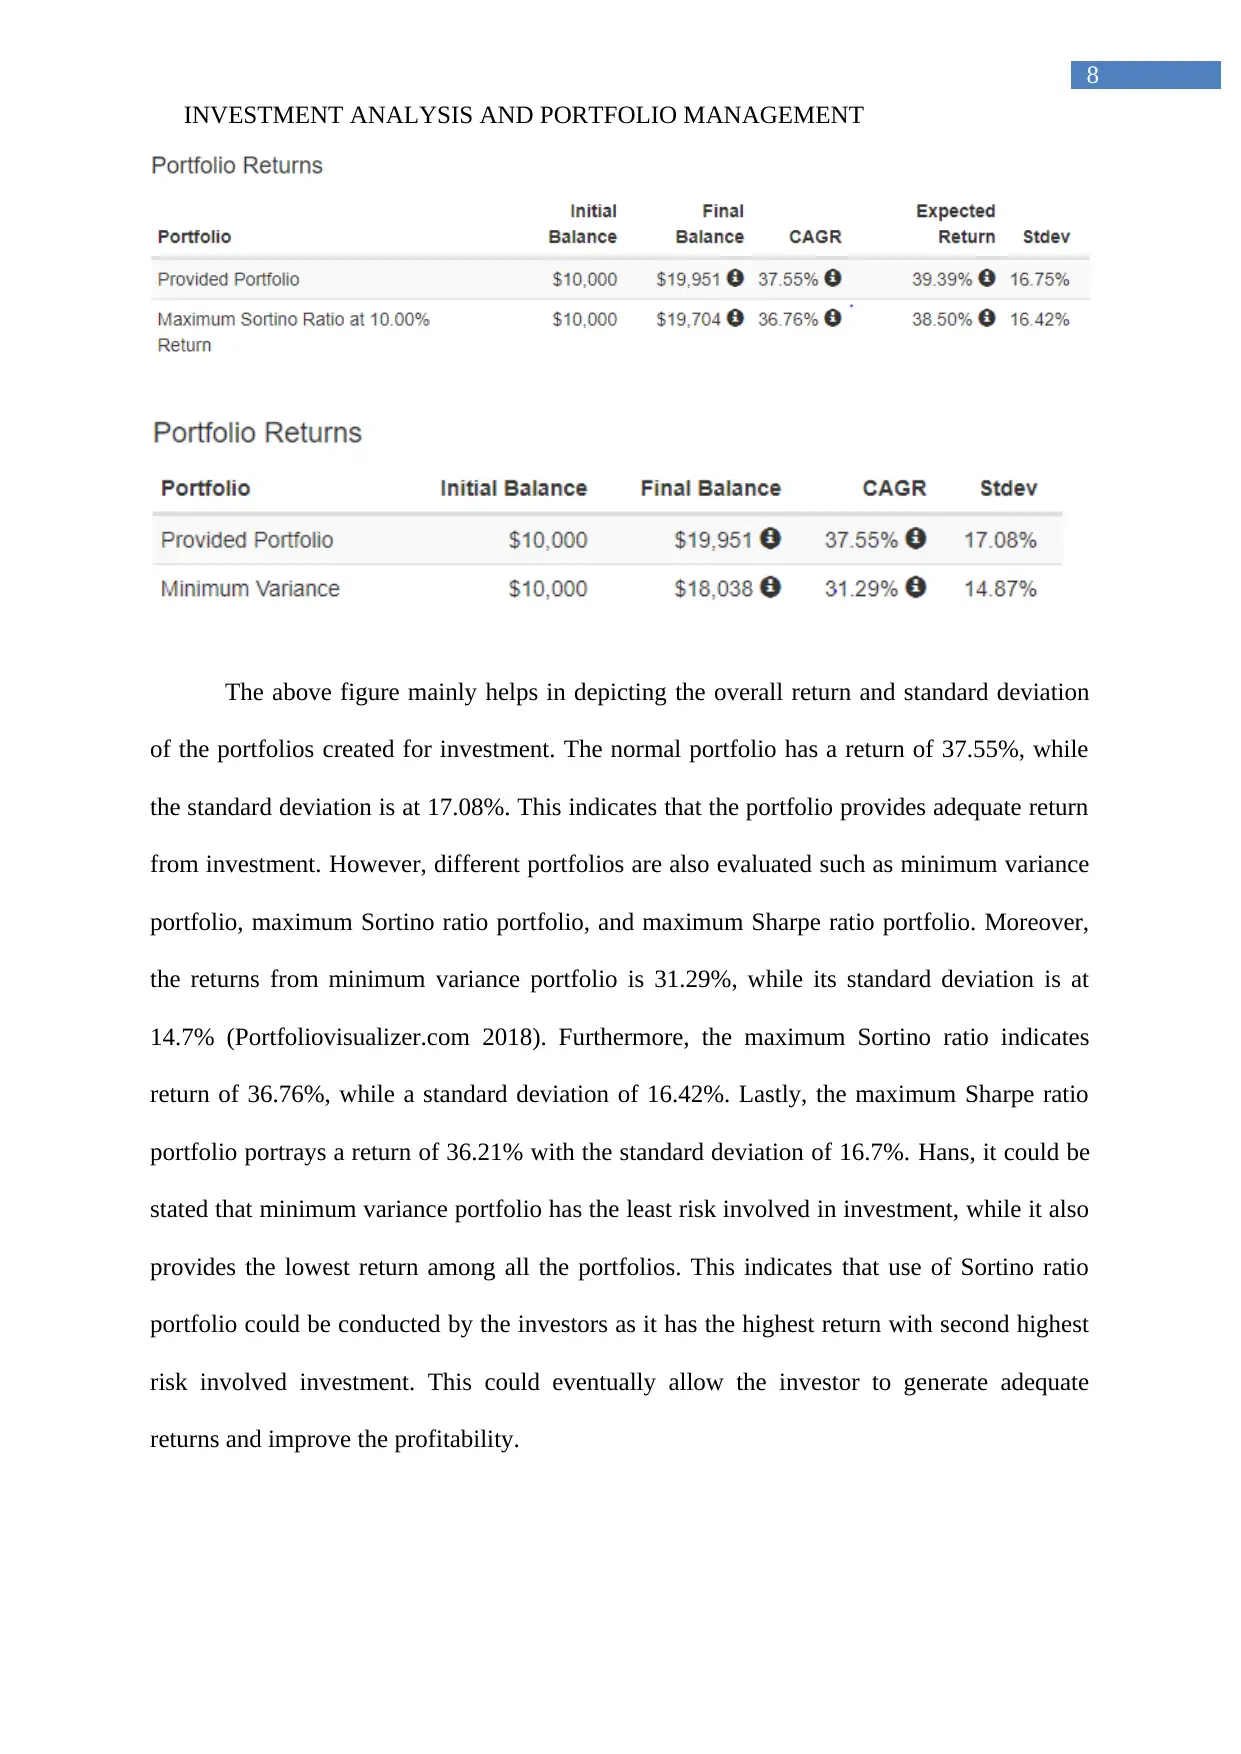
The above figure mainly helps in depicting the overall return and standard deviation
of the portfolios created for investment. The normal portfolio has a return of 37.55%, while
the standard deviation is at 17.08%. This indicates that the portfolio provides adequate return
from investment. However, different portfolios are also evaluated such as minimum variance
portfolio, maximum Sortino ratio portfolio, and maximum Sharpe ratio portfolio. Moreover,
the returns from minimum variance portfolio is 31.29%, while its standard deviation is at
14.7% (Portfoliovisualizer.com 2018). Furthermore, the maximum Sortino ratio indicates
return of 36.76%, while a standard deviation of 16.42%. Lastly, the maximum Sharpe ratio
portfolio portrays a return of 36.21% with the standard deviation of 16.7%. Hans, it could be
stated that minimum variance portfolio has the least risk involved in investment, while it also
provides the lowest return among all the portfolios. This indicates that use of Sortino ratio
portfolio could be conducted by the investors as it has the highest return with second highest
risk involved investment. This could eventually allow the investor to generate adequate
returns and improve the profitability.
8
The above figure mainly helps in depicting the overall return and standard deviation
of the portfolios created for investment. The normal portfolio has a return of 37.55%, while
the standard deviation is at 17.08%. This indicates that the portfolio provides adequate return
from investment. However, different portfolios are also evaluated such as minimum variance
portfolio, maximum Sortino ratio portfolio, and maximum Sharpe ratio portfolio. Moreover,
the returns from minimum variance portfolio is 31.29%, while its standard deviation is at
14.7% (Portfoliovisualizer.com 2018). Furthermore, the maximum Sortino ratio indicates
return of 36.76%, while a standard deviation of 16.42%. Lastly, the maximum Sharpe ratio
portfolio portrays a return of 36.21% with the standard deviation of 16.7%. Hans, it could be
stated that minimum variance portfolio has the least risk involved in investment, while it also
provides the lowest return among all the portfolios. This indicates that use of Sortino ratio
portfolio could be conducted by the investors as it has the highest return with second highest
risk involved investment. This could eventually allow the investor to generate adequate
returns and improve the profitability.
⊘ This is a preview!⊘
Do you want full access?
Subscribe today to unlock all pages.
Trusted by 1+ million students worldwide
INVESTMENT ANALYSIS AND PORTFOLIO MANAGEMENT
9
2) Comparing the provide portfolio with optimised portfolios:
All the optimized portfolios relatively have different attributes in comparison with the
portfolio created for investment. The maximum Sharpe ratio portfolio provides a lower return
than the actual portfolio, where both the returns and the risk involved is low. this relatively
indicates that using maximum Sharpe ratio would eventually reduce the actual returns
provided from an investment, while the risk would also reduce. Therefore, could be stated
that using the maximum Sharpe ratio value would eventually allow the investor to control
risk and improve the profitability. On the other hand, the evaluation of maximum Sortino
ratio is relatively adequate where 36.76% is estimated to be on from the portfolio with low
risk involved in investment (Portfoliovisualizer.com 2018). However, the maximum Sortino
ratio portfolio does not provide the adequate returns, as compared to the actual returns of the
portfolio. Lastly, minimum portfolio variance is conducted which indicates the overall low
risk from investment that is generated from the portfolio. Moreover, the minimum variance
portfolio could be used by investors who have low risk attribute and does not want to increase
their risk from investment. Therefore, from the comparison of all the three portfolios it could
be identified that use of Sortino ratio portfolio could eventually allow the investors to reduce
the risk and generate adequate returns from investment.
3) From the analysis of 3 portfolios depicting which one is the most comfortable:
The valuation of all the three portfolios mainly states the overall returns and risk
involved in their investment. However, the compatibility level of the portfolios is mainly
based on the investors requirement, where investors with high risk capability will go with
normal portfolio weights. On the other hand, investors with low risk profile will go with
minimum portfolio variance, where risk from investment is reduced substantially.
Moreover, the use of Sortino ratio portfolio would eventually allow investors to achieve
Paraphrase This Document
Need a fresh take? Get an instant paraphrase of this document with our AI Paraphraser
INVESTMENT ANALYSIS AND PORTFOLIO MANAGEMENT
10
higher Returns, while reducing the risk from investment (Portfoliovisualizer.com 2018).
However, from the investment point of view minimum variance portfolio is the best possible
choice and comfortable for all the level of investors. This is due to the lowest attribute of the
portfolio, and the level of returns that is provided from investment. in comparison to all the
other portfolios the return is relatively low but it is more than 30% of the investment.
However, the risk is substantially low in comparison to all the Investments, which could
eventually allow investors to reduce the negative impact of capital market on their portfolio.
Objective 1b:
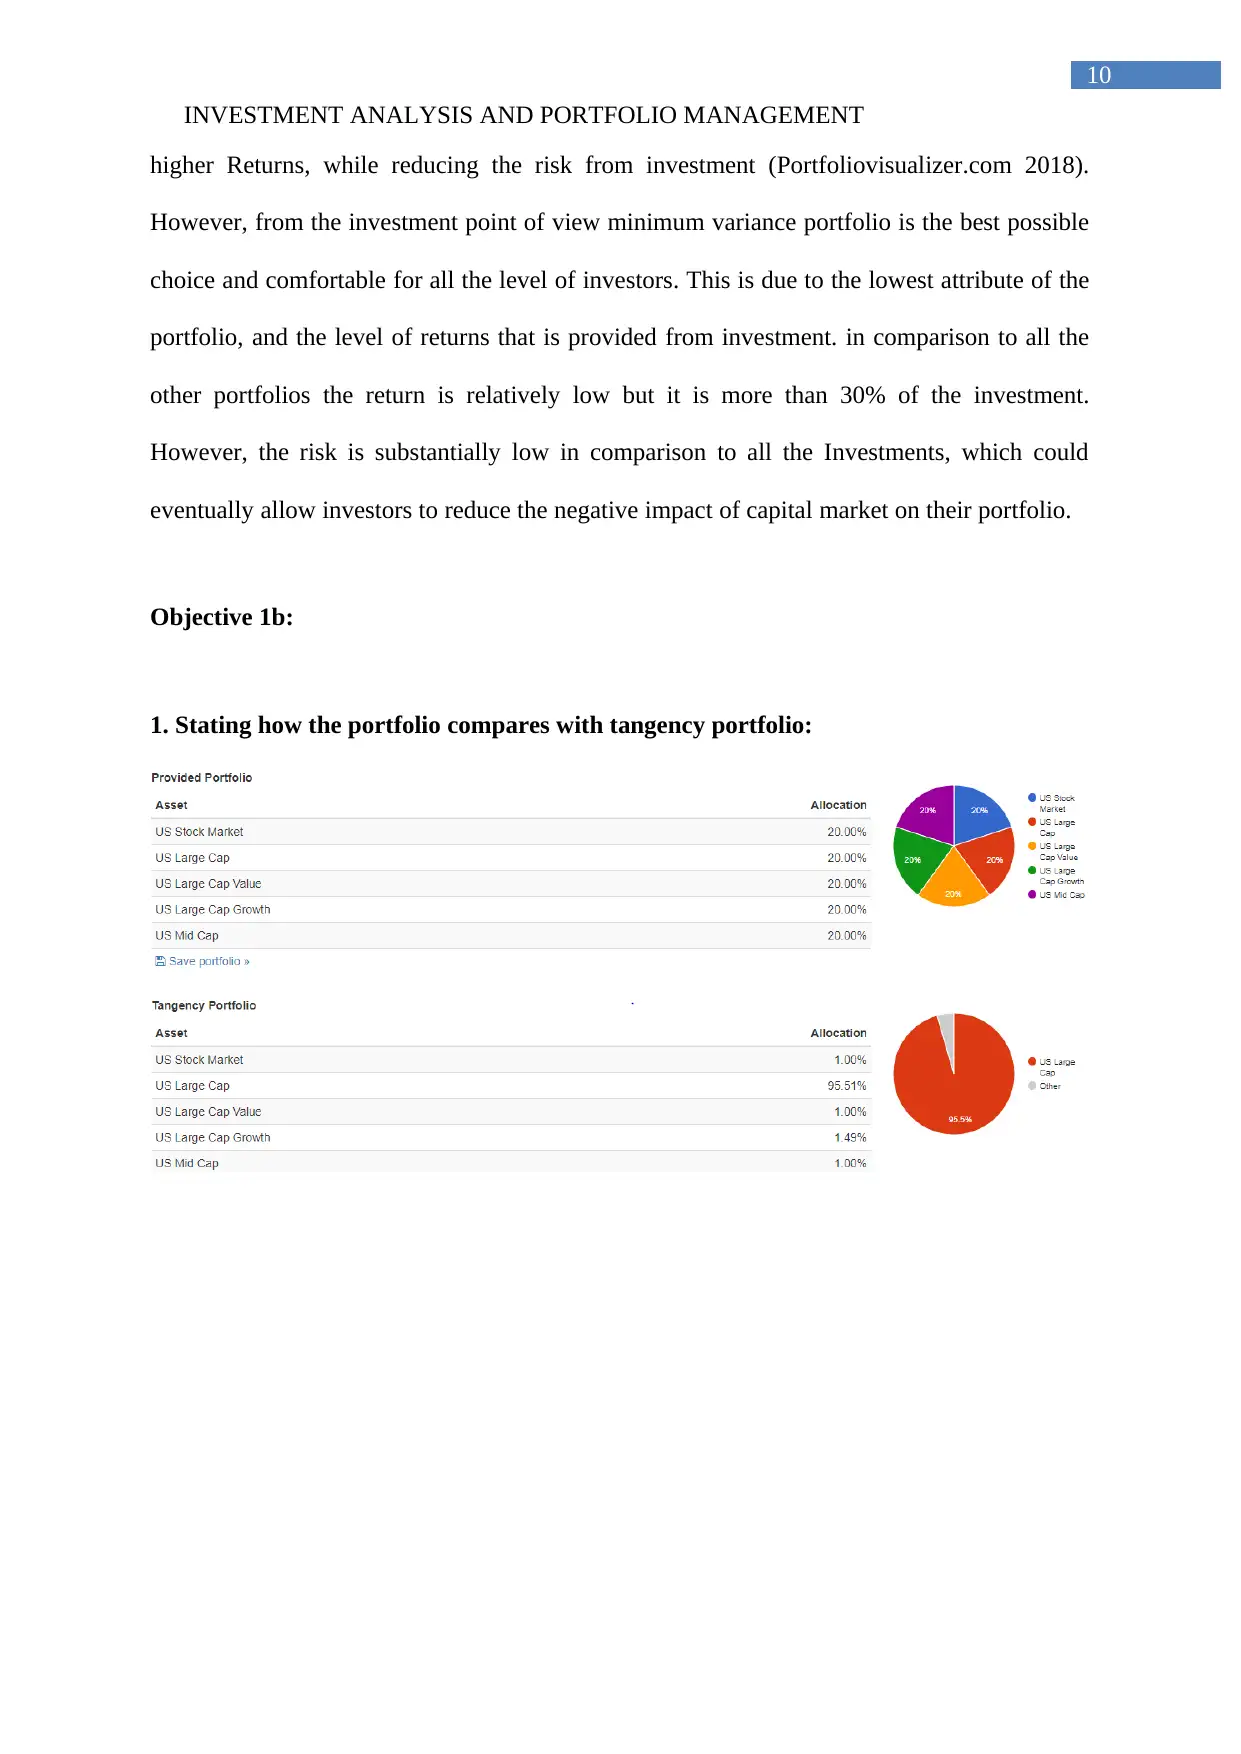
1. Stating how the portfolio compares with tangency portfolio:
10
higher Returns, while reducing the risk from investment (Portfoliovisualizer.com 2018).
However, from the investment point of view minimum variance portfolio is the best possible
choice and comfortable for all the level of investors. This is due to the lowest attribute of the
portfolio, and the level of returns that is provided from investment. in comparison to all the
other portfolios the return is relatively low but it is more than 30% of the investment.
However, the risk is substantially low in comparison to all the Investments, which could
eventually allow investors to reduce the negative impact of capital market on their portfolio.
Objective 1b:
1. Stating how the portfolio compares with tangency portfolio:
INVESTMENT ANALYSIS AND PORTFOLIO MANAGEMENT
11
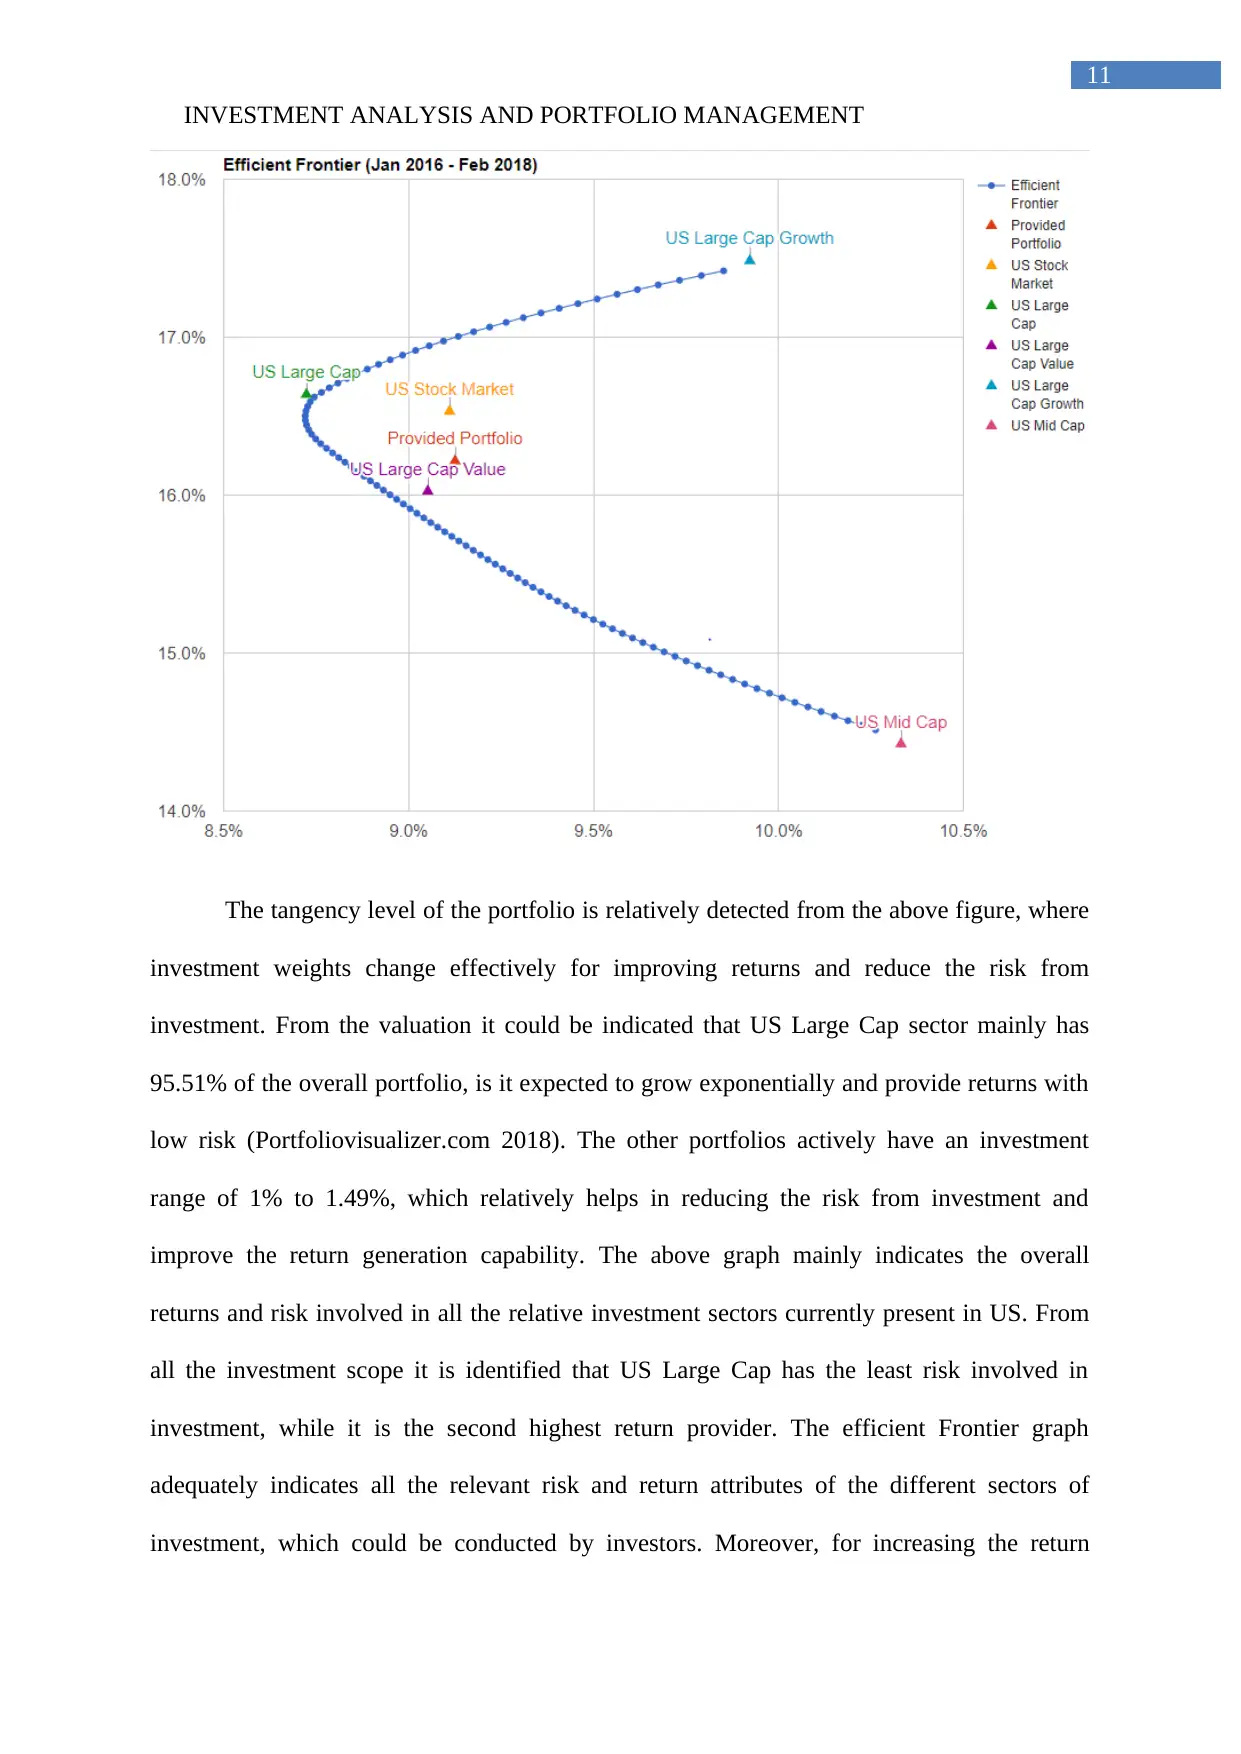
The tangency level of the portfolio is relatively detected from the above figure, where
investment weights change effectively for improving returns and reduce the risk from
investment. From the valuation it could be indicated that US Large Cap sector mainly has
95.51% of the overall portfolio, is it expected to grow exponentially and provide returns with
low risk (Portfoliovisualizer.com 2018). The other portfolios actively have an investment
range of 1% to 1.49%, which relatively helps in reducing the risk from investment and
improve the return generation capability. The above graph mainly indicates the overall
returns and risk involved in all the relative investment sectors currently present in US. From
all the investment scope it is identified that US Large Cap has the least risk involved in
investment, while it is the second highest return provider. The efficient Frontier graph
adequately indicates all the relevant risk and return attributes of the different sectors of
investment, which could be conducted by investors. Moreover, for increasing the return
11
The tangency level of the portfolio is relatively detected from the above figure, where
investment weights change effectively for improving returns and reduce the risk from
investment. From the valuation it could be indicated that US Large Cap sector mainly has
95.51% of the overall portfolio, is it expected to grow exponentially and provide returns with
low risk (Portfoliovisualizer.com 2018). The other portfolios actively have an investment
range of 1% to 1.49%, which relatively helps in reducing the risk from investment and
improve the return generation capability. The above graph mainly indicates the overall
returns and risk involved in all the relative investment sectors currently present in US. From
all the investment scope it is identified that US Large Cap has the least risk involved in
investment, while it is the second highest return provider. The efficient Frontier graph
adequately indicates all the relevant risk and return attributes of the different sectors of
investment, which could be conducted by investors. Moreover, for increasing the return
⊘ This is a preview!⊘
Do you want full access?
Subscribe today to unlock all pages.
Trusted by 1+ million students worldwide
1 out of 16
Related Documents


Your All-in-One AI-Powered Toolkit for Academic Success.
+13062052269
info@desklib.com
Available 24*7 on WhatsApp / Email
![[object Object]](/_next/static/media/star-bottom.7253800d.svg)
Unlock your academic potential
Copyright © 2020–2026 A2Z Services. All Rights Reserved. Developed and managed by ZUCOL.